
Trends Sci. 2026; 23(10): 13064
Dual Quenching Fluorescent Detection of Cr(VI) Using N,S,P Co-Doped Carbon Dots Prepared via Rapid Microwave Synthesis
Feni Risma Mei Diana, Endang Tri Wahyuni,
Mudasir Mudasir and Suherman Suherman*
Department of Chemistry, Universitas Gadjah Mada, Yogyakarta 55281, Indonesia
(*Corresponding author’s e-mail: [email protected])
Received: 17 December 2025, Revised: 20 February 2026, Accepted: 27 February 2026, Published: 15 April 2026
Abstract
A rapid and sustainable microwave-assisted method was developed for synthesizing nitrogen-, sulfur-, and phosphorus-co-doped carbon dots (N,S,P-CDs) using citric acid as the carbon precursor, along with ethylenediamine, thioglycolic acid, and phosphoric acid as dopant sources, for the early detection of Cr(VI) in aqueous environments. The process achieved highly efficient dopant incorporation in just 30 s at 450 W, demonstrating its green, energy-saving characteristics. Beyond achieving an exceptional quantum yield of 89.64%, this study provides detailed insight into the N,S,P-CDs–Cr(VI) interaction and dual quenching mechanism, explaining the synergistic roles of IFE and SQE in N,S,P-CDs, with high selectivity confirmed in the presence of various cations and anions, an aspect rarely discussed in previous research. In-depth analysis of morphological and optical features, including UV-Vis, FT-IR, Raman, XRD, HR-TEM, zeta potential analyzer, and spectrofluorometer, confirmed effective doping and co-doping, the formation of a carbonaceous core structure, and the resulting strong fluorescence emission. The synthesized N,S,P-CDs exhibited high photostability and strong stability against pH and ionic-strength variations, with a linear detection range of 0 - 100 µM, a low limit of detection of 0.07354 µM, and a limit of quantification of 0.2451 µM. The sensor demonstrated competitive sensitivity, together with high analytical accuracy and precision. Application to real water samples verified accurate Cr(VI) detection below WHO limits, confirming the N,S,P-CDs as a sustainable and sensitive fluorescent platform for monitoring toxic metal pollutants in water.
Keywords: Tri-atom-doped carbon dots, Fluorescence sensing, Chromium (VI) detection, Inner filter effect, Static quenching, Environmental monitoring, Microwave-assisted synthesis
Introduction
Water contamination has emerged as a significant global concern, posing severe risks to ecosystem stability and human well-being, particularly given water’s vital role in supporting all forms of life on Earth [1]. Escalating industrialization and urban expansion have intensified the discharge of heavy metal ions into aquatic systems, where they persist as non-biodegradable and bioaccumulative pollutants [2]. Among these contaminants, hexavalent chromium (Cr(VI)) has attracted substantial attention due to its high solubility, strong oxidizing potential, and severe carcinogenicity. Chronic exposure to Cr(VI) can induce
genetic mutations, oxidative stress, and cancer, posing long-term environmental and public health risks [3,4]. Its primary sources, such as electroplating, leather tanning, mining, and pigment production, continuously release chromium compounds into aquatic ecosystems, exacerbated by inadequate wastewater management [5]. Exhibiting toxicity nearly 500 times higher than trivalent chromium (Cr(III)), Cr(VI) remains highly mobile and persistent in aqueous media, readily penetrating biological membranes and triggering severe biomolecular degradation [6]. Consequently, the precise, accurate, and ultrasensitive detection of Cr(VI) in water environments is crucial for effective environmental monitoring and safeguarding ecosystem integrity, particularly given that the World Health Organization (WHO) recommends maintaining Cr(VI) concentrations below 50 µg/L (0.96 µM).
Conventional analytical techniques, including chromatography, inductively coupled plasma mass spectrometry (ICP–MS), high-performance liquid chromatography (HPLC), and X-ray fluorescence (XRF), provide high reliability and selectivity [7-11]. However, their dependence on sophisticated instrumentation, sensitivity, labor-intensive sample preparation, and high operational costs restricts their applicability for rapid or on-site analysis [12]. In contrast, fluorescence-based sensing has emerged as a sustainable, cost-effective, and highly sensitive alternative, enabling real-time monitoring while adhering to green chemistry principles by reducing solvent use, energy consumption, and chemical waste [13-15].
Among various fluorescent materials, carbon dots (CDs), as a fluorescent sensor, are quasi-spherical carbon-based nanomaterials smaller than 10 nm that have gained increasing prominence in environmental sensing due to their tunable photoluminescence, high aqueous dispersibility, chemical stability, and low toxicity [16-22]. Recently, CDs have attracted growing interest as fluorescent probes for heavy metal ion detection (e.g., Fe³⁺, Cu²⁺, Hg²⁺, Pb²⁺, Cd²⁺, Ag⁺, Al³⁺, and Cr(VI)), where the sensing response is commonly governed by static/dynamic quenching, photoinduced electron transfer (PET), energy transfer (FRET/SET), and/or the inner filter effect (IFE), depending on surface chemistry and spectral overlap. These established studies highlight that rational control of surface states and interfacial interactions is critical for achieving both sensitivity and selectivity in CDs-based metal-ion sensing, motivating the development of heteroatom-engineered CDs for practical Cr(VI) monitoring in real water matrices [23-25]. Notably, the bottom-up synthesis of CDs allows precise control over their optical and structural properties while offering better energy efficiency and reduced material waste compared to top-down methods [26]. Nonetheless, many existing bottom-up synthesis routes remain energy-intensive, often requiring temperatures exceeding 200 °C and prolonged reaction durations [27-29]. Addressing these limitations aligns with the sustainability goals of reducing both energy input and waste generation during nanomaterial fabrication. In this context, microwave-assisted synthesis has emerged as an eco-efficient strategy, providing homogeneous heating, rapid reaction kinetics, and superior energy conversion efficiency. Recent studies have shown that the optical/functional properties of CDs are highly dependent on processing parameters (e.g., precursor ratio, microwave power/time, and post-treatment), which regulate surface functional groups and emissive surface states. Consequently, rational control of synthesis and purification conditions is crucial for obtaining reproducible CDs with optimized photoluminescence and reliable sensing performance in real samples [30,31].
Beyond process control, the optical and electronic characteristics of CDs can also be finely tuned through heteroatom doping, which modifies surface states, introduces defect sites, and enhances radiative recombination [32]. Non-metal dopants such as nitrogen, sulfur, phosphorus, boron, and fluorine are particularly favorable due to their ability to strengthen photoluminescence and expand functional group diversity without introducing toxicity concerns [33]. In contrast, metal doping (e.g., Fe, Ni, Mn) often raises environmental and biological safety concerns, limiting its practical applicability [34]. For instance, single-dopant CDs synthesized from citric acid and polyethyleneimine achieved a detection limit of 62.4 nM with a QY of 11.65% [35]. Similarly, CDs derived from soluble starch and L-arginine showed a slightly lower performance, with a detection limit of 0.80 μM and a QY of 10.9% [36]. In metal-doped systems, Ni-doped lignin CDs demonstrated comparable efficiency, yielding a QY of 8.25% and a detection limit of 0.17 μM for Cr(VI) [37]. In comparison, dual-heteroatom systems such as B,N-CDs, exhibited improved luminescence performance (QY = 59.01%) but still suffered from a relatively high detection limit of 0.24 µM [38]. These findings clearly reveal that, despite significant progress, conventional single- and dual-doping strategies remain inherently constrained in both QY and sensitivity, limiting their applicability for trace-level Cr(VI) monitoring. Therefore, a new generation of rationally engineered tri-atom doped CDs is urgently required—designed to harness synergistic heteroatom interactions that simultaneously enhance emission efficiency and detection capability. Such an approach not only addresses existing performance bottlenecks but also aligns with the principles of energy efficiency and waste reduction, advancing the development of sustainable nanomaterials for real-world environmental sensing.
Accordingly, this study presents a rapid microwave-assisted synthesis of N,S,P-CDs using citric acid, ethylenediamine, thioglycolic acid, and phosphoric acid as low-cost and environmentally benign precursors, without the use of any metal species in the synthesis. Beyond producing high–quantum–yield, sensitively and selectively responsive nanomaterials for Cr(VI) detection, this work provides a systematic understanding of the interactions between N,S,P-CDs and Cr(VI), offering clear insight into the detection mechanism at the sensor–target interface.
Materials and methods
Materials
Citric acid (C₆H₈O₇, ≥99%), ethylenediamine (EDA, 98%), thioglycolic acid (C₂H₄O₂S, ≥98%), and phosphoric acid (H₃PO₄, 85 wt% in water) were purchased from Merck Millipore and used as received without further purification. Hydrochloric acid (HCl, ~37% (w/w) in water), sodium hydroxide (NaOH, 99%), and sodium chloride (NaCl, ≥99%) were purchased from Sigma-Aldrich. Analytical-grade inorganic salts/metal salts, including K₂Cr₂O₇, FeCl₂·4H₂O, Fe(NO₃)₃·9H₂O, Ni(NO₃)₂·6H₂O, Pb(NO₃)₂, Zn(NO₃)₂·6H₂O, Cu(NO₃)₂·3H₂O, Cr(NO₃)₃·4H₂O, Ca(NO₃)₂·4H₂O, Mg(NO₃)₂·6H₂O, AgNO₃, Al(NO₃)₃·9H₂O, Mn(NO₃)₂·4H₂O, NaHCO₃, KSCN, NaH₂PO₄, Na₂HPO₄, Na₂S, K₂CrO₄, K₂S₂O₈, KHSO₄, KH₂AsO₄, Na₂SO₄, Na₂CO₃, NaNO₂, NaNO₃, Na₂SO₃, Na₂S₂O₃, Na₂S₂O₅, Na₃PO₄, and NaF were used for analytical and selectivity tests. All aqueous solutions were prepared using deionized water. A dialysis membrane with a molecular weight cut-off (MWCO) of 1,000 Da was obtained from Merck Millipore and used for product purification.
Synthesis of undoped carbon dots (CDs) and N,S,P co-doped carbon dots (N,S,P-CDs)
Microwave-assisted synthesis was carried out using a domestic microwave oven (Samsung ME731K; 20 L cavity; cavity dimensions 330×211×309 mm3; turntable distribution; maximum microwave output power 800 W; operating frequency 2450 MHz). The microwave was operated at 450 W, with power delivered in a pulsed/duty-cycled mode (magnetron ON/OFF). The reaction mixture was placed in an open 15 mL test tube (cylindrical geometry) positioned at the center of the turntable. The bulk temperature was measured immediately after irradiation using a digital thermometer and reached approximately 100 °C under the selected condition.
The undoped CDs were synthesized via microwave-assisted carbonization of citric acid. In a typical procedure, citric acid (200 mg) was irradiated in an open 15 mL test tube without solvent at 450 W for 6 min, yielding a yellow-brown product after cooling. For the synthesis of N,S,P-CDs, citric acid (200 mg) was mixed with ethylenediamine (67 µL), thioglycolic acid (35 µL), and phosphoric acid (26 µL) and irradiated at 450 W for 30 s under the same conditions. The obtained product was redispersed in 10 mL of distilled water and stirred for 10 min. The dispersion (10 mL) was purified by single-bath dialysis against 1,000 mL of deionized water using a 1,000 Da MWCO membrane for 3 h at room temperature under gentle stirring without water replacement.
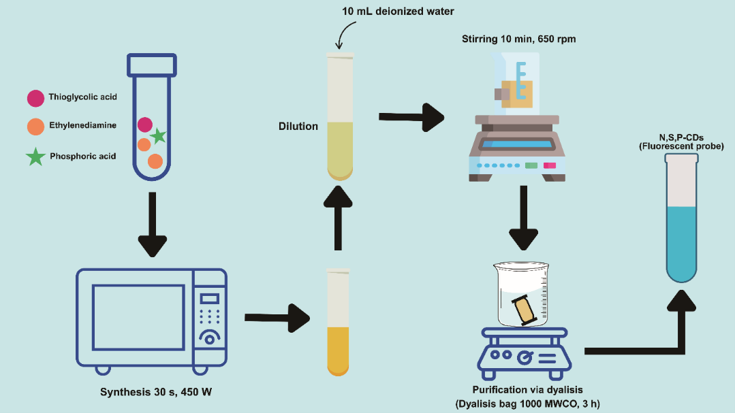
Figure 1 Schematic synthesis of N,S,P-CDs.
Characterization of CDs and N,S,P-CDs
Optical properties were evaluated by UV–Vis spectrophotometry using a GENESYS 50 spectrophotometer (Thermo Scientific; silicon photodiode detector) with a 2 nm spectral bandwidth and the default medium response time at room temperature, while fluorescence spectra were recorded using a Shimadzu RF-6000 spectrofluorometer (PMT detector; high-voltage mode) with excitation/emission slit widths of 5 nm and an integration time of 0.5 s at room temperature. Structural properties were analyzed by X-ray diffraction (XRD) using a D8 Advance Eco diffractometer (Bruker) with Cu Kα radiation (λ = 1.5406 Å) at 40 kV and 40 mA over 2θ = 10° - 80° using a 0.02° step size, and crystallinity was further verified by selected area electron diffraction (SAED) on an FEI Tecnai G2 Supertwin TEM (Thermo Fisher Scientific) operated at 200 kV. Morphology, particle size distribution, and lattice fringes were examined by high-resolution transmission electron microscopy (HR-TEM) using the same FEI Tecnai G2 Supertwin microscope (200 kV) after drop-casting onto carbon-coated copper grids and drying at room temperature; SAED was collected in diffraction mode under near-parallel illumination using a selected-area aperture of ~0.5 - 2.0 µm and a camera length of 200 - 800 mm with 0.5 - 3 s exposure under low-dose conditions, and the camera constant was calibrated using a polycrystalline Au standard for d-spacing determination. Elemental composition and spatial distribution were determined by scanning transmission electron microscopy–energy-dispersive X-ray spectroscopy (STEM-EDX) using an EDAX system attached to the HR-TEM (200 kV) with a live time of 30 - 120 s over an energy range of 0 - 20 keV. Surface functional groups were identified by Fourier-transform infrared spectroscopy (FT-IR) using an IRPrestige-21 spectrometer (Shimadzu) over 4,000 - 400 cm⁻¹ at 4 cm⁻¹ resolution with 32 scans per spectrum (fresh background recorded under identical conditions), while zeta potential was measured using a nanoPartica SZ-100V2 analyzer (Horiba) at 25 ± 0.5 °C after 2 - 5 min equilibration (triplicate measurements, automatic acquisition). Structural defects and graphitic ordering were assessed by Raman spectroscopy using a LabRAM HR Evolution spectrometer (Horiba) with a 532 nm laser over 800 - 2,000 cm⁻¹ at ~1 - 2 cm⁻¹ spectral resolution, laser power < 5 mW, and 5 - 20 s integration time with 2 - 5 accumulations at room temperature.
Stability evaluation of N,S,P-CDs
The physicochemical stability of the synthesized N,S,P-CDs was systematically evaluated under diverse environmental conditions, including pH variation, ionic strength, UV irradiation, and storage duration. For pH stability assessment, the fluorescence response of N,S,P-CDs (10 mL) was monitored over the pH range 2 - 12, adjusted with HCl or NaOH. Emission intensity was recorded at the maximum excitation wavelength. Ionic-strength tolerance was examined by adding NaCl solutions (0.01 - 1 M) to 200 µL of N,S,P-CDs and analyzing the resulting fluorescence spectra. Photostability was evaluated under continuous UV irradiation (365 nm) for 0 - 50 min using a UV reactor, after which the fluorescence intensity was measured to assess photobleaching resistance. Lastly, storage stability was evaluated by monitoring the fluorescence intensity of N,S,P-CDs stored at ambient temperature over 14 days, with measurements performed on days 0, 2, 5, 8, 11, and 14. These analyses collectively provide a comprehensive understanding of the environmental robustness and operational durability of the N,S,P-CDs.
Selectivity and sensitivity measurements
The selectivity and sensitivity of N,S,P-CDs toward Cr(VI) detection were extensively evaluated. Selectivity was assessed by recording the fluorescence response of N,S,P-CDs in the presence of a wide range of cations and anions, including Fe²⁺, Co²⁺, Fe³⁺, Ni²⁺, Pb²⁺, Zn²⁺, Cu²⁺, Cr³⁺, Ca²⁺, Mg²⁺, Ag⁺, Al³⁺, Mn²⁺, HCO₃⁻, SCN⁻, H₂PO₄⁻, S²⁻, CrO₄²⁻, S₂O₈²⁻, BrO₃⁻, H₂AsO₄⁻, HSO₄⁻, MnO₄⁻, HPO₄²⁻, SO₄²⁻, CO₃²⁻, NO₂⁻, NO₃⁻, SO₃²⁻, S₂O₃²⁻, S₂O₅²⁻, PO₄³⁻, F⁻, and Cl⁻. Each ion was introduced at 100 µM into 9 mL of N,S,P-CDs solution (pH 7), and fluorescence spectra were recorded to evaluate the selectivity of the N,S,P-CDs toward Cr(VI). Sensitivity toward Cr(VI) was investigated under optimized conditions by mixing 9 mL of N,S,P-CDs with 1 mL of Cr(VI) at concentrations ranging from 0 to 100 µM. Fluorescence quenching efficiency was determined, and the LoD and LoQ were calculated based on the standard deviation of the response (Sy,x ) and the slope of the calibration curve (b ), according to the following equations:
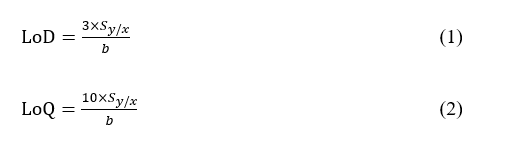
The validity of the calculated LoD and LoQ was further verified using the mean blank response ( ȳblank ) and its standard deviation ( Sblank ). All measurements were conducted in triplicate.
Quantum yield determination and Real-sample analysis
Fluorescence emission spectra of the sample and reference were recorded under identical experimental conditions, using a spectrofluorometric setup with fixed excitation and emission slit widths, a constant integration time, and measurements performed at room temperature. The fluorescence quantum yield (QY) was calculated using a relative method according to the following equation:

where ΦF and ΦR are the quantum yields of the sample and reference, respectively; IF and IR are the integrated fluorescence emission intensities; AF and AR are the absorbances at the excitation wavelength.
The practical applicability of N,S,P-CDs was assessed using real environmental samples, including electroplating wastewater, river water, and tap water. Each sample was spiked with 1 mL of N,S,P-CDs under optimized conditions to a final volume of 10 mL, then analyzed by UV-Vis spectrophotometer and spectrofluorometer at the optimal excitation wavelength. All experiments were performed in triplicate.
Results and discussion
Structural and optical properties of N,S,P-CDs
The successful synthesis and structural features of N,S,P-CDs were confirmed using a combination of UV–Vis spectrophotometry, Raman spectroscopy, FT-IR spectroscopy, XRD, HR-TEM, SAED, EDX, zeta potential analyzer, and spectrofluorometer.
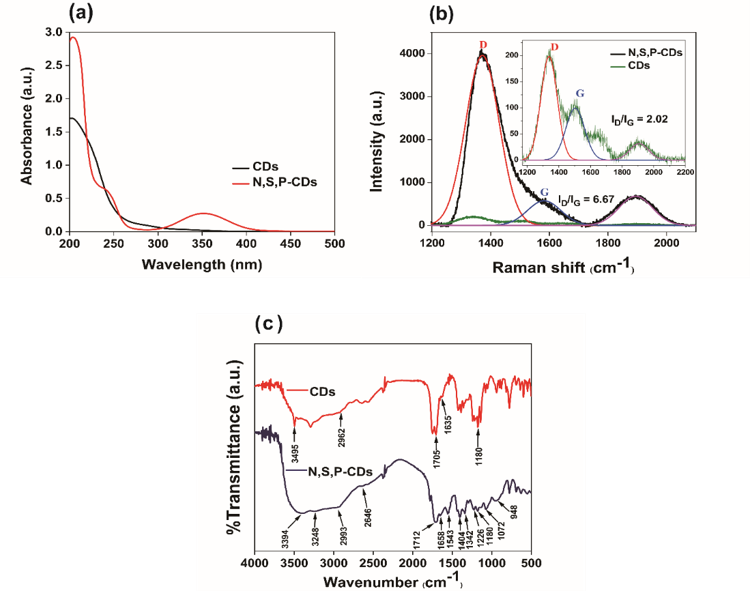
Figure 2 UV-Vis absorbance of CDs and N,S,P-CDs (a), Comparison of Raman spectra between CDs and N,S,P-CDs (b), FT-IR spectra of CDs and N,S,P-CDs (c).
As depicted in Figure 2(a) (red line), the UV–Vis absorption spectrum of N,S,P-CDs exhibited two distinct peaks at 246 and 352 nm, corresponding to the π–π* transitions of aromatic C=C bonds within the sp²-hybridized carbon core and n–π* transitions of heteroatom-containing functional groups (C=O, C–N, C=N, and C=S) in N,S,P-CDs surface. These absorption features verified the successful formation of conjugated carbon cores and effective surface passivation. In contrast, CDs showed negligible absorption (Figure 2(a); black line), highlighting the essential role of heteroatom doping in modulating the electronic structure and optical properties of the carbon dots. This distinct optical behavior reflects the influence of N, S, and P incorporation on the π-conjugated system, thereby improving the material’s sensing performance.
Raman spectroscopy further provided insights into the degree of graphitization and the density of structural defects in the synthesized CDs and N,S,P-CDs (Figure 2(b)). The Raman spectra revealed 2 major bands—D and G—corresponding to disordered sp³-hybridized carbon and the graphitic sp² network, respectively. CDs displayed D and G bands at 1,336.02 and 1,505.61 cm⁻¹, with an ID/IG ratio of 2.02, where ID/IG are the peak intensities (heights) of the D band and G band, respectively, indicating the presence of amorphous carbon and surface defects associated primarily with oxygen-containing functional group [39]. Conversely, N,S,P-CDs exhibited D and G bands at 1,372 and 1,582 cm⁻¹, respectively, with a significantly higher ID/IG ratio of 6.67. The coexistence of both bands indicated a structure composed of sp²- and sp³-hybridized carbon domains, confirming a graphitic surface with moderate amorphous character. The elevated ID/IG ratio in N,S,P-CDs indicated a higher density of defect sites and enhanced surface functionalization resulting from N, S, and P doping. This observation is consistent with previous studies showing that chemical doping can increase the D-band intensity by inducing lattice distortions in the graphite structure. The resulting disorder improves the exposure of surface-active sites, which in turn, enhances fluorescence [40].
Complementary FT-IR spectra (Figure 2(c)) further substantiated the successful doping of N, S, and P dopants into the CDs. In a comparative context, CDs exhibited characteristic absorption peaks at 3,945, 2,962, 1,705, 1,635, and 1,180 cm⁻¹, assigned to O–H, C–H, C=O, C=C, and O–C–O stretching vibrations, respectively, confirming the formation of oxygen-containing functionalities on the CDs surface. For N,S,P-CDs, a broad absorption band observed in the 3,000 - 3,400 cm⁻¹ range (3,344 and 3,248 cm⁻¹) was attributed to overlapping O–H and N–H stretching vibrations. A slight shift in the Csp³–H stretching peak to 2,993 cm⁻¹ and overlapping bands between 1,500 - 1,712 cm⁻¹ indicated the presence of C=O and C=N stretching vibrations. The broad peak at 1,658 cm⁻¹ was ascribed to –CO–NH, C=O, and C=C stretching, suggesting the formation of amide linkages resulting from the reaction between ethylenediamine and citric acid. The disappearance of the carboxyl-related C=O band further verified the replacement of –COOH groups by amide bonds, likely formed through peptide-like condensation between the two precursors. In addition, distinct peaks at 1,543 and 1,404 cm⁻¹, corresponding to N–H and C–N stretching, confirmed nitrogen incorporation, while absorption at 1,226, 948, and 779 cm⁻¹ corresponded to C–S, S–O–C, and S–H vibrations, respectively, validating sulfur doping. The P–O–C stretching observed at 1,072 cm⁻¹ provided clear evidence of phosphorus integration into the N,S,P-CDs surface. Collectively, these spectral features further demonstrated the successful doping of N, S, and P atoms, resulting in enhanced surface passivation and the formation of heteroatom-enriched functional groups. This synergistic heteroatom doping supports the observed optical properties and suggests a well-passivated surface in N,S,P-CDs, advantageous for sensing applications. The consistency across UV–Vis, Raman, and FT-IR measurements provides strong evidence for the successful production of N,S,P-CDs, which possess a carbon core and passivating functional surface groups.
XRD analysis was employed to characterize the crystallinity and structural order of the N,S,P-CDs as depicted in Figure 3(a). The diffraction profile exhibited a broad peak cantered at 2θ = 22.2°, corresponding to the (002) plane of graphitic carbon, characteristic of an amorphous carbon structure with extensive lattice defects. The broadness of this peak reflects a high density of structural defects and disordered carbon arrangements, primarily attributed to the presence of N, S, and P dopants within the N,S,P-CDs structure. In addition, relatively sharp peaks observed at 20.1° and 30.5°, assigned to the (100) plane and oxygen-related defect sites, indicate the partial formation of crystalline carbon domains within the predominantly amorphous matrix. The coexistence of these features suggests that the N,S,P-CDs are largely amorphous, while retaining a degree of graphitic ordering that can suppress light scattering and minimize energy loss, thereby enhancing luminescence efficiency and photostability [39,40]. Compared with previously reported carbon dots exhibiting diffraction peaks near 2θ = 25.5°, 23.8°, and 23.1°, the observed shift toward a smaller diffraction angles indicates an expanded interlayer spacing [41-43]. This enlargement results from the doping of nitrogen, sulfur, and phosphorus into the graphite structure, which increases the interplanar distance and shifts the diffraction angle to lower 2θ values. This shift is primarily attributed to surface defects and passivation, both of which increase the d-spacing and induce uniform strain [44,45].
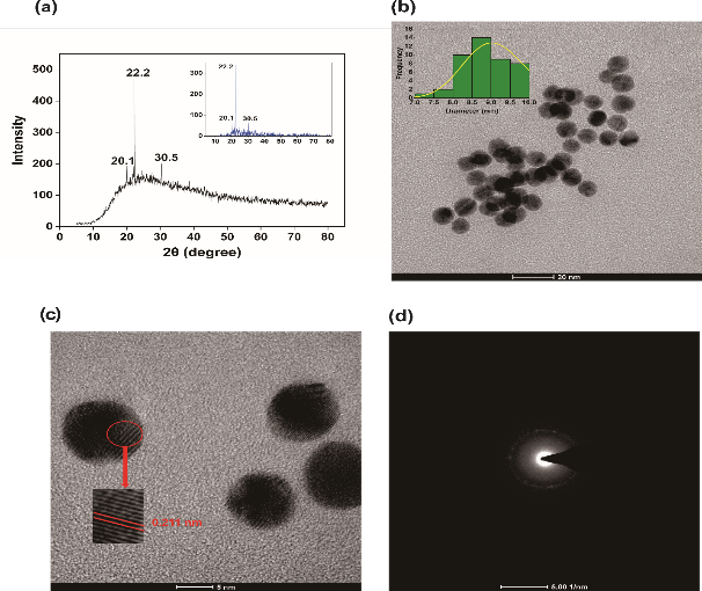
Figure 3 XRD patterns of N,S,P-CDs (a), TEM image of N,S,P-CDs with a scale bar of 20 nm and the average particle size distribution (inset) (b), HRTEM image of N,S,P-CDs highlights with red circles showing the arrangements of graphitic packing as interplanar fringes (c), SAED pattern of N,S,P-CDs (d).
Moreover, the diffraction peak at 30.5° is associated with oxygen-containing groups and defect sites induced by N-doping within the carbon lattice. The broad full width at half maximum (FWHM) of the (002) reflection indicates the presence of nanoscale crystallites (<10 nm), consistent with the Debye–Scherrer relation, which associates wider FWHM values with smaller crystallite sizes. This interpretation is further supported by the vast peak observed near 22.2°. HR-TEM (250,000×; Figure 3(b)) further revealed that the N,S,P-CDs possess a quasi-spherical morphology with uniform size distribution and minimal aggregation, likely due to electrostatic repulsion from surface functional groups. The particle diameters ranged from 7 to 10 nm, with an average size of approximately 8.89 nm, confirming excellent size uniformity. Furthermore, the internal structure of the N,S,P-CDs was examined using HR-TEM (Figure 3(c)), which revealed well-resolved lattice fringes with an interlayer spacing of 0.211 nm, corresponding to the (100) crystal facet of graphitic carbon (dₕₖₗ = 0.211 nm), as schematically illustrated in Figure S1. This observation confirms the presence of a conjugated sp²-hybridized carbon core, consistent with the dₕₖₗ values obtained from the XRD pattern. In addition, the SAED pattern in Figure 3(d) showed diffuse rings with weak and irregular bright spots, indicative of low crystallinity. Such partial amorphousness is attributed to the doping of nitrogen, sulfur, and phosphorus on the N,S,P-CDs. Despite this, the coexistence of localized graphitic domains within an amorphous carbon matrix suggests that the N,S,P-CDs possess a quasi-graphitic structure, providing an optimal balance between crystallinity and defect-induced emissive sites [46].
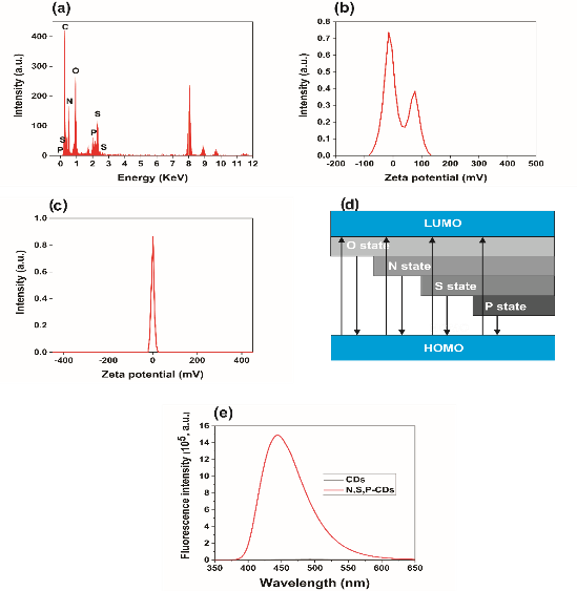
Figure 4 EDX Spectrum for element analysis of N,S,P-CDs (a), Zeta potential graph of N,S,P-CDs before (b), and after (c) addition of Cr(VI), Fluorescence mechanism of N,S,P-CDs (d), Fluorescence intensity of CDs and N,S,P-CDs (e).
The elemental composition of the synthesized N,S,P-CDs was investigated through EDX spectroscopy, as shown in Figure 4(a). The EDX spectrum displayed distinct peaks corresponding to C, N, O, S, and P, confirming the successful incorporation of dopants into the N,S,P-CDs structure. Quantitative analysis revealed elemental distributions of C (57.95%), O (18.36%), N (10.93%), P (4.35%), and S (8.41%) (Table S1), demonstrating effective nitrogen doping and co-doping with sulfur and phosphorus. The presence of these dopants indicates successful surface modification and structural passivation, which are essential for enhancing the fluorescence intensity and electronic properties of the N,S,P-CDs. Zeta potential analysis was performed to elucidate further the surface charge characteristics (Figure 4(b)). The pristine N,S,P-CDs exhibited a positive zeta potential of +18.9 mV, suggesting a positively charged surface dominated by protonated amine and nitrogen-containing functional groups. This observation aligns with the FT-IR results, confirming the introduction of amine functionalities during synthesis. Upon the introduction of Cr(VI) ions, the zeta potential decreased significantly from +18.9 mV to –0.1 mV, as shown in Figure 4(c). This decrease in surface charge is attributed to effective interactions between the surface amine groups of the N,S,P-CDs and Cr(VI) species. The pronounced reduction in zeta potential highlights the efficient surface interaction mechanism, confirming the suitability of N,S,P-CDs as highly responsive nanomaterials for Cr(VI) detection.
As illustrated in Figure 4(d), tri-atom doping was selected because the functional groups introduced by N, S, and P broaden and enrich the distribution of surface energy states, thereby promoting the formation of new emissive surface states and enhancing fluorescence emission through synergistic effects. This enhancement arises from radiative recombination of trapped electron–hole (e-h) pairs at various dopant-related energy levels. In particular, N doping effectively passivates the CDs, while co-doping with S and P further increases the density of emissive states by introducing additional defect- and surface-related functionalities and energy levels [47]. Accordingly, upon excitation, electrons are promoted into these dopant-associated higher-energy states and then undergo vibrational relaxation to lower vibronic levels, which favors radiative recombination and thus produces a markedly stronger fluorescence intensity for the N,S,P-CDs than for pristine CDs, as depicted in Figure 4(e). This mechanism ultimately contributes to the significant improvement in QY. Moreover, the successful synthesis, as confirmed by the above characterizations, further indicates that, under microwave irradiation, short external thermal waves provide more uniform heating and effectively shorten reaction time. This condition facilitates the chemical oxidation and carbonization of organic materials, ultimately leading to the formation of optimized N,S,P-CDs by passivating organic molecules on their surfaces [48].
The stability of N,S,P-CDs
As shown in Figure 5(a), the probe exhibits broad pH tolerance, with relatively stable fluorescence over pH 4 - 10, supporting its suitability for applications in both mildly acidic and alkaline environments. Notably, the fluorescence intensity peaks at pH 7, indicating an optimal emission condition that is likely related to effective surface passivation. Under more alkaline conditions, the fluorescence gradually decreases at pH 11 and 12, which may be attributed to deprotonation of surface carboxyl groups and increased surface electronegativity, promoting aggregation and resulting in partial fluorescence quenching. Conversely, in strongly acidic media, the fluorescence drops sharply at pH 2 and 3, suggesting disruption of surface emissive states and/or partial structural degradation. To assess the stability, N,S,P-CDs were tested in various conditions.
The fluorescence intensity remained stable across NaCl concentrations from 0 to 1 M, as depicted in Figure 5(b), demonstrating excellent salt tolerance, optical stability, and resistance to aggregation in high-ionic-strength environments. Photostability testing (Figure 5(c)) revealed negligible fluorescence loss after 50 min of continuous UV irradiation, confirming strong photostability and suitability for UV-driven applications such as photocatalysis and optical sensing. Moreover, as shown in Figure 5(d), over 85% of the initial fluorescence intensity was retained after 14 days of storage at room temperature, validating the remarkable long-term stability and practical applicability of N,S,P-CDs.
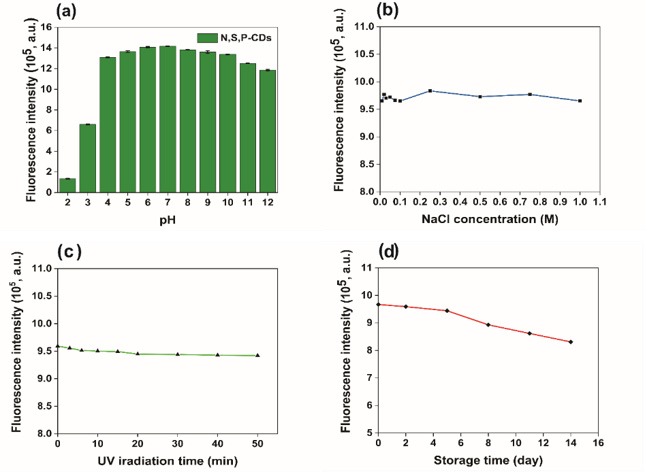
Figure 5 Fluorescence intensity of N,S,P-CDs at different pH (a), The effect of NaCl solution concentration (b), UV irradiation time (c), Storage time at room temperature (d) on the fluorescence intensity of N,S,P-CDs.
Cr(VI)–N,S,P-CDs interaction and quenching: Multi-technique evidence
A red shift accompanied by decreased absorbance at 246 and 362 nm in the UV–Vis spectrum (Figure 6(a)) confirms coordination between Cr(VI) and N,S,P-CDs [49], which is likely governed by interactions between protonated amine groups (–NH₃⁺) and dichromate anions (Cr₂O₇²⁻). Consistently, the zeta potential decreases from +18.9 to –0.1 mV (Figure 4(c)), indicating association of Cr(VI) species on the N,S,P-CDs surface. These spectral and surface-charge changes suggest the formation of a non-fluorescent (or weakly fluorescent) ground-state complex prior to excitation, a hallmark of static quenching. Time-resolved fluorescence measurements further support this mechanism: The average lifetime (τavg ) of pristine N,S,P-CDs (0.852 ns) does not decrease but increases to 2.022 ns after Cr(VI) addition (Figure 6(b)), while the decay profiles remain similar in shape and do not shift toward shorter times. Because dynamic (collisional) quenching typically leads to lifetime shortening, the absence of a reduced lifetime rules out dynamic quenching as the dominant pathway [50-52]. Therefore, the UV–Vis changes, preserved decay behavior, and reduced fluorescence intensity collectively confirm a static quenching mechanism (SQE) driven by ground-state interactions between Cr(VI) species and surface functional groups of the N,S,P-CDs [53]. As illustrated in Figure 6(c), SQE occurs when N,S,P-CDs form a ground-state [N,S,P-CDs–Cr(VI)] complex; upon photoexcitation, radiative emission is suppressed due to non-radiative relaxation, resulting in diminished fluorescence intensity. In addition, the temperature-dependent Stern–Volmer analysis (Table S2) shows good linearity with intercepts close to unity, confirming the applicability of the Stern–Volmer model. The Stern–Volmer quenching constants (KSV ) were determined to be 8.0×10³ M⁻¹ at 25 °C, 2.2×10³ M⁻¹ at 35 °C, and 2.0×10³ M⁻¹ at 45 °C, respectively. Notably, KSV decreases with increasing temperature, indicating weakened quenching at elevated temperatures. This temperature dependence is characteristic of SQE, as elevated temperatures generally destabilize the ground-state fluorophore–quencher complex.
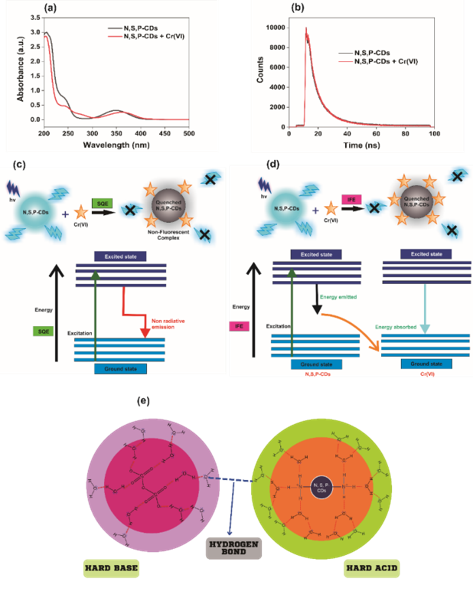
Figure 6 Comparison of the absorbance of N,S,P-CDs in the absence and presence of Cr(VI) (a), Fluorescence decay curves of N,S,P-CDs and the mixtures of N,S,P-CDs with Cr(VI) (b), Fluorescence quenching pathways for Cr(VI) sensing: SQE through ground-state association (c) and IFE through absorption of excitation/emission light by Cr(VI) [54] (d), The chemical reaction between N,S,P-CDs and Cr(VI) (e).
In aqueous media, Cr(VI) mainly exists as hydrated oxoanions (Cr₂O₇²⁻), surrounded by a structured solvation shell formed through extensive hydrogen bonding with water molecules. This hydration environment can be described analogously to a Stern-like inner layer and a more diffuse outer layer. Zeta-potential measurements indicate that the N,S,P-CDs possess a positively charged surface due to the predominance of protonated amine groups (–NH₃⁺), whose stabilization is facilitated by solvation and hydrogen bonding with interfacial water. Owing to the strong solvation of both species, their association in water is expected to occur mainly via solvent-separated ion pairs, with interactions mediated by hydrogen-bonded water molecules, although transient direct contacts may also form. From a qualitative Hard and Soft Acids and Bases (HSAB) perspective, Pearson’s principle states that, in a competitive situation, hard acids preferentially interact with hard bases, while soft acids preferentially interact with soft bases. In our system, the surface RNH₃⁺ group does not behave as a Lewis base because the nitrogen atom does not provide a lone electron pair; instead, its “acidic” character is mainly associated with the proton in the N–H bond, which exhibits hard acid-like characteristics (small size, high charge density, and low polarizability). In contrast, Cr(VI) oxoanions (e.g., Cr₂O₇²⁻) act as hard bases, as their oxygen atoms serve as donor/acceptor sites and are characterized by high electronegativity and low polarizability. Accordingly, this hard acid–hard base complementarity supports hydrogen-bonded N–H·O interactions between surface –NH₃⁺ groups and Cr(VI) species in aqueous solution, as illustrated in Figure 6(e).
Selectivity performance of N,S,P-CDs toward Cr(VI)
As illustrated in Figure 7(a), the N,S,P-CDs display a clear preference toward Cr(VI), evidenced by a substantial decrease in fluorescence intensity. In contrast, the presence of other metal cations induces only minimal perturbations. This trend is further reinforced by the anion selectivity results in Figure 7(c), where Cr(VI) again emerges as the only species capable of producing a marked quenching effect. Visual assessments under UV illumination support these findings. As illustrated in Figure 7(b), the N,S,P-CDs preserve their bright blue fluorescence when exposed to a wide range of metal cations, confirming that these ions do not interfere with their emissive properties. In contrast, (N,S,P-CDs–Cr(VI)) complex exhibits a distinct loss of fluorescence, indicating a specific interaction between Cr(VI) and the surface states of the N,S,P-CDs. A comparable response is observed for the anion series in Figure 7(d), where all anions except Cr(VI) leave the fluorescence essentially unchanged. Overall, Cr(VI) suppresses the fluorescence intensity of N,S,P-CDs to below 50%, while all other tested ions maintain emission levels above 90%. This sharp discrimination underscores the exceptional selectivity of N,S,P-CDs toward Cr(VI). It highlights their strong potential as reliable fluorescent probes for detecting Cr(VI) in complex matrices.
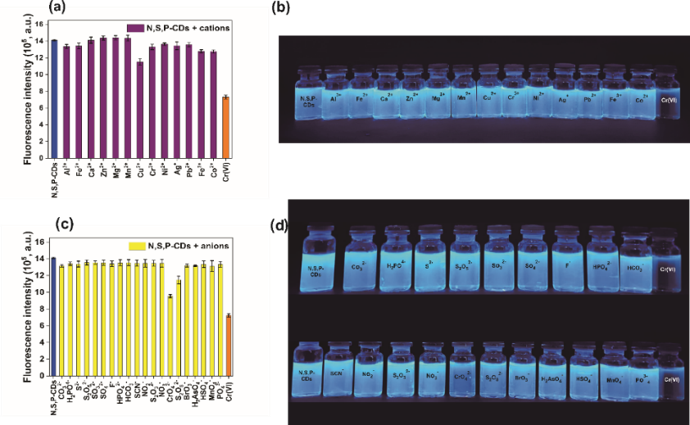
Figure 7 Fluorescence intensity of N,S,P-CDs after addition of other metal cations (a) and anions (c) compared with Cr(VI), Fluorescence appearance of N,S,P-CDs after addition of other metal cations (b) and anions (d) compared with Cr(VI) under UV light at 365 nm (d).
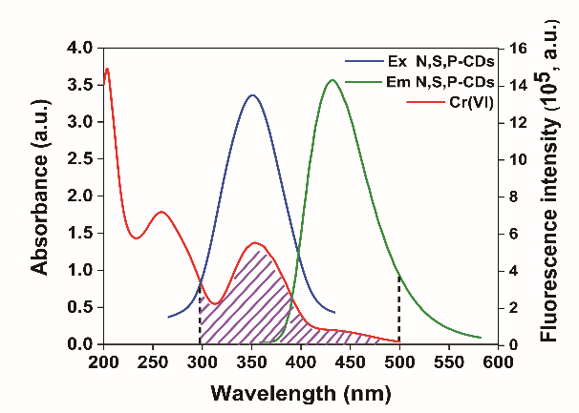
Figure 8 Illustration of IFE resulting in fluorescence quenching of N,S,P-CDs.
As depicted in Figure 8, IFE occurs because Cr(VI) acts as an absorber/metal-ion quencher with an absorption spectrum overlapping the excitation and/or emission bands of N,S,P-CDs [55]. Specifically, Cr(VI) exhibits sharp absorbance peaks around 250 and 350 nm, along with a shoulder near 450 nm, corresponding to the excitation and emission wavelengths of N,S,P-CDs, at around 350 and 450 nm, respectively. The spectral overlap leads to the excitation of N,S,P-CDs partially blocked by the absorbance of Cr(VI). At the same time, the fluorescence emitted by the N,S,P-CDs is absorbed by Cr(VI), resulting in fluorescence quenching. This Cr(VI)-induced quenching via IFE, a pseudo-quenching mechanism involving fluorescence reabsorption by Cr(VI), as illustrated in Figure 6(d). Therefore, the Cr(VI)-induced fluorescence attenuation of N,S,P-CDs is governed by a dual mechanism involving SQE through ground-state complex formation and an IFE arising from spectral overlap.
Quantitative evaluation of IFE
To further clarify the contribution of optical attenuation to the observed steady-state fluorescence decrease, the IFE was quantitatively evaluated using absorbance-corrected fluorescence intensity calculations. The corrected fluorescence intensity was determined according to:

where Aex and Aem represent the absorbance values measured at the excitation wavelength (348 nm) and emission wavelength (452 nm), respectively.
As summarized in Table S8, the excitation absorbance (Aex) increases systematically with increasing Cr(VI) concentration, resulting in a correction factor (CF) increase from 1.45 to 1.49 across 0 - 1 µM. This corresponds to approximately 31% - 33% optical attenuation attributable to IFE under the present optical density conditions. The total observed fluorescence variation within this concentration range remains below 1%, indicating that the steady-state intensity attenuation is predominantly governed by concentration-dependent IFE. Detailed numerical calculations of CF, %IFE, and total fluorescence variation are provided in the Supplementary Information (Section: “Calculation of quantitative parameters for absorbance-based IFE correction”).
The comparison of Stern–Volmer plots before and after absorbance correction (Figure S2) further supports this conclusion. While the uncorrected plot (F0/Fobs) exhibits excellent linearity (R² = 0.996), the corrected relationship (F0corr/Fcorr) shows a markedly altered trend (R² = 0.952), indicating that the intensity-based attenuation observed in the uncorrected data is largely influenced by optical attenuation under the present measurement geometry.
Importantly, time-resolved fluorescence measurements reveal no shortening of the average fluorescence lifetime upon Cr(VI) addition, thereby excluding dynamic quenching. The emergence of a new UV–Vis absorption band further indicates ground-state interaction between N,S,P-CDs and Cr(VI), consistent with a SQE. Collectively, these findings demonstrate that the fluorescence response arises from the combined contribution of concentration-dependent IFE and SQE. Under the investigated conditions, IFE dominates the steady-state intensity variation, while SQE is independently supported by lifetime invariance and UV–Vis spectral evidence.
Sensitivity and application of N,S,P-CDs in real water samples
As illustrated in Figure 9(a), the fluorescence intensity of N,S,P-CDs gradually decreases with increasing Cr(VI) concentration, accompanied by a corresponding rise in % quenching. A strong linear relationship (R² = 0.9968) between % quenching and Cr(VI) concentration, as depicted in Figure 9(b), demonstrates excellent proportionality over a wide range, confirming high analytical precision and responsiveness at both low and high concentrations. This linearity and sensitivity enable accurate determination of the limit of detection (LoD) and limit of quantification (LoQ), corresponding to the smallest detectable analyte amount and the lowest reliably quantifiable concentration, respectively. The LoD and LoQ were calculated using the Sy,x from the low-concentration calibration range. The validity of the calculated LoD and LoQ was further verified using the ȳblank and Sblank . Based on these calculations, the resulting values were LoD = 0.07354 µM and LoQ = 0.2451 µM, as shown in Tables S3 and S4. These values are significantly lower than those reported in previous studies (Table 1), underscoring the sensor’s superior sensitivity. Importantly, the LoD is far below the WHO permissible limit for Cr(VI) in drinking water (0.96 µM), confirming the remarkable detection capability of N,S,P-CDs. Hence, the as-prepared N,S,P-CDs function as an ultrasensitive and reliable “turn-off” fluorescent probe for trace-level Cr(VI) monitoring in aqueous environments.
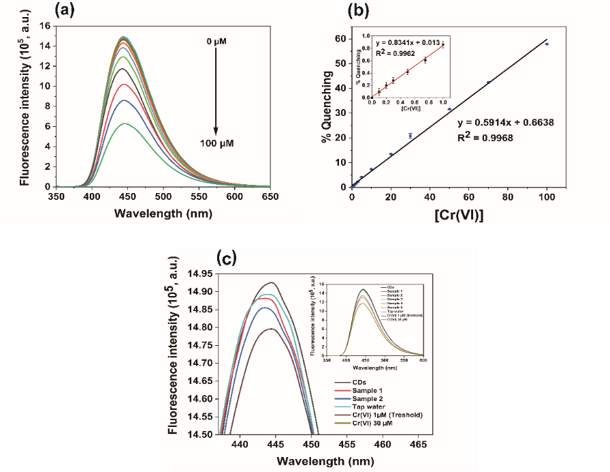
Figure 9 Effect of Cr(VI) concentration on fluorescence intensity (a), Linearity curve in the range of 0 - 100 µM Cr(VI) (inset: 0 - 1 µM) (b), Fluorescence intensity of N,S,P-CDs against their application on real samples in a water environment (c).
The practical applicability of N,S,P-CDs for Cr(VI) detection was validated using real water samples collected from various sites in Yogyakarta. As shown in Figure 9(c), tap water, Sample 1 (Code River), and Sample 2 (Gajahwong River) displayed fluorescence intensities above the Cr(VI) threshold (1 µM; brown line), corresponding to safe concentrations of 0.26 - 0.55 µM. Conversely, Sample 3 (Piyungan River), Sample 4 (wastewater near the Piyungan outlet), and Sample 5 (electroplating wastewater) exhibited fluorescence intensities below the threshold (see inset), indicating elevated Cr(VI) levels of 1.41, 12.16, and 15.34 µM, respectively. These findings confirm that water from the Code and Gajahwong Rivers remains within safe limits. In contrast, samples from the Piyungan River, the Piyungan wastewater outlet, and electroplating waste streams show substantial Cr(VI) contamination.
Table 1 Comparison of synthesis type, synthesis time, LoD, quenching mechanism, and % quenching of N,S,P-CDs with other CDs for Cr(VI) detection.
No. |
Type of CDs |
Synthesis type |
LoD |
Quenching mechanism |
% Quenching |
Ref. |
1 |
N,P-CDs |
Hydrothermal (180 ℃; 6 h) |
2.4 μM |
PET |
15.10% |
[43] |
2 |
CS-CDs |
Hydrothermal (190 ℃; 15 h) |
0.59 μM |
IFE |
16.81% |
[41] |
3 |
Metal-free TA-CDs |
Hydrothermal (160 ℃; 10 h) |
0.51 μM |
DQ/FRET |
27.11% |
[56] |
4 |
G-CDs |
Co-electrolyis 12 min |
0.15 μM |
SQE |
6.05% |
[57] |
5 |
M− 6 %P-CDs |
Hydrothermal (180 ℃; 12 h) |
0.59 μM |
IFE |
73.90% |
[58] |
6 |
MCDs |
Solvothermal (180 ℃; 12 h) |
0.86 μM |
SQE + IFE |
21.70% |
[59] |
7 |
NCDs |
Hydrothermal (180 ℃; 10 h) |
0.173 µM |
FRET |
21% |
[60] |
8 |
D-CDs |
Hydrothermal (200 ℃; 9 h) |
0.08 μM |
IFE + SQE |
4.02% |
[53] |
9 |
N,S,P-CDs |
Microwave (450 W (≈100 °C); 30 s) |
0.07354 µM |
IFE + SQE |
89.64% |
Based on the calculations in Tables S5 and S6, the pristine CDs show a QY of 8.94%, whereas the N,S,P-CDs exhibit a markedly higher QY of 89.64%, indicating highly efficient radiative emission upon tri-atom doping. This enhancement is attributed to dopant-induced surface/defect states that facilitate radiative recombination, along with an optimized precursor composition and controlled synthesis conditions that yield favorable structural and optical features. Compared with literature probes (Table 1), many CDs require hydrothermal/solvothermal processing (≈160 - 200 °C, 6 - 15 h) and typically report higher LoD values, while electrochemical routes require dedicated instrumentation and do not always provide high QY. In contrast, our N,S,P-CDs are rapidly prepared by microwave irradiation (450 W, ~100 °C, 30 s), offering a favorable balance of high QY, low LoD, and energy-efficient synthesis aligned with green chemistry principles. The applicability of the proposed N,S,P-CDs–based sensor for real-sample analysis was evaluated by spike–recovery tests in different water matrices, including river water, wastewater, electroplating wastewater, and tap water. As shown in Table S7, recoveries for Cr(VI) spiked at 0.25, 0.5, and 1.0 µM ranged from 96.96% to 101.52%, with relative standard deviations (RSD, n = 3) below 2%. These results confirm good analytical accuracy and precision across diverse and potentially complex matrices. The consistently high recoveries and low RSD values suggest that no significant matrix interference was observed under the tested conditions, supporting the applicability of the proposed method for practical environmental monitoring.
Conclusions
In conclusion, N,S,P-CDs were successfully synthesized via a rapid, energy-efficient microwave-assisted route, achieving a remarkably high QY (89.64%) within 30 s at 450 W. Structural and optical analyses confirmed effective N, S, and P doping, partial graphitization, and robust surface passivation. The resulting N,S,P-CDs exhibited superior optical performance, excellent photostability, broad pH tolerance, and strong resistance to ionic strength. Their fluorescence sensing capability toward Cr(VI) was governed by synergistic SQE and IFE mechanisms, enabling highly selective and sensitive detection with a wide linear range (0 - 100 µM) and an ultralow detection limit (0.07354 µM). Application to real environmental water samples demonstrated reliable quantification of Cr(VI) below the WHO permissible limit, with satisfactory analytical accuracy and precision as evidenced by recoveries ranging from 96.96% to 101.52% and relative standard deviations (RSD, n = 3) below 2%. Overall, these findings highlight N,S,P-CDs as a sustainable, high-performance, and green nanomaterial platform for practical Cr(VI) detection and broader environmental sensing applications.
Acknowledgements
The authors greatly acknowledge the scholarship support from Indonesia Endowment Fund for Education Agency (LPDP).
Declaration of Generative AI in Scientific Writing
The authors acknowledge that generative AI (ChatGPT) was used in the preparation of this manuscript. The use of AI was for improving the readability and language of a manuscript. No content was generated, nor was data interpreted using AI. All content and conclusions in this paper are based on our contributions and analysis.
CRediT Author Statement
Feni Risma Mei Diana: Conceptualization; Methodology; Investigation; Resources; Writing - Original Draft. Endang Tri Wahyuni: Writing - Review & Editing; Supervision. Mudasir Mudasir: Writing - Review & Editing; Supervision. Suherman Suherman: Writing - Review & Editing; Supervision.
References
[1] CJ Walsh. Urban impacts on the ecology of receiving waters: A framework for assessment. Hydrobiologia 2000; 431, 107-114.
[2] K Jomova, SY Alomar, E Nepovimova, K Kuca and M Valko. Heavy metals: Toxicity and human health effects. Archives of Toxicology 2025; 99(1), 153-209.
[3] QY Chen, A Murphy, H Sun and M Costa. Molecular and epigenetic mechanisms of Cr(VI)-induced carcinogenesis. Toxicology and Applied Pharmacology 2019; 377, 114636.
[4] A Monga, AB Fulke and D Dasgupta. Recent developments in essentiality of trivalent chromium and toxicity of hexavalent chromium: Implications on human health and remediation strategies. Journal of Hazardous Materials Advances 2022; 7, 100113.
[5] S Mitra, AJ Chakraborty, AM Tareq, TB Emran, F Nainu, A Khusro, AM Idris, MU Khandaker, H Osman, FA Alhumaydhi and J Simal-Gandara. Impact of heavy metals on the environment and human health: Novel therapeutic insights to counter the toxicity. Journal of King Saud University - Science 2022; 34(3), 101865.
[6] S Prasad, KK Yadav, S Kumar, N Gupta, MMS Cabral-Pinto, S Rezania, N Radwan and J Alam. Chromium contamination and effect on environmental health and its remediation: A sustainable approaches. Journal of Environmental Management 2021; 285, 112174.
[7] J Chávez-Lara, M Galicia, K Carrasco-Urrutia and J Torres-Pérez. Sensitive detection of chromium (VI) using Au-NPs/MWCNT/chitosan composite via electrochemical approach. International Journal of Electrochemical Science 2023; 18(7), 100161.
[8] ER Darwish, RF Alshehri, AS Amin and M Aish. Development of an innovative optical sensor to detect extremely low levels of chromium in real samples using colorimetric methods. Environmental Science: Advances 2023; 3(2), 274-289.
[9] K Hagiwara, Y Koike, M Aizawa and T Nakamura. On-site determination of arsenic, selenium, and chromium(VI) in drinking water using a solid-phase extraction disk/handheld X-ray fluorescence spectrometer. Analytical Sciences 2018; 34(11), 1309-1315.
[10] K Pytlakowska. Speciation of inorganic chromium in water samples by energy dispersive x-ray fluorescence spectrometry. Journal of Analytical Atomic Spectrometry 2016; 31(4), 968-974.
[11] F Ming, J Hou, C Hou, M Yang, X Wang, J Li, D Huo and Q He. One-step synthesized fluorescent nitrogen doped carbon dots from thymidine for Cr(VI) detection in water. Spectrochimica Acta Part A: Molecular and Biomolecular Spectroscopy 2019; 222, 117165.
[12] J Dei, S Mondal, A Biswas, DJ Sarkar, S Bhattacharyya, S Pal, S Mukherjee, S Sarkar, A Ghosh, V Bansal, R Bandhyopadhyay, BK Das and BK Behera. Cr-Detector: A simple chemosensing system for onsite Cr(VI) detection in water. PLoS One 2024; 19(1), e0295687.
[13] AG Kolekar, SP Pawar, DB Gunjal, OS Nille, PV Anbhule, SV Koparde, NQ Nguyen, D Sohn, GB Kolekar, GS Gokavi and VR More. Facile synthesis of sulphur-doped carbon dots (S-CDs) using a hydrothermal method for the selective sensing of Cr6+ and Fe3+ ions: Application to environmental water sample analysis. RSC Advances 2024; 14(5), 3473-3479.
[14] AB Patil, PL Chaudhary and PV Adhyapak. Carbon dots-cadmium sulfide quantum dots nanocomposite for ‘on-off’ fluorescence sensing of chromium(VI) ions. RSC Advances 2024; 14(18), 12923-12934.
[15] J Xie, Z Wu, J Sun, C Lv and Q Sun. Green synthesis of carbon quantum dots derived from Lycium barbarum for effective fluorescence detection of Cr(VI) sensing. Journal of Fluorescence 2024; 34(2), 571-578.
[16] NH Hussen, AH Hasan, YM FaqiKhedr, A Bogoyavlenskiy, AR Bhat and J Jamalis. Carbon dot based carbon nanoparticles as potent antimicrobial, antiviral, and anticancer agents. ACS Omega 2024; 9(9), 9849-9864.
[17] VK Pandey, A Tripathi, A Taufeeq, AH Dar, AV Samrot, S Rustagi, S Malik, T Bhattacharya, AM Shaikh and B Kovács. Significance and applications of carbon dots in anti cancerous nanodrug conjugate development: A review. Applied Surface Science Advances 2024; 19, 100550.
[18] S Sharma, R Kumar, K Kumar and N Thakur. Sustainable applications of biowaste-derived carbon dots in eco-friendly technological advancements: A review. Materials Science and Engineering: B 2024; 305, 117414.
[19] P Singh, V Bhankar, S Kumar and K Kumar. Biomass-derived carbon dots as significant biological tools in the medicinal field: A review. Advances in Colloid and Interface Science 2024; 328, 103182.
[20] L Zhai, XM Ren and Q Xu. Carbogenic π-conjugated domains as the origin of afterglow emissions in carbon dot-based organic composite films. Materials Chemistry Frontiers 2021; 5(11), 4272-4279.
[21] B Wang, GIN Waterhouse, B Yang and S Lu. Advances in shell and core engineering of carbonized polymer dots for enhanced applications. Accounts of Chemical Research 2024; 57(19), 2928-2939.
[22] L Wang, C Gu, L Wu, W Tan, Z Shang, Y Tian and J Ma. Recent advances in carbon dots for electrochemical sensing and biosensing: A systematic review. Microchemical Journal 2024; 207, 111687.
[23] S Darinel, T Landa, N Kumar, R Bogireddy, I Kaur and V Batra. Heavy metal ion detection using green precursor derived carbon dots. iScience 2022; 25(2), 103816.
[24] RB González-González, MB Morales-Murillo, MA Martínez-Prado, EM Melchor-Martínez, I Ahmed, M Bilal, R Parra-Saldívar and HMN Iqbal. Carbon dots-based nanomaterials for fluorescent sensing of toxic elements in environmental samples: Strategies for enhanced performance. Chemosphere 2022; 300, 134515.
[25] W Zhong and J Yang. Fluorescent carbon quantum dots for heavy metal sensing. Science of the Total Environment 2024; 957, 177473.
[26] A Priyadharshini and AA Napoleon. Metal and heteroatoms co-doped fluorescent carbon dots for highly selective and sensitive detection of Mg2+ ions in aqueous media: Applications in test strips, pharmaceutical, real samples and bioimaging. Spectrochimica Acta Part A: Molecular and Biomolecular Spectroscopy 2025; 332, 125851.
[27] A Ahlawat, TK Dhiman, PR Solanki and PS Rana. Facile synthesis of carbon dots via pyrolysis and their application in photocatalytic degradation of rhodamine B (RhB). Environmental Science and Pollution Research 2024; 31(34), 46752-46759.
[28] L Gan, Q Su, Z Chen and X Yang. Exploration of pH-responsive carbon dots for detecting nitrite and ascorbic acid. Applied Surface Science 2020; 530, 147269.
[29] C Wu, S Zhang, M Liu and J He. One-step solvothermal synthesis of nitrogen-doped carbon dots with efficient red emission from conjugated perylene for multiple applications. Carbon 2024; 230, 119601.
[30] Y Liu, H Yang, T Huang, L Niu and S Liu. Recent advances of biomass-derived carbon dots with room temperature phosphorescence characteristics. Nano Today 2024; 56, 102257.
[31] N Wang, K Liu, Z Hou, Z Zhao, H Li and X Gao. The comparative techno-economic and life cycle assessment for multi-product biorefinery based on microwave and conventional hydrothermal biomass pretreatment. Journal of Cleaner Production 2024; 474, 143562.
[32] ÇK Kurukavak, M Tok, M Yurdakul and M Kuş. Dual- and triple- hetero-atom-doped carbon dots as novel additives for the engineering of defects passivation to boost performance of perovskite solar cells. Journal of Materials Science: Materials in Electronics 2025; 36(8), 485.
[33] A Saravanan, P Das, M Maruthapandi, S Aryal, S Michaeli, Y Mastai, JHT Luong and A Gedanken. Heteroatom co-doping (N, NS, NB) on carbon dots and their antibacterial and antioxidant properties. Surfaces and Interfaces 2024; 46, 103857.
[34] J Qi, P Zhang, T Zhang, R Zhang, Q Zhang, J Wang, M Zong, Y Gong, X Liu, X Wu and B Li. Metal-doped carbon dots for biomedical applications: From design to implementation. Heliyon 2024; 10(11), e32133.
[35] J Hu, M Su, H Yuan, C Jing, B Li and B Wang. Fluorescent responsive film based on nitrogen-doped carbon quantum dots embedded in mesoporous silica for visual detection of Cr(VI). Journal of Environmental Chemical Engineering 2025; 13(2), 115656.
[36] CS Ni, WJ Zhang, WZ Bi, MX Wu, SX Feng, XL Chen and LB Qu. Facile synthesis of N-doped graphene quantum dots as a fluorescent sensor for Cr(VI) and folic acid detection. RSC Advances 2024; 14(36), 26667-26673.
[37] Y Chen, Z Wang, M Liang, Y Liu, W Dong, Q Hu, C Dong and X Gong. High-efficient nickel-doped lignin carbon dots as a fluorescent and smartphone-assisted sensing platform for sequential detection of Cr(VI) and ascorbic acid. International Journal of Biological Macromolecules 2024; 274(P2), 133790.
[38] Y Wang, X Hu, W Li, X Huang, Z Li, W Zhang, X Zhang, X Zou and J Shi. Preparation of boron nitrogen co-doped carbon quantum dots for rapid detection of Cr(VI). Spectrochimica Acta Part A: Molecular and Biomolecular Spectroscopy 2020; 243, 118807.
[39] SA Mathew, P Praveena, S Dhanavel, R Manikandan, S Senthilkumar and A Stephen. Luminescent chitosan/carbon dots as an effective nano-drug carrier for neurodegenerative diseases. RSC Advances 2020; 10(41), 24386-24396.
[40] RB González-González, LT González, M Madou, C Leyva-Porras, SO Martinez-Chapa and A Mendoza. Synthesis, purification, and characterization of carbon dots from non-activated and activated pyrolytic carbon black. Nanomaterials 2022; 12(3), 298.
[41] Y Feng, R Li, P Zhou and C Duan. Non-toxic carbon dots fluorescence sensor based on chitosan for sensitive and selective detection of Cr(VI) in water. Microchemical Journal 2022; 180, 107627.
[42] H Kaur, K Garg, A Gupta, S Chakroborty, TJ Jose, IA Darwish and SK Shukla. One-Pot synthesis of waste poly (Vinyl-Chloride) derived carbon dots for antimicrobial applications. Journal of Molecular Liquids 2025; 417, 126540.
[43] J Goswami, SS Rohman, AK Guha, P Basyach, K Sonowal, SP Borah, L Saikia and P Hazarika. Phosphoric acid assisted synthesis of fluorescent carbon dots from waste biomass for detection of Cr(VI) in aqueous media. Materials Chemistry and Physics 2022; 286, 126133.
[44] YF Li, X Zhang, Q Lu, JZ Cao, S Gao, QZ Liu, XX Cai and H Zhao. Cellulose-based yellow-green emitting carbon dots with large Stokes shift as effective ‘turn off-on’ fluorescence platforms for Cr(VI) and AA dual efficacy detection. Analytica Chimica Acta 2024; 1324, 343102.
[45] AM Mahmoud, MH Mahnashi, AA Fatease, MAH Mostafa, MM El-Wekil and R Ali. Fluorometric and electrochemical dual-mode detection of toxic flavonoid rutin based on new nitrogen and sulfur co-doped carbon dots: Enhanced selectivity based on masking the interfering flavonoids with BSA complexation. Journal of Food Composition and Analysis 2022; 108, 104428.
[46] M Medhi, M Yumnam, P Mudoi and P Mishra. Green fluorescent carbon dots synthesized from various household green wastes for detection of parathion methyl pesticide. Journal of Luminescence 2025; 277, 120926.
[47] P Cui and Y Xue. The role of center-N-doping in non-radiative recombination loss of nitrogen-doped graphene quantum dots. Materials Science in Semiconductor Processing 2022; 139, 106323.
[48] C Long, Z Jiang, J Shangguan, T Qing, P Zhang and B Feng. Applications of carbon dots in environmental pollution control: A review. Chemical Engineering Journal 2021; 406, 126848.
[49] YL Tian, YY Ji, X Zou, QM Chen, SL Zhang and ZJ Gong. N, P co-doped carbon dots as multifunctional fluorescence nano-sensor for sensitive and selective detection of Cr(VI) and ascorbic acid. Journal of Analysis and Testing 2022; 6(3), 335-345.
[50] J Yu, R Kalimuthu, X Liu, W Zhang, Y Tan, K Yan, S Ye and J Feng. Unveiling the quenching mechanism of metal ions using solvent-driven N, S-doped carbon quantum dots. Optical Materials 2025; 162, 116948.
[51] L Wu, W Pan, H Ye, N Liang and L Zhao. Sensitive fluorescence detection for hydrogen peroxide and glucose using biomass carbon dots: Dual-quenching mechanism insight. Colloids and Surfaces A: Physicochemical and Engineering Aspects 2022; 638, 128330.
[52] SH Elagamy, RH Obaydo, A Barseem and H Lotfy. Dual emissive carbon dots as ratiometric fluorescence sensors: A comprehensive review. Sensing and Bio-Sensing Research 2025; 50, 100930.
[53] S Liu, Y Zhang, Y Zhang, J Zhang, R Tian and L Zhao. Visual fluorescence detection kit for Cr(VI) based on biological matrix-derived carbon dots and assisted for AA. Diamond and Related Materials 2024; 148, 111382.
[54] KF Kayani, SJ Mohammed, D Ghafoor, MK Rahim and HR Ahmed. Carbon dot as fluorescence sensor for glutathione in human serum samples: A review. Material Advances 2024; 5(11), 4618-4633.
[55] Z Zhang, Y Liu, Y Lin, J Zhang and C Zheng. Inner filter effect-based sensing platforms: Strategies to enhance anti-interference capability and sensitivity for on-site analysis. Trends in Analytical Chemistry 2026; 195, 118552.
[56] H Chen, D Li, Y Zheng, K Wang, X Zhang, S Zhou, S Wei, F Yong, J Nie, H Wen, J Wu, W Xue and S Huang. Metal-free carbon-dots nanozyme with oxidase-like activity as photocatalysts for highly efficient detection/reduction of Cr(VI) and antibacterial application. Separation and Purification Technology 2025; 356, 129852.
[57] T Long, H Luo, H Li, J Sun, Y Wang, J Zhou, Y Chen and D Xu. Fe-doping green fluorescent carbon dots via co-electrolysis of chrysoidine G and potassium ferrocyanide for sensitive Cr(VI) detection. Spectrochimica Acta Part A: Molecular and Biomolecular Spectroscopy 2024; 311, 124010.
[58] Y Tian and Y Yue. Phosphor doped carbon dots with high photoluminescence and stability towards pH and Cr(VI) sensors. Microchemical Journal 2024; 207, 112046.
[59] X Hao, X Zhang, J Wang, C Liu, C Li and P Yang. Carbon dots with high brightness and stability towards efficient Cr(VI) and l-arginine sensors. Microchemical Journal 2024; 207, 112092.
[60] R Newar, N Sultana, S Das, B Gogoi, NF Islam, H Sarma and A Baruah. Development of FRET-based optical sensors using N-doped carbon dots for detection of chromium (VI) and manganese (VII) in water for a sustainable future. Journal of Environmental Chemical Engineering 2024; 12(1), 111721.