Trends
Sci.
2026;
23(10):
13079
Comparative study of Sugarcane Bagasse Pyrolysis Methods on Phosphate Ion Adsorption Efficiency: Optimization with BBD-RSM
Nabila Eka Yuningsih, Suprapto Suprapto and Yatim Lailun Ni’mah*
Department of Chemistry, Faculty of Science and Data Analytics, Institut Teknologi Sepuluh Nopember,
Jl. Arif Rahman Hakim, Kampus ITS Keputih-Sukolilo, Surabaya 60111, Indonesia
(*Corresponding author’s e-mail: [email protected])
Received: 18 December 2025, Revised: 25 January 2026, Accepted: 10 February 2026, Published: 20 April 2026
Abstract
Utilization of sugarcane bagasse waste as an adsorbent because it has a high silica content, is environmentally friendly, and has a high surface area. Sugarcane bagasse is used as an adsorbent with oxygen pyrolysis (SB@PO) and N2 (SB@PN) methods, both of which are applied to reduce phosphate waste in water. The adsorption method was chosen to reduce phosphate levels in wastewater. Adsorption parameters include adsorbent mass, contact time, and initial concentration of phosphate solution. Response Surface Methodology (RSM) and Box-Behnken design (BBD) methods are used to optimize the process. Phosphate levels are measured using Differential Pulse Voltammetry (DPV). The characterizations carried out include: FTIR, XRD, FESEM-EDX, and N2 adsorption-desorption. SB@PO obtained material with a crystalline structure and rich in silica while SB@PN obtained material rich in carbon and amorphous structure. The adsorption optimization results showed that SB@PO was superior to SB@PN, namely the percentage removal and adsorption capacity were 95.97% and 43.48 mg/g for SB@PO, while SB@PN was optimal with the percentage removal and adsorption capacity of 65.75% and 2.2×10⁻⁴ mg/g, respectively.
Keywords: Adsorption, Waste, Sugarcane bagasse, Phosphate, Pyrolysis, Differential Pulse Voltammetry (DPV), Response Surface Methodology (RSM)
Introduction
Sugarcane bagasse is an organic and environmentally friendly waste, but its combustion can be harmful to human health and cause air pollution. Bagasse is obtained from the processing of sugarcane into sugar. Recycled bagasse is usually used as a raw material for making fertilizer [1], electrodes [2], and adsorbents [3]. Sugarcane bagasse contains cellulose (33.5%); hemicellulose (43.6%); silica (9.35%), and lignin [4]. Based on Sarkar et al. [5], it shows that sugarcane bagasse contains SiO2 (50% - 97%), CaO (1% - 2%), Fe2O3 (3% - 4%), MgO (0.5% - 1%), and K2O (4.2% - 4.4%). Due to its high content, bagasse is processed into products with high sales value, abundant availability, affordability, and environmental friendliness. Bagasse has a high surface area and adsorption capacity. These properties make it suitable for use as an adsorbent [4].
The processing of sugarcane bagasse into adsorbents has been studied, among others, as biochar [6], silica [7], activated carbon [4], composites [2], and coagulants [8]. The processing of sugarcane bagasse into biochar by pyrolysis method was chosen because it can decompose organic materials using high temperatures without oxygen and with little oxygen. Sugarcane bagasse was pyrolyzed with variations in N2 and oxygen atmospheres to obtain adsorbents with different characteristics, where when pyrolysis using N2 atmosphere obtained carbon while oxygen pyrolysis obtained higher silica [9,10]. Thus, in this study, sugarcane bagasse was used as an adsorbent for phosphate adsorption with variations in oxygen and N2 atmospheric pyrolysis methods to obtain higher silica (SB@PO) and carbon (SB@PN) materials.
Phosphate is a hazardous waste and a major chemical species in the agricultural world, especially in fertilizer production. Fertilizers containing phosphate include: NPK fertilizer, TSP fertilizer, MKP (Mono Potassium Phosphate) fertilizer, SP-36 fertilizer. The need for phosphate fertilizer in Indonesia is increasing and has an impact on the amount of phosphate contaminant waste. In addition, the importance of formulating phosphate fertilizer application on agricultural land so that fertilizer is optimally absorbed by the soil [11]. Excessive application of phosphate fertilizers results in fertilizers not being absorbed with high concentrations flowing from agricultural land to the water system, which causes eutrophication that can kill other organisms [12]. Therefore, processing is carried out to remove high concentrations of phosphate content (M) that are not absorbed in water bodies with 3R (Reduce, Reuse, and Recycle), namely reducing the amount of waste by reducing phosphate fertilizer consumption, reusing excess phosphate fertilizer that can still be used, and reducing the amount of waste disposed of in landfills (TPA).
Several methods have been used to remove phosphate, including biologically coupled induced crystallization [13], adsorption [14,15], sedimentation [16], and electrocoagulation [17]. The adsorption method was chosen because it is simple, low-cost, and more effective at reducing phosphate levels.
Adsorption process parameters include contact time, adsorbent mass, and initial solution concentration [18]. Optimizing phosphate adsorption parameters using the classical approach is inefficient. Besides being time-consuming and labor-intensive, the classical approach also requires a large amount of chemicals [19]. The solution is to use a non-classical approach or experimental design, namely Response Surface Methodology (RSM) with a Box-Behnken design. Experimental design is used to obtain optimum conditions with a small number of trials (runs), thus requiring fewer chemicals and being economical. The Box-Behnken design is the input of the experimental design, which uses 3 levels: The lowest value (−1), the middle value (0), and the highest value (+1) [20]. The Response Surface Methodology (RSM) is the output of the experimental design, which produces the optimum area of interaction or combination of factors and levels used [21].
Concentration measurement during adsorption using the voltammetric method, namely Differential Pulse Voltammetry (DPV), has advantages in the phosphate measurement process, such as the absence of additional complexing agents, high sensitivity and selectivity. Therefore, in this study, phosphate adsorption measurements were conducted using Differential Pulse Voltammetry (DPV) with graphite as the working electrode, Pt as the auxiliary electrode, and Ag/AgCl as the reference electrode [22].
The novelty of this research lies in the measurement of phosphate ion concentration using the differential pulse voltammetry (DPV) method, because in general the determination of phosphate levels using a UV-Vis Spectrophotometer [23] and the use of DPV has been widely used to determine heavy metal levels [22], but no one has done it for determining phosphate levels. Based on the background description above, this study aims to determine the optimization parameters that influence phosphate adsorption with SB@PO and SB@PN from sugarcane bagasse. The phosphate adsorption process uses a Box-Behnken design (BBD) to determine the optimum conditions for the adsorption process, with the output being a surface response curve between the influencing factors.
Materials and methods
We collected sugarcane bagasse from sugarcane juice vendors. The chemical reagents used in this study included acids, such as 65% nitric acid (HNO3) from MercK, potassium dihydrogen phosphate (KH2PO4) from MercK, and phosphate standard solution (SRM from NIST) from Supelco®, [K3Fe(CN)6], and distilled water was used as the solvent in each solution.
Sugarcane bagasse waste was pyrolyzed under oxygen and N2 atmosphere to produce SB@PO (oxygen) and SB@PN (nitrogen), which were used as adsorbents for phosphate adsorption. TGA, FTIR, XRD, and FESEM-EDX characterization were performed to determine the characteristics of SB@PO and SB@PN. Phosphate adsorption optimization was carried out using non-classical BBD and RSM approaches, followed by isothermal and kinetic studies. Phosphate adsorption concentration was measured using the differential pulse voltammetry (DPV) method.
Synthesis SB@PO and SB@PN from sugarcane bagasse
The initial stage involved washing and drying the bagasse obtained from sugarcane juice sellers. After drying, the bagasse was ground into powder with a particle size of < 100 mesh. The bagasse powder was pyrolyzed with vaccum furnace tube in an N2 atmosphere at 400 °C for 6 h for SB@PN and in an oxygen atmosphere at 500 °C for 7.5 h for SB@PO with furnace. Each pyrolysis process with N2 and oxygen atmosphere with a heating rate of 10 °C/min. After pyrolysis, SB@PO was pretreated at a 15 min washing process with 65% HNO3 solution under constant stirring at room temperature (25 °C and 1 atm) to remove carbon and other impurities [24].
Characterization
Bagasse powder was first characterized by TGA with oxygen and nitrogen atmospheres to determine the decomposition time of the material. SB@PO and SB@PN were characterized by XRD, FTIR, FESEM-EDX, and N2 adsorption-desorption to analyze the diffraction pattern, functional groups, shape, and surface morphology, and surface area of SB@PO and SB@PN. The results of phosphate adsorption optimization with SB@PO and SB@PN were characterized by FTIR to determine the functional groups present before and after adsorption. Differential Pulse Voltammetry (DPV) was used to determine the performance of phosphate adsorption.
Phosphate ion adsorption
The adsorption of phosphate ions on SB@PO was optimized using parameters including contact time of 5, 15, and 30 min, adsorbent mass of 0.015, 0.02, and 0.025 g, and initial concentration of 1.2; 1.4; and 1.6 M in 25 mL of KH2PO4 solution. while on SB@PN with parameters including contact time of 30, 60, and 90 min, adsorbent mass of 0.05, 0.15, and 0.25 g, and initial concentration of 0.6; 0.8; and 1 M in 25 mL of KH2PO4 solution. Illustrate for adsorption of phosphate process shown in Figure 1. The removal percentage was calculated using Eq. (1).

where
 and
and
 are the initial and equilibrium KH2PO4
concentrations
(M), respectively. The initial (
)
and the equilibrium (
)
concentrations can be determined using a calibration curve of the
KH2PO4
standard solution.
are the initial and equilibrium KH2PO4
concentrations
(M), respectively. The initial (
)
and the equilibrium (
)
concentrations can be determined using a calibration curve of the
KH2PO4
standard solution.
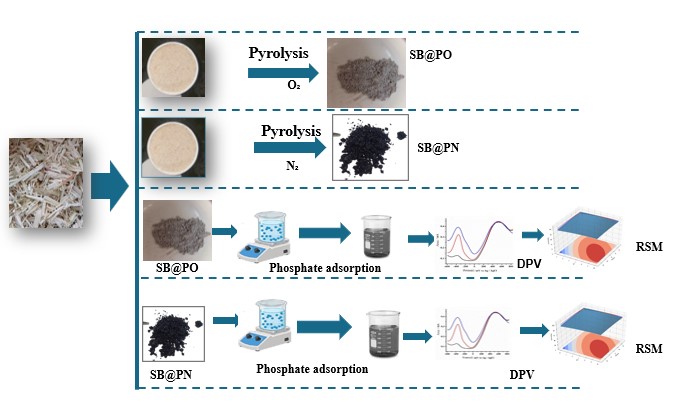
Figure 1 Illustrate for adsorption of phosphate process.
Experimental design for optimization
Response
Surface Methodology (RSM) with Box-Behnken Design (BBD) was used to
optimize phosphate ion adsorption. RSM is used to display the output
of the optimization process, while BBD is used to vary the input in
the experimental design. BBD design, regression analysis, and
response surface diagrams were performed using Python software. BBD
requires less experimentation compared to central composite design
(CCD), thereby reducing chemical consumption during the optimization
process. Optimization of phosphate ion adsorption using BBD with 3
factors and 3 levels requires 15 input variations. Three independent
factors, namely adsorbent mass ( ),
contact time (
),
contact time ( )
and initial concentration (
)
and initial concentration ( ),
were examined at high (+1), medium (0) and low (−1) values,
respectively, as summarized in Tables
1
and 2
RSM displays the optimization of factors influencing the phosphate
ion with SB@PO and SB@PN, considering the response (%removal) and
the relationship between response and factors.
),
were examined at high (+1), medium (0) and low (−1) values,
respectively, as summarized in Tables
1
and 2
RSM displays the optimization of factors influencing the phosphate
ion with SB@PO and SB@PN, considering the response (%removal) and
the relationship between response and factors.
Table 1 Box-behnken design for the phosphate ion adsorption with SB@PO.

Table 2 Box-behnken design for the phosphate ion adsorption with SB@PN.

Apparatus and electrochemical test procedure
A 3-electrode configuration was implemented in an electrochemical cell consisting of graphite as the working electrode, Ag/AgCl containing KCl as the reference electrode, and platinum wire (Τ = 1 mm) as the counter electrode. An aqueous solution of potassium ferric/ferrocyanide [Fe(CN)6]3−/4− (5 mM) was prepared from acetate solution (0.1 M) and poured into the electrochemical cell equipped with 3 electrodes. The calibration curve of the potassium dihydrogen phosphate (KH2PO4) solution was tested using differential pulse voltammetry (DPV) from 1,000 to −1,000 mV at a scan rate of 100 mVs−1 and a current input of 20 mA. All electrochemical measurements, including differential pulse voltammetry (DPV), were performed using a computer-controlled potentiostat, an eDAQ model ER466 electrochemical analyzer, and EChem software (ES260) (eDAQ Pty Ltd, Australia).
Study isotherm and kinetics adsorption
The adsorption isotherm test was carried out using the batch equilibrium method. On SB@PO adsorbent by weighing 0.02 g at 20 min in 25 mL of aqueous solution with phosphate concentration. Samples were taken at concentrations of 1, 1.2, 1.4, 1.6 and 1.8 M, respectively. On SB@PN adsorbent by weighing 0.15 g in 25 mL at 66 min in 25 mL of aqueous solution with phosphate concentration. Samples were taken at concentrations of 0.2, 0.4, 0.6, 0.8 and 1 M, respectively. and the concentration of phosphorus in water in the filtrate was measured after filtration. The phosphorus adsorption capacity of SB@PO and SB@PN was calculated, and the adsorption isotherm curves were plotted. The adsorption isotherm equations were fitted.
The adsorption kinetics test was carried out using the batch equilibrium method. In SB@PO adsorbent by weighing 0.02 g in 25 mL of aqueous solution with a phosphate concentration in water of 1.4 M. Samples were taken at 5, 10, 20, 30 and 40 min, respectively. In SB@PN adsorbent by weighing 0.15 g in 25 mL of aqueous solution with a phosphate concentration in water of 0.6 M. Samples were taken at 20, 35, 50, 65 and 80 min, respectively, and the phosphorus concentration in water in the filtrate was measured after filtration. The phosphorus adsorption capacity of SB@PO and SB@PN was calculated, and the adsorption kinetics curve was plotted. The adsorption kinetics equation was fitted.
Models for adsorption capacity, isotherm, and kinetics parameters.

In
the above equation of adsorption capacity:
 is the adsorption amount (mg/g);
is the initial mass concentration of the phosphate (mg/L);
is the adsorption amount (mg/g);
is the initial mass concentration of the phosphate (mg/L);
 is the end mass concentration of the phosphate (mg/L); V is the
volume of the solution (L);
is the end mass concentration of the phosphate (mg/L); V is the
volume of the solution (L);
 is the amount of adsorption substrate added (g);
 is the molecular of phosphate (g·mol−1).
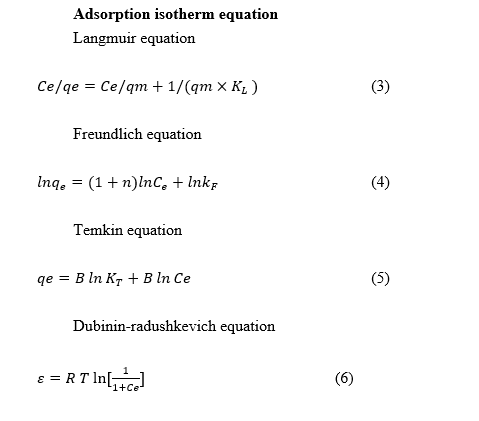
where,
is the adsorption equilibrium solution concentration (mg/L),
 denotes
the adsorption amount (mg/g),
denotes
the adsorption amount (mg/g),
 is the maximum adsorption amount (mg/g), and
 ,
,
 are
the Langmuir, Freundlich, and Temkin’s adsorption constants,
respectively.
Where
are
the Langmuir, Freundlich, and Temkin’s adsorption constants,
respectively.
Where
 is the universal gas constant which is 8.314 J/mol K and
 is the temperature during adsorption (K).
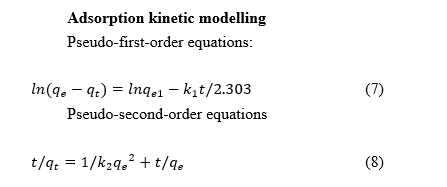
where,
qt is the adsorption amount at time
 (mg/kg);
is the reaction time (s); a,
(mg/kg);
is the reaction time (s); a,
 are the model parameters and
 is the maximum adsorption amount (mg/g).
Results and discussion
Characterization
The physical appearance of Sugarcane Bagasse Pyrolysis Oxygen (SB@PO) and Sugarcane Bagasse Pyrolysis Nitrogen (SB@PN) is shown in Figure 2. Initially, the sugarcane bagasse powder looks like a light brown powder. Because sugarcane bagasse contains lignin, it makes the bagasse powder light brown. Lignin itself is a major component in plant cells that has a complex chemical structure and contains aromatic groups. When lignin is exposed to light, especially UV light, the light energy breaks the chemical bonds in lignin and produces free radicals that cause the lignin photodegradation process, thus giving plants a light brown color. After oxygen pyrolysis and HNO3 pretreatment, the color changes to ash white, indicating conversion to SB@PO, ash white due to the oxidation and decomposition of organic compounds such as cellulose, hemicellulose, and lignin, leaving behind an inorganic residue rich in silica (SiO2). Pyrolysis in an oxygen atmosphere removes other components such as carbon, hydrogen, and oxygen. After nitrogen pyrolysis, the color changes to black powder, indicating conversion to SB@PN. Organic components in bagasse, such as cellulose, hemicellulose, and lignin, decompose into carbon and other gaseous compounds such as CO, CO2, and H2O. The resulting carbon cannot burn in the absence of oxygen and remains stable, remaining in solid form and giving it a black color. The decomposition of organic compounds causes this color change during the pyrolysis process, which produces ash white material rich in silica (SB@PO) and black material rich in carbon (SB@PN) [25].
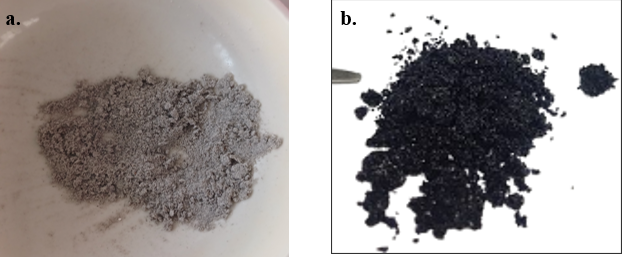
Figure 2 (a) SB@PO and (b) SB@PN are the results of pyrolysis of sugarcane bagasse.
Thermogravimetric analysis (TGA)
The sugarcane bagasse powder material was characterized by TGA (TG/DTA Hitachi STA7300, Germany) to determine the temperature and time of decomposition. In this case, TGA was determined using N2 (SB@PN) and oxygen (SB@PO) atmospheres. The characterization results are shown in Figure 3 TGA and DTA of SB@PO and SB@PN. Based on Figure 3 shows the decomposition temperature of SB@PO and SB@PN materials. The first decomposition at a temperature of 100 - 200 °C. This indicates that at this temperature, decomposition of water and hemicellulose occurs. Figure 3 shows that water decomposes at a temperature of 100 °C and hemicellulose decomposes at a temperature of 200 °C, which begins to decompose and releases volatile gases with %TG of 15%. At a temperature of 350 °C, SB@PO decomposes faster than SB@PN and shows the decomposition of cellulose and lignin with %TG of 65%. In SB@PN, the material only decomposes by 80% and leaves carbon residue because in the pyrolysis process with nitrogen atmosphere there is no oxygen available to oxidize carbon to CO2, leaving a carbon residue with a stable thermal structure and not easily decomposed at high temperatures up to 1,000 °C. In the N2 pyrolysis process, amorphous carbon is obtained [26]. While in SB@PO, there is still decomposition at a temperature of 480 °C, which shows the decomposition of lignin and organic compounds. So, based on the TGA characterization for the SB@PN pyrolysis method using a temperature of 400 °C for 6 h, SB@PO using a temperature of 500 °C for 7.5 h [10].
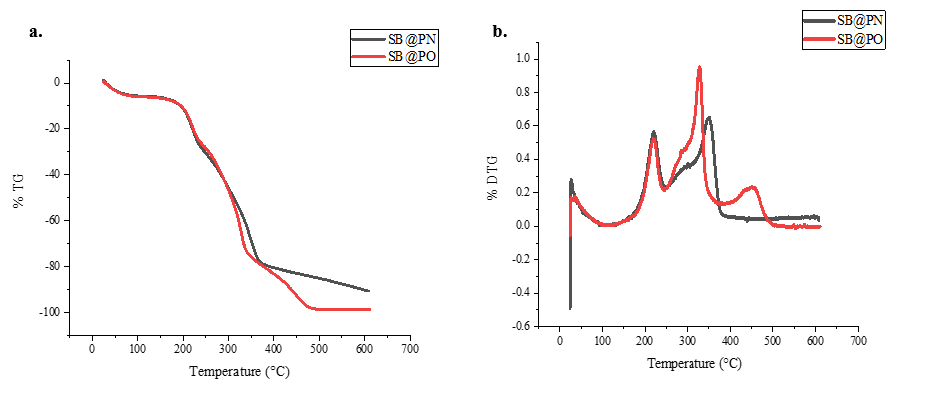
Figure 3 Thermogram of sugarcane bagasse; (a) TGA and (b) DTG of SB@PO and SB@PN from sugarcane bagasse.
According to research conducted by Torres et al. [27], at pyrolysis temperatures in an N2 atmosphere, the carbon content increases with increasing temperature associated with the decomposition process of organic components such as cellulose, hemicellulose and lignin and other gases will decompose faster with increasing temperature to a certain point thereby increasing carbon content. This contrasts with pyrolysis in an oxygen atmosphere, where increasing temperatures cause the carbon to become ash and fly, leaving behind a higher silica content [6].
X-ray Diffractogram (XRD)
Sugarcane bagasse that has been pyrolyzed into SB@PO and SB@PN was characterized by XRD (Rigaku) with an angle of 2ϴ 5° - 90°. The results of the XRD characterization are shown in Figure 4. Figure 4(a) shows the diffractogram of SB@PO showing a peak band 2θ in the 20°, 30°, and 38° regions, which indicates cristobalite silica. Meanwhile, Figure 4(b) shows the diffractogram of SB@PN showing a broad peak band 2ϴ in the area between 15°, 22°, 30°, 35°, and 37°, representing amorphous silica cristobalite and carbon because this process does not have oxygen that oxidizes carbon to CO2 by inhibiting the carbon crystallization process by filling t he pores and reducing the mobility of carbon atoms so that the carbon formed cannot form regular crystals [4]. This is in accordance with previous research and data processing using Crystal Impact Match. Based on Figure 4, it shows that SB@PO shows a crystalline peak of silica cristobalite, while SB@PN shows an amorphous peak of carbon and silica cristobalite.
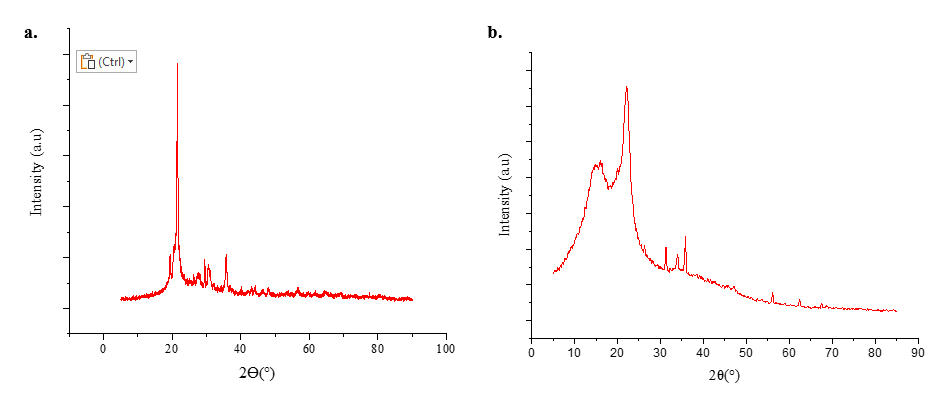
Figure 4 Diffractogram of sugarcane bagasse pyrolysis results (a) SB@PO and (b) SB@PN.
Fourier Transform Infrared (FTIR)
Sugarcane bagasse that has been pyrolyzed into SB@PO and SB@PN was characterized by an ATR-FTIR analyzer (Agilent Cary 630). Analysis of functional groups in SB@PO and SB@PN from bagasse was carried out using FTIR, as shown in Figure 5. Figure 5(a) shows that SB@PO has functional groups in the 1,000 - 1,100 cm−1 region, which is Si-O-Si stretching, and in the 750 cm−1 regions, which is Si-OH Asymmetry so from the figure it is concluded that SB@PO is indicated to contain high silica content. Figure 5(b) shows that SB@PN has functional groups in the 3,225 cm−1 regions, which shows -OH stretching vibrations, peaks in the 1,630 - 1,680 cm−1 region indicate C=O functional groups. In the 1,000 - 1,100 cm−1 regions shows Si-O-Si stretching vibrations. This is in accordance with research conducted by Ni’mah et al. [17]. Based on Figure 5, it can be concluded that SB@PO is indicated to contain high silica, while SB@PN is indicated to contain high carbon and silica.
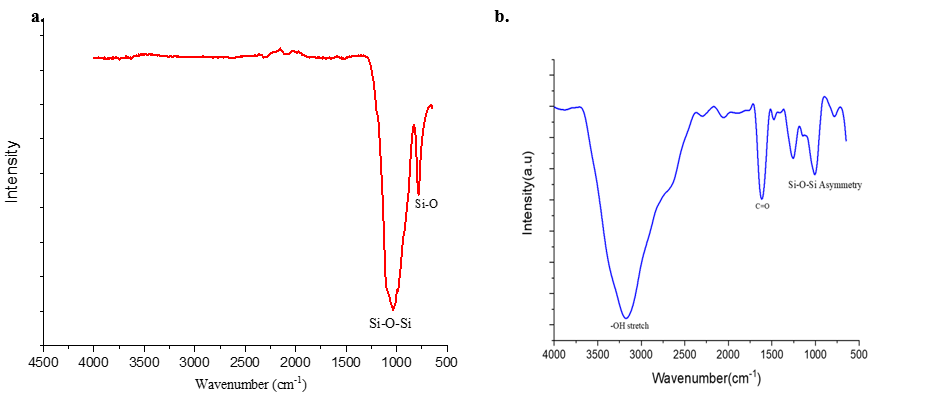
Figure 5 Spectra IR of sugarcane bagasse pyrolysis results (a) SB@PO and (b) SB@PN.
Field Emission Scanning Electron Microscope - Energy Dispersive X-ray Spectroscopy (FESEM-EDX)
The morphology of SB@PO and SB@PN was analyzed using FESEM-EDX (Hitachi Regulus 8220) as shown in Figure 6 for SB@PO and Figure 7 for SB@PN. In Figure 6, the FESEM image of SB@PO from sugarcane bagasse at magnifications of 15k×, 25k×, 50k×, 60k× and 70k× reveals the presence of small, round cavities on the surface, characterized by an irregular surface with a spherical shape. Additionally, the morphology of SB@PO appears irregular because the surface of the material is oxidized to form an irregular structure and make the surface rough and uneven. The oxidation reaction occurs because oxygen reacts with components such as cellulose and lignin to form an irregular structure, exhibiting nanometer-sized particles. This is clarified by EDX in Figure 6 (f and g), showing that SB@PO has the highest element content, namely Si (30.8%) and O (53.5%). This clarifies that SB@PO has a high silica content.
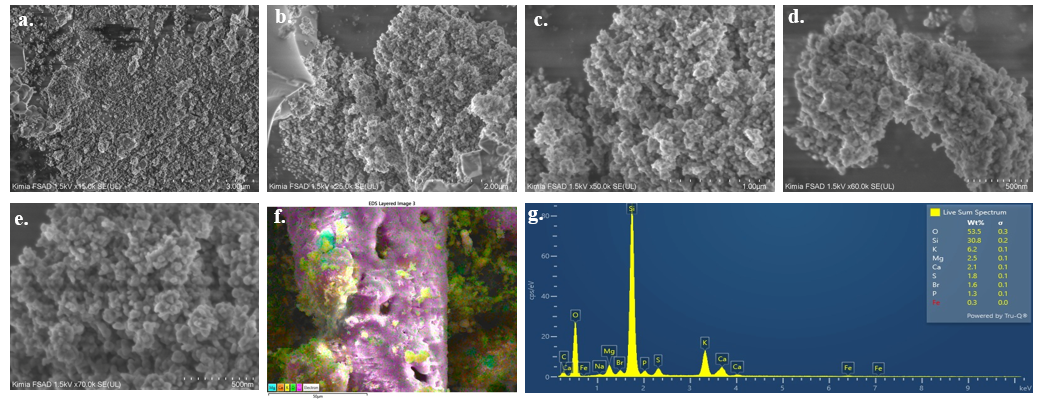
Figure 6 FESEM image with magnification of (a) 15k×, (b) 25k×, (c) 50k×, (d) 60k×, (e) 70kx, (f) and (g) EDX image of SB@PO from sugarcane bagasse.
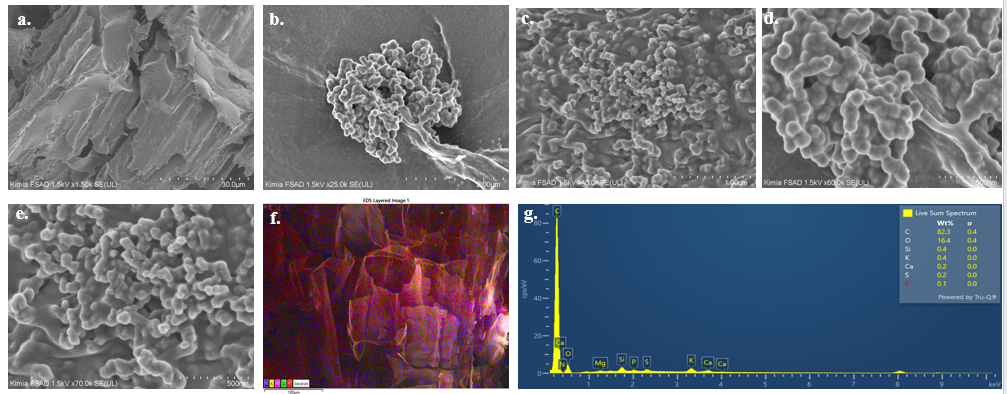
Figure 7 FESEM image with magnification of (a) 1.5k×, (b) 25k×, (c) 40k×, (d) 60k×, (e) 70k×, (f) and (g) EDX image of SB@PN from sugarcane bagasse.
In Figure 7, the FESEM image of SB@PN from sugarcane bagasse at magnifications of 1.5k×, 25k×, 40k×, 60k×, and 70k× shows the presence of small, round cavities on the surface with an irregular surface with a spherical shape. In addition, the morphology of SB@PN also appears irregular and shows nanometer-sized particles. This is clarified by EDX in Figure 6 (f and g) showing that SB@PN has the highest element content, namely C (82.3%), Si (0.4%) and O (16.4%). This clarifies that SB@PN has a high carbon and silica content. The pyrolysis process with nitrogen atmosphere (SB@PN) there is no oxygen gas available to oxidize carbon to CO2, leaving a carbon residue with a stable thermal structure and is not easily decomposed at high temperatures up to 1,000 °C. Thus producing a material with a high carbon contentIn this case, it is in accordance with research by Sarkar et al. [5] where sugarcane bagasse contains SiO, CaO, K2O, and Fe2O3 [28].
Adsorption-desorption N2
The surface area and pore diameter distribution of SB@PO and SB@PN were characterized by N2 adsorption-desorption using the multi-point BET isotherm method. The specific pore surface area is an important parameter in determining the quality of the adsorbent. This is because the pore surface area affects the adsorption capacity of the adsorbent. The larger the pore surface area, the greater the adsorption capacity. Pore size distribution is also a parameter in the characterization study.
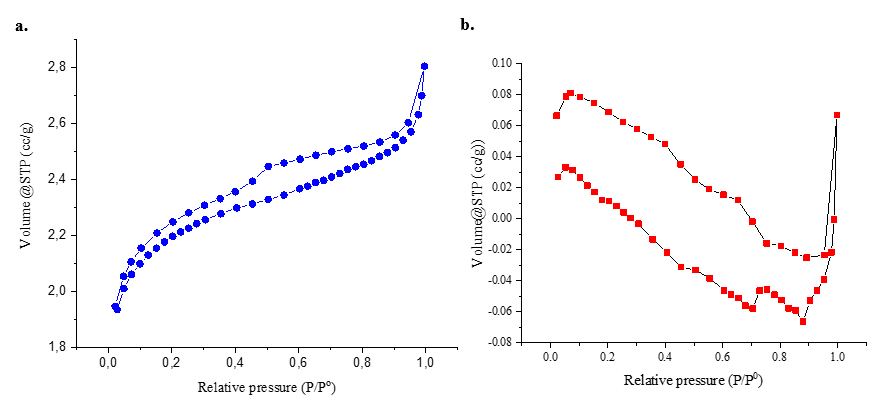
Figure 8 N2 adsorption-desorption isotherm of (a) SB@PO and (b) SB@PN.
Figure 8 shows the adsorption-desorption N2 of SB@PO (Figure 8(a)) and SB@PN (Figure 8(b)), where in SB@PO obtained a specific surface area of 236.971 m2/g with pore radius of 1.92 nm, and an isotherm type IV with a hysteresis loop, which explains that the material is mesoporous, while in SB@PN obtained a specific surface area of 0.139 m2/g with pore radius of 236.05 nm and the isotherm type is not defined. This is due to the large hysteresis loop because the surface conditions of the material change during the adsorption and desorption processes, which is contrary to the assumption of the BET theory, which assumes a fixed surface so that the adsorption and desorption curves do not meet each other, showing differences in behavior when the gas is absorbed and released from the surface of the material [29].
Study adsorption
Calibration curve
Determination of the calibration curve with a concentration of 0.1 to 1M. Each concentration was measured by Differential Pulse Voltammetry (DPV), and the peak current (Ip) was obtained, which was then plotted into a graph to obtain a calibration curve with a correlation coefficient (R2) of 0.9972 where when the R2 value approaches 1 it indicating that there is an accurate and precise linear relationship between the predicted value and the test value. The calibration curve is shown in Figure 9, which is plotted in the Differential Pulse Voltammetry curve (Figure 9(a)) and the graph plot (Figure 9(b)) [30].
|
|
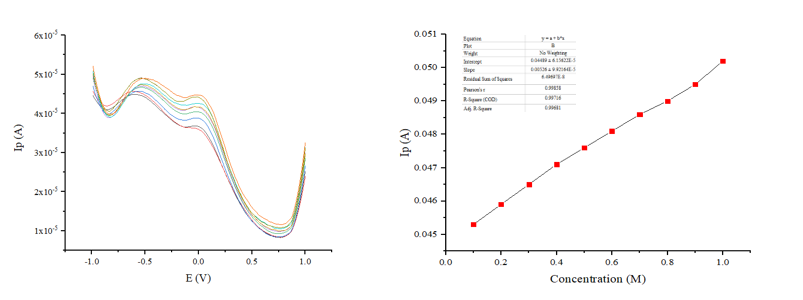
Figure 9 Calibration curve KH2PO4 0.1 to 1 M.
Optimization of phosphate ion adsorption
Box-Behnken
design (BBD) was applied for maximizing phosphate ion removal at
SB@PO and SB@PN, the outcome of which is explained at Table
3
for SB@PO and Table
4
for SB@PN. Of the 15 experiments carried out, BBD optimization was
involved for the perfection of input variables at order to maximize
phosphate ion removal. to relate the experimental input variables
for phosphate ion removal, multiple linear regression was used, like
shown at Eq. (9) for SB@PO and Eq. (10) for SB@PN, Z represents the
predicted response, and
,
,
and
are
the coded values of the input variables.

The data at the percentage removal were statistically analyzed and presented at Table 3 and Table 4. Based on these results, the highest percentage removal of phosphate ion from the adsorption process utilizing SB@PO was achieved under the conditions of an adsorbent mass of 0.02 g, contact time of 20 min, and an initial concentration of 1.4 M, by a phosphate ion removal percentage of 95.97%. Removal of phosphate ion from the adsorption process utilizing SB@PN was achieved under the conditions of an adsorbent mass of 0.15 g, contact time of 66 min, and an initial concentration of 0.6 M, by a phosphate ion removal percentage of 65.73%.
Table 3 Box Behnken experimental design with independent variables for SB@PO.

Table 4 Box Behnken experimental design with independent variables for SB@PN.

The correlation coefficient (R²) of 0.942 is shown at the regression analysis for Eq. (9) for SB@PO and correlation coefficient (R²) of 0.873 is shown at the regression analysis for Eq. (10) for SB@PN among the input variables and the removal of phosphate ion has a strong relationship. To assess the quality of the proposed model, the R² value by a value close for 1 shows higher prediction accuracy. The p-value tests the null hypothesis for obtaining information about the correlation between the response and the independent variable. The significance of the design is indicated by a p-value below 0.05. The p-value (Prob F-static) was 0.0129 at the case of phosphate ion adsorption with SB@PO (See Table S1) and 0.0771 at the case ion phosphate adsorption with SB@PN (See Table S2) showing that the independent variables (adsorbent mass, contact time, and initial solvent concentration) had a significant correlation with the percentage of removal response. The adsorption performance of the SB@PO adsorbent is superior to that of SB@PN. This is because SB@PN has a small surface area and the adsorption optimization process is only able to produce a removal percentage of 65.73%.
The response surface shown as a 3D graph in Figure 10 for SB@PO adsorbent and Figure 11 for SB@PN adsorbent helps understand the relationship between the test factors and phosphate ion removal. This 3D graph is generated by plotting the percentage decrease on the Z-axis against 2 test variables while keeping the other variable constant at level 0. Different color zones can be seen on the contour plot of the 3D graph.
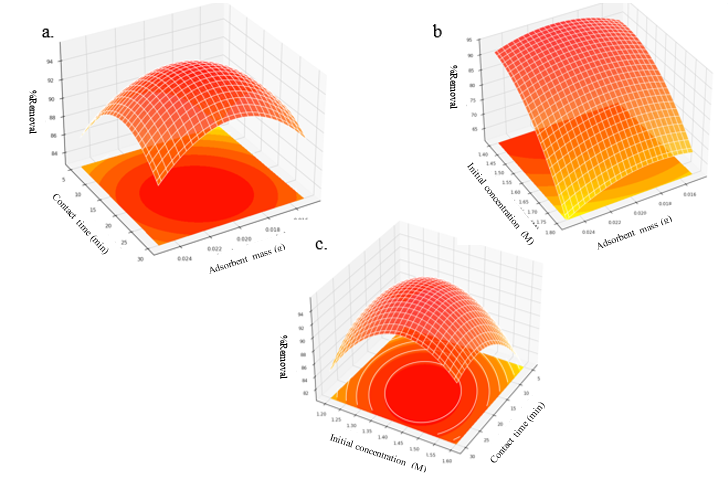
Figure 10 Response Surface (3-D) shows the effect of % removal phosphate adsorption with SB@PO to (a) contact time vs. adsorbent mass, (b) initial concentration vs. adsorbent mass, and (c) initial concentration vs. contact time.
Based on the 3D RSM curve in Figure 10, the optimum conditions for phosphate ion adsorption with SB@PO include an adsorbent mass of 0.02 g, a contact time of 20 min, and an initial concentration of 1.4 M, by a phosphate ion removal percentage of 95.97%. The 3D RSM curve in Figure 11 shows the optimum conditions for phosphate ion adsorption with SB@PN including an adsorbent mass of 0.15 g, a contact time of 66 min, and an initial concentration of 0.6 M, by a phosphate ion removal percentage of 65.73% with error analysis shown in Figure 12 and Table 5 namely MAE (Mean Absolute Error), MSE (Mean Squared Error), RMSE (Root Mean Squared Error), and residual plot analysis. Error analysis studies are conducted to identify model weaknesses, improve models, understand data, and evaluate performance by reducing errors and increasing accuracy so that the model is suitable for use. Based on study, it was shown that SB@PO has a smaller error than SB@PN, where the MAE, MSE, and RMSE values are closet to zero. Based on Figure 12(a), it shows that the residual plot is slightly skewed towards the negative with high and narrow peak so that the drain is normally distributed. Based on Figure 12(b), the residual points appear more symmetrical and closer to the ideal bell shape, with peaks more centered around the 0 value (the mean of the residuals). Based on its visual shape, SB@PO is more normally distributed than SB@PN.
Table 5 Study error analysis adsorption of phosphate with SB@PO and SB@PN adsorbent.

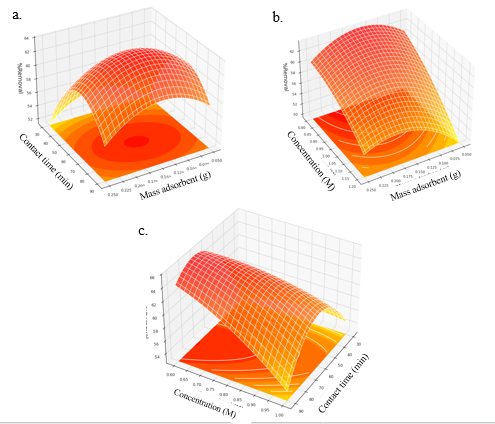
Figure 11 Response Surface (3-D) shows the effect of % removal phosphate adsorption with SB@PN to (a) contact time vs. adsorbent mass, (b) initial concentration vs. adsorbent mass, and (c) initial concentration vs. contact time.
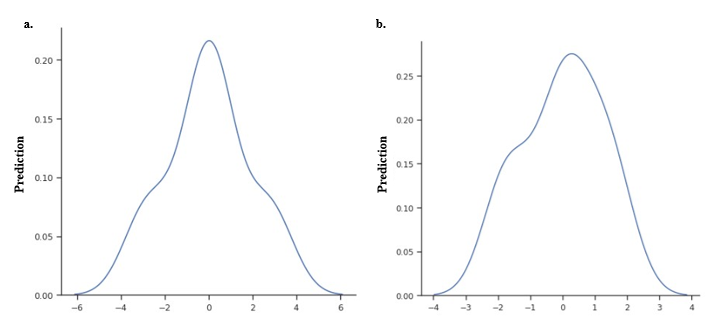
Figure 12 Plot analysis residual; (a) SB@PO and (b) SB@PN.
Adsorption isotherm models of phosphate at SB@PO and SB@PN
Table 6 summarizes the optimal data that was applied to create the adsorption isotherm model. The phosphate adsorption regressions for Langmuir, Freundlich, Temkin, and Dubinin-Radushkevich, for SB@PO and SB@PN adsorbent.
Table 6 Examination of the Freundlich, Temkin, Dubinin-Radushkevich, Langmuir isotherm.

The correlation coefficients for each isotherm design are shown at Table 6 shows that the adsorption with SB@PO data closely matched the Langmuir isotherm model, by the Langmuir isotherm showing the greatest correlation coefficient (R²) at 0.9985. The maximum adsorption power (qm) of the Langmuir was found to be 43.48 mg/g. Adsorption of monolayer adsorption indicated adsorption occurs when adsorbate molecules attach to active sites on the surface of the adsorbent and form a single layer [31]. The adsorption data with SB@PN is in good agreement with the Dubinin-Radushkevich isotherm model which shows the largest correlation coefficient (R²) of 0.9769. The adsorption of porous materials, especially microporous materials, is explained by this model. The multi-layered adsorption properties are indicated by the pore filling mechanism applied to the adsorption process. This was determined using the E < 8 kJ/mol (physisorption) and 8 - 16 kJ/mol (chemisorption) approaches, which obtained (E = 2.236 kJ/mol) so that the adsorption of phosphate with SB@PN occurs by physisorption where adsorption occurs due to Van der Waals forces between the adsorbate molecules and the adsorbent surface [32].
Adsorption kinetics models of phosphate at SB@PO and SB@PN
The
regression coefficient for SB@PO (Figure
13),
namely Langmuir is 0.9985, and the calculated
values for various phosphate concentrations are in good agreement
with the experimental results. The isotherm kinetics is close to
pseudo-second order, namely the correlation coefficient value of
0.9992. This implies that chemisorption is the main mechanism, which
means that the critical step in the adsorption process is the
interaction between phosphate ions and the surface groups of the
adsorbent. Higher initial phosphate concentrations result in an
increase in the adsorption quantity at equilibrium, indicating a
greater mass transfer driving force that allows more phosphate ions
to reach the adsorbent surface quickly [33].
|
|
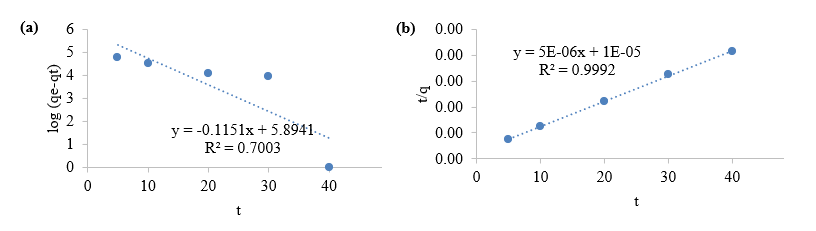
Figure 13 Adsorption kinetics of SB@PO adsorbent (a). pseudo-first-order, (b). pseudo-second-order.
The regression coefficient for SB@PN (Figure 14), namely Dubinin-Radushkevich, is 0.9769. The isotherm kinetics approaches pseudo-first order, namely the correlation coefficient value of 0.624. This implies that physisorption is the main mechanism, which means that the critical stage in the adsorption process is the interaction between phosphate ions and the surface groups of the adsorbent [16].
|
|
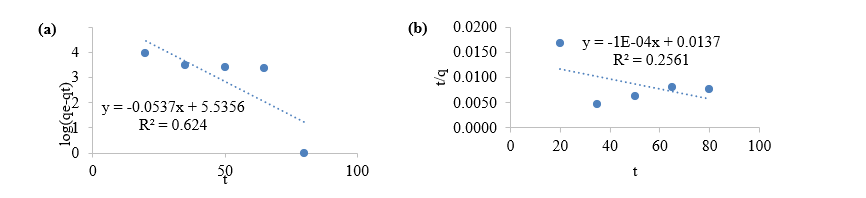
Figure 14 Adsorption kinetics of SB@PN adsorbent; (a) pseudo-first-order and (b) pseudo-second-order.
Comparative study
A comparison was made between the characterization and optimization of phosphate ion adsorption achieved in this study using 2 different adsorbents in the atmosphere in the pyrolysis method, namely SB@PO and SB@PN adsorbents used for phosphate ion adsorption. The comparison of SB@PO and SB@PN derived from sugarcane bagasse used for phosphate ion adsorption is shown in Table 7.
Table 7 Comparative study on phosphate adsorption with SB@PO and SB@PN adsorbent.

Validation method
Validation methods are used to ensure that an analytical method or process is suitable for its intended purpose and is reliable. In validation, several aspects that need to be discussed include accuracy, precision, detection limit, quantification limit, and robustness. Validation is conducted to ensure that the method produces accurate and reliable data. Method validation in this study used a phosphate solution of KH2PO4 and standard reference material (SRM) for phosphate analysis. Validation method to determine the phosphate measurement process using the differential pulse voltammetry (DPV) method. The validation process obtained the results shown in Table 8.
Table 8 Summary of method validation.

Conclusions
This study showed that the pyrolysis process plays a significant role in determining the physicochemical properties and phosphate adsorption performance of the adsorbent derived from sugarcane bagasse. Pyrolysis under O₂ atmosphere produced nanometer size and material content in the form of Si (30.8%) and O (53.5%) with a significantly higher surface area of 236,971 m2/g, resulting in superior phosphate adsorption compared to the carbon-dominated adsorbent obtained under N₂ atmosphere while the characterization of SB@PN showed carbon and amorphous silica, nanometer size and material content in the form of C (82.3%), Si (0.4%) and O (16.4%) with a specific surface area of 0.139 m2/g. Optimization of phosphate adsorption with RSM-BBD showed optimum conditions for SB@PO including adsorbent mass of 0.02 g, a contact time of 21 min, and an initial concentration of 1.4 M with a percentage removal and adsorption capacity of 95.97%, 43.48 mg/g with Langmuir isotherm rate and pseudo-second-order kinetics, while SB@PN was optimum an adsorbent mass of 0.15 g, a contact time of 66 min, and an initial concentration of 0.6 M with a percentage removal and adsorption capacity of 65.75% and 2.2x10⁻⁴ mg/g with Dubinin-Radushkevich isotherm rate and pseudo-first-order kinetics. This study shows that SB@PO shows superior adsorption performance compared to SB@PN.
Acknowledgements
The Institute Teknologi Sepuluh Nopember provided financial assistance for this work under the Doctoral Dissertation Research Program Funding (PDD) project scheme of the Ministry of Research, Technology, and Higher Education (Kemenristekdikti) 2025 No. 1224/PKS/ITS/2025, for which the authors would like to express their gratitude.
Declaration of generative AI in scientific writing
The authors acknowledge the use of generative AI tools (e.g., QuillBot and ChatGPT by OpenAI) in the preparation of this manuscript, specifically for language editing and grammar correction. No content generation or data interpretation was performed by AI. The authors take full responsibility for the content and conclusions of this work.
CRediT author statement
Yatim Lailun Ni’mah: Conceptualization; Methodology; Supervision; Validation. Nabila Eka Yuningsih: Data curation; Writing - Original draft preparation; Reviewing and Editing. Suprapto Suprapto: Visualization; Investigation; Software; Supervision.
References
[1] SM Beyan, SV Prabhu, TT Sissay and AA Getahun. Sugarcane bagasse based activated carbon preparation and its adsorption efficacy on removal of BOD and COD from textile effluents: RSM based modeling, optimization and kinetic aspects. Bioresource Technology Reports 2021; 14, 100664.
[2] AND Nasti. Carbon composite of NiO hydrothermal impregnation from sugarcane bagasse and its electrochemical properties. Jurnal Rekayasa Proses 2023; 17(2), 236-244.
[3] PN Onwuachi-Iheagwara. Bio-adsorbent of Jatropha curcus oil in sugar cane bagasse ash for the synthesis of biodiesel catalyzed by calcined Sartaj maize stalk powder (CSMSP). Case Studies in Chemical and Environmental Engineering 2024; 10, 100879.
[4] F Mohamed. Activated carbon derived from sugarcane and modified with natural zeolite for efficient adsorption of methylene blue dye: Experimentally and theoretically approaches. Scientific Reports 2022; 12(1), 18031.
[5] J Sarkar, D Mridha, J Sarkar, JT Orasugh, B Gangopadhyay, D Chattopadhyay, T Roychowdhury and K Acharya. Synthesis of nanosilica from agricultural wastes and its multifaceted applications: A review. Biocatalysis and Agricultural Biotechnology 2021; 37, 102175.
[6] N Divyangkumar and NL Panwar. Optimizing high performance biochar from sugarcane bagasse and corncob via vacuum pyrolysis. Energy 360 2025; 3, 100014. .
[7] SC Pinheiro, OA Paiva, RDT Filho and GC Cordeiro. Minimizing heterogeneity of sugarcane bagasse ash by silica extraction via sol gel process. Next Materials 2025; 9, 101171.
[8] MB Bahrodin, NS Zaidi, A Kadier, N Hussein, A Syafiuddin and R Boopathy. A novel natural active coagulant agent extracted from the sugarcane bagasse for wastewater treatment. Applied Sciences 2022; 12(16), 7972.
[9] CA Okonkwo, MC Menkiti, IA Obiora-Okafo and ON Ezenwa. Controlled pyrolysis of sugarcane bagasse enhanced mesoporous carbon for improving capacitance of supercapacitor electrode. Biomass Bioenergy 2021; 146, 105996.
[10] NT Miranda, IL Motta, RM Filho and MRW Maciel. Sugarcane bagasse pyrolysis: A review of operating conditions and products properties. Renewable and Sustainable Energy Reviews 2021; 149, 111394.
[11] A Manyatshe, ZED Cele, MO Balogun, TTI Nkambule and TAM Msagati. Chitosan modified sugarcane bagasse biochar for the adsorption of inorganic phosphate ions from aqueous solution. Journal of Environmental Chemical Engineering 2022; 10(5), 108243.
[12] TC Malone and A Newton. The globalization of cultural eutrophication in the coastal ocean: Causes and consequences. Frontiers in Marine Science 2020; 7, 670.
[13] G Xin, X Zhou, P Zuo, W Ma, C Liu and Y Zhao. Enhanced the simultaneous removal and recovery of phosphorus in induced crystallization coupled biological phosphorus removal process. Green Technologies and Sustainability 2024; 2(2), 100088.
[14] W Gong, C Qi, L Huang, Z Tian, Z Huang, C Tao, H Lin, L Guo and Z Yu. Adsorption of phosphorus in wastewater by lanthanum-modified magnetic sewage sludge biochar. Desalination and Water Treatment 2024; 320, 100603.
[15] S Sawasdee and Watcharabundit. Mechanistic insights into adsorption of methylene blue and methyl orange using cassava rhizome activated carbon: Adsorption, characterization and reusability. Trends in Sciences 2025; 22(12), 10751.
[16] Q Wu, J Zhang and S Wang. Preparation and application of modified activated carbon for effective removal of phosphorus from glyphosate by-product salt. Desalination and Water Treatment 2023; 313, 152-161.
[17] YL Ni’mah, S Suprapto, APK Subandi, NE Yuningsih and AC Pertiwi. The optimization of silica gel synthesis from chemical bottle waste using response surface methodology. Arabian Journal of Chemistry 2022; 15(12), 104329.
[18] S Inna, MDD Ornella, B Arthur and K Richard. Phophorus and potassium recovery from cotton shell and sugarcane bagasse ashes. Sustainable Chemistry One World 2025; 5, 100037.
[19] NE Yuningsih. Adsorption of malachite green using activated carbon from mangosteen peel: Optimization using box-Behnken design. Journal of Renewable Materials 2024; 12(5), 981-992.
[20] YL Ni’mah, AC Pertiwi and S Suprapto. Adsorption of Cu(II) on silica gel synthesized from chemical bottle glass waste: Response surface methodology-Box Behnken design optimization. South African Journal of Chemical Engineering 2024; 48, 55-62.
[21] YL Ni’mah, NE Yuningsih and S Suprapto. The adsorption of Pb(II) using silica gel synthesized from chemical bottle waste: Optimization using box-Behnken design. Journal of Renewable Materials 2023; 11(6), 2913-2924.
[22] HA El-Raheem, R Helim, RYA Hassan, AFA Youssef, HK Youssoufi and C Kraiya. Electrochemical methods for the detection of heavy metal ions: From sensors to biosensors. Microchemical Journal 2024; 207, 112086.
[23] D Li. Selective adsorption of phosphate by 2D thin-bladed ZIF-L in phosphate mining wastewater: An investigation of single phosphorus and phosphorus-chromium composite systems. Chemical Engineering Research and Design 2025; 223, 209-219.
[24] GF David. Coupled effect of pyrolysis temperature and HNO3 pretreatment on sugarcane bagasse fast pyrolysis for levoglucosan production. Biomass Bioenergy 2025; 203, 108372.
[25] A Boonmee and K Jarukumjorn. Preparation and characterization of silica nanoparticles from sugarcane bagasse ash for using as a filler in natural rubber composites. Polymer Bulletin 2020; 77(7), 3457-3472.
[26] E Marguí, I Queralt and E De Almeida. X-ray fluorescence spectrometry for environmental analysis: Basic principles, instrumentation, applications and recent trends. Chemosphere 2022; 303, 135006.
[27] SM Torres, VED Lima, PDA Basto, NTDA Júnior and AAM Neto. Assessing the pozzolanic activity of sugarcane bagasse ash using X-ray diffraction. Construction and Building Materials 2020; 264, 120684.
[28] M Yadav, V Dwibedi, S Sharma and N George. Biogenic silica nanoparticles from agro-waste: Properties, mechanism of extraction and applications in environmental sustainability. Journal of Environmental Chemical Engineering 2022; 10(6), 108550.
[29] JSD Jeremias, JY Lin, MLP Dalida and MC Lu. Abatement technologies for copper containing industrial wastewater effluents - A review. Journal of environmental chemical engineering 2023; 11(2), 109336.
[30] YL Ni’mah, S Suprapto, APK Subandi, NE Yuningsih and AC Pertiwi. The optimization of silica gel synthesis from chemical bottle waste using response surface methodology. Arabian Journal of Chemistry 2022; 15(12), 104329.
[31] SS Rawat and A Sharma. Sugarcane bagasse ash - The future composite material: A literature review. Materials Today: Proceedings 2023; 75, 14-22.
[32] B Biswas. Phosphorus adsorption using chemical and metal chloride activated biochars: Isotherms, kinetics and mechanism study. Heliyon 2023; 9(9), e19830.
[33] WY El-Nazer, TE Farrag, MS Beheary and RA Mansour. Biosynthesis, characterization, and utilization of rice husk nanosilica in the adsorption of heavy metals from simulated wastewater. Next Materials 2025; 9, 101219.
Supplementary data
Table S1 OLS regression adsorption of phosphate at SB@PO.
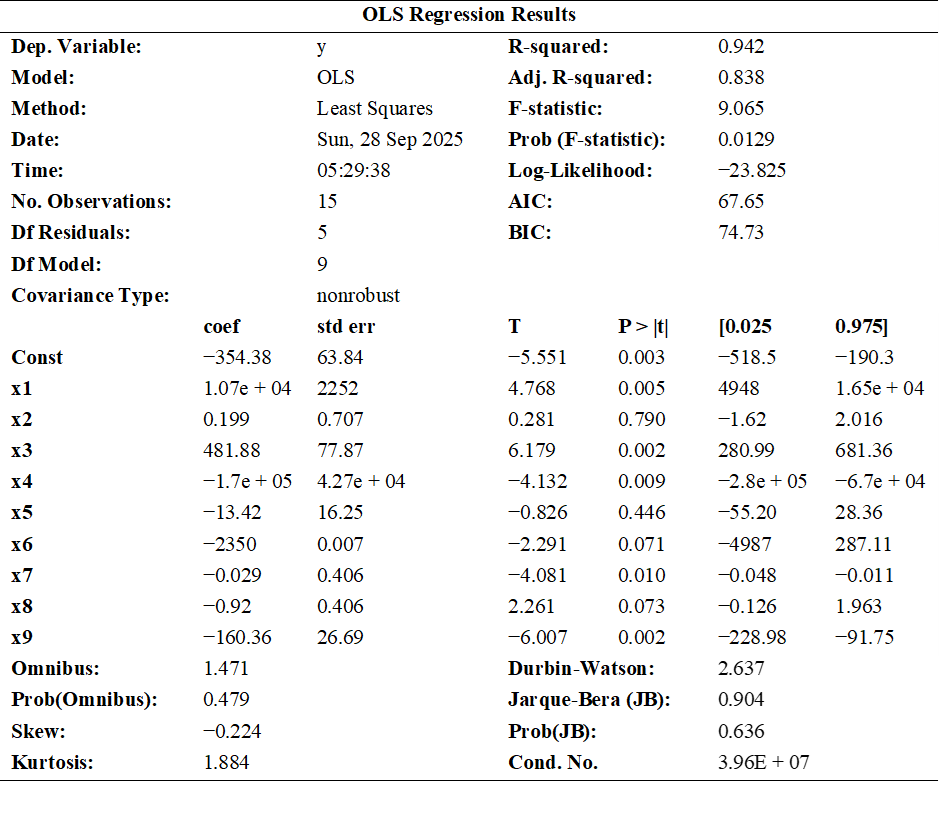
Table S2 OLS regression adsorption of phosphate at SB@PN.