
Trends
Sci.
2026;
23(10):
13446
Tropical Cyclone Contribution to Rainfall in Indonesia’s New Capital City under Seasonal Variability and Madden-Julian Oscillation Modulation
Nadya Rezky Ananda1, Marzuki Marzuki1,*, Helmi Yusnaini 1,
Ravidho Ramadhan1,2 and Mutya Vonnisa1
1Department of Physics, Universitas Andalas, Padang 25163, Indonesia
2Research Institute for Sustainable Humanosphere (RISH), Kyoto University, Kyoto 6110011, Japan
(*Corresponding author’s e-mail: [email protected])
Received: 25 January 2026, Revised: 31 March 2026, Accepted: 7 April 2026, Published: 15 May 2026
Abstract
This study investigates the contribution of tropical cyclone (TC)–induced rainfall (TC rain) and the modulation of the Madden-Julian Oscillation (MJO) on the New Capital City of Indonesia (hereafter called Nusantara City or NC), East Kalimantan. A total of 318 TCs were examined using the International Best Track Archive for Climate Stewardship (IBTrACS) data during 2000 - 2024. Daily rainfall from the IMERG Final Product (IMERG-F) was analyzed using RMM-based MJO phase classification. Rainfall from within 1,100 km of the TC center was considered as TC-induced rainfall. Seasonal analysis indicates that TC rainfall contributes 11% - 12% of total rainfall during JJA and increases markedly to 19% - 23% during September - November (SON). MJO modulation demonstrated that TC dominance intensifies during convective suppression phases over Indonesia: the contribution of TC rain exceeded 20% in Phases 5 - 6 during JJA and surpassed 30% in Phases 6 - 7 during SON. This amplification occurs when the MJO convective center shifts to the Western Pacific, dynamically strengthening the monsoon trough and enhancing the interaction between TCs and regional moisture transport toward Kalimantan. A 25-year linear trend analysis indicated a slight increase in total rainfall and a slight decline in TC rain; however, neither was statistically significant, reflecting the low frequency of cyclones directly affecting Kalimantan. Despite the slight annual trend, the substantial contribution of TC during JJA and SON highlights its crucial role as a short-term trigger of extreme rainfall. These findings emphasize the need for integrating TC-related hydrometeorological hazard functions into regional disaster risk mitigation, particularly during the peak transition season.
Keywords: Rainfall, Tropical cyclones, Madden-julian oscillation, New capital city, Seasonal modulation, Monsoon trough, IMERG, IBTrACS
Introduction
The Indonesian government has decided to relocate the capital from Jakarta to a new location in East Kalimantan, hereafter called Nusantara City (NC; Figure 1). This relocation is expected to help address several challenges faced by Jakarta, including those related to natural disasters. East Kalimantan has a low risk of earthquakes and volcanic eruptions [1], but it still has the potential for disasters caused by extreme weather. This region is situated near the Intertropical Convergence Zone (ITCZ) and is surrounded by the warm, moisture-rich waters of the Maritime Continent,
resulting in a humid tropical climate characterized by high rainfall throughout the year. These conditions are further reinforced by strong land-sea interactions in the Makassar Strait, which functions as a primary corridor for water vapor transport from the Pacific Ocean to eastern Kalimantan. The relatively warm sea surface temperatures (SSTs), together with the influence of the Indonesian Throughflow (ITF), modulate the distribution of latent heat and atmospheric moisture along the East Kalimantan coast. This ocean-atmosphere coupling enhances the regional precipitation response to large-scale atmospheric disturbances [2-4]. Consequently, the potential for hydrometeorological disasters, particularly floods and landslides, remains substantial. Recent studies have indicated an upward trend in flood disasters associated with a roughly 25% increase in the amplitude and frequency of extreme rainfall, particularly across the northern regions of Indonesia, including Kalimantan [5]. In the specific context of NC, Ramadhan et al. [6] reported an elevated risk of flooding and landslides in the surrounding area, consistent with the findings of Marzuki et al. [4]. These hydrometeorological hazards are closely associated with variability in the regional rainfall regime, which is strongly modulated by intraseasonal and interannual climate variability.
Intraseasonal and interannual variability significantly impact the NC region. Unlike Jakarta, which generally exhibits a single dominant rainfall peak during the boreal winter monsoon, NC experiences 2 prominent peaks in annual rainfall [7], occurring in November - December and March - April. In addition to this bimodal rainfall pattern, interannual variability associated with the El Niño-Southern Oscillation (ENSO) strongly modulates seasonal rainfall, particularly during the dry season from August to October [6]. Although this period is climatologically dry, extreme rainfall events can still occur due to the interaction between intraseasonal disturbances and large-scale climate variability. One notable example occurred on 27 - 28 August 2021, when rainfall reaching 82 mm day⁻¹ for more than 11 h triggered widespread flooding and landslides across East Kalimantan, including the NC region [8]. This event was associated with enhanced water vapor transport from Kalimantan Island and the Banda Sea, which was modulated by the Boreal Summer Intraseasonal Oscillation (BSISO) and large-scale variability related to La Niña.
Mechanistically, several modes of large-scale climate variability influence rainfall over the NC region. The BSISO, an intraseasonal mode distinct from the Madden-Julian Oscillation (MJO), exhibits pronounced northward and northeastward propagation across the Indian Ocean and western North Pacific, whereas the MJO primarily propagates eastward along the equator. During boreal summer, the potential overlap between BSISO and MJO signals can strengthen Rossby wave structures in the Northern Hemisphere and generate circulation anomalies that enhance moisture convergence and convective activity over the Maritime Continent [9]. In addition to these intraseasonal processes, interannual variability associated with the ENSO modulates the background state of SSTs and Walker circulation, which in turn influences the strength and propagation of the MJO over the Indo-Pacific region [10]. Through this modulation, ENSO can alter atmospheric moisture transport and rainfall distribution across the Maritime Continent, including Kalimantan. Consistent with this interaction, Ramadhan et al. [11] showed that MJO activity can substantially enhance rainfall over the NC region, particularly during the dry season when the MJO is in phases 2 - 3, which are associated with more intense and longer-duration daily rainfall, thereby increasing the risk of hydrometeorological disasters.
While these large-scale modes of climate variability modulate the background conditions controlling rainfall variability in the NC region, synoptic-scale systems can also play an important role in generating extreme precipitation events. One such system is tropical cyclone (TC) activity in the Western Pacific Ocean. The Western Pacific Ocean is the most active area for TC trajectories affecting Indonesian waters [12]. Although Kalimantan Island is rarely directly traversed by cyclones, these systems can indirectly affect atmospheric conditions through increased humidity, wind convergence, and the strengthening of the northwest monsoon [13-15]. The intensity and spatial distribution of TC-related rainfall can also be modulated by the large-scale climate background discussed earlier. For example, ENSO alters SST patterns and Walker circulation, which can shift TC genesis locations and modify moisture transport pathways across the Maritime Continent [10]. Similarly, the MJO and BSISO can enhance convective activity and atmospheric moisture convergence, thereby creating favorable conditions for intense rainfall events associated with synoptic disturbances [9,11]. Studies in various countries have shown that TCs can contribute a significant percentage to the total rainfall. A study in the Philippines reported that tropical cyclone-induced rainfall accounted for 54.2% of total seasonal precipitation [16], while research in Mexico by Breña-Naranjo et al. [17] found that arid regions such as the Baja California Peninsula received an average TC rain contribution of around 40% of the total annual rainfall. This pattern has also been observed in Australia, with tropical cyclones accounting for 20% - 40% of the total rain along the west coast, increasing to 60% -70% during the peak of the tropical cyclone season [18]. Therefore, measuring the contribution of tropical cyclones to rainfall in the NC is essential, given the high potential for hydrometeorological disasters in this region. The combination of tropical cyclone activity and the MJO phase may explain a significant portion of the variability in extreme rainfall in East Kalimantan. However, most previous studies have focused separately on the ENSO, BSISO, or MJO, and no studies have quantitatively measured the specific contribution of tropical cyclone-induced rainfall in the NC, especially when interacting with the dominant MJO phase.
Addressing this knowledge gap is essential for understanding rainfall extremes and improving disaster preparedness in the NC region. To support the development of NC as a sustainable and disaster-resilient city, it is therefore important to quantify the role of tropical cyclone-induced rainfall in regional precipitation variability. Such an understanding would provide a scientific basis for hydrometeorological risk mitigation and inform the design of adaptive and climate-responsive infrastructure. Accordingly, this study aims to quantify the contribution of tropical cyclone rainfall to total rainfall in the NC region during the 2000 - 2024 period using Integrated Multi-satellite Retrievals for GPM Final Run (IMERG-F) data in combination with cyclone trajectories from the International Best Track Archive for Climate Stewardship (IBTrACS). The study period was selected based on the availability and consistency of the IMERG satellite precipitation dataset. In addition, we examine the spatial and seasonal variability of tropical cyclone rainfall, particularly during June - July - August (JJA) and September - October - November (SON), which correspond to the peak period of tropical cyclone activity influencing the Maritime Continent. Furthermore, this study evaluates the influence of the MJO phase on the contribution of tropical cyclone rainfall in the NC region and considers the broader background conditions associated with ENSO variability. The BSISO is not explicitly analyzed in this study because its signals largely overlap with the boreal summer evolution of the MJO and require more specialized filtering techniques, which are beyond the scope of the present analysis.
Materials and methods
Study area
This research focused on the NC area in East Kalimantan, located between coordinates 0.6 S and 1.2 S, and 116.4 E and 117.4 E. This boundary includes the Core Government Center Area (KIPP) and the entire NC Development Area (Figure 1). The NC is being developed in the Sepaku District (North Penajam Paser Regency) and partly in the Samboja, Loa Kulu, Loa Janan, and Muara Jawa Districts (Kutai Kartanegara Regency), covering an area of approximately 324,332 hectares [19,20].
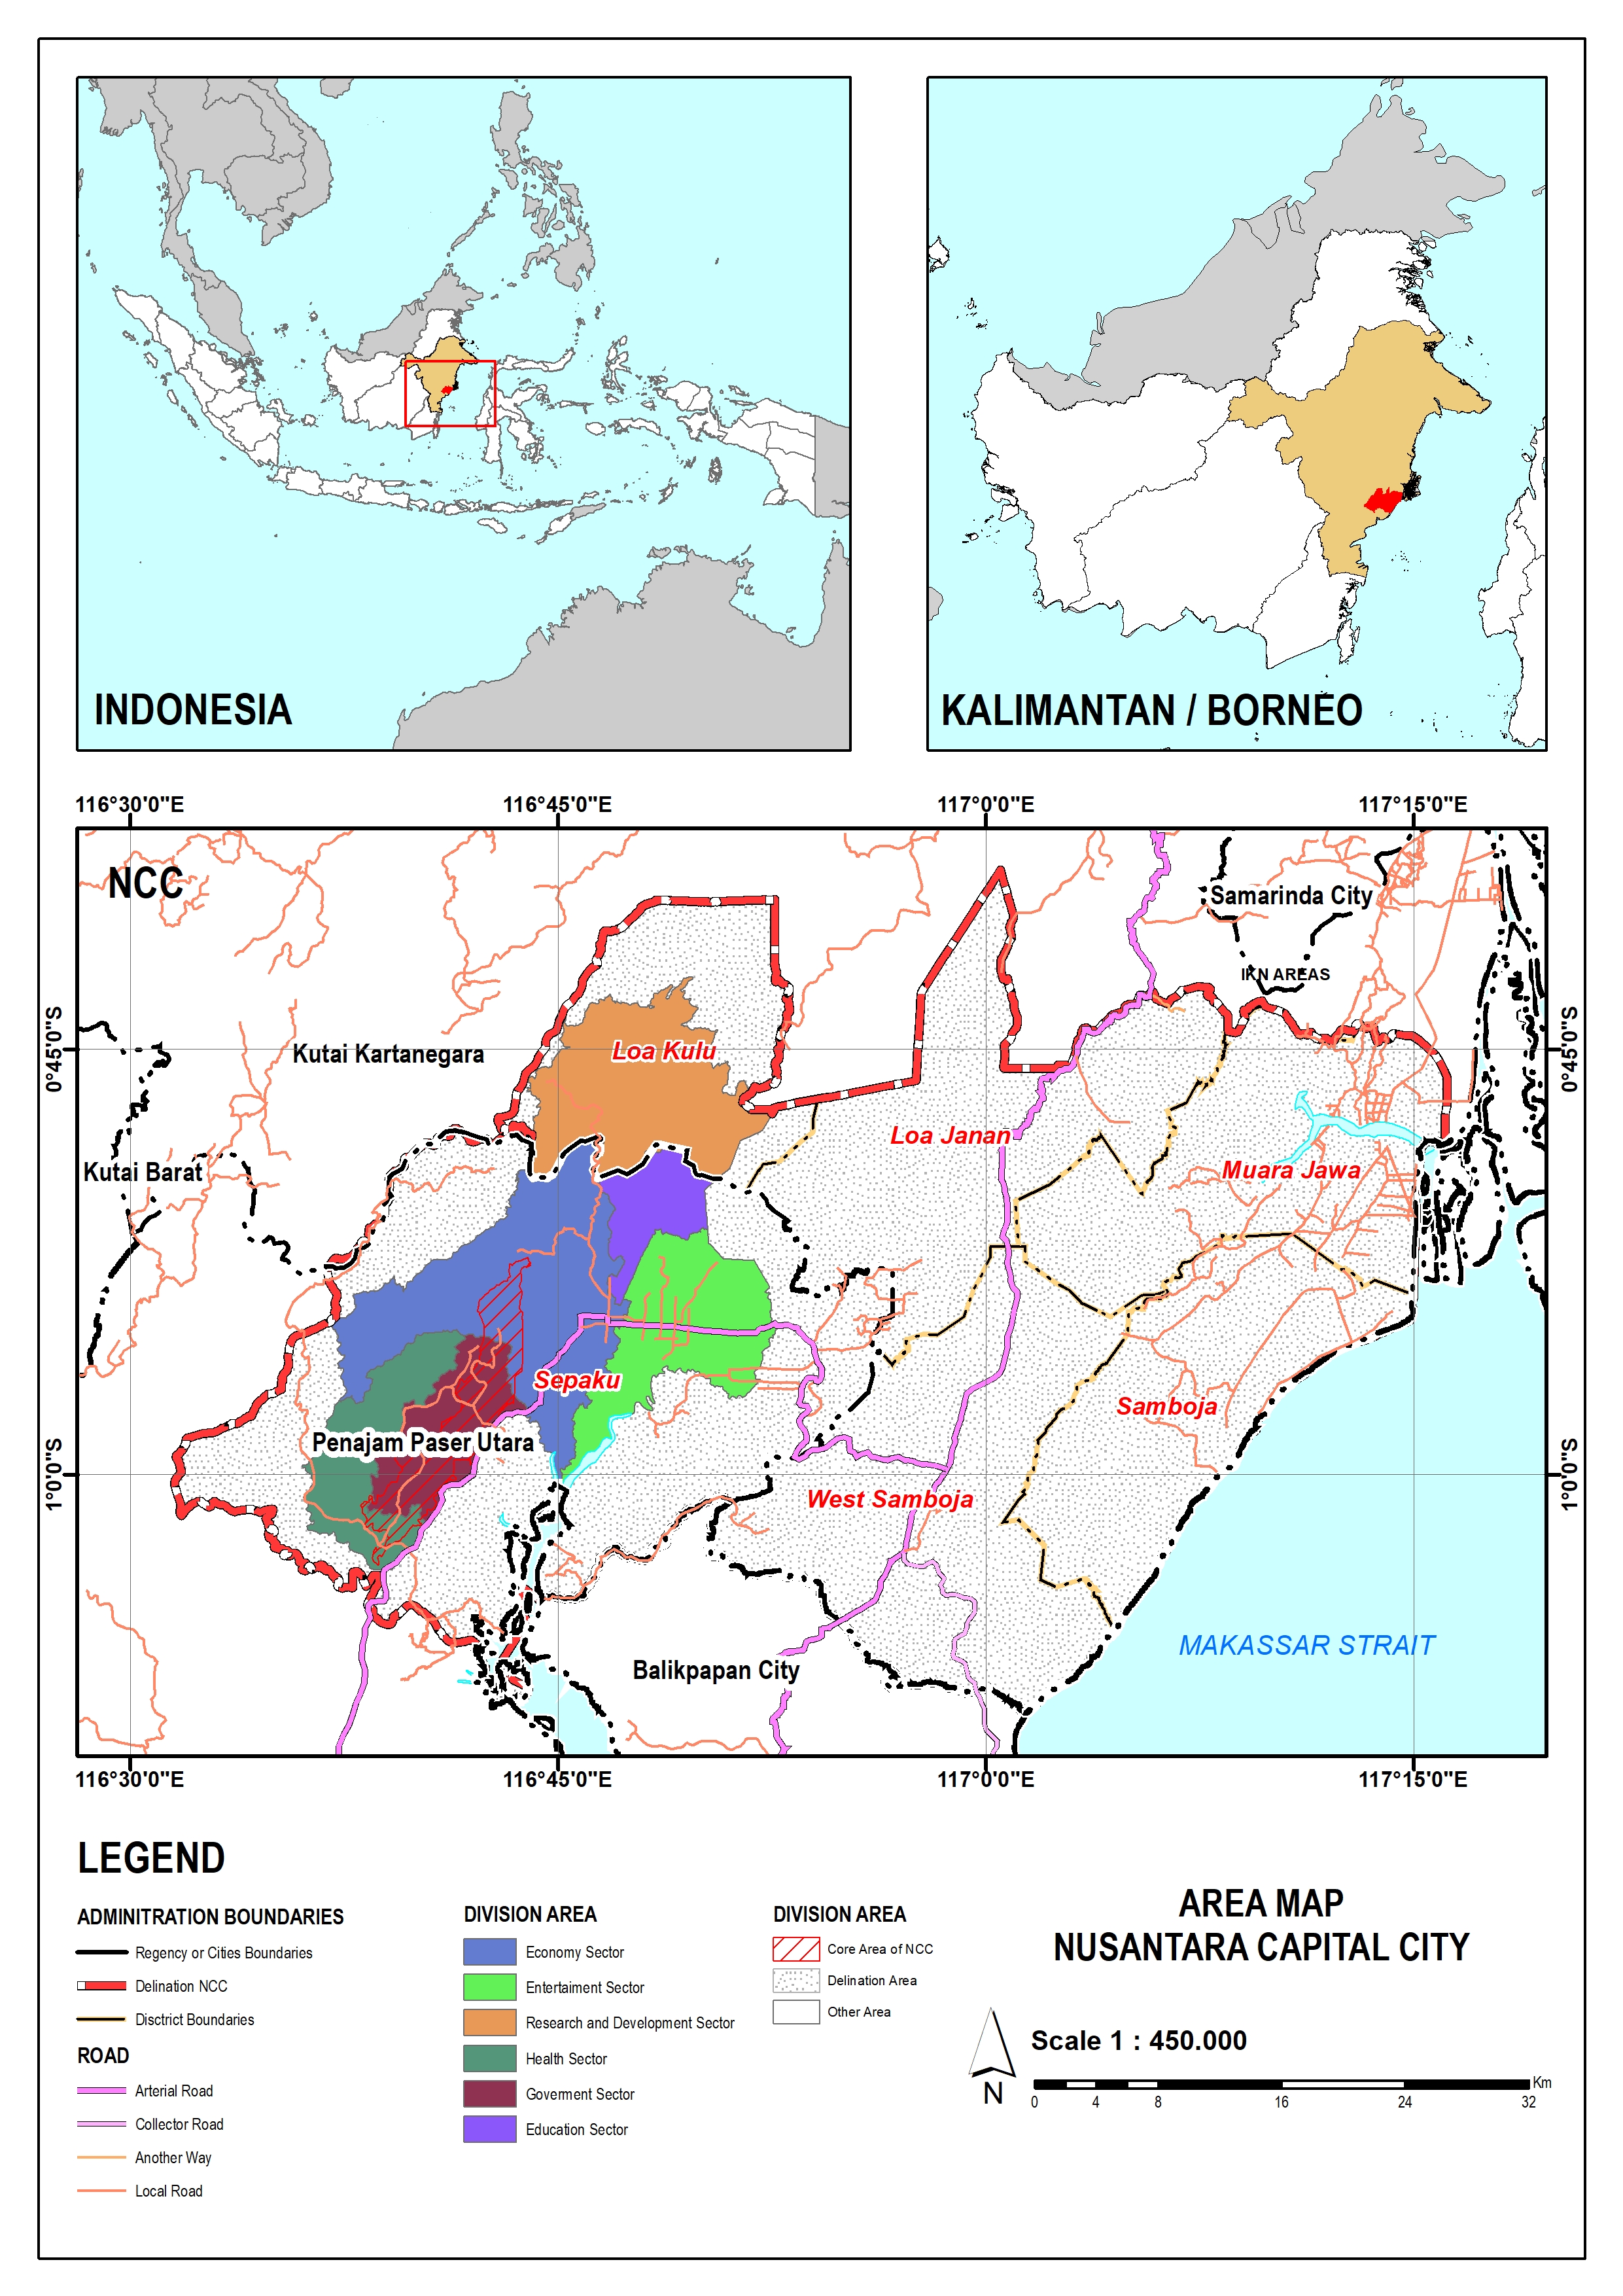
Figure 1 Administrative map of the Nusantara Capital City in East Kalimantan. The NC area covers part of North Penajam Paser Regency (Sepaku District) and part of Kutai Kartanegara Regency (Samboja, Loa Kulu, Loa Janan, and Muara Jawa Districts). The map delineates the surrounding buffer areas, including Balikpapan and Samarinda, and highlights the direct boundary with the Makassar Strait.
Data
This study employed IMERG rainfall data, which provides global precipitation estimates with high spatial and temporal resolution and more uniform coverage, thereby enhancing global climate and hydrological monitoring [21]. The dataset was downloaded from the National Aeronautics and Space Administration (NASA) website (https://disc.gsfc.nasa.gov/). The IMERG algorithm is used to overcome the inherent limitations of observations from individual Low Earth Orbit (LEO) satellites by combining measurements from multiple passive microwave (PMW) sensors and filling temporal and spatial gaps using infrared (IR) observations from Geostationary Earth Orbit (GEO) satellites. This fusion approach enables IMERG to produce continuous, accurate, and reliable estimates of precipitation [22]. IMERG products are available at a spatial resolution of 0.1°×0.1° (~11 km) and consist of three variants: IMERG-E (Early), IMERG-L (Late), and IMERG-F (Final). This study utilized 24 years of daily IMERG-F data spanning 2000 - 2024. The superior performance of IMERG, particularly IMERG-F, in Indonesia has been demonstrated in several studies [23-25].
TC occurrences and trajectories were obtained from the IBTrACS data and downloaded from the National Oceanic and Atmospheric Administration (NOAA) website (https://www.ncdc.noaa.gov/ibtracs/). The IBTrACS dataset provides key information, including observation time, the positions of cyclone centers, the minimum pressure, the maximum wind speed, regional-scale intensity classification, the cyclone name, and the data source [26,27]. This study focused on TC activity in the Western Pacific basin (6°S - 30°N, 107°E - 160°E) during 2000 - 2024, corresponding to the IMERG observation period. A total of 318 TCs were examined using IBTrACS data during 2000 - 2024.
To objectively define individual tropical cyclone events for the analysis, cyclonic events were identified based on a 12-hour temporal separation criterion applied to consecutive IBTrACS observations. This threshold ensures that long-duration systems are not fragmented into multiple events, thereby preventing artificial inflation of the cyclone count and ensuring that each cyclone lifecycle is counted as a single unique event. Each identified event has its maximum wind speed (Vmax) determined, and the time and location of this maximum intensity are used as the primary reference for defining the analysis window. Only observation records occurring within the spatial domain (6°S - 30°N, 107°E - 160°E), within a radius of 1,100 km from the peak intensity location, and within a time window of ±3 days from the Vmax peak are retained for analysis. This approach allows overlapping systems to be separated objectively while preventing double counting of the same cyclonic event. This threshold is consistent with several previous studies [16,28,29].
The 1,100 km radius was chosen to capture not only the precipitation core around the center of the tropical cyclone, but also the extensive outer rainband structure and the cycloneʼs indirect influence on large-scale moisture transport, such as the strengthening and movement of monsoon air masses. This selection is consistent with study by Bagtasa [30], which shows that a radius of 1,000 - 1,200 km effectively captures the tropical cyclone rainfall contribution over the Maritime continent without significantly including non-cyclonic rainfall. A smaller radius (<800 km) may underestimate the contribution of long-range moisture transport, while a larger radius (>1,200 km) may overestimate it by including unrelated rainfall. This approach is particularly relevant for equatorial regions such as Kalimantan, which are rarely directly crossed by TCs but are more frequently affected indirectly through water vapor advection and regional circulation modification. Therefore, this relatively large radius is necessary to represent indirect effects, which are more dominant than direct effects in Indonesia.
Temporal trend analysis was performed using the Mann-Kendall (MK) nonparametric test to detect the presence of monotonic trends and determine their statistical significance. The slope of the trend was calculated using the Theil-Sen Estimator, which provides a median estimate of all slope pairs and is more robust to extreme values. The selection of this non-parametric approach was based on the characteristics of tropical rainfall data, which is generally not normally distributed and has high interannual variability. The significance level used in this study was 95% [31]. Additionally, zonal wind (u), meridional wind (v), and specific humidity (q) data at the 500 - 1,000 hPa pressure levels were obtained from the fifth-generation ECMWF reanalysis (ERA5). These variables were used to calculate water vapor flux (WVF) by vertically integrating specific humidity and wind vectors to represent dominant moisture transport in the lower to middle troposphere, which is the main layer for tropical cyclone formation and intensification. We also used SST data to examine oceanic thermal conditions associated with tropical cyclone development.
Methodology
Daily rainfall data from IMERG were classified into tropical cyclone-induced rainfall (TC rain) and non-tropical cyclone-induced rainfall. Rainfall occurring within 1,100 km of the TC center and within the temporal window was considered TC-induced rainfall, whereas all remaining daily rainfall that did not meet these criteria was categorized as non-tropical cyclone-induced rainfall. The contribution of TC rain to the total rainfall (CTC) is then expressed as a percentage, calculated by comparing the total amount of cyclone-induced rainfall to the total rainfall using the following Eq. (1)
C TC
=
(Rainfall induced by tropical cyclone) x 100% (1)
TC
=
(Rainfall induced by tropical cyclone) x 100% (1)
(Total rainfall)
Several other researchers have used this same formula [16,32,33].
Rainfall was analyzed at daily, monthly, and seasonal scales. The seasonal analysis concentrated on the JJA and SON periods that correspond to the peak of TC activity in the Western Pacific Ocean. Spatial characteristics were examined by visualizing mean total rainfall, TC-induced rainfall, and the percentage contribution of the latter across the NC region using the IMERG grid resolution.
We employed the Real-Time Multivariate MJO (RMM) Index data published by the Australian Bureau of Meteorology (BoM) to assess the modulation of rainfall by the MJO. The RMM index consists of eight phases that describe the longitudinal propagation of dominant convective centers: Phase 1 (East Africa), Phase 2 (Western Indian Ocean), Phase 3 (Eastern Indian Ocean), Phase 4 (Western Indonesia), Phase 5 (Eastern Indonesia), Phase 6 (Western Pacific Ocean), Phase 7 (Central Pacific Ocean), and Phase 8 (Eastern Pacific Ocean or West Africa) [34]. Only MJO events with an RMM amplitude >1 were classified as strong and used in the analysis. Total rainfall and TC rain over the NC were subsequently grouped by MJO phase to identify variation in the contribution of TC rain and evaluate how this contribution is modulated by the MJO.
Water vapor flux, wind, and SST data were used to examine the atmospheric dynamics across seasons and MJO phases. Water vapor flux is essential for examining TC rain because it represents the primary fuel that drives the formation, intensification, and precipitation of TC. In addition, water vapor flux data help identify regions where moisture conditions are favorable for cyclone development.
Results and discussion
Distribution of tropical cyclone
The frequency of TCs during 2000 - 2024 consistently indicated high activity from July to November. TC occurrences began to increase in July (46 events), peaked in September (69 events), and remained elevated until November (43 events) (Figure 2). Seasonally, the highest TC density (approximately 70 - 90 events per season accumulated over 2000 - 2024) was observed during the JJA and SON seasons, while the lowest density occurred during the DJF (December - January - February) season (Figure 3). Spatially, TC concentrations were highest in the South China Sea and the western Philippine Sea (Figure 3), representing the primary genesis region within the Western Pacific basin. This spatial distribution aligns with the climatological position of the monsoon trough and the convergence zone where southwesterly monsoon flows interact with trade winds, creating favorable conditions for cyclogenesis [35,36].
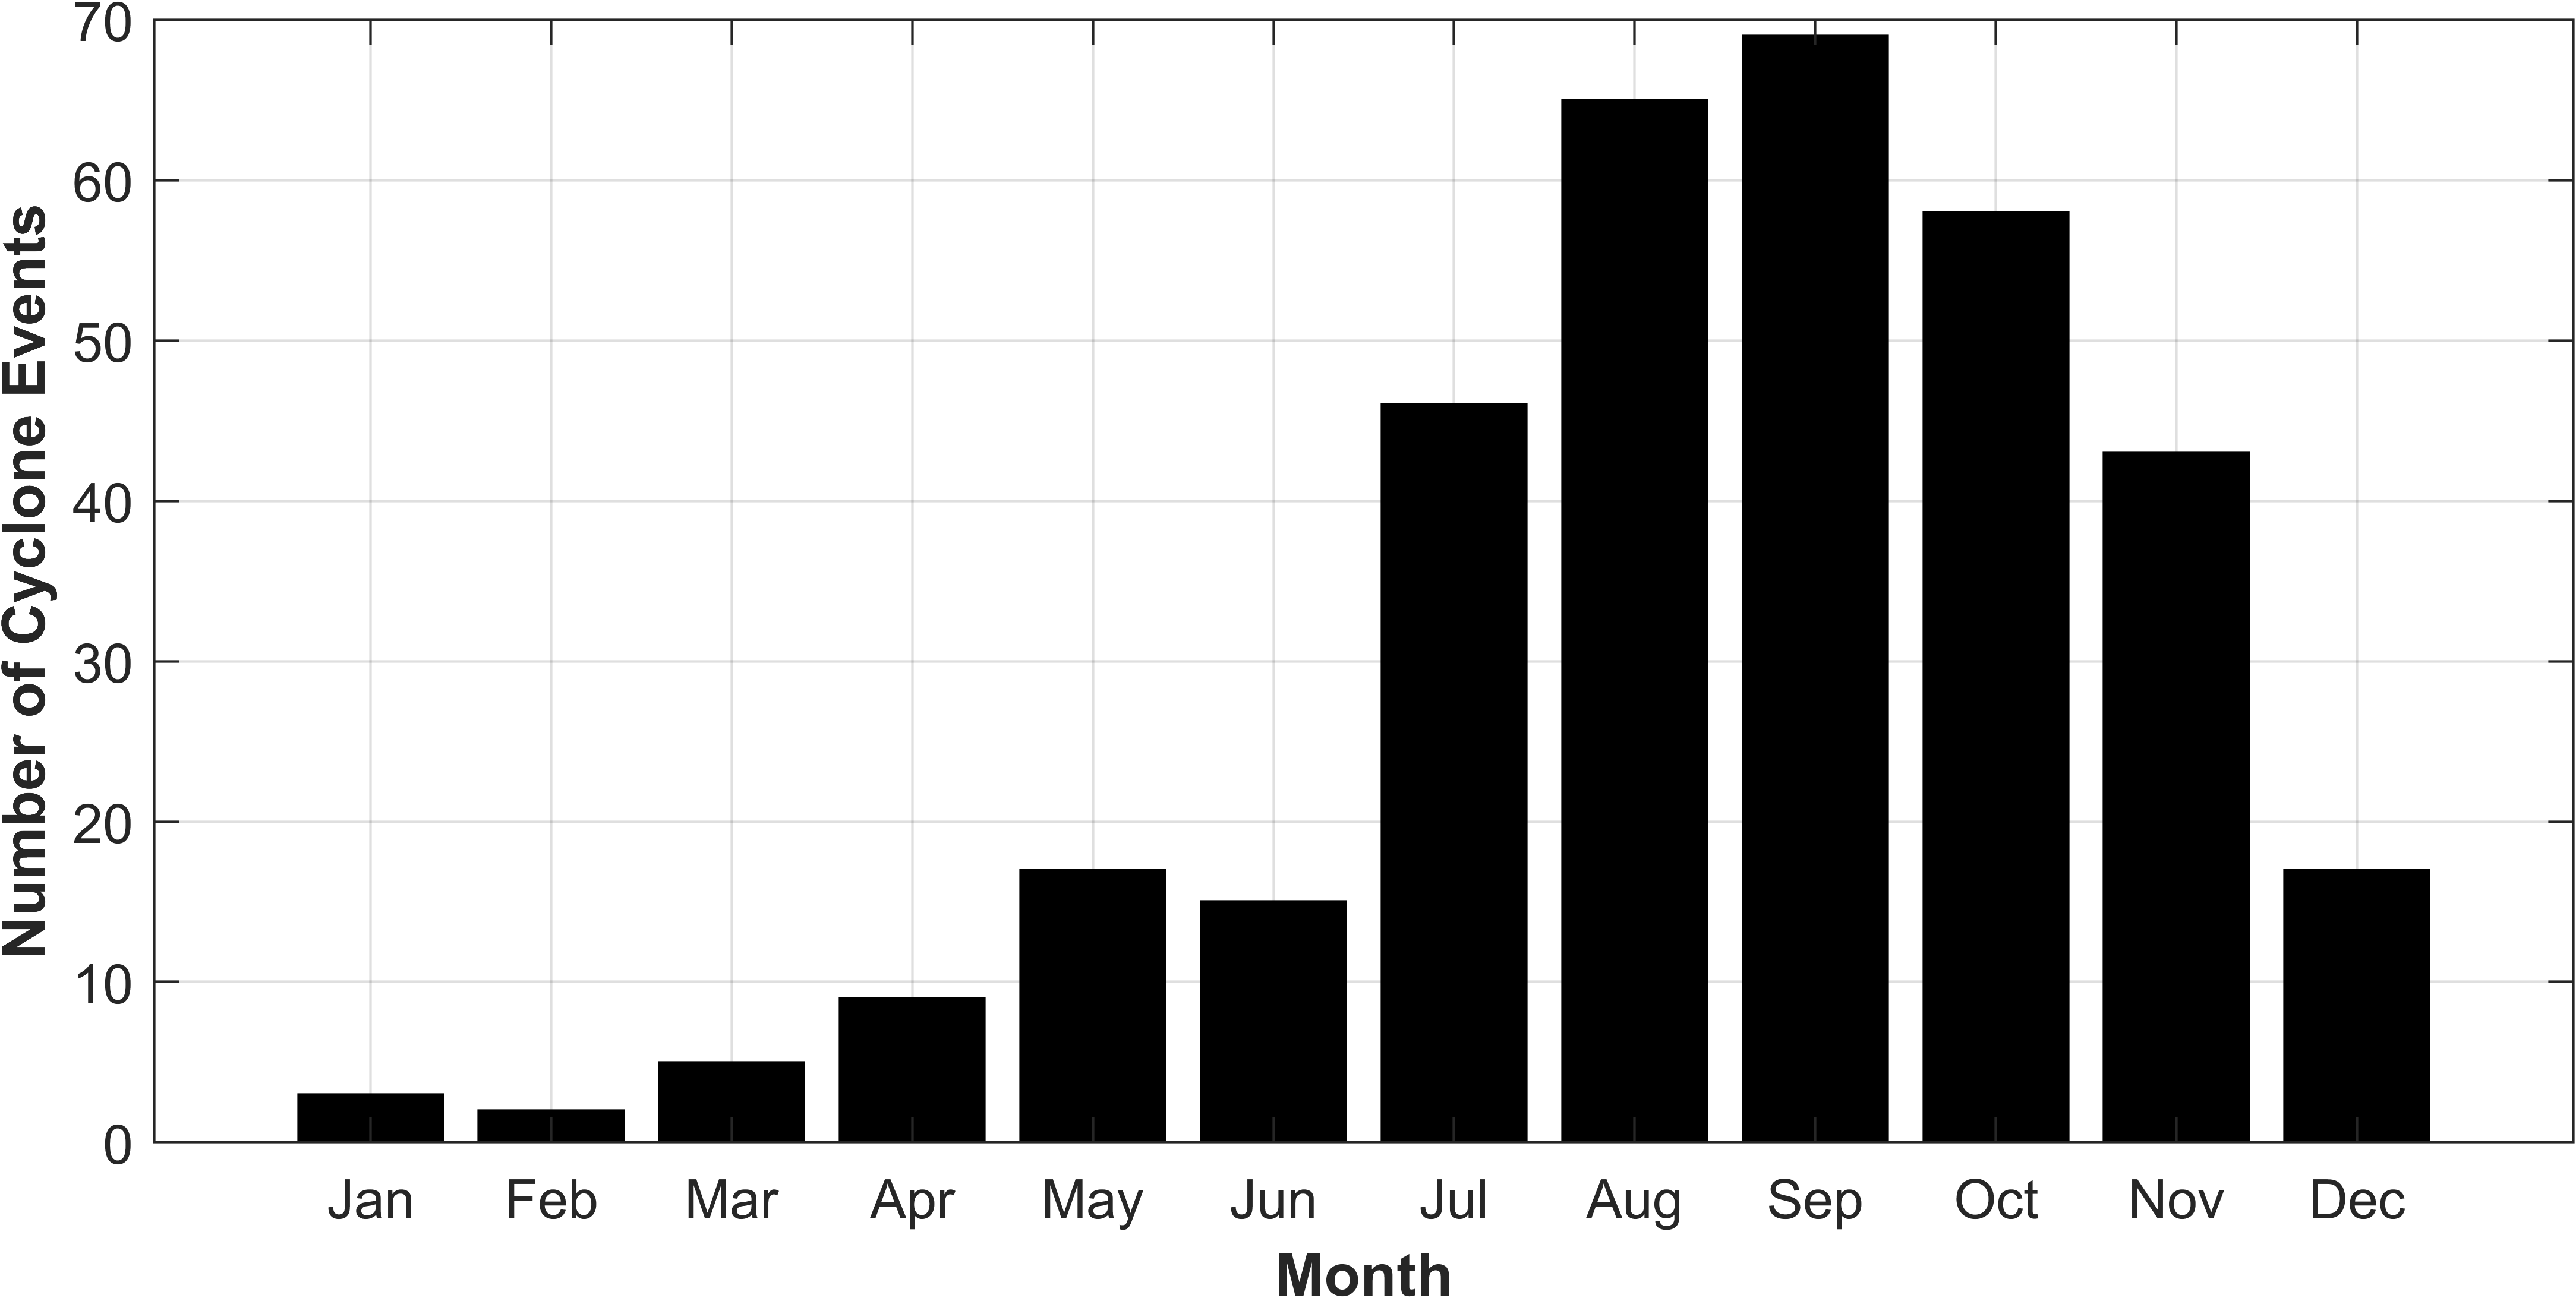
Figure 2 Monthly frequency of tropical cyclone occurrences during the 25-year period (2000 - 2024) over the Western Pacific region (6°S - 30°N, 107°E - 160°E).
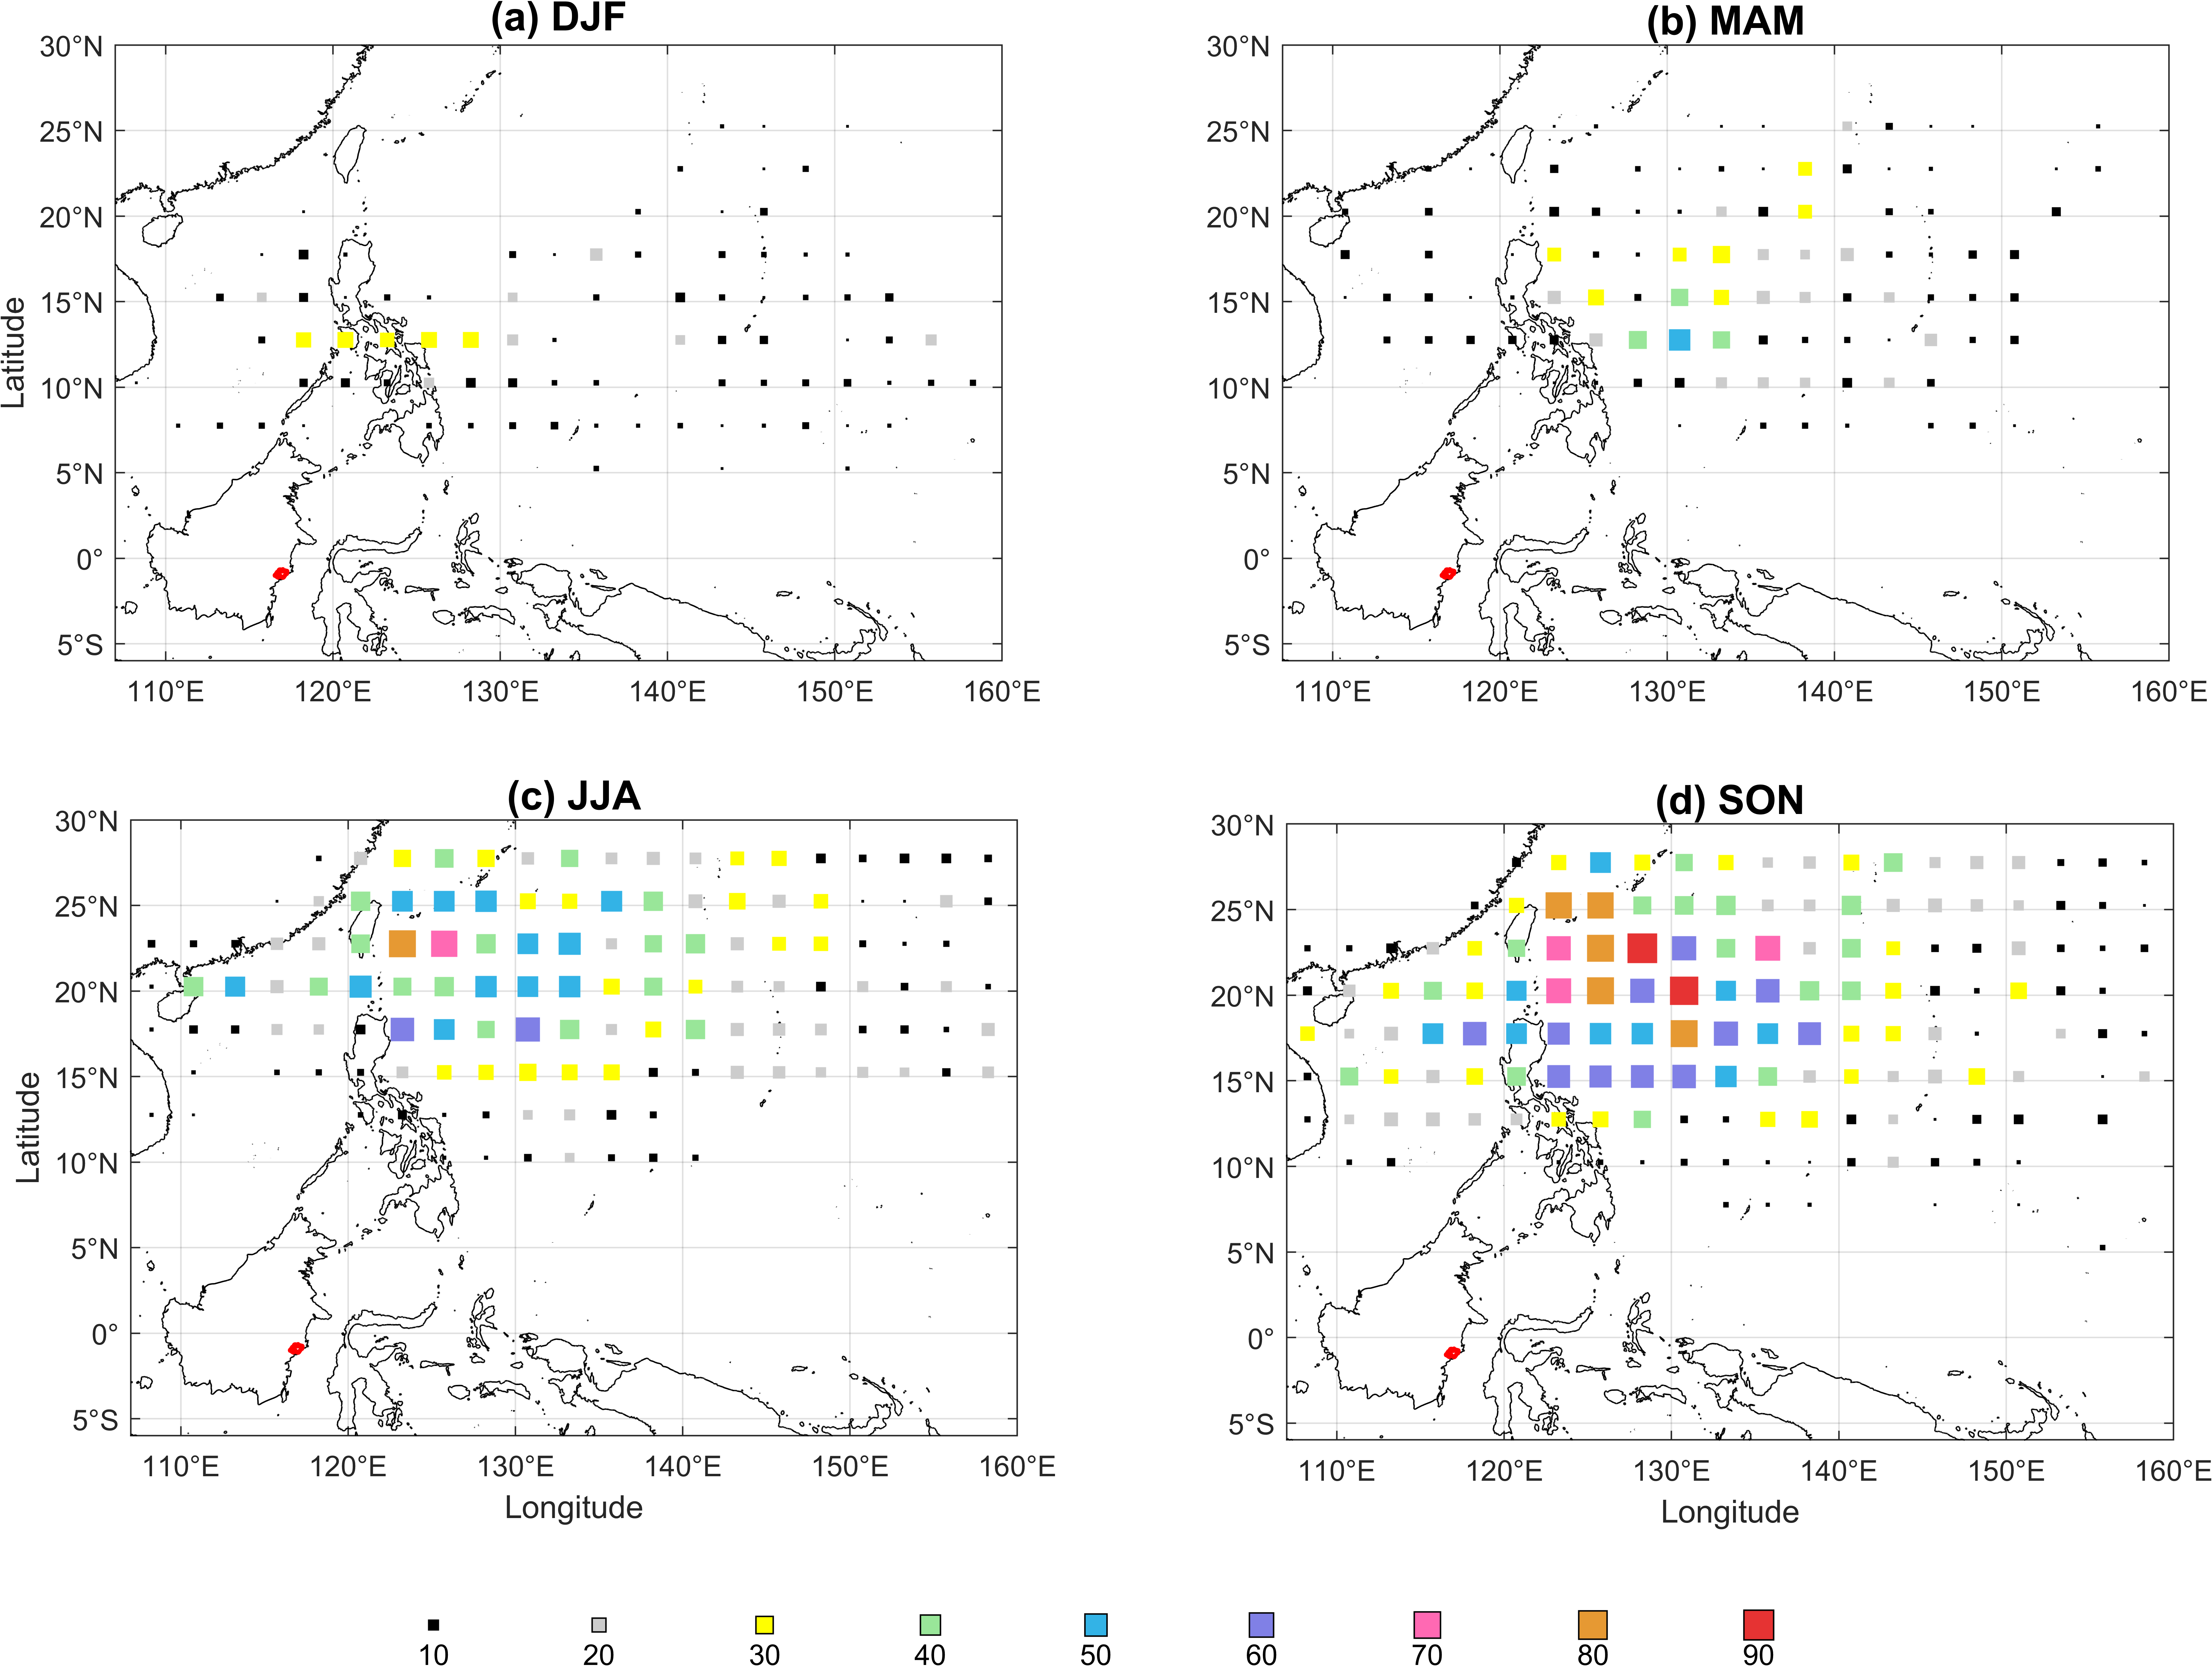
Figure 3 Spatial density maps showing the concentration of tropical cyclones over the Western Pacific Ocean across four seasonal periods: (a) DJF, (b) MAM, (c) JJA, and (d) SON. The size and color of each grid cell represent the cyclone density (ranging from 10 to 90), highlighting the most active formation and track regions.
The elevated TC activity during JJA and SON is strongly supported by favourable thermodynamic and dynamical conditions in the tropics. During JJA, thermodynamic conditions are particularly conducive to storm formation. SSTs across the Western Pacific increase significantly, exceeding 26.5 °C across a wide area (Figure 4(b)). This rise in SST is regarded as the minimum threshold for deep convection and TC development [37,38], providing the necessary energy and moisture through evaporation and condensation processes that fuel tropical cyclone intensification [39]. The warm ocean surface creates an environment where organized convective systems can develop and maintain the vertical structure required for cyclogenesis [40].
From a dynamical perspective, the JJA period is dominated by strong southwesterly monsoonal flow over the Western Pacific (Figure 5(a)). This flow generates a concentrated water vapor flux in the northern sector (around 1025 kg m−1 s−1), coinciding with the northward displacement of both the monsoon trough and the ITCZ. The monsoon trough, formed by the convergence of southwest monsoon flows, cross-equatorial currents, and southeast trade winds, represents a region of considerable convective activity that is highly conducive to tropical cyclone generation [35]. The poleward migration of the ITCZ plays a crucial role in enhancing convective disturbances and increasing low-level vorticity, thereby fostering an atmospheric environment highly favorable for the genesis and intensification of TC events [41,42]. During strong monsoon trough years, the eastward extension of the trough evolves into a closed monsoon gyre, with enhanced lower-level southwesterly flows providing a favorable environment for rapid TC formation [43]. Approximately 70% of Western North Pacific TC genesis events are linked to monsoon gyre activity, with the south-southeast periphery of these gyres serving as particularly favorable regions for cyclogenesis [44].
When TCs develop (Figure 5(b)), the water vapor flux becomes dominated by strong cyclonic circulation, with peak values reaching up to 600 between 20 N and 25 N. Pronounced positive water vapor flux anomalies (>150 kg m−1 s−1) surrounding TC activity (Figure 5(c)) indicate a substantial inward transport of moisture toward the core of the storm. This mechanism reflects the rapid intensification of moisture flux convergence in the lower troposphere, a defining feature of the developing cyclone [45]. The convergence of southwesterly summer monsoon flows and easterly flows creates water vapor convergence centers over the South China Sea and Philippine Sea, establishing anomalous positive relative humidity conditions that are essential for TC genesis and intensification [40].
TC activity also remains elevated during the SON season, although environmental characteristics begin to differ from those during JJA. During SON, SSTs in the Western Pacific remain sufficiently warm to sustain tropical convection, while the ITCZ gradually shifts southward, causing the monsoon trough to retreat from its farthest northward position recorded in JJA. The water vapor flux during SON is generally slightly weaker than in JJA, with peak magnitudes around 500 kg m−1 s−1 near 20 N, and anomalies declining to below 50 kg m−1 s−1 across the South China Sea to the equatorial region.
Despite this modest weakening in moisture transport, environmental conditions during SON remain supportive for the formation of TCs. The SST remains high, exceeding 28 °C (Figure 4(e)), well above the threshold required for deep convection and providing ample energy for storm development. Furthermore, vertical wind shear within the primary development region tends to be relatively low, allowing storms to maintain their structure during intensification. The combination of warm SSTs, reduced wind shear, and adequate mid-level humidity creates a thermodynamic environment that continues to support active cyclogenesis through the fall season [40,46]. Additionally, eastward propagation of the MJO, which carries positive convective anomalies from the Indian Ocean into the Western Pacific, frequently enhances synoptic-scale circulation during SON and serves as a key trigger for TC initiation [47,48]. The MJO exerts significant control on basinwide TC frequency in the Western North Pacific, with convectively active MJO phases (phases 4 - 6) associated with substantially increased cyclogenesis rates compared to suppressed phases [49-51]. During active MJO phases, enhanced convection develops cyclonic vortices, decreases vertical wind shear, and intensifies upper-level divergence, all of which favor TC genesis and development [40].
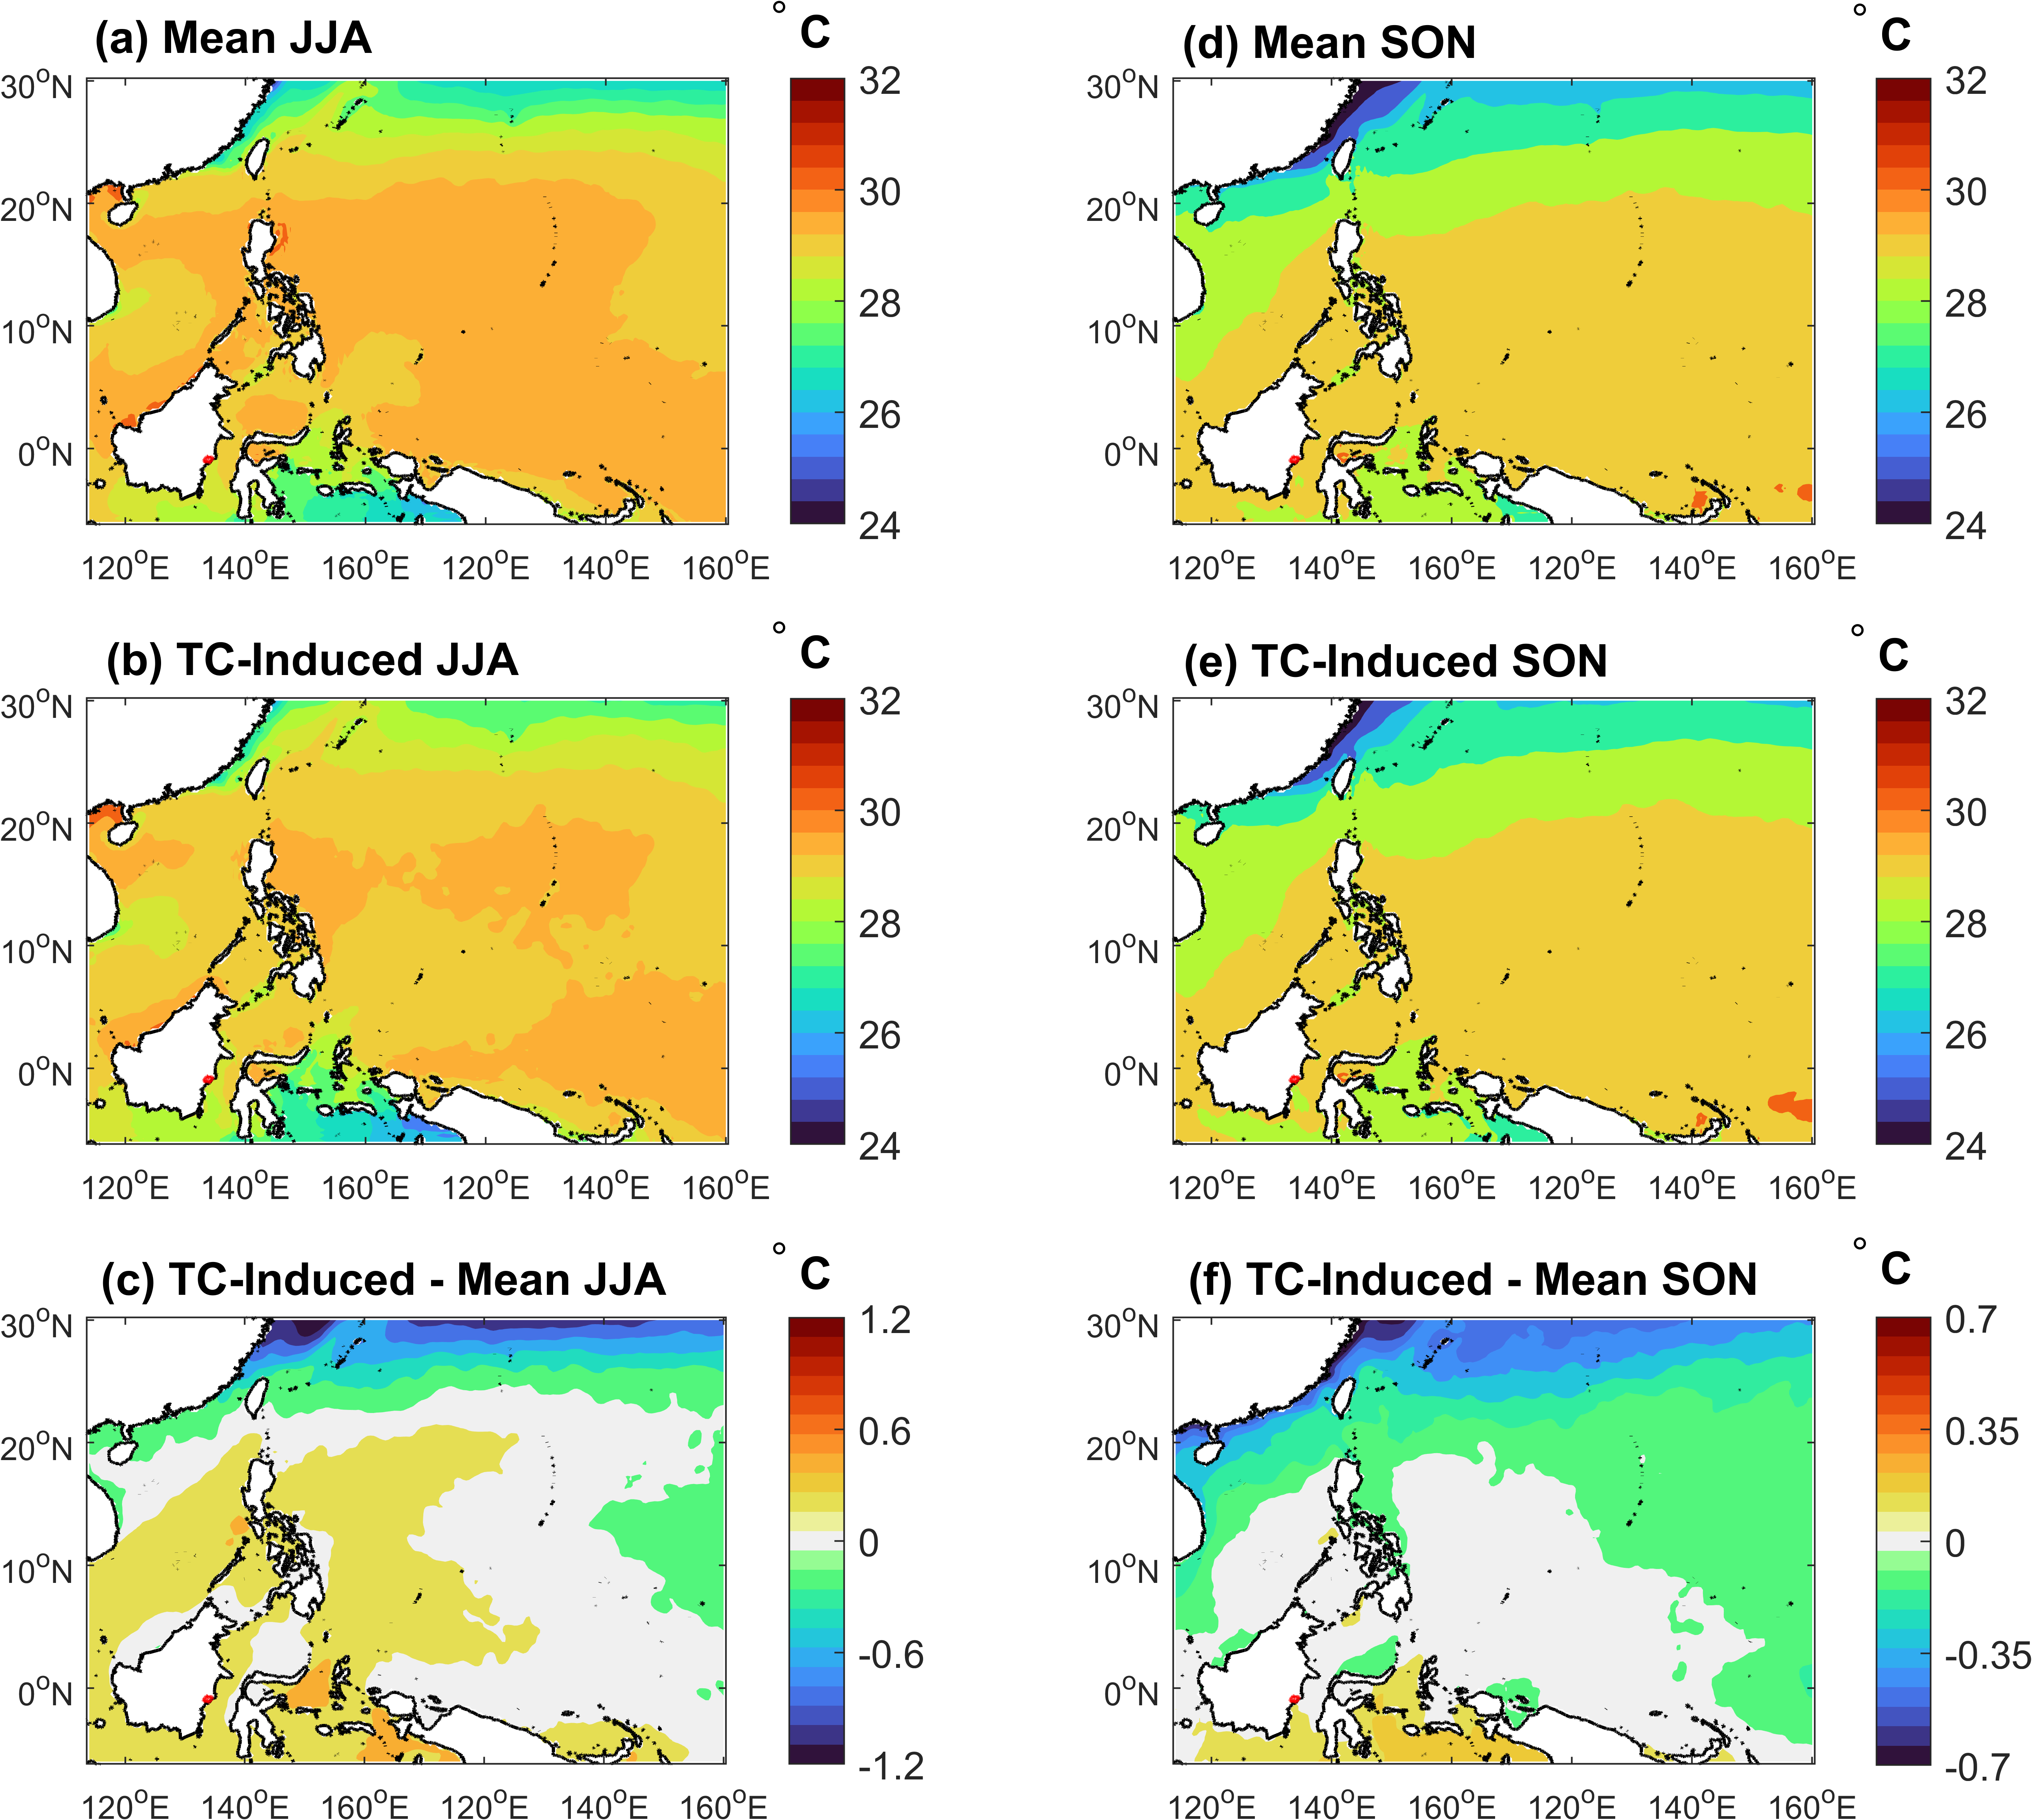
Figure 4 Sea surface temperature (SST) over the Western Pacific Ocean for the 2000 - 2024 period. Panels (a) and (d) show the climatological mean during JJA and SON, respectively. Panels (b) and (e) depict SST conditions associated with tropical cyclone (TC) influence. Panels (c) and (f) present the SST anomalies, defined as the difference between TC-influenced conditions and the climatological mean. The location of the NC is marked in red.
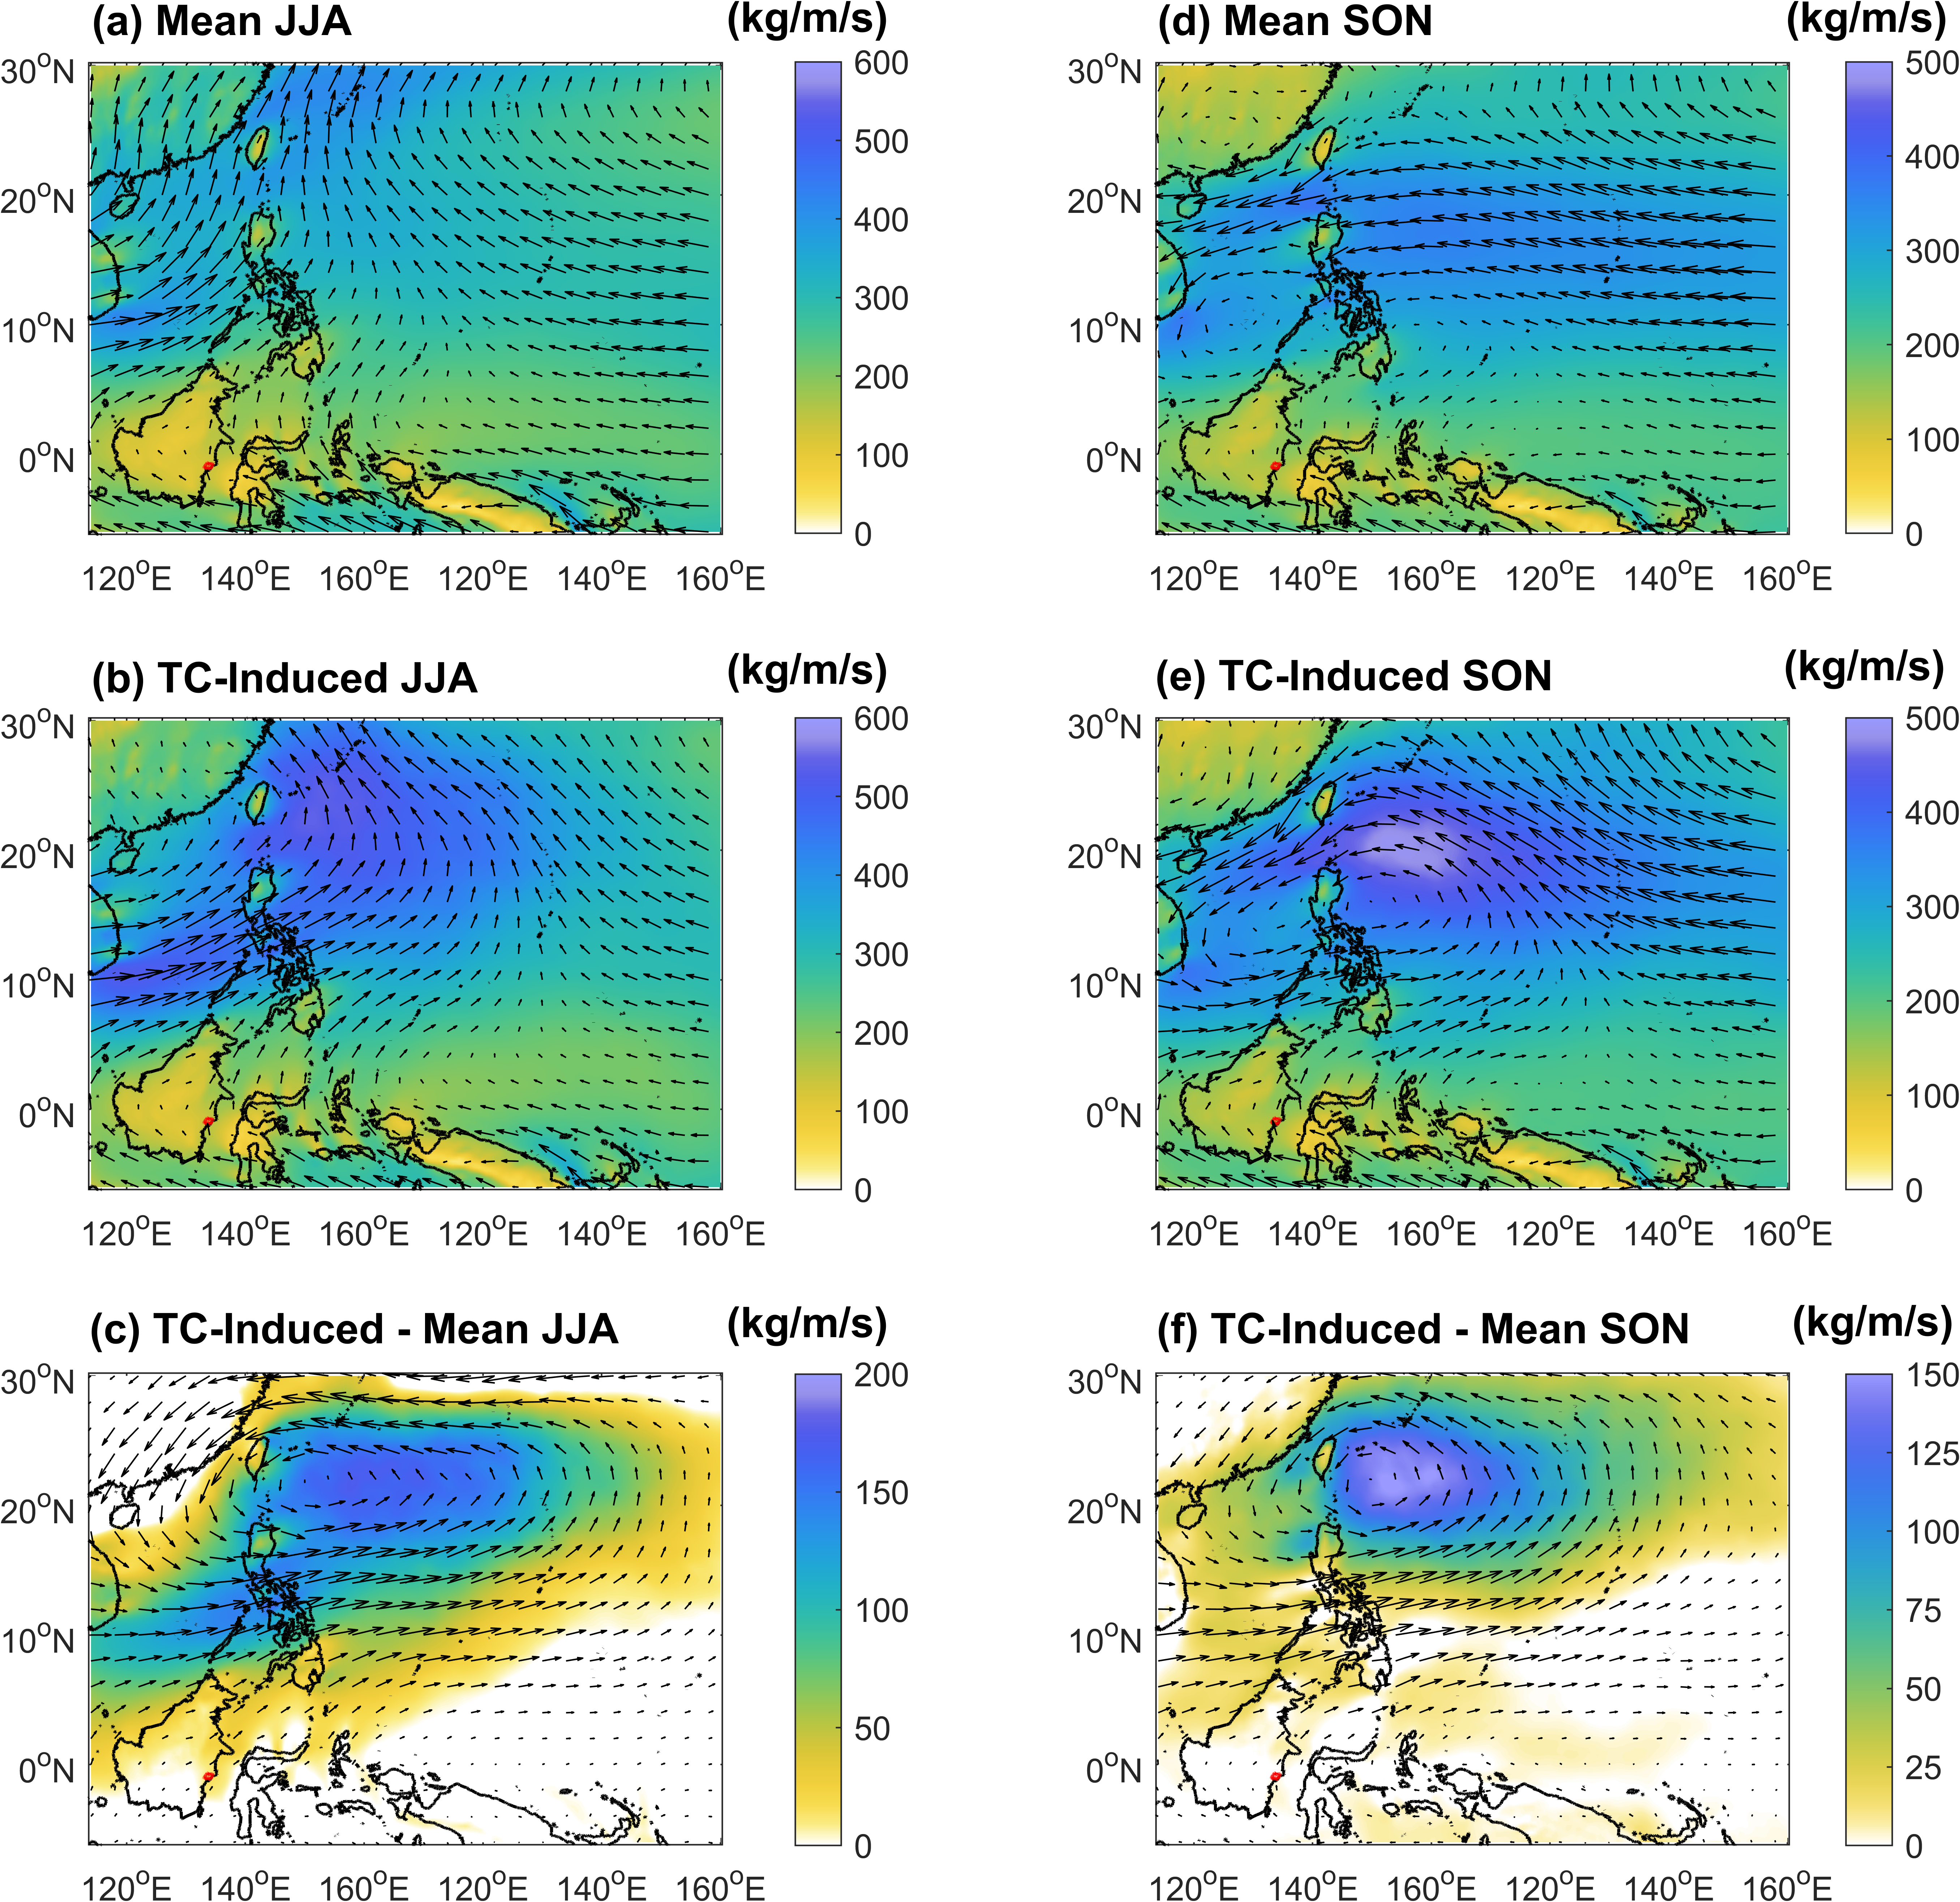
Figure 5 Vertically integrated water vapor flux (kg m⁻¹ s⁻¹) and associated moisture flux vectors over the Western Pacific Ocean for the 2000 - 2024 period. Panels (a) and (d) show the climatological mean during JJA and SON, respectively. Panels (b) and (e) depict conditions associated with tropical cyclone (TC) influence. Panels (c) and (f) represent the difference between TC-induced conditions and the climatological state. The NC’s location is indicated in red.
The contribution of tropical cyclones to rainfall
The distribution and contribution of rainfall triggered by TC activity in the NC exhibited distinct spatial patterns and marked seasonal variability during 2000 - 2024. The total annual rainfall in the NC averaged 7 - 9 mm/day, with the southeastern coastal areas, particularly Samboja and Muara Jawa, recording the highest values (Figure 6(a)). This high intensity is strongly influenced by local factors including low-lying topography and direct exposure to warm water masses from the Makassar Strait, which serves as the main source of moisture [52,53]. These geographic conditions favor the development of Mesoscale Convective Systems (MCS), which indeed dominate the total annual rainfall volume and create the observed spatial gradient between coastal and inland areas [54]. However, coastal areas remain highly sensitive to water vapor convergence amplified by large-scale atmospheric disturbances. While MCS drives the baseline rainfall climatology, TC act as a critical external forcing that intensifies moisture flux convergence during specific seasons, thereby exacerbating extreme rainfall events in these coastal zones despite their lower frequency compared to local convective activities [8,55]. Notably, TC rain (Figure 6(b)) also demonstrated a relatively even spatial distribution across the NC, with a daily mean of 5 - 7 mm/day and maxima again occurring in Samboja. These findings imply that although TCs form far away in the Western Pacific, their activity can indirectly modulate rainfall over the NC through enhanced moisture convergence and strengthened northwesterly monsoonal advection, both of which intensify regional precipitation [4,8]. Overall, the contribution of TC rain to the annual total exceeded 9% - 10% (Figure 6(c)). The highest contributions were observed in Samboja, Loa Kulu, and Sepaku, areas adjacent to the Makassar Strait, which forms part of the Indonesian Throughflow (ITF). These waters are among the warmest globally and are a persistent source of abundant moisture [56,57]. The Indonesian Maritime Continent, particularly the Makassar Strait region, exhibits unique characteristics where mesoscale convective complexes contribute up to 20% of total rainfall, with seasonal increases reaching 24% - 30% during peak periods [58].
Seasonal differences are evident in the spatial distribution of rainfall (Figure 7). During the JJA season, daily total rainfall (Figure 7(a)) ranges from 6 to 9 mm/day, while TC rain (Figure 7(c)) contributes 3 - 6 mm/day. The contribution of TC rain during this period is relatively moderate, at 11% - 12% (Figure 7(e)). In contrast, during the SON season, although the average daily total rainfall (Figure 7(b)) slightly decreases to 6 - 8.5 mm/day, TC rain (Figure 7(d)) increases markedly to 5.5 - 7.5 mm/day. Consequently, the percentage contribution of TC rain reaches its highest-level during SON (Figure 7(f)), ranging from 19% to 23%, with the maxima located in Samboja, Loa Kulu, and Sepaku. This sharp rise is consistent with the seasonal climatology of TCs, as both the frequency and density of TC activity in the Western Pacific peak during SON (Figures 2 and 3). The seasonal modulation of MCS activity by large-scale atmospheric patterns, including convectively coupled equatorial waves, further enhances the probability of extreme precipitation events during this period [59].
These results indicate that the SON season represents the most vulnerable period to the indirect influence of TC, characterized by an almost twofold increase in extreme rainfall compared to JJA. During the SON period, the southwest monsoon begins to recede and the ITCZ shifts southward across Kalimantan, thereby increasing low-level convergence and background humidity in the NC region [7]. This transitional environment creates atmospheric conditions that are more sensitive to large-scale disturbances than during the JJA period. In this situation, TC activity in the Western Pacific not only acts as an additional source of moisture, but also interacts with the weakening monsoon system and strengthening ITCZ convergence [60]. The findings of Bagtasa [30], TC activity during this period often triggers a Rossby wave response that produces a Moisture Conveyor Belt (MCB), which is a large-scale water vapor transport pathway that channels moisture from the Philippine Sea and the Makassar Strait to Kalimantan. Given that the atmospheric background in SON already supports convergence and moisture accumulation, TC-induced advection becomes more efficient in increasing episodic precipitation. These conditions physically explain why TC rainfall contributions increase nearly twofold compared to the JJA season, even though the cyclone center remains far from the NC region [60]. Considering the NCʼs strategic role as a center of national activity, the heightened contribution of TC-related extreme rainfall suggests substantial future hydrometeorological risks in the form of flooding and landslides. These risks should be carefully incorporated into disaster mitigation strategies and spatial planning initiatives across the region [4,6].
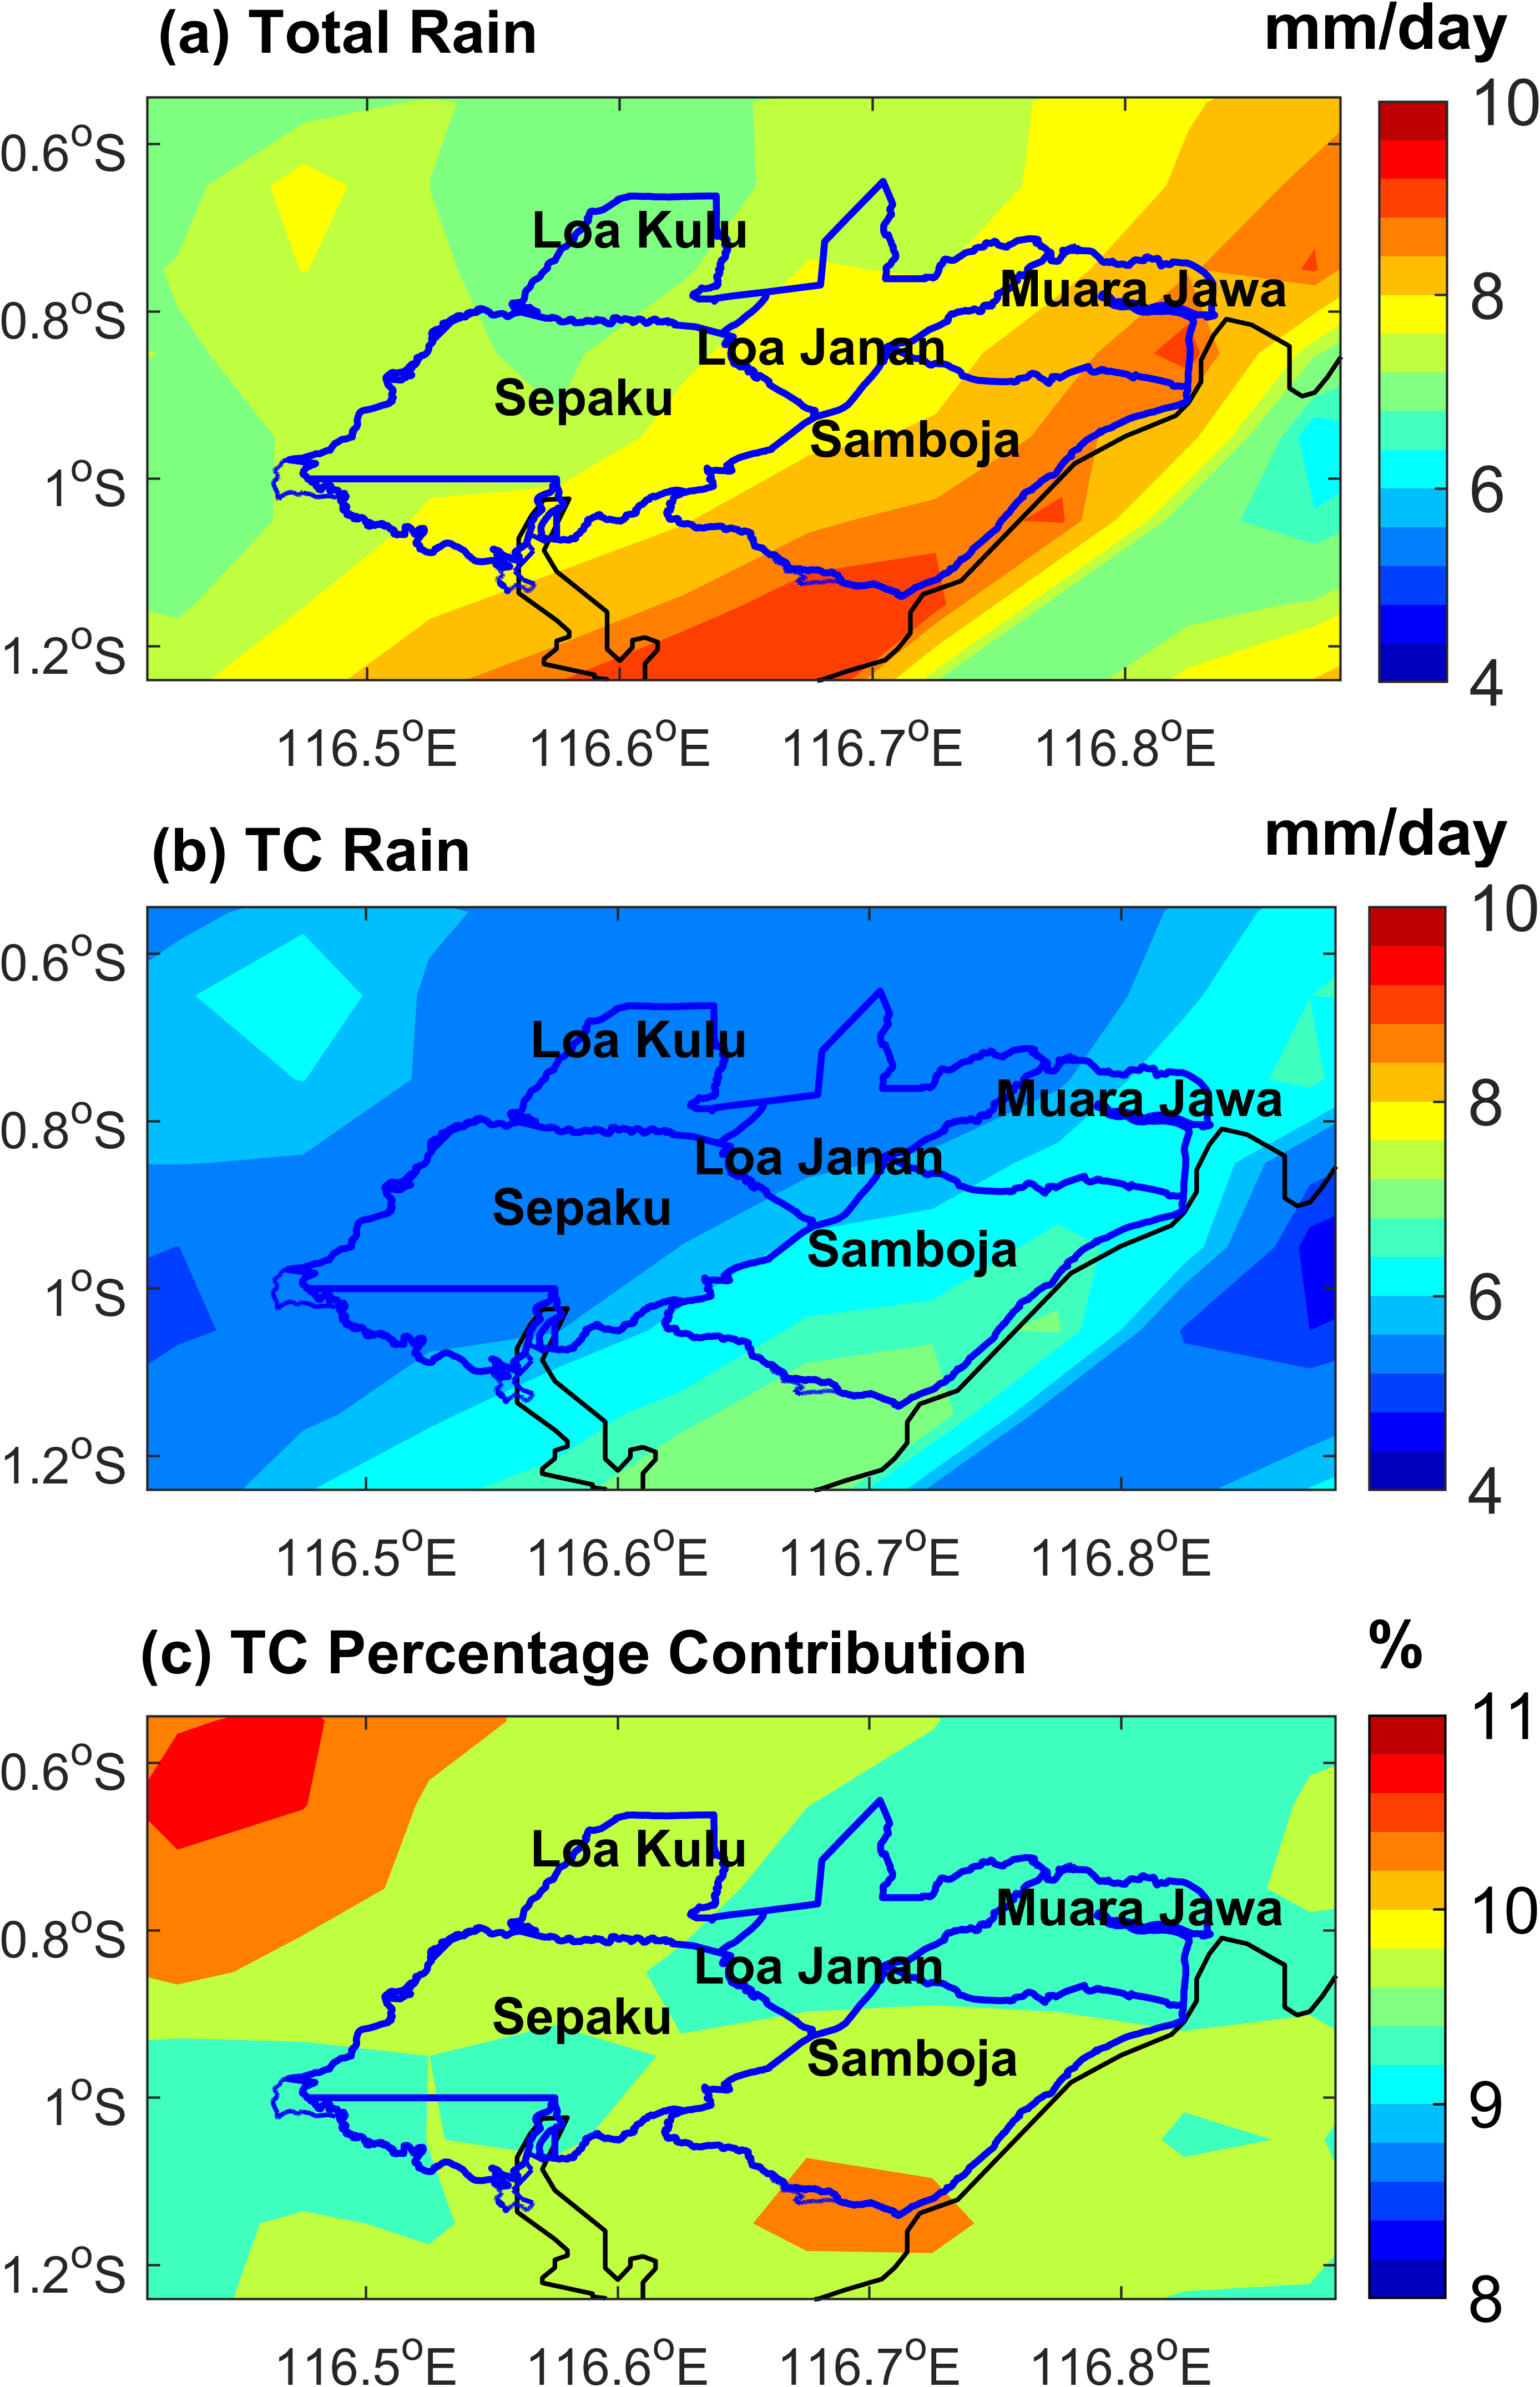
Figure 6 Daily averages of (a) total rainfall, (b) tropical cyclone (TC)-induced rainfall, and (c) the percentage contribution of TC-induced rainfall to total rainfall over the NC during the 2000 - 2024 period.
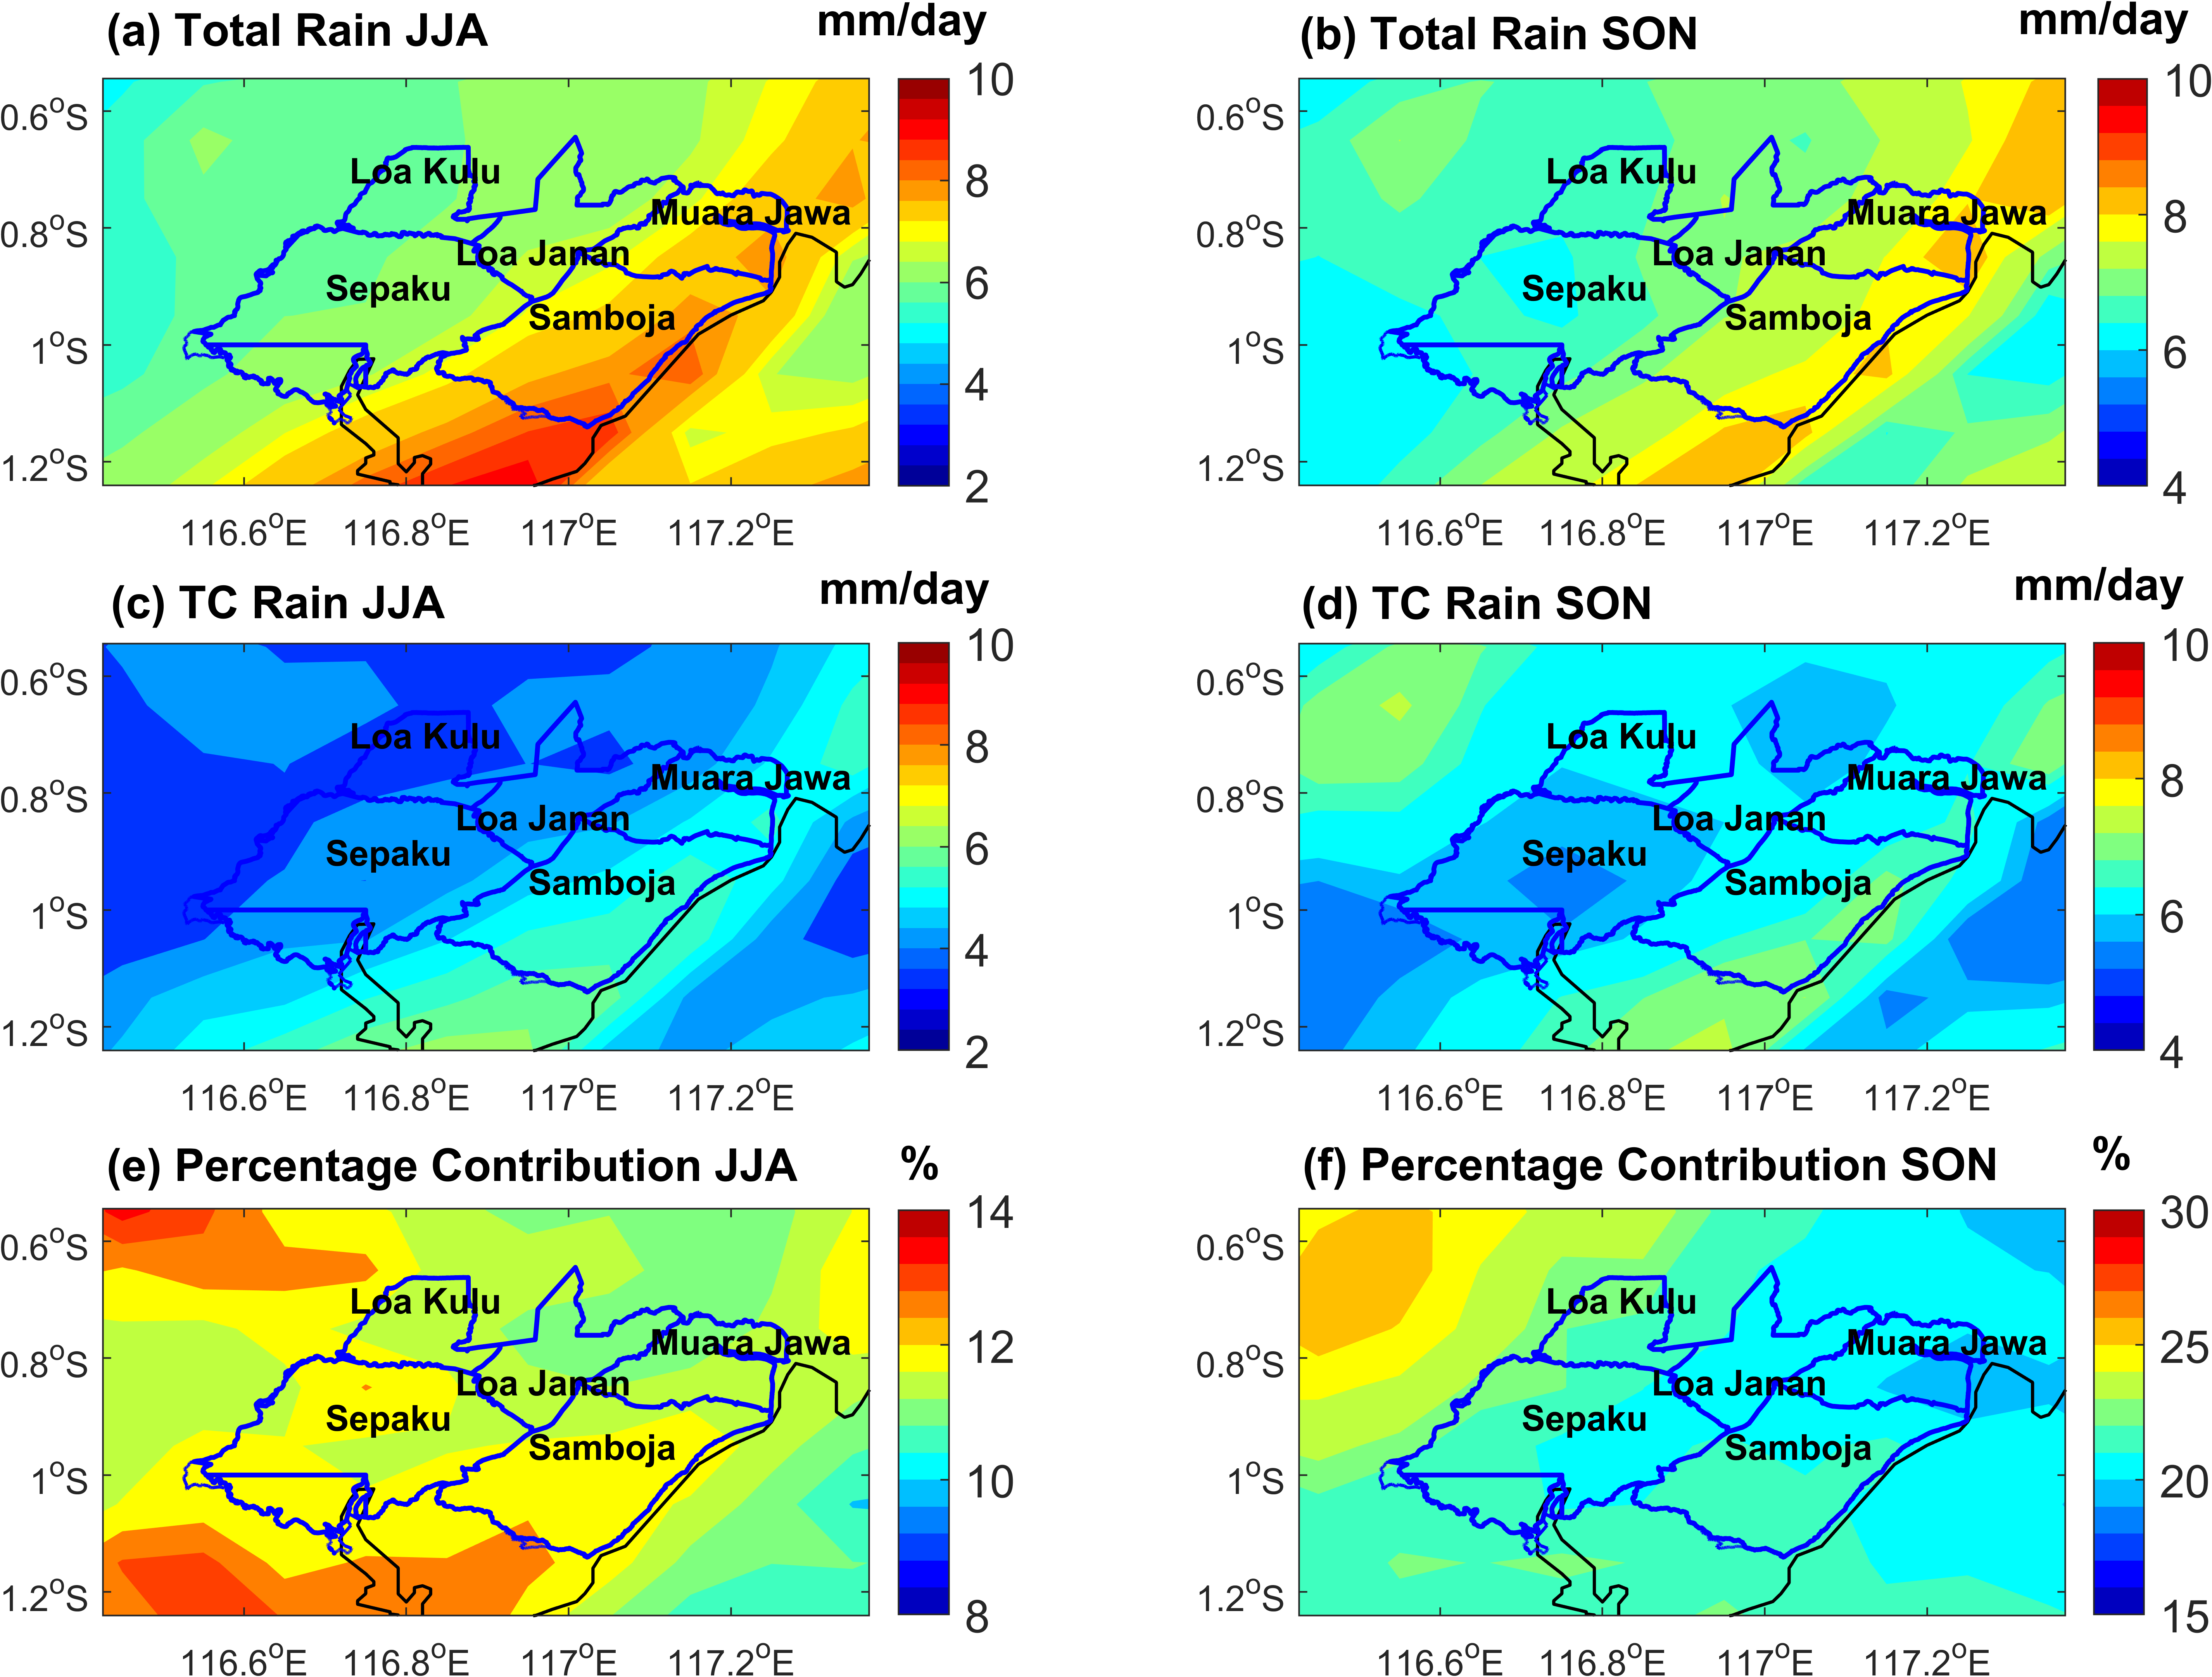
Figure 7 Daily average rainfall over the NC during the 2000 - 2024 period. Panels (a) and (b) show total rainfall during JJA and SON, respectively. Panels (c) and (d) depict tropical cyclone (TC)-induced rainfall during JJA and SON. Panels (e) and (f) present the percentage contribution of TC-induced rainfall to total rainfall during JJA and SON.
Modulation of TC rain by The Madden-Julian oscillation
The MJO significantly modulates both total rainfall and the specific contribution of TCs during the JJA and SON seasons (Figures 8 and 9). During JJA, total rainfall over the NC is strongly influenced by MJO Phases 2 and 3, which correspond to the active convective stages of the MJO over the Indian Ocean and the Maritime Continent. These phases produce the highest daily average total rainfall (Figure 8), reaching 10 - 15 mm/day, driven by enhanced large-scale moisture convergence and intensified low-level cyclonic circulation anomalies that favor deep convective development [40,61]. The active MJO convective envelope during these phases creates favorable conditions for organized precipitation systems by strengthening the monsoon trough and enhancing relative vorticity across the region [62,63]. Conversely, MJO Phases 6 to 8 represent convective suppression over Indonesia [34,64], characterized by anomalous anticyclonic circulation and subsidence that result in a marked decrease in rainfall to <6 mm/day.
The spatial distribution of TC rain indicated that the highest daily average, exceeding 13 mm/day, occurs during Phase 2, with maxima concentrated in Samboja and Loa Kulu. This finding supports the notion that MJO Phase 2 enhances regional atmospheric moisture and low-level convergence, which synergistically amplify precipitation associated with the TC-related outflow and moisture transport pathways [65]. The poleward edges of the MJOʼs moist-convective envelope provide particularly favorable environments for TC-related precipitation enhancement, as TC forming in these regions can efficiently tap into the abundant moisture reservoir established by the active MJO phase [66,67].
Despite the low total rainfall during the MJO suppression stage (Phases 5 - 8), the percentage contribution of TC rainfall to total rainfall peaks during Phases 5 and 6 (>20%). This increase is linked to the eastward shift of the MJO convective center into the Western Pacific, generating circulation anomalies that strengthen the monsoon trough over the South China Sea and the Western Pacific, regions that coincide with the origin of TCs. This intensification of the trough increases the likelihood of interactions between distant TCs and regional moisture flows toward Kalimantan. With total rainfall reduced during these phases, the relative influence of TC-related precipitation becomes more pronounced [11,68], even though absolute TC rainfall amounts may be lower than during active phases [69,70].
During SON (Figure 9), MJO dynamics continue to regulate rainfall in the NC but with greater variation in intensity. The highest daily average total rainfall (Figure 8) occurs during Phases 2 - 4 (>10 mm/day), consistent with active MJO conditions that promote enhanced local convection. In contrast, Phases 6 - 8 correspond to suppressed convection and a reduction in total rainfall to <8 mm/day, as the MJOʼs convective center shifts eastward and subsidence dominates over the Maritime Continent [71]. TC rain during SON reaches its highest daily average (>13 mm/day) during Phase 3, corroborating that the active MJO phase provides highly favourable conditions for TC intensification in the Western Pacific and subsequent moisture advection toward Kalimantan [65]. Importantly, the percentage contribution of TC rain reaches its maximum during Phases 6 and 7 (>30%) and is distributed relatively uniformly across the NC. This indicates that although the MJO suppresses total precipitation via convection during these phases, TCs assume a dominant role in determining the characteristics of rainfall [61,72]. The persistence of organized TC activity during suppressed MJO phases reflects the basin-scale circulation modifications that create favorable conditions for TC maintenance in the Western Pacific, even as local convection over Indonesia weakens [70,73].
Vertical wind shear (VWS) anomalies further elucidate the dynamic mechanisms driving the precipitation patterns observed in Figures 8 and 9. Figure 10 illustrates the spatial distribution of 850 - 200 hPa VWS anomalies across the Western Pacific for each MJO phase. Dynamically, the MJO suppressed phase (Phases 5 - 7) over the Indonesian region is associated with the formation of low-tropospheric westerly circulation anomalies over the Western Pacific. These anomalies strengthen the monsoon trough and enhance both relative vorticity and low-level convergence within TC genesis regions [62], creating a more favorable environment for cyclogenesis despite the suppressed convection over the Maritime Continent [63,74].
During the JJA season, several MJO phases exhibit moderate positive VWS anomalies across parts of the Western Pacific, particularly during Phases 3 - 4. This increased vertical wind differential between the upper and lower troposphere acts to limit TC intensification by disrupting the vertical alignment of the TC vortex and inhibiting the efficient ventilation of latent heat from the storm core [69,75]. However, regions surrounding the South China Sea and the Philippine Sea consistently maintain near-neutral to weakly negative VWS anomalies during Phases 2 - 3. These conditions coincide with the enhanced rainfall observed over NC (Figure 8), suggesting that relatively reduced shear in these areas facilitates TC-related moisture transport toward Kalimantan, despite the generally moderate VWS environment during JJA [40,61].
In contrast, the SON season exhibits more pronounced negative VWS anomalies over the Western Pacific basin, specifically during MJO Phases 6 and 7. This weakening of VWS creates highly favorable dynamical conditions for TC intensification and persistence. The synergy between increased low-level convergence and strengthened upper-level divergence (200 hPa) supports efficient cyclone ventilation, thereby enhancing the latent energy supply required for deep convective development [76]. This seasonal disparity explains why TCs during SON intensify more effectively and exhibit longer durations compared to JJA, ultimately contributing to the higher percentage of TC-related rainfall during suppressed MJO phases in SON [70,73].
Overall, VWS anomalies confirm that the MJO suppressed phase over Indonesia does not necessarily result in unfavorable conditions for TCs in the broader Western Pacific basin. Instead, the eastward displacement of MJO convection modifies large-scale circulation, fostering a supportive environment for TC activity through strengthened monsoonal flow and Rossby wave responses. This mechanism ultimately explains why the relative contribution of TC-induced rainfall peaks during the MJO suppressed phases, as the dynamical environment in the Western Pacific becomes more conducive to TC activity even while local precipitation in Indonesia declines [61,69]. The phase-dependent modulation of VWS represents a critical link between large-scale intraseasonal variability and regional TC impacts, with implications for subseasonal precipitation forecasting in NC [69,73].
To further examine the upper-tropospheric circulation associated with tropical cyclone activity, Figure 11 presents the spatial distribution of 200-hPa divergence anomalies over the Western Pacific for each MJO phase during the JJA and SON seasons. Upper-level divergence serves as a critical indicator of the efficiency of mass evacuation from convective systems and directly influences the maintenance of organized deep convection within TCs [66,69]. During the JJA season, enhanced divergence anomalies are most evident during MJO Phases 3 and 4 particularly over the Philippine Sea and the central Western Pacific (~135°E - 150°E). The strengthening of upper-level divergence in this region indicates a more favorable outflow environment that supports convective organization within tropical cyclones. Such conditions enhance the efficiency of mass evacuation from the storm core thereby facilitating sustained convective activity and contributing to the maintenance of cyclone intensity. These divergence patterns are broadly consistent with the relatively weak vertical wind shear observed in parts of the Western Pacific during the active MJO stages suggesting a dynamically coherent environment that supports TC development and associated moisture transport toward Kalimantan [61,74].
MJO Phases 5 - 7 generally exhibit weaker or locally negative divergence anomalies across the Maritime Continent and the South China Sea, indicating reduced upper-level ventilation over the Indonesian region during the suppressed convective phase of the MJO. Despite this reduction, localized areas of positive divergence persist over segments of the Western Pacific basin, implying that basin-scale circulation anomalies continue to support organized cyclone outflow even when large-scale convection over Indonesia weakens [63,73]. This spatial heterogeneity in upper-level divergence patterns reflects the complex interaction between the MJOʼs convective envelope and regional circulation features, with important implications for TC maintenance and precipitation generation [69].
During the SON season, the divergence anomaly patterns appear more heterogeneous but still reveal several regions of enhanced upper-tropospheric outflow. In particular, Phase 3 shows a distinct center of positive divergence near the Philippine Sea, which coincides with the period of intensified tropical cyclone activity and elevated TC-related rainfall contributions identified earlier (Figure 9). This enhanced divergence facilitates the efficient removal of mass from the upper troposphere, allowing for sustained deep convection and moisture convergence at lower levels [66,67]. Conversely, Phases 6 - 7 tend to display weaker divergence anomalies across much of the domain, suggesting a reduction in large-scale convective forcing. Nevertheless, the persistence of localized divergence centers over the Western Pacific indicates that tropical cyclones may continue to maintain organized outflow structures under favorable basin-scale circulation conditions, even during periods of reduced large-scale divergence [73,77].
The coupling between upper-level divergence and lower-level convergence represents a fundamental mechanism through which the MJO modulates TC-related precipitation. During active MJO phases, enhanced upper-level divergence over the Western Pacific creates a favorable environment for TC intensification by promoting efficient vertical mass transport and latent heat release [40,74]. During suppressed MJO phases, the spatial redistribution of divergence anomalies reflects the eastward propagation of the MJOʼs circulation features, with implications for the location and intensity of TC activity across the basin [63,69].
The WVF anomaly patterns during JJA and SON (Figure 12) reveal the atmospheric mechanisms underlying this variation in rainfall. The WVF anomaly (TC-induced - Mean) is calculated from the difference between the WVF on the days of TC occurrence and the seasonal climatological WVF. In this study, water vapor flux was vertically integrated over the 1,000 - 500 hPa layer to represent lower-to-mid tropospheric moisture transport, which is primarily responsible for supplying inflow moisture to tropical cyclones. This boundary was chosen because it physically encompasses more than 90% of the total atmospheric water vapor mass in the tropics [78], capturing the dominant moisture transport processes that fuel TC convection and precipitation [69,75].
During the JJA season, phases 2 to 3 show a very strong moisture convergence area, with WVF values reaching ~500 kg m⁻¹ s⁻¹, especially in the Philippine Sea region. This strengthening of WVF is supported by intense southwest monsoon winds, allowing TC circulation to pull large amounts of water vapor from the Western Pacific towards the convection center. The enhanced moisture availability during these phases provides the thermodynamic fuel necessary for sustained deep convection and heavy precipitation, explaining the elevated TC rainfall contributions observed over NC during Phases 2 - 3 (Figure 8). The spatial coherence of the moisture convergence zone with the TC track and the regional circulation pattern indicates efficient coupling between the large-scale MJO-induced flow and the TC-scale circulation [62,63]. Conversely, phases 5 to 8 show a weakening of the WVF relative to phases 2 - 3. Although the cyclonic pattern remains clearly visible, the WVF anomaly decreases, and the convergence area becomes more limited. This decrease is related to the MJO phase entering a suppression over the Indonesian region, resulting in a convective background and a southwest monsoon flow that is weaker than in the early phases. As a result, the TC continues to contribute to water vapor advection, but not as much as during the active MJO phase (phases 2 - 3), leading to lower absolute TC rainfall amounts despite the higher percentage contribution to total rainfall [69,73].
During the SON season in phases 3 to 5, the magnitude of the WVF anomaly reaches >200 kg m⁻¹ s⁻¹ and is concentrated in the 6°N - 30°N latitude region covering the Philippine Sea to the Western Pacific Ocean. This pattern strongly indicates the entry of a much more intense supply of water vapor from the tropics into the TC convergence zone, which supports cyclone intensification and activity. The enhanced moisture transport during these phases reflects the favorable alignment of the MJOʼs circulation anomalies with the climatological moisture sources in the Western Pacific, creating optimal conditions for TC-related precipitation generation [74,79]. Conversely, phases 6 to 8 show an apparent decrease in WVF anomaly values compared to phases 3 to 5. Although the convergence pattern associated with TC movement remains, its intensity tends to weaken. This pattern reflects a reduction in the strength of the water vapor flow carried by the TC circulation [71]. This weakening occurs despite the fact that Phases 6 - 7 correspond to favorable dynamical conditions for TC genesis and intensification in the Western Pacific, as indicated by reduced VWS and enhanced monsoon trough activity [63,73]. The apparent contradiction between favorable dynamical conditions and reduced moisture transport during Phases 6 - 8 suggests that while TCs can maintain their structural integrity and intensity during suppressed MJO phases, the large-scale moisture supply from the broader tropical atmosphere is diminished compared to active MJO phases [66,77].
The vertically integrated moisture transport patterns reveal that the MJO modulates TC-related precipitation not only through dynamical mechanisms (VWS, divergence, vorticity) but also through thermodynamic pathways involving moisture availability and transport efficiency. The phase-dependent variations in WVF magnitude and spatial distribution directly influence the intensity and spatial extent of TC-related rainfall over NC, with implications for flood risk assessment and hydrological forecasting [40,75].
To further support these findings, historical analysis of extreme events (Table 1) confirms that significant 7-day rainfall accumulations in NC often coincide with specific MJO phases (amplitude > 1.0). Notably, tropical cyclones such as Chanthu (2021) and Yagi (2006) produced substantial rainfall during active MJO phases 3 and 4. Although tropical cyclones infrequently make direct landfall over Kalimantan, their indirect impacts mediated through large-scale moisture transport and enhanced regional convergence can nonetheless generate considerable rainfall, particularly when TCs interact with favorable MJO circulation anomalies [66,80].
Table 1 illustrates the most impactful tropical cyclone events from 2000 - 2024 along with their corresponding MJO phases, highlighting how TCs exploit available moisture and circulation anomalies to drive extreme precipitation in NC during both active and suppressed MJO conditions. The historical record reveals that extreme rainfall events can occur across a range of MJO phases, but the physical mechanisms differ substantially: during active phases (2 - 4), extreme rainfall results from the combination of enhanced large-scale moisture convergence and TC-induced circulation, while during suppressed phases (5 - 7), extreme rainfall reflects the dominance of TC-related processes in an environment of reduced background precipitation [69,77]. This phase-dependent variability in the mechanisms of extreme rainfall generation has important implications for subseasonal forecasting and early warning systems, as different MJO phases require different predictive approaches and lead times [73,81].
Table 1 Summary of the most impactful tropical cyclone (TC) events and their corresponding active Madden-Julian Oscillation (MJO) phases (amplitude > 1.0) over the Nusantara City (NC) region. The associated rainfall (mm) represents the 7-day cumulative precipitation during the ±3-day window centered on the peak intensity (Vmax).
Year |
TC Name |
Season |
MJO Phase |
TC Associated Rainfall (mm) |
2000 |
XANGSANE |
SON |
6 |
43.04 |
2001 |
DANAS |
SON |
8 |
61.31 |
2006 |
YAGI |
SON |
4 |
93.05 |
2006 |
SHANSHAN |
SON |
3 |
112.88 |
2009 |
CHOI-WAN |
SON |
3 |
33.58 |
2010 |
MEGI |
SON |
6 |
61.40 |
2012 |
BOLAVEN |
JJA |
3 |
70.70 |
2016 |
MERANTI |
SON |
4 |
82.93 |
2018 |
MARIA |
JJA |
4 |
22.10 |
2020 |
MOLAVE |
SON |
6 |
39.95 |
2020 |
GONI |
SON |
7 |
45.65 |
2021 |
CHANTHU |
SON |
3 |
102.45 |
2024 |
YINXING |
SON |
1 |
23.31 |
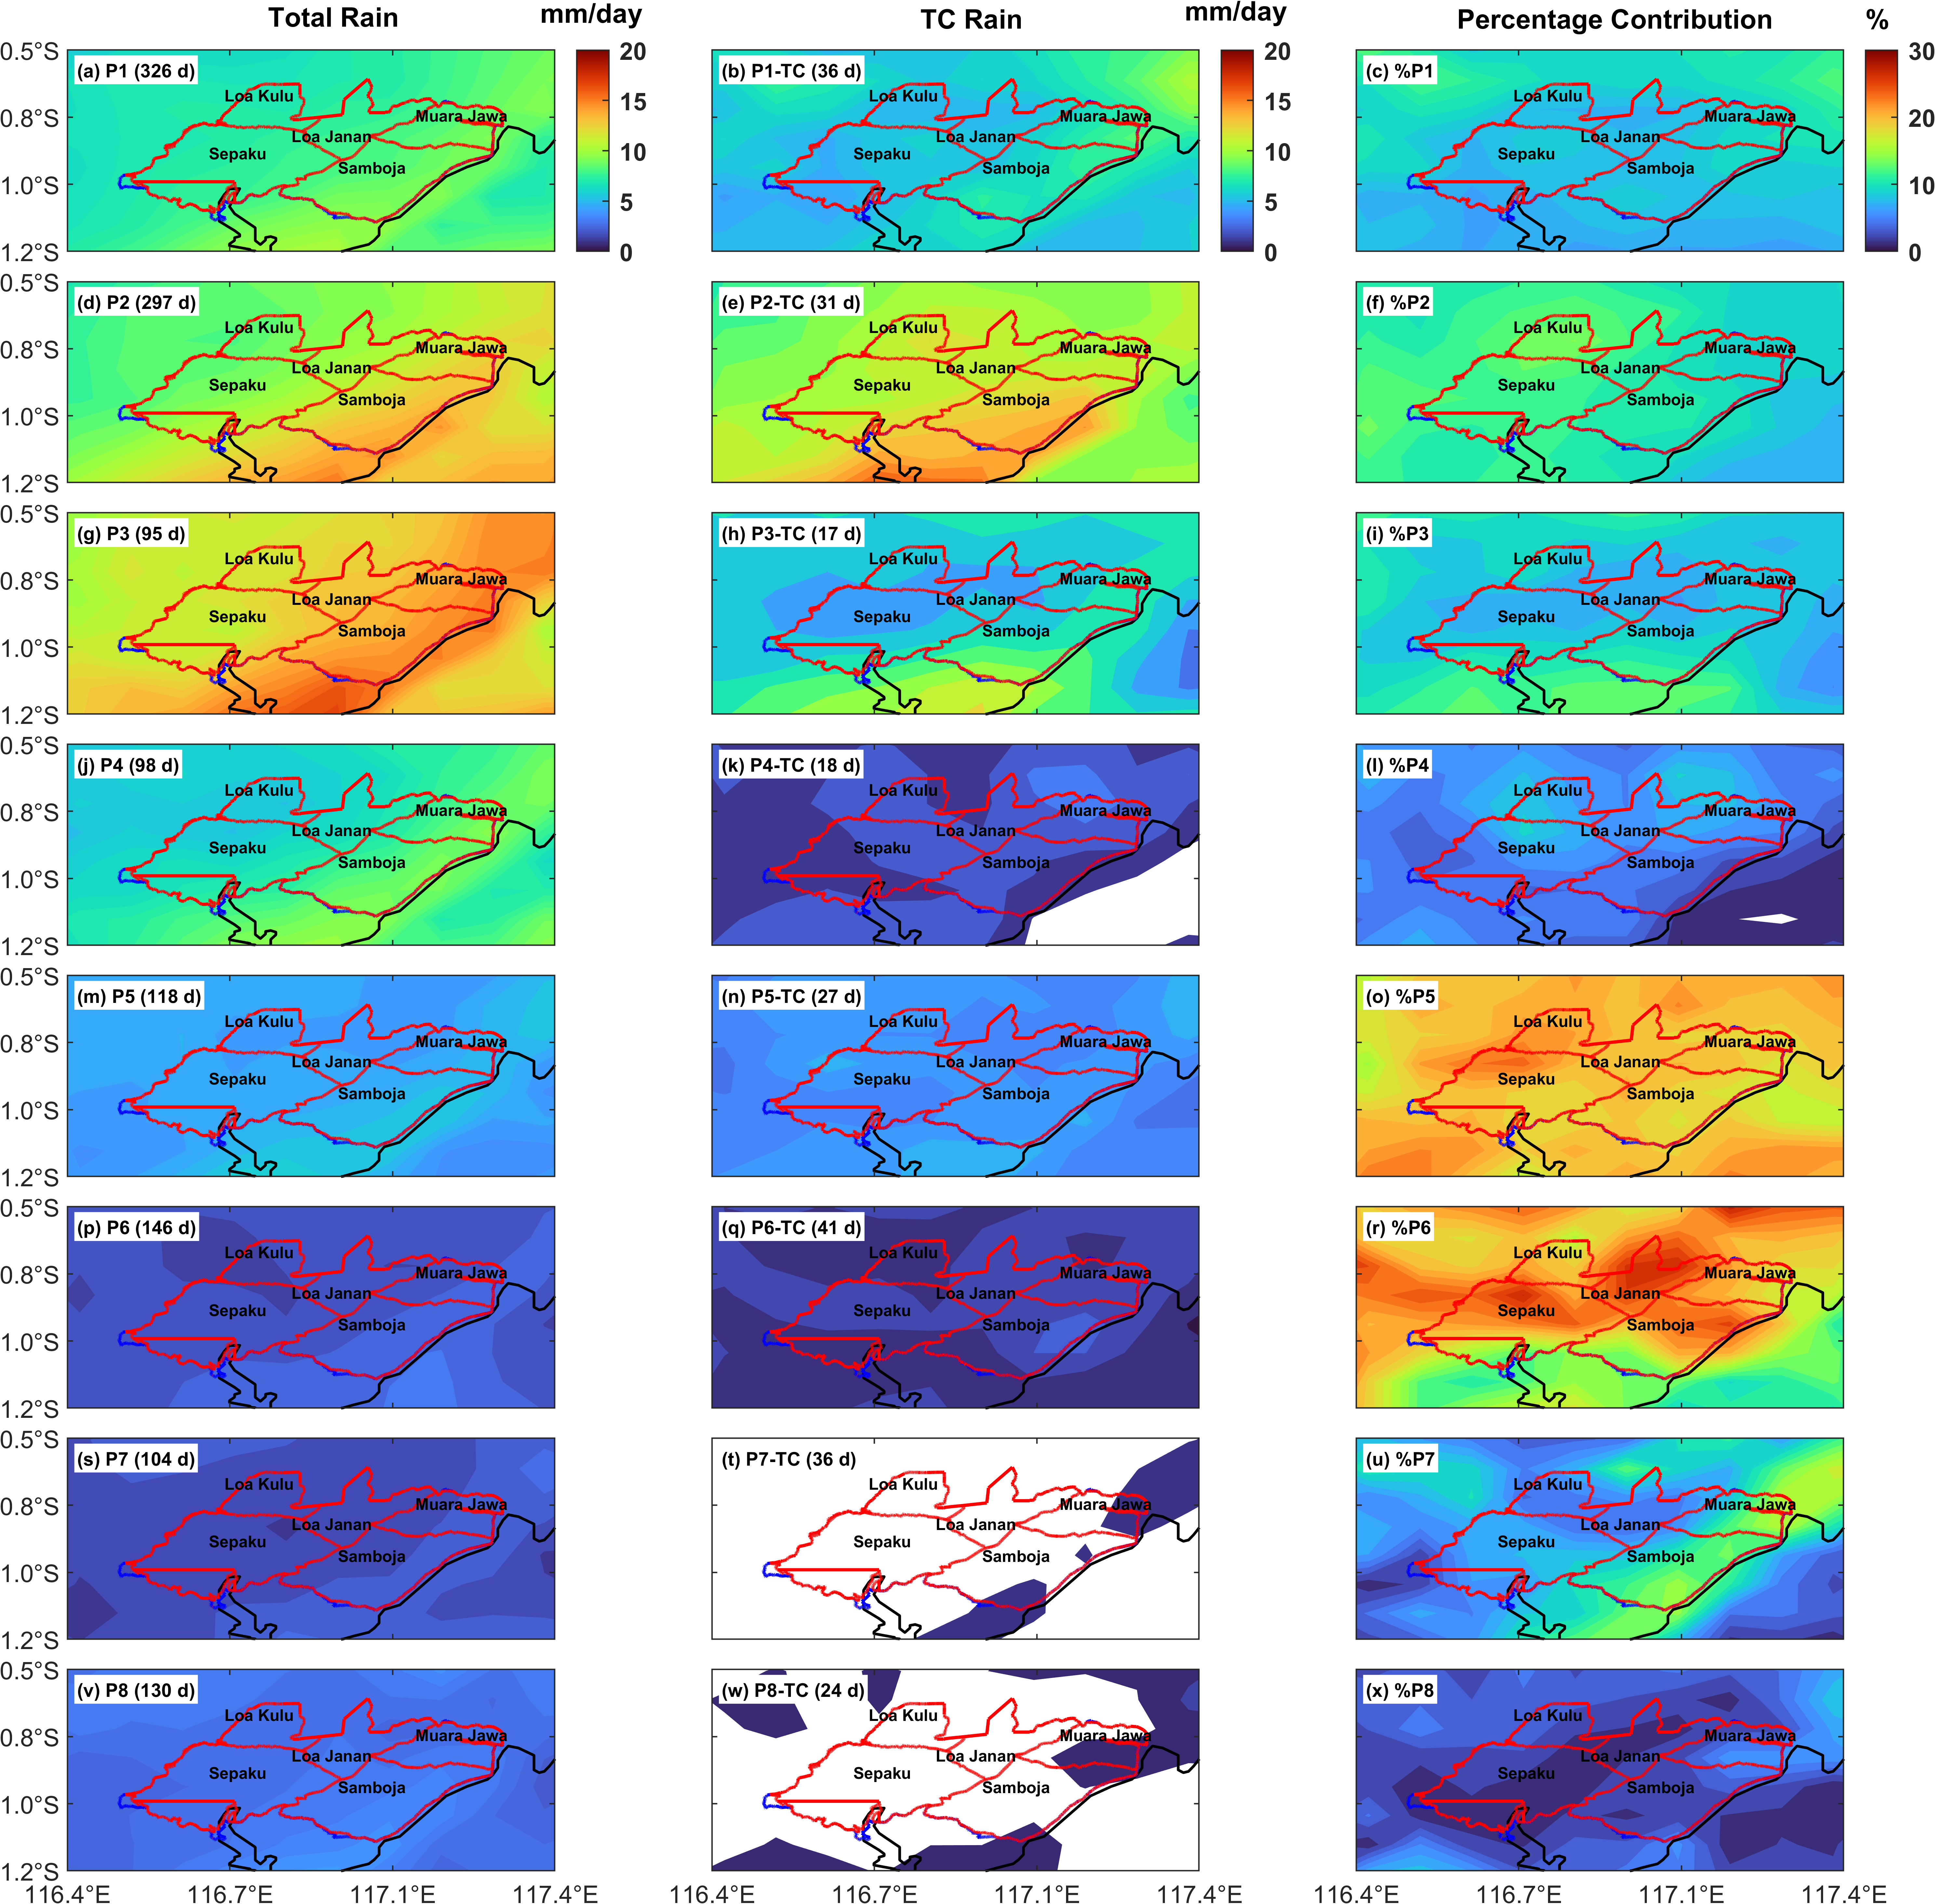
Figure 8 Daily mean total rainfall, tropical cyclone-induced rainfall (TC rain), and the percentage contribution of TC rainfall during the JJA season over NC for the period 2000 - 2024, stratified by MJO phase. P denotes the MJO phase, and the number in parentheses indicates the total number of days associated with each phase.
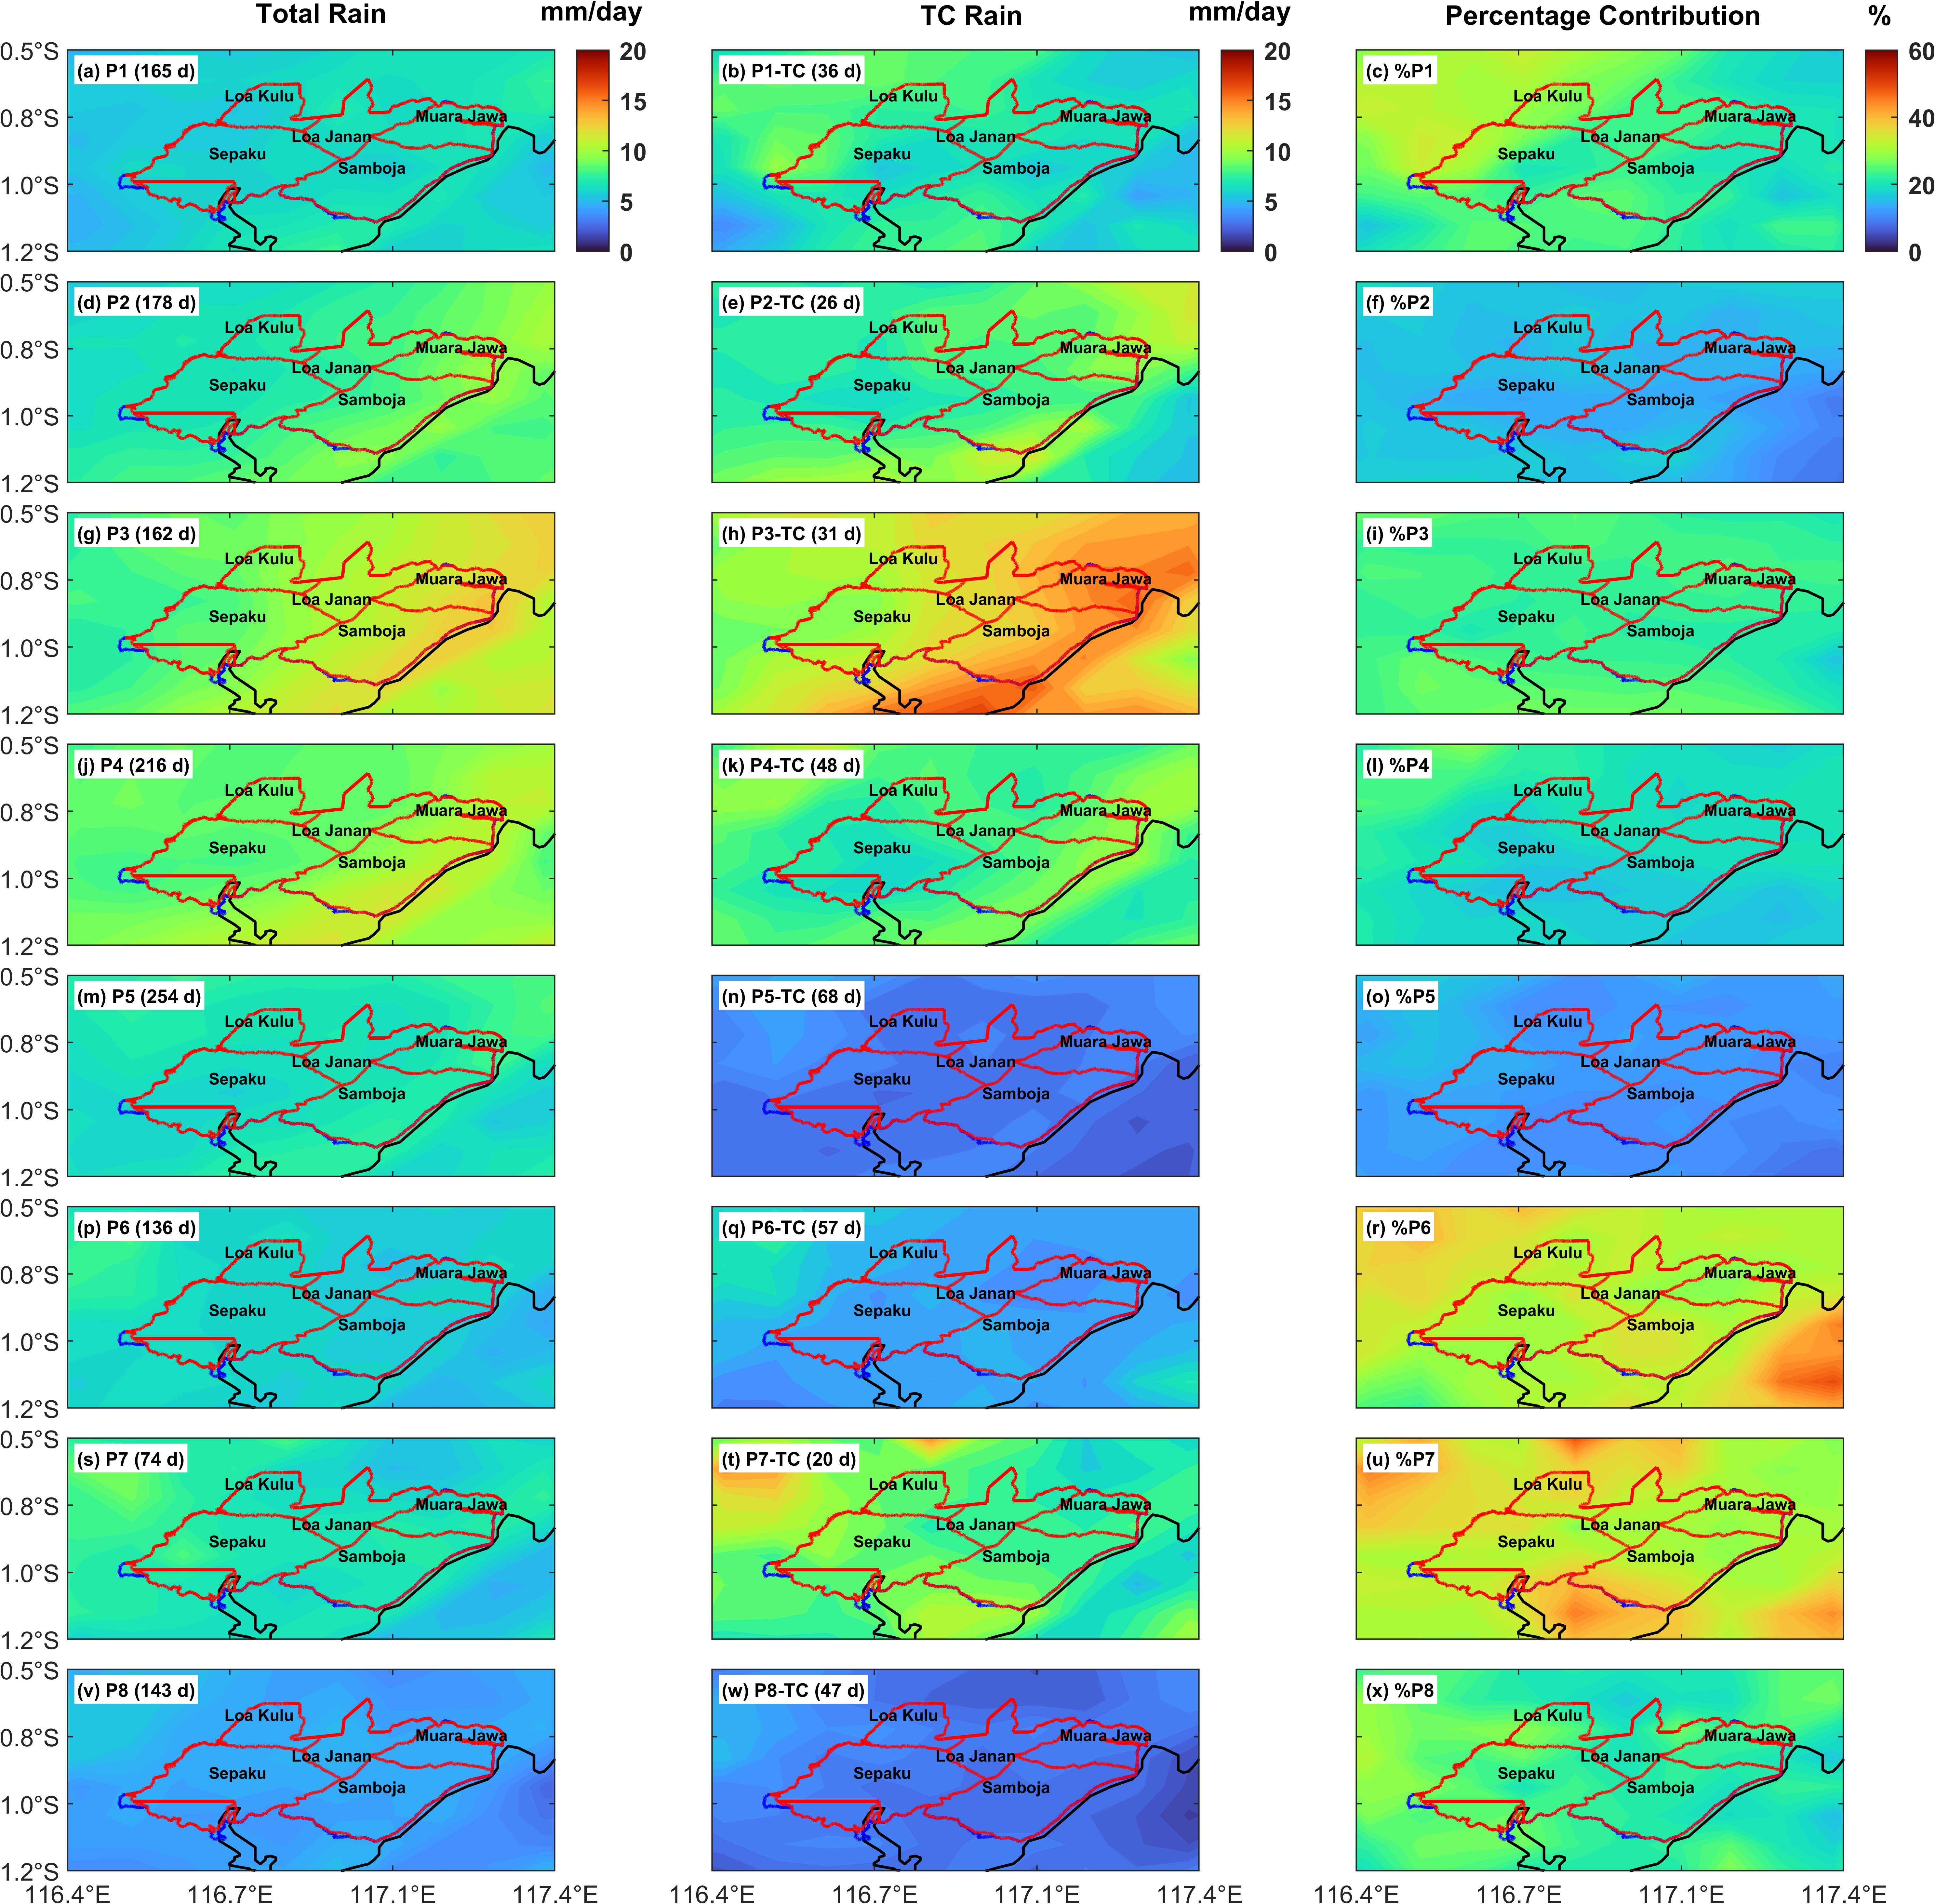
Figure 9 Daily mean total rainfall, tropical cyclone-induced rainfall (TC rain), and the percentage contribution of TC rainfall during the SON season over NC for the period 2000 - 2024, stratified by MJO phase. P denotes the MJO phase, and the number in parentheses indicates the total number of days associated with each phase.
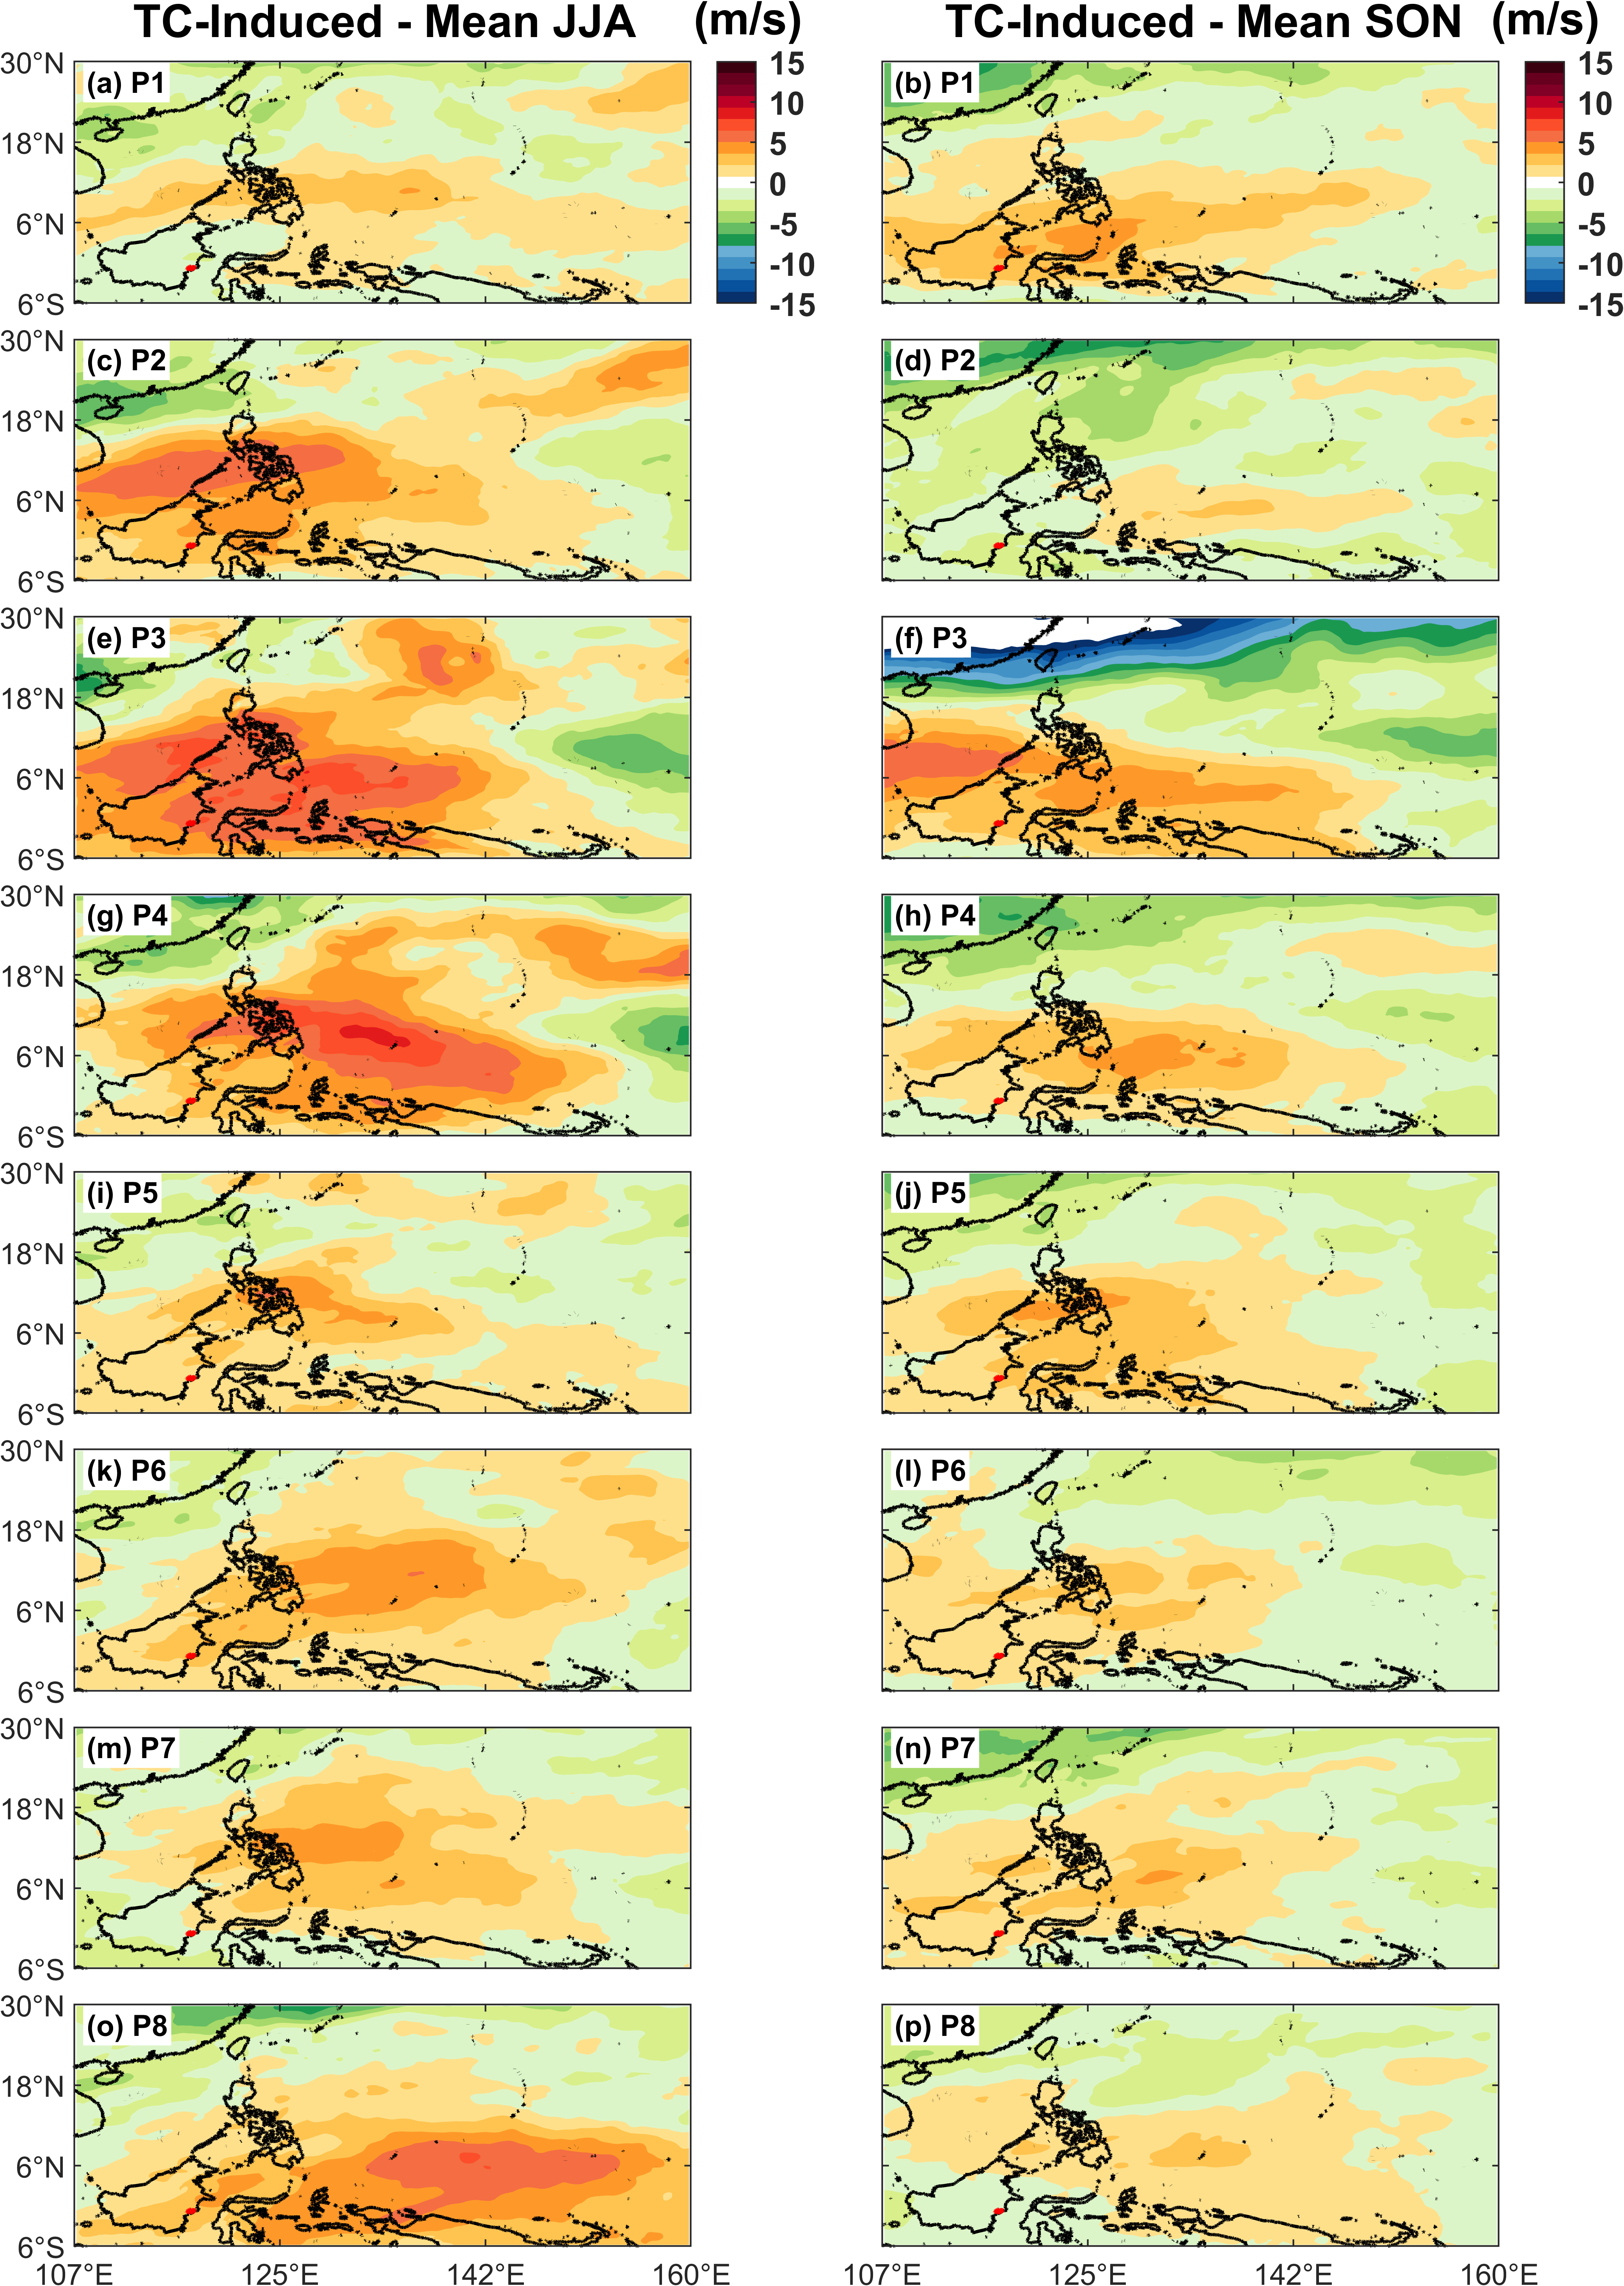
Figure 10 Vertical wind shear anomalies (m s⁻¹) over the Western Pacific Ocean during JJA and SON for each MJO phase over the 2000 - 2024 period. Anomalies are defined as the difference between tropical cyclone (TC)-influenced conditions and the corresponding climatological mean for each phase. P denotes the MJO phase.
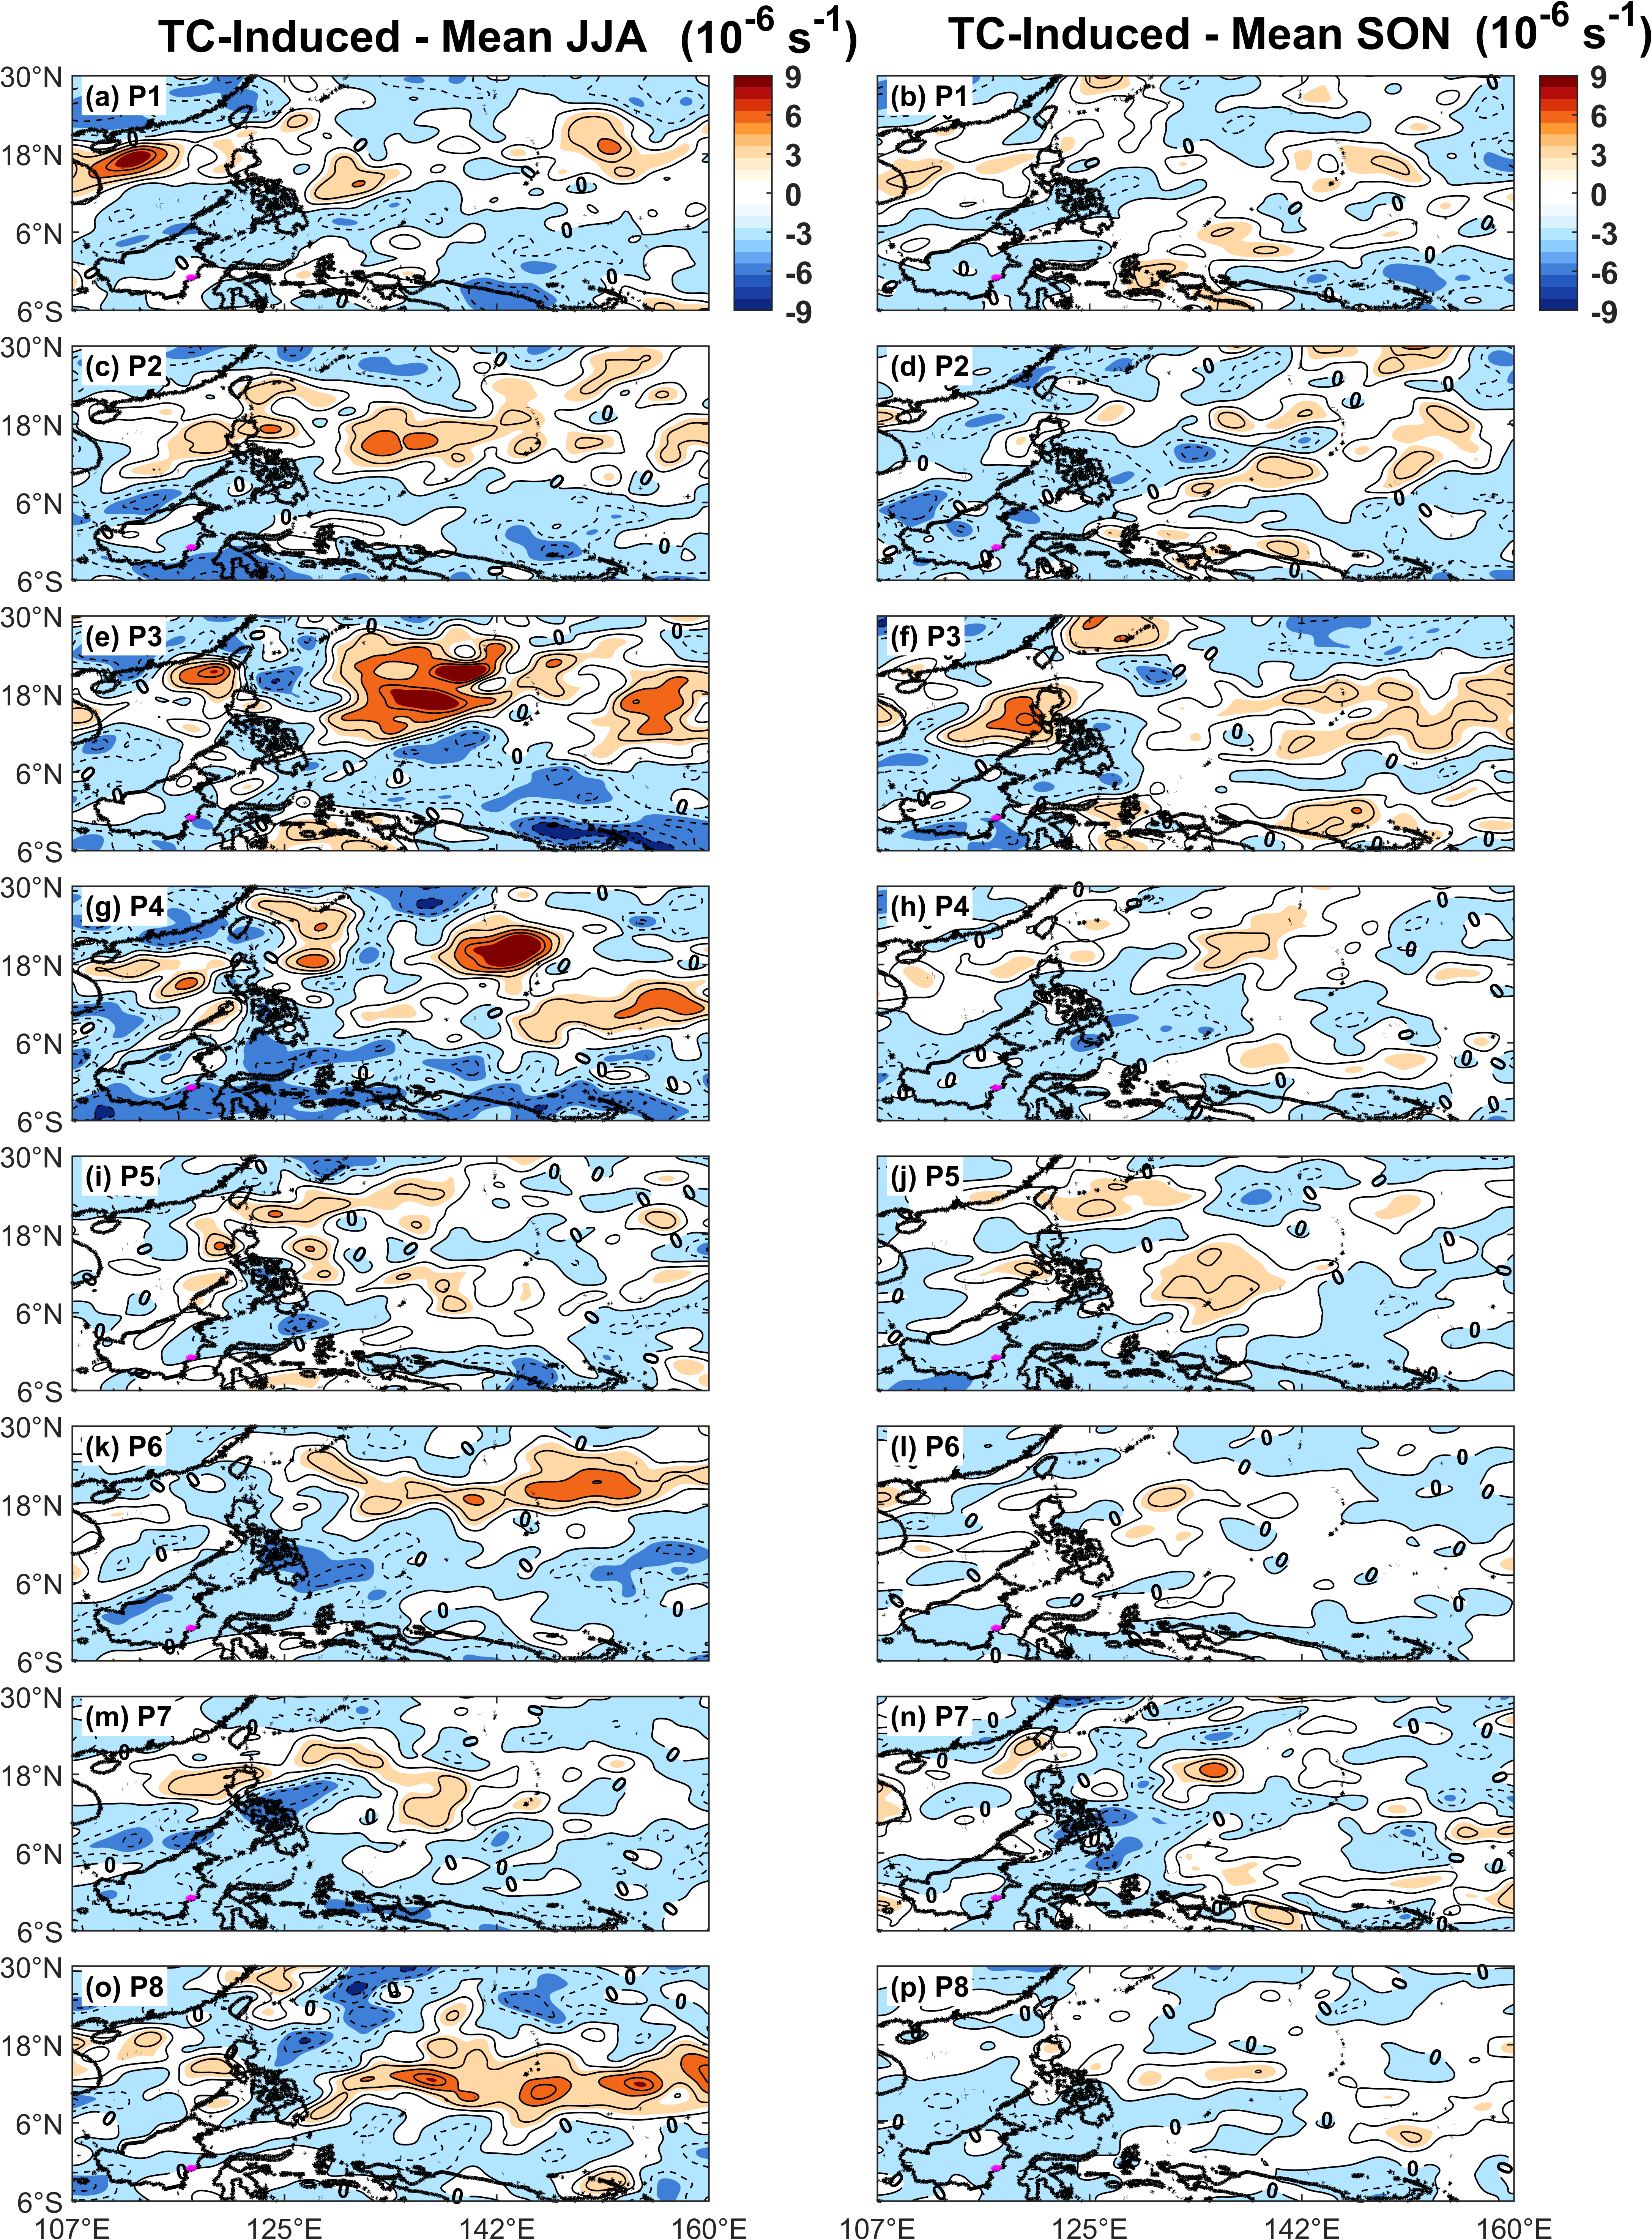
Figure 11 200-hPa divergence anomalies (contours; interval = 3×10⁻⁶ s⁻¹) over the Western Pacific for each MJO phase during JJA and SON over the 2000 - 2024 period. Anomalies are defined as the difference between tropical cyclone (TC)-influenced conditions and the corresponding climatological mean for each phase. P denotes the MJO phase.
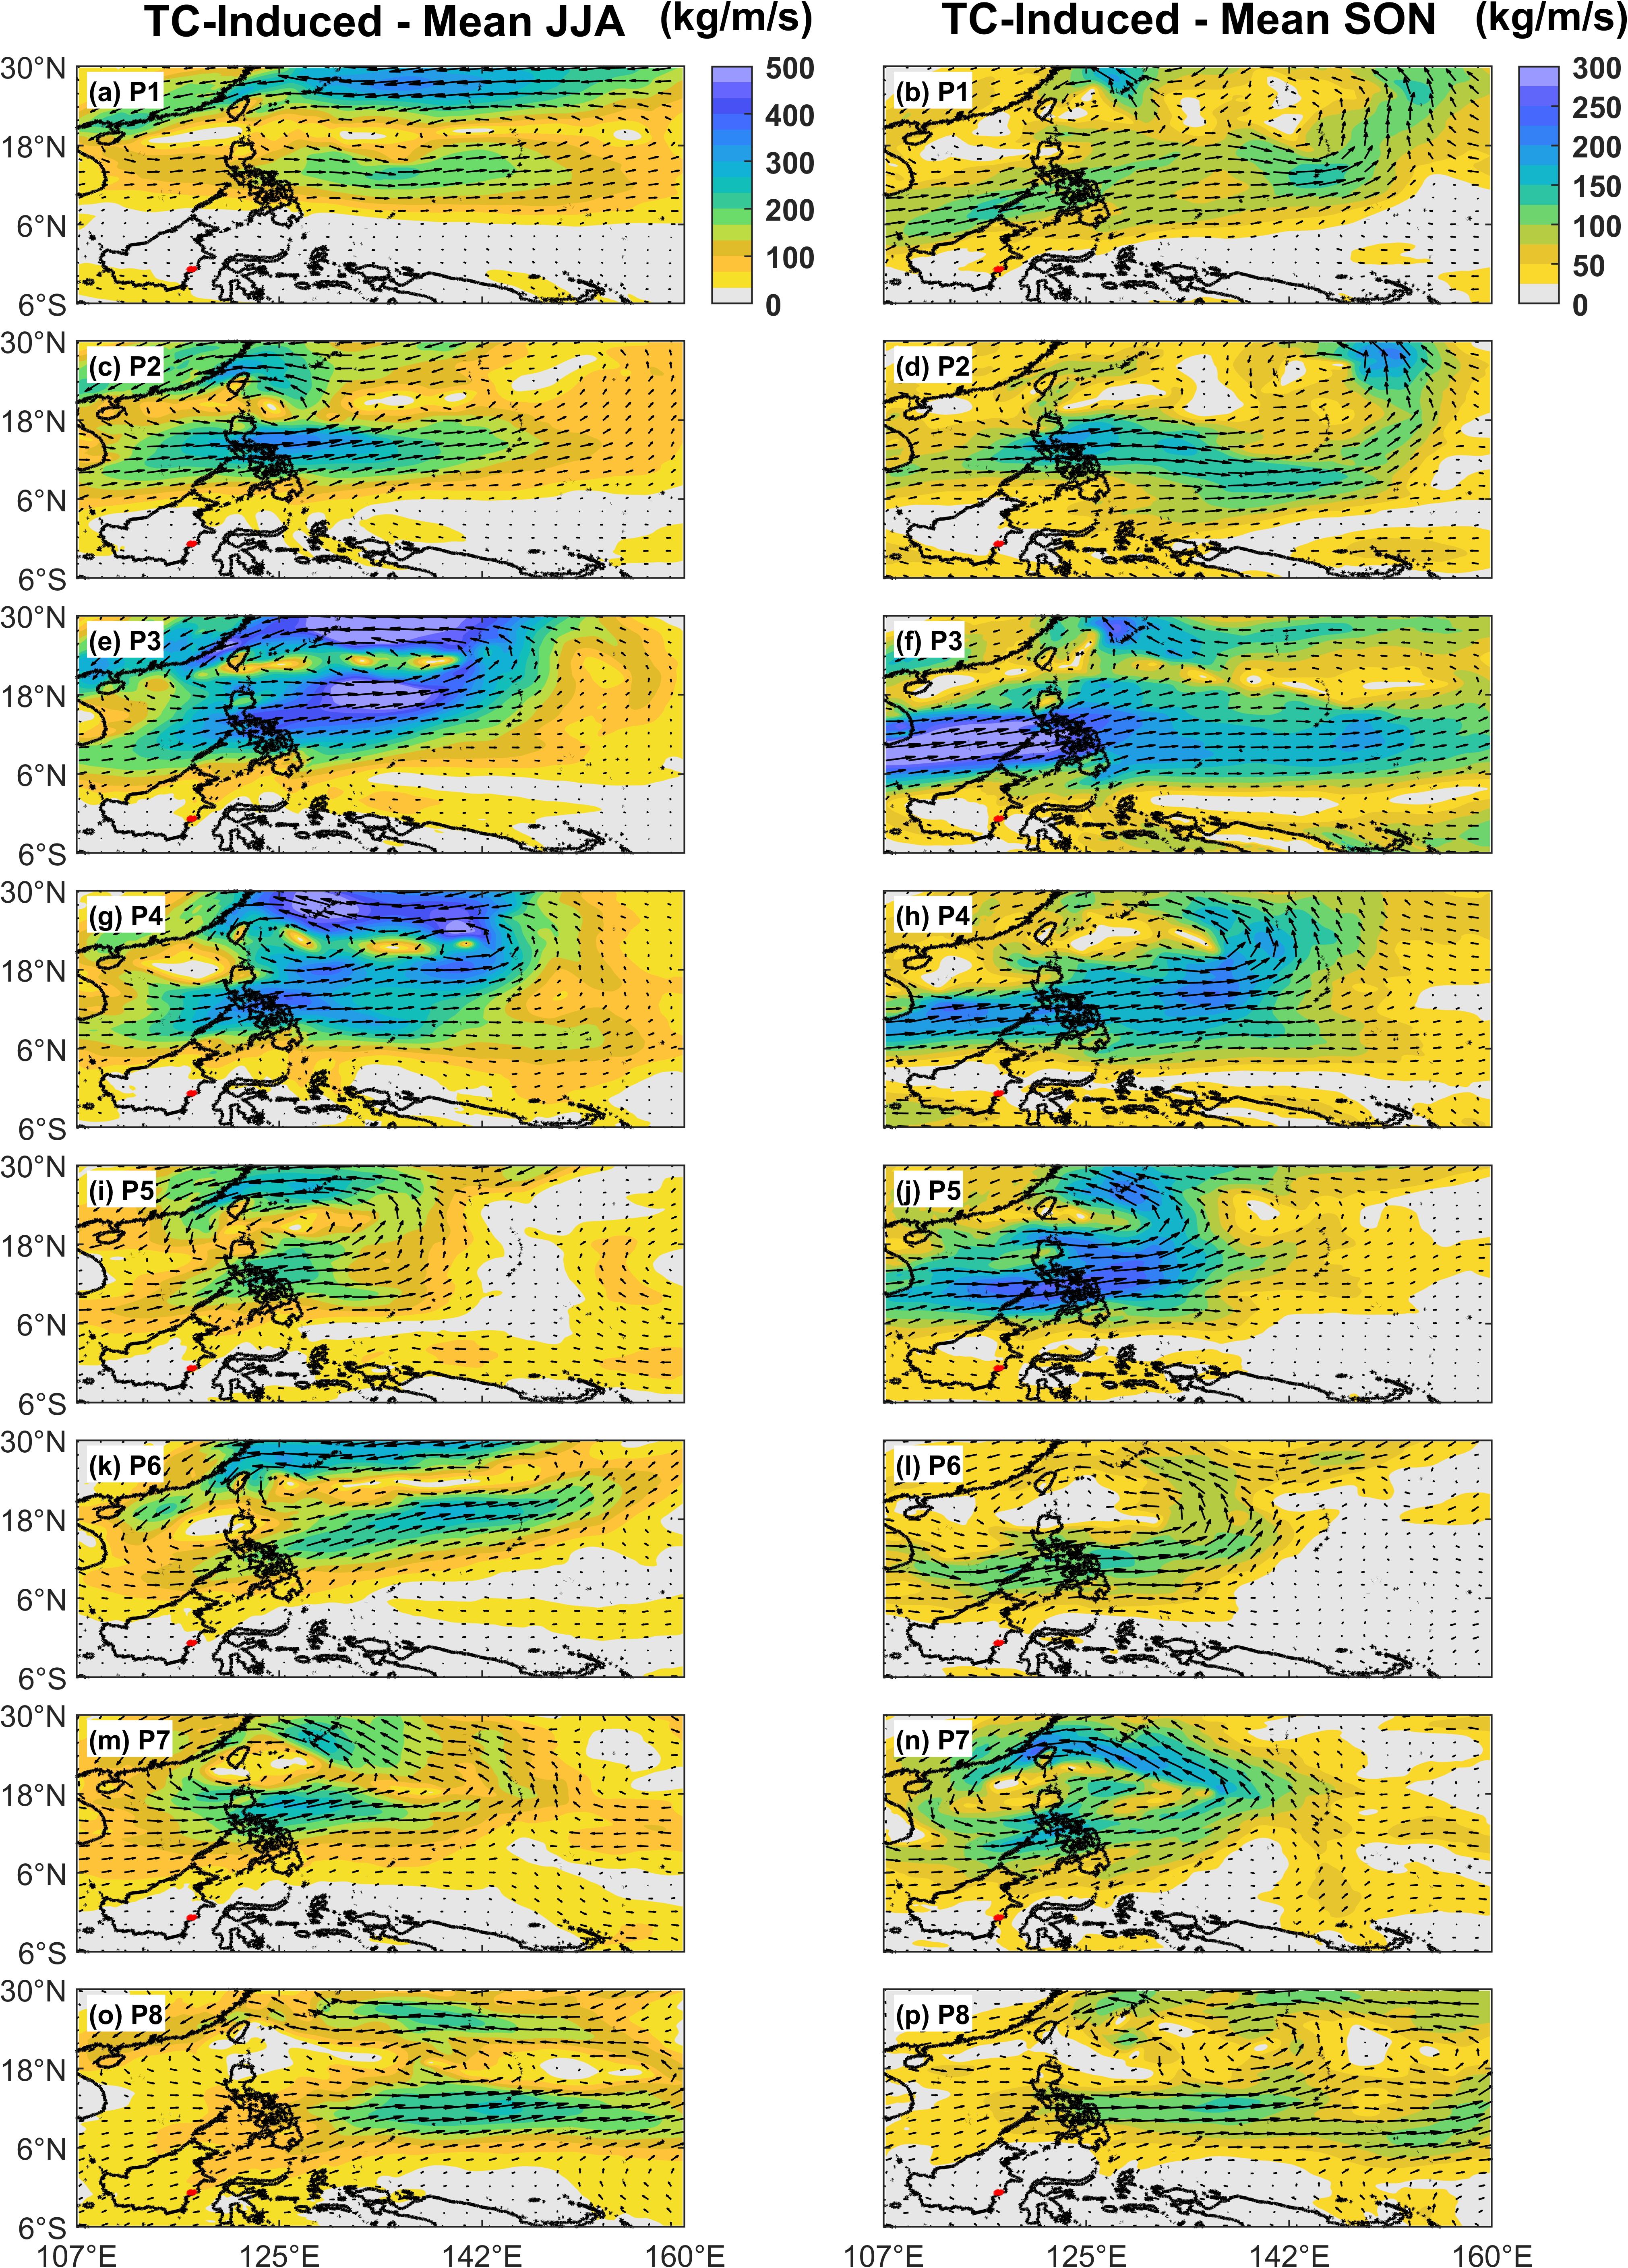
Figure 12 Vertically integrated water vapor flux anomalies (kg/m/s) and moisture flux vectors anomalies over the Western Pacific Ocean during the JJA and SON seasons from 2000 - 2024 for each MJO phase. The anomalies are calculated as the difference between TC-induced conditions and the climatological state for each corresponding phase. P denotes the MJO phase.
Trend in tropical Cyclone-Induced rainfall
Analysis of the annual variation of average daily rainfall in the NC during 2000 - 2024 (Figure 13) demonstrates the dominance of rainfall unrelated to tropical cyclones, consistent with earlier spatial and seasonal findings (Figures 2 - 6). The average total daily rainfall ranges from 6 to 10 mm/day, whereas TC rain only accounts for approximately 0.5 - 1 mm/day. This difference indicates that annual rainfall in the NC is predominantly driven by non-TC mechanisms, such as local convective processes, mesoscale convective systems (MCS), and regional monsoonal circulation, that occur more frequently and persist longer than TC-related rainfall [82]. The episodic nature of TC rainfall, despite its relatively small annual contribution, underscores the importance of distinguishing between climatological means and event-based hazard characteristics when assessing hydrometeorological risk.
A 25-year linear trend analysis revealed contrasting tendencies in annual rainfall. Total rainfall exhibits a slight upward trend of 0.014 mm/day/year, whereas TC rainfall declines slightly at −0.006 mm/day/year. The increase in total rainfall may relate to rising sea surface temperatures and enhanced moisture availability [83], yet the intensity and frequency of TCs do not necessarily follow the same trajectory, a conclusion supported by prior studies documenting diverse regional TC rainfall patterns across the globe [28,84]. Recent observational evidence from the Western North Pacific indicates that TC rain rates exhibit opposite responses to ENSO phases, with increases of 9% during El Niño years and decreases of 14% during La Niña years since 2013, driven by shifts in track density and moisture availability [85]. These findings highlight the complex, non-linear relationship between large-scale climate forcing and regional TC rainfall responses.
However, statistical analysis indicated that both rainfall trends in the NC were not significant at the 95% confidence level. This non-significance is consistent with the inherent characteristics of tropical rainfall, which is marked by high interannual variability, limited recurrence of extreme disturbances, and the relatively short 25-year observation window for capturing long-term climate signals [86]. The weak and statistically non-significant downward trend in TC-induced rainfall is further attributable to the low frequency of cyclones directly affecting Kalimantan. Similar findings have been reported in other tropical regions, where substantial interannual variability obscures long-term trend detection despite increases in extreme TC rainfall magnitude [87]. Accordingly, the present analysis should be interpreted as evidence of interannual variability rather than as robust detection of long-term climatic change. The 2000 - 2024 period is therefore more appropriate for characterizing seasonal and intraseasonal modulation of rainfall than for attributing long-term trends in TC-induced precipitation.
In addition, interannual variability in the Maritime Continent region is strongly influenced by large-scale climate phenomena such as the ENSO, which often occurs in conjunction with the MJO and has the potential to modulate TC activity and rainfall distribution [88]. This interconnection creates a complex combined signal, in which ENSO can modulate the amplitude and spatial propagation of MJO convective anomalies [89]. During El Niño summers, enhanced low-level westerlies and a strengthened monsoon trough increase TC activity and rainfall over the north-central Philippines, while La Niña conditions produce opposite effects [90]. Furthermore, Western North Pacific TCs interact with MJO phases to suppress Maritime Continent rainfall across all MJO phases, alleviating rainfall enhancement during convective phases and aggravating suppression during suppressive phases through moisture divergence and upper-tropospheric subsidence mechanisms [82]. Because ENSO, MJO, and TC activity can overlap in time and influence rainfall through different physical pathways, caution is required in interpreting any apparent annual trend without explicitly isolating these coupled modes of variability.
Despite the small annual TC rainfall contribution, it is important to emphasize that the hazard associated with TCs is episodic, pronounced at shorter temporal scales, and characteristic of an event-based hazard. TC rainfall plays a disproportionately large role during specific seasons, contributing more than 20% of the total rainfall during JJA and exceeding 30% during SON. Consequently, TCs act as strong catalysts for extreme rainfall events in NC. Their impact is indirectly felt through enhanced moisture flux convergence and intensified northwesterly monsoon advection triggered by TC activity over the Western Pacific, which amplifies extreme rainfall in NC [87,91]. In the Philippines, for example, TC rainfall accounts for up to 54% of annual rainfall in northern Luzon, with wet years experiencing significantly higher TC numbers (4 TCs versus 1.67 in dry years) and TC-induced rainfall (330 mm versus 75 mm) [91,92]. These findings underscore that while TC rainfall may not exhibit statistically significant long-term trends, individual TC events can deliver extreme precipitation totals that dominate seasonal and annual rainfall budgets in affected regions.
From a risk-management perspective, this distinction is critical for Nusantara City. Even when the annual TC rainfall signal is small, short-duration TC-enhanced rainfall episodes can still elevate runoff generation, exceed urban drainage capacity, and accelerate slope instability when they coincide with antecedent wet conditions. Therefore, the practical relevance of TC-induced rainfall lies less in its annual mean contribution and more in its ability to trigger high-impact hydrometeorological events over short timescales.
TC-induced rainfall does not exhibit a statistically significant long-term annual trend in the NC. Despite this, hydrometeorological risks remain elevated during the peak TC season, and the episodic yet high-impact nature of TC events warrants prioritization in disaster risk reduction strategies. The relatively short 25-year observation period limits the robustness of long-term climate trend detection and renders the analysis more suitable for examining seasonal and intraseasonal variability. For this reason, the present findings should not be used to infer that TC-related hazard is diminishing in a practical sense. Instead, they indicate that hazard assessment in NC should prioritize seasonal windows of heightened sensitivity, particularly when TC activity coincides with favorable MJO phases and enhanced monsoonal moisture transport. Despite the absence of a significant annual trend, episodic yet high-impact TC events warrant prioritization in disaster risk reduction strategies, hydrological modeling frameworks, and the calibration and evaluation of global climate models using satellite-based precipitation products [93]. This information can be directly translated into operational planning through sub-seasonal early warning, flood preparedness, slope-stability monitoring, and drainage design adjustments during JJA and especially SON, when remote TC effects are most pronounced. Such efforts are essential to enhance the resilience of NC to compound MJO-TC extreme rainfall events, particularly given projections of increased TC rainfall intensity under future warming scenarios, even if TC frequency may decline [94].
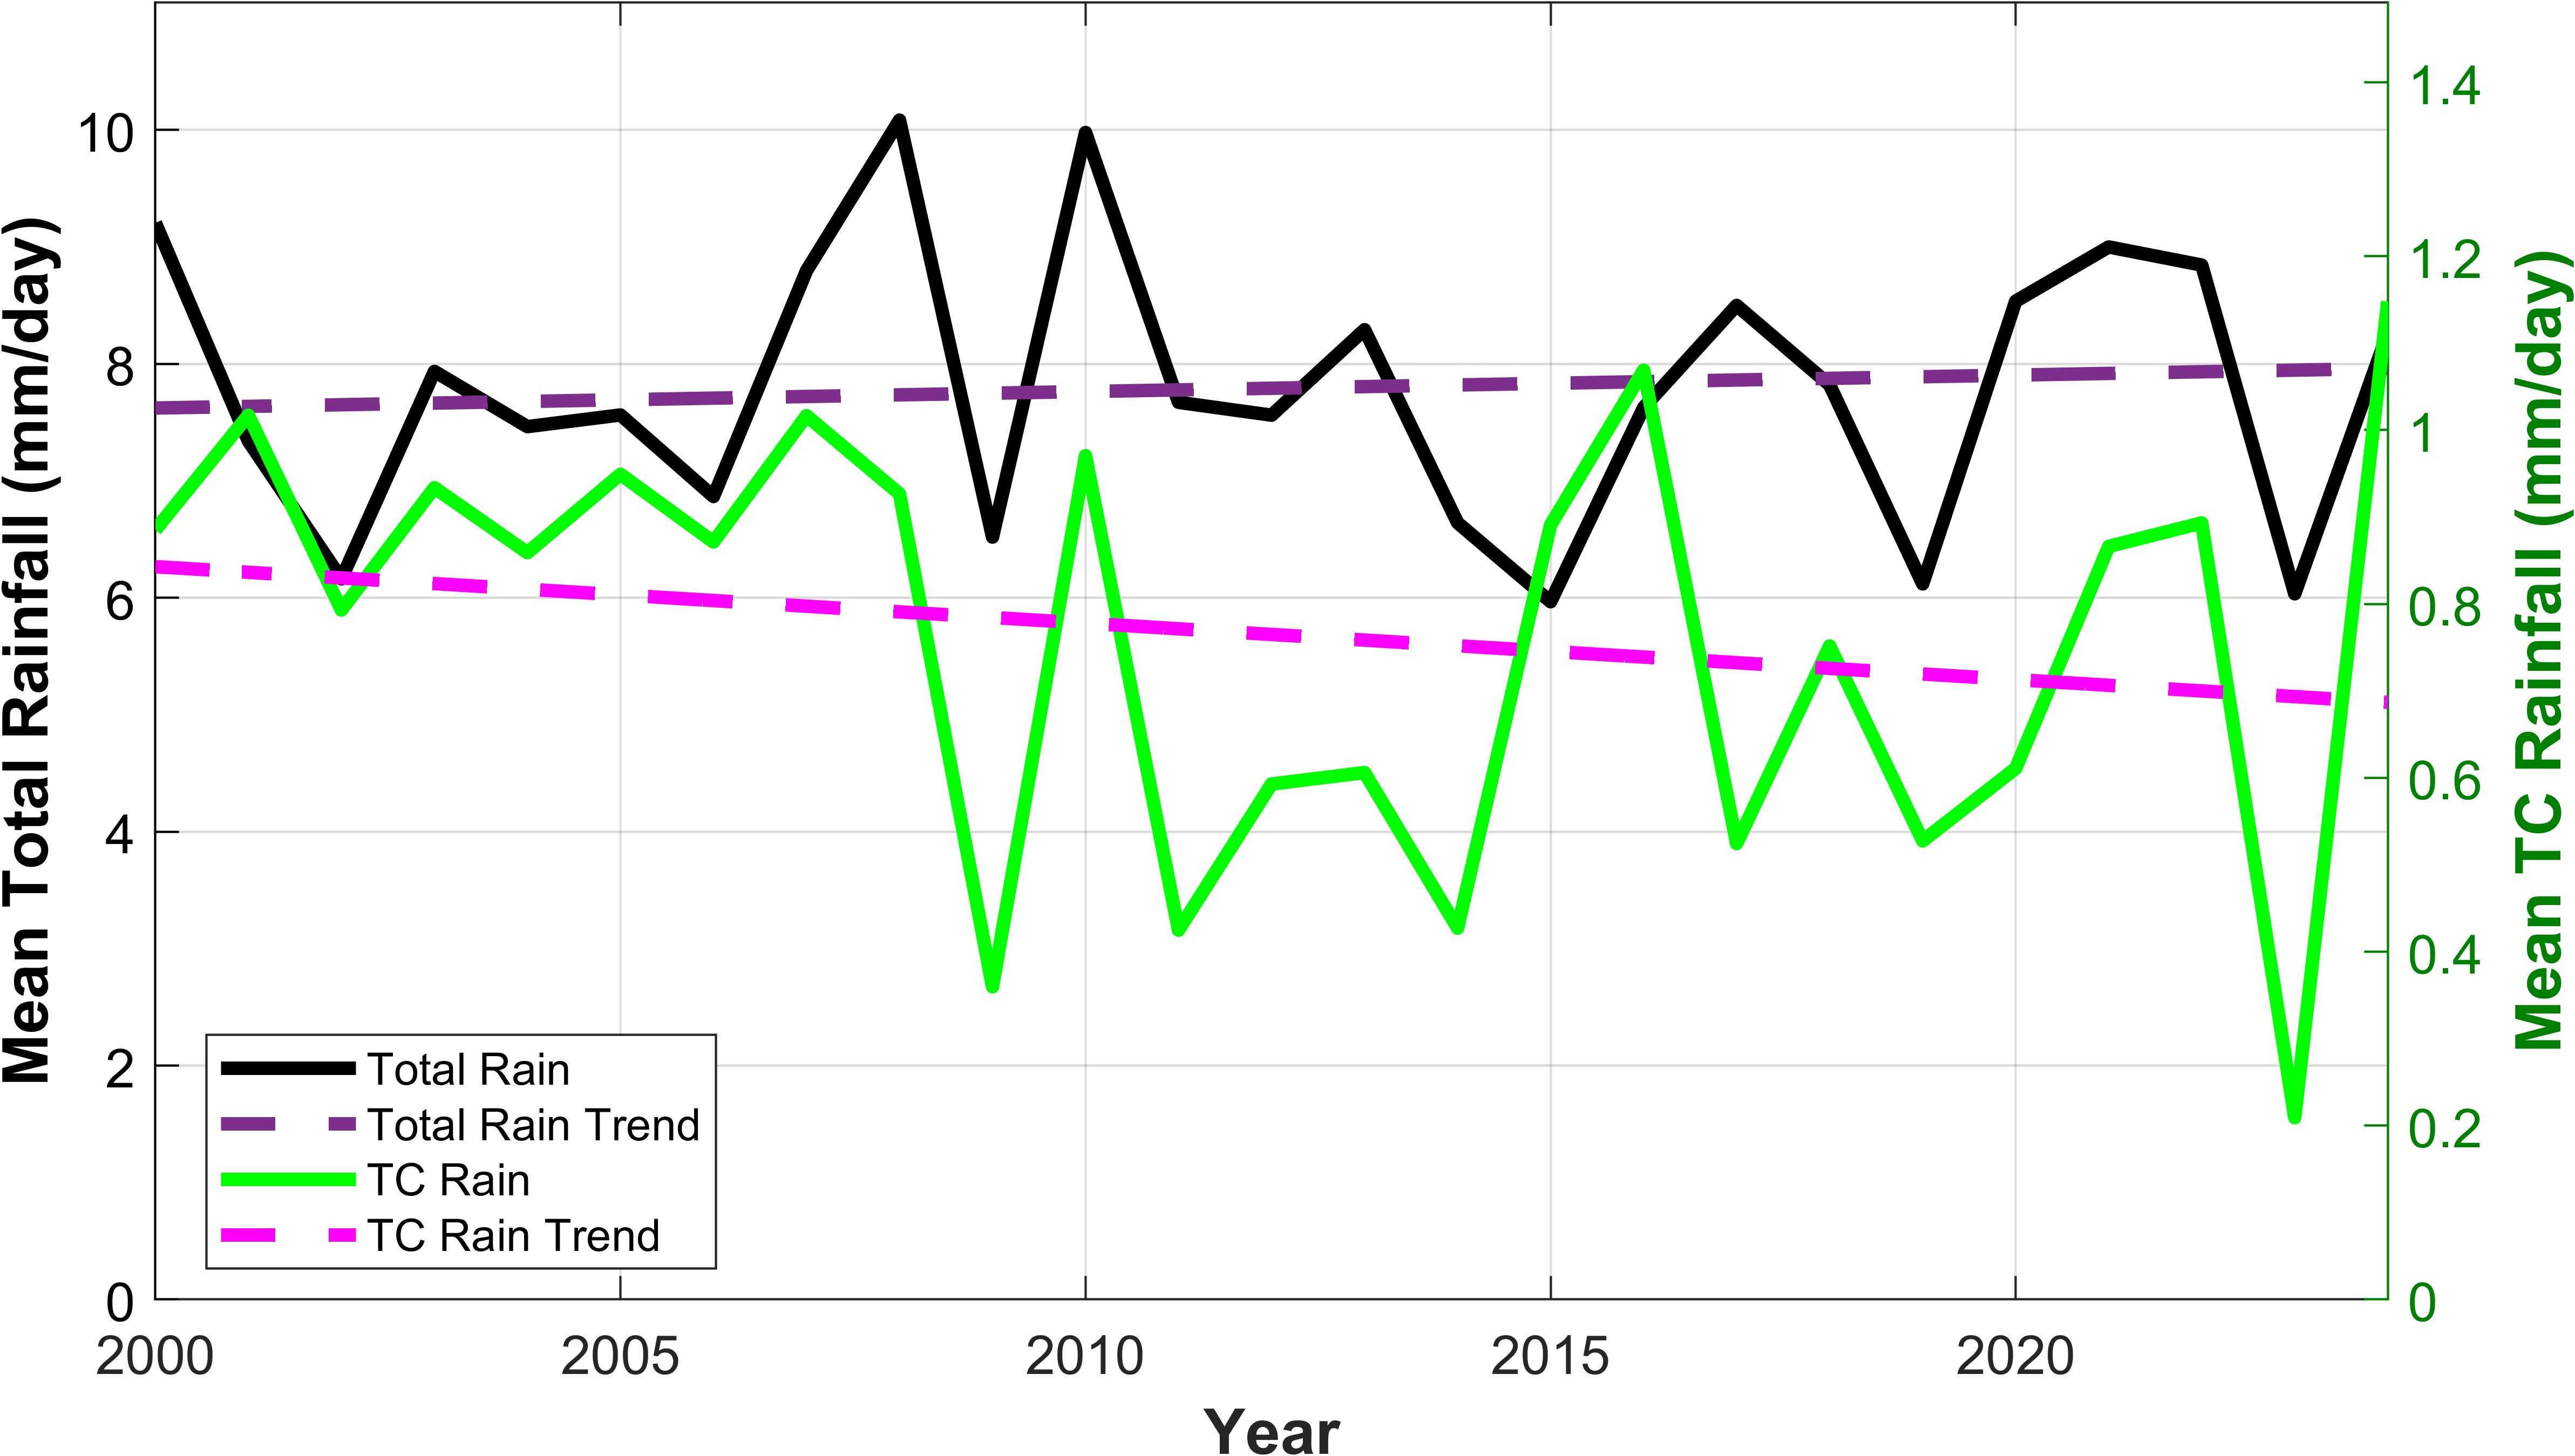
Figure 13 Trends of total rainfall (black line) and TC-induced rainfall (green line) over the NC region during the 2000 - 2024 period.
The limitations of this study should be acknowledged. While IMERG Final has demonstrated high spatial consistency with surface observation data and significant performance improvements over the GPM era [24,95], several technical limitations remain to be considered. IMERG was essentially developed as a High Resolution Precipitation Product (HRPP) rather than a Climate Data Record (CDR), so long-term temporal homogeneity, especially during the transition period between the TRMM era (2000 - 2014) and the GPM era (2015-present), could potentially be affected by differences in sensor calibration, algorithm updates, and gauge adjustment procedures between missions [96-97]. The TRMM 3B42 algorithm switched to GPM observations post-March 2015, introducing potential temporal inhomogeneity that may affect trend analyses spanning the TRMM-GPM transition [96]. Furthermore, IMERG V06 and V07 exhibit systematic differences in precipitation estimates, with V07 increasing annual mean precipitation by 2.2% over land but decreasing it by 5.8% over ocean compared to V06, though V07 shows improved detection skill and reduced bias against rain gauge networks [98].
The spatial resolution of 0.1° (~11 km) may also limit the representation of local-scale convective processes and highly localized extreme rainfall intensity, particularly in coastal areas and complex topographies such as NC [99,100]. Validation studies have shown that IMERG tends to underestimate heavy TC rainfall, especially near storm centers, with mean errors of −0.78 mm/h for mean TC rainfall and −12.1 mm/h for heavy TC rainfall [98,101]. Performance varies significantly by land cover type, with overestimations over water bodies and evergreen broadleaf forests [98]. Additionally, IMERG exhibits reduced detection skill at high elevations (>4,500 m) and struggles to capture the full intensity of extreme precipitation events, often underestimating rainfall during tropical cyclones and medicanes by significant margins [100,102]. The high intra-grid spatial variability in the Maritime Continent results in large spatial sampling errors when comparing IMERG gridboxes with individual station measurements, particularly above the 95th percentile of extreme precipitation [103].
In addition, this study did not use in-situ rainfall data as additional validation at the local scale, so the potential for satellite bias in extreme events could not be fully evaluated. Validation studies in similar tropical environments have revealed that IMERG overestimates hourly rainfall (correlation coefficients of 0.03 - 0.28) and daily rainfall (RMSE up to 6.90 mm/day), with particular challenges in complex terrain and during extreme rainfall events [24]. While IMERG Final Run products, which incorporate monthly GPCC gauge adjustments, generally outperform Early and Late Run products, they still exhibit systematic biases, with only 16% - 17% of areas showing acceptable relative bias ranges (−10% to 10%) during extreme TC events [104]. These limitations suggest that the true magnitude of extreme TC rainfall in the NC may be underestimated by IMERG, potentially affecting the assessment of TC rainfall trends and variability.
This study also analyzes the effects of TC and MJO separately without performing simultaneous statistical decomposition of the ENSO-MJO-TC interaction, which theoretically can contribute to interannual variability and will be an important direction for further research to clarify the mechanisms controlling rainfall variability in the NC. The complex interplay between ENSO phases, MJO propagation, and TC genesis and track patterns creates non-linear interactions that cannot be fully captured through separate analyses [61,105]. Future research should employ advanced statistical techniques, such as multivariate regression, empirical orthogonal function (EOF) analysis, or machine learning approaches, to disentangle the relative contributions of these coupled climate modes to TC rainfall variability in the Maritime Continent. Additionally, the integration of high-resolution regional climate model simulations with satellite observations could provide improved representation of local-scale processes and better quantification of TC rainfall extremes in complex coastal and mountainous terrain.
Conclusions
TC activity significantly contributes to rainfall in the NC, particularly on a seasonal scale. The SON season makes a substantially greater contribution (19% - 23%) than the JJA season (June – July - August) (11% - 12%), a pattern that is directly influenced by the frequency and density of TC activity that peaks in the Western Pacific Ocean during SON. The MJO also strongly modulates the contribution of TCs. The highest percentage contribution of TCs occurs during the MJOʼs local convective-suppression phase over Indonesia. During JJA, the contribution of TCs peaks (>20%) in Phases 5 - 6, indicating that the shift in the MJO convective center to the Western Pacific strengthens the monsoon trough and increases the interaction of TCs with moisture flows towards Kalimantan. In the SON, TC dominance is more extreme, peaking (>30%) in Phase 6 - 7 across most of NC. This confirms that even though total seasonal rainfall decreases during the MJO suppression, TCs become a dominant and sensitive factor in the formation of extreme rainfall in the region.
Linear trend analysis indicates a slight increase in total rainfall (+0.014 mm day⁻¹) and a modest decline in TC rainfall (‒0.006 mm day⁻¹). Although neither trend was statistically significant over the 25 years, this result should not be interpreted as evidence of declining TC-related hazard. Rather, it indicates that the available record is too short and too strongly affected by interannual variability to support robust long-term trend attribution. The primary value of the present analysis lies in identifying the seasonal and intraseasonal conditions under which TC impacts on NC rainfall become disproportionately important.
The contribution of TC rainfall to seasonal totals is not linear in relation to risk, but becomes significant when considered within the framework of rainfall thresholds that trigger landslides. Studies of intensity duration and effective duration thresholds show that landslides occur when rainfall accumulation exceeds a certain critical value, which is greatly influenced by previous soil moisture conditions. In the context of NC, the contribution of TCs during the MJO 5 - 7 phase has the potential to increase daily or multi-day rainfall accumulation to exceed these thresholds, especially when it occurs after a period of active monsoon rainfall. Thus, the contribution of TCs serves as a factor that amplifies the probability of slope failure in the regional risk system, rather than simply being a statistical addition to the total seasonal rainfall.
These findings have direct practical implications for the environmental resilience planning of Nusantara City. In particular, the results support the incorporation of TC-MJO compound rainfall risk into flood preparedness, slope stability surveillance, drainage design, and sub-seasonal early warning systems. Heightened preparedness during JJA and especially SON, with particular attention to MJO Phases 5 - 7, would provide a more actionable framework for anticipatory risk management than reliance on annual rainfall statistics alone.
Furthermore, climate projections for the Maritime Continent indicate an intensification of the hydrological cycle under global warming, characterized by increased atmospheric moisture availability and a higher likelihood of extreme rainfall events. Under such a future climate background, even if the frequency of tropical cyclones does not increase, the rainfall efficiency and hydrological impact of TC-related events may intensify. This implies that the compound influence of remote tropical cyclones, monsoonal moisture transport, and intraseasonal variability may become more consequential for NC than suggested by present-day annual mean trends alone. Although the historical trends detected in this study are not statistically significant, the demonstrated sensitivity of NC rainfall to TC-MJO interaction suggests that compound extreme events may become more impactful under future climate scenarios.
Therefore, the main contribution of this study is not to claim a robust long-term climatic trend, but to demonstrate that NC is seasonally and intraseasonally vulnerable to remotely forced extreme rainfall. This perspective is particularly relevant for a rapidly developing capital city, where infrastructure resilience, land-use planning, and disaster-risk governance must account for short-duration but high-impact hydrometeorological events. These findings highlight the importance of incorporating sub-seasonal MJO phase monitoring into regional early warning systems. In particular, heightened alertness during MJO Phases 5 - 7 in JJA and SON could support anticipatory flood management, slope stability monitoring, and drainage capacity preparedness in the NC region. Therefore, integrating TC-MJO compound risk into long-term resilience planning is essential for the sustainable development of NC.
Acknowledgements
The authors would like to thank the NASA Goddard Space Flight Center for providing the IMERG data, National Centers for Environmental Information (NCEI) and World Meteorological Organization (WMO) for IBTrACS data, and European Centre for Medium Range Weather Forecasts (ECMWF) for access to the ERA5 reanalysis datasets through the Copernicus Climate Change Service (C3S). This research was funded by the 2025 Postgraduate Research Masterʼs Thesis Grant from the Ministry of Education, Culture, Research, and Technology/Directorate General of Higher Education, Research, and Technology (Contract No: 060/C3/DT.05.00/PL/2025).
Declaration of Generative AI in Scientific Writing
The authors acknowledge the use of generative AI tools (e.g., ChatGPT by OpenAI) in the preparation of this manuscript, solely for language editing and grammar correction. No content generation, data analysis, or interpretation was performed by AI. The authors take full responsibility for the content and conclusions of this work.
CRediT Author Statement
Marzuki Marzuki: Conceptualization (lead); methodology (lead); visualization (lead); writing – original draft (equal); formal analysis (equal); writing – review and editing (equal); Funding acquisition (lead). Nadya Rezky Ananda: writing – original draft (equal); formal analysis (equal); writing – review and editing (equal). Ravidho Ramadhan: Project administration (lead); visualization (supporting); Writing – review & editing (supporting). Helmi Yusnaini: Project administration (lead); visualization (supporting); Writing – review & editing (supporting). Mutya Vonnisa: Writing – review & editing (supporting); Funding acquisition (supporting).
[1] M Irsyam, PR Cummins, M Asrurifak, L Faizal, DH Natawidjaja, S Widiyantoro, I Meilano, W Triyoso, A Rudiyanto, S Hidayati, M Ridwan, NR Hanifa and AJ Syahbana. Development of the 2017 national seismic hazard maps of Indonesia. Earthquake Spectra 2020; 36, 112-136.
[2] AR As-syakur, T Tanaka, T Osawa and MS Mahendra. Indonesian rainfall variability observation using TRMM multi-satellite data. International Journal of Remote Sensing 2013; 34(21), 7723-7738.
[3] H Yan, W Wei, W Soon, Z An, W Zhou, Z Liu, Y Wang and RM Carter. Dynamics of the intertropical convergence zone over the western Pacific during the Little Ice Age. Nature Geoscience 2015; 8, 315-320.
[4] M Marzuki, R Ramadhan, H Yusnaini, M Vonnisa, R Safitri and E Yanfatriani. Changes in extreme rainfall in new capital of Indonesia (IKN) based on 20 years of GPM-IMERG data. Trends in Sciences 2023; 20(11), 6935.
[5] VSA Hendrawan, AP Rahardjo, HG Mawandha, E Aldrian, A Muhari and D Komori. Review article: Past and future climate-related hazards in Indonesia. EGUsphere 2025. https://doi.org/10.5194/egusphere-2025-584
[6] R Ramadhan, Marzuki, W Suryanto, Sholihun, H Yusnaini, R Muharsyah and M Hanif. Trends in rainfall and hydrometeorological disasters in new capital city of Indonesia from long-term satellite-based precipitation products. Remote Sensing Applications: Society and Environment 2022; 28, 100827.
[7] E Aldrian and RD Susanto. Identification of three dominant rainfall regions within Indonesia and their relationship to sea surface. International Journal of Climatology 2003; 23(12), 1435-1452.
[8] A Purwaningsih, SW Lubis, E Hermawan, DF Andarini, T Harjana, DN Ratri, A Ridho, Risyanto and AP Sujalu. Moisture origin and transport for extreme precipitation over Indonesia’s new capital city, Nusantara in August 2021. Atmosphere 2022; 13(9), 1391.
[9] K Kikuchi. The boreal summer intraseasonal oscillation (BSISO): A review. Journal of the Meteorological Society of Japan 2021; 99(4), 933-972.
[10] Supari, F Tangang, E Salimun, E Aldrian, A Sopaheluwakan and L Juneng. ENSO modulation of seasonal rainfall and extremes in Indonesia. Climate Dynamics 2018; 51, 2559-2550.
[11] R Ramadhan, Marzuki, W Suryanto, Sholihun, H Yusnaini and R Muharsyah. Rainfall variability in Indonesia new capital associated with the Madden-Julian oscillation and its contribution to flood events. Quaternary Science Advances 2024; 13, 100163.
[12] KK Yulianti, NS Ningsih, R Rachmayani and E Prasetyo. The influence of El Niño-Southern oscillation (ENSO) on the characteristics of tropical cyclones in Indonesia waters. Tropical Cyclone Research and Review 2025; 14(3), 270-286.
[13] PA Sugianto, MA Azka, R Mahubessy and PA Winarso. Kajian kondisi atmosfer di wilayah Indonesia saat periode aktifnya badai tropis Kai-Tak. Prosiding SNFA 2018; 3, 216.
[14] S Tridaiana and M Marzuki. Exploring the complex dynamics of tropical cyclone activity in the Southern Indian Ocean: A multidecade analysis. Jurnal Penelitian Pendidikan IPA 2023; 9(11), 1069-1077.
[15] AY Sari, M Marzuki, M Vonnisa, R Ramadhan, H Yusnaini, R Muharsyah and A Erajalita. Comparison of climatology of precipitation diurnal cycle in Kalimantan deduced from rain gauge and IMERG data. Journal of Physics: Conference Series 2024; 2866, 012070.
[16] G Bagtasa. Contribution of tropical cyclones to rainfall in the Philippines. Journal of Climate 2017; 30, 3621-3633.
[17] JA Breña-Naranjo, A Pedrozo-Acuña, O Pozos-Estrada, SA Jiménez-López and MR López-López. The contribution of tropical cyclones to rainfall in Mexico. Physics and Chemistry of the Earth 2015; 83-84, 111-122.
[18] RA Dare, NE Davidson and JL McBride. Tropical cyclone contribution to rainfall over Australia. Monthly Weather Review 2012; 140, 3606-3619.
[19] Kementerian PPN/Bappenas. Pocketbook of national capital city relocation. Kementerian PPN/Bappenas, Central Jakarta, Indonesia, 2021.
[20] T Nugraha, T Trilaksono and R Renaldi. Nusantara: Indonesia’s bold move toward a smart capital in the Global South. Brown Journal of World Affairs 2024; 3(11), 107-123.
[21] G Huffman, D Bolvin, D Braithwaite, K Hsu, R Joyce, C Kidd, E Nelkin, S Sorooshian, J Tan and P Xie. GPM integrated multi-satellite retrievals for GPM (IMERG) Algorithm Theoretical Basis Document (ATBD) version 06. National Aeronautics and Space Administration, Washington DC, 2020.
[22] J Tan, WA Petersen and A Tokay. A novel approach to identify sources of errors in IMERG for GPM ground validation. Journal of Hydrometeorology 2016; 17, 2477-2491.
[23] R Ramadhan, R Muharsyah, Marzuki, H Yusnaini, M Vonnisa, H Hashiguchi, W Suryanto and Sholihun. Evaluation of GPM IMERG products for extreme precipitation over Indonesia. Journal of Physics: Conference Series 2022; 2309, 012008.
[24] R Ramadhan, H Yusnaini, M Marzuki, R Muharsyah, W Suryanto, S Sholihun, M Vonnisa, H Harmadi, AP Ningsih, A Battaglia, H Hashiguchi and A Tokay. Evaluation of GPM IMERG performance using gauge data over Indonesian maritime continent at different time scales. Remote Sensing 2022; 14(5), 1172.
[25] S Zhu, Z Li, M Chen, Y Wen, Z Liu, GJ Huffman, TE Tsoodle, SC Ferraro, Y Wang and Y Hong. Evaluation of IMERG climate trends over land in the TRMM and GPM eras. Environmental Research Letters 2025; 20, 014064.
[26] MC Kruk, KR Knapp, DH Levinson, HJ Diamond and JP Kossin. An overview of the international best track archive for climate stewardship (IBTrACS). Bulletin of the American Meteorological Society 2010; 91(3), 363-376.
[27] N Bloemendaal, ID Haigh, H de Moel, S Muis, RJ Haarsma and JCJH Aerts. Generation of a global synthetic tropical cyclone hazard dataset using STORM. Scientific Data 2020; 7, 40.
[28] F Ren, G Wu, W Dong, X Wang, Y Wang, W Ai and W Li. Changes in tropical cyclone precipitation over China. Geophysical Research Letters 2006; 33(20), 20702.
[29] H Jiang, JB Halverson, J Simpson and EJ Zipser. Hurricane “Rainfall Potential” derived from satellite observations aids overland rainfall prediction. Journal of Applied Meteorology and Climatology 2008; 47, 944-959.
[30] G Bagtasa. Influence of Madden-Julian oscillation on the intraseasonal variability of summer and winter monsoon rainfall in the Philippines. Journal of Climate 2020; 33, 9581-9594.
[31] M Gocic and S Trajkovic. Analysis of changes in meteorological variables using Mann-Kendall and Sen’s slope estimator statistical tests in Serbia. Global and Planetary Change 2013; 100, 172-182.
[32] MJ Uddin, Y Li, KK Cheung, ZM Nasrin, H Wang, L Wang and Z Gao. Rainfall contribution of tropical cyclones in the Bay of Bengal between 1998 and 2016 using TRMM satellite data. Atmosphere 2019; 10(11), 699.
[33] D Yao, X Song, L Yang and Y Ma. Contribution of tropical cyclones to precipitation around reclaimed Islands in the South China Sea. Water 2020; 12(11), 3108.
[34] MC Wheeler and HH Hendon. An all-season real-time multivariate MJO index: Development of an index for monitoring and prediction. Monthly Weather Review 2004; 132, 1917-1932.
[35] P Song, J Zhu, Z Zhong, L Qi and X Wang. Impact of atmospheric and oceanic conditions on the frequency and genesis location of tropical cyclones over the western North Pacific in 2004 and 2010. Advances in Atmospheric Sciences 2016; 33, 599-613.
[36] X Wang and W Zhou. Interdecadal variation of the monsoon trough and its relationship with tropical cyclone genesis over the South China Sea and Philippine Sea around the mid-2000s. Climate Dynamics 2024; 62, 3743-3762.
[37] X Cao, T Li, M Peng, W Chen and G Chen. Effects of monsoon trough interannual variation on tropical cyclogenesis over the western North Pacific. Geophysical Research Letters 2014; 41(12), 4332-4339.
[38] PH Raavi, JE Chu, A Timmermann, SS Lee and KJE Walsh. Moisture control of tropical cyclones in high-resolution simulations of paleoclimate and future climate. Nature Communications 2023; 14, 6426.
[39] MJ Widlansky, H Annamalai, SB Gingerich, CD Storlazzi, JJ Marra, KI Hodges, B Choy and A Kitoh. Tropical cyclone projections: Changing climate threats for Pacific Island defense installations. Weather, Climate, and Society 2019; 11, 3-15.
[40] Z Gong, Y Liu, ZZ Hu and P Liang. Tropical cyclone activities over the western North Pacific in summer 2020: Transition from silence in July to unusually active in August. Frontiers in Earth Science 2022; 10, 843990.
[41] M Stowasser, Y Wang and K Hamilton. Tropical cyclone changes in the western North Pacific in a global warming scenario. Journal of Climate 2007; 20, 2378-2396.
[42] KTF Chan, Z Dong and M Zheng. Statistical seasonal forecasting of tropical cyclones over the western North Pacific. Environmental Research Letters 2021; 16, 074027.
[43] X Cao, G Chen, T Li and F Ren. Simulations of tropical cyclogenesis associated with different monsoon trough patterns over the western North Pacific. Meteorology and Atmospheric Physics 2016; 128, 491-511.
[44] TC Chen, SY Wang, MC Yen and WAG Jr. Role of monsoon gyre in the interannual variation of tropical cyclone formation over the western North Pacific. Weather and Forecasting 2004; 19, 776-785.
[45] Z Sun, S Gao and M Jian. Comparison of the water vapor budget evolution of developing and non-developing disturbances over the western North Pacific. Remote Sensing 2024; 16(13), 2396.
[46] JW Choi, BJ Kim, R Zhang, KJ Park, JY Kim, Y Cha and JC Nam. Possible relation of the western North Pacific monsoon to the tropical cyclone activity over western North Pacific. International Journal of Climatology 2016; 36(9), 3334-3345.
[47] B Liebmann, HH Hendon and JD Glick. The relationship between tropical cyclones of the western Pacific and Indian oceans and the Madden-Julian oscillation. Journal of the Meteorological Society of Japan 1994; 72(3), 401-412.
[48] G Chen, J Ling, Z Xiao, C Li and C Zhang. Influence of SST-precipitation relationship over the equatorial western Pacific on simulation of the Madden-Julian oscillation. Geophysical Research Letters 2024; 51(21), e2024GL110485.
[49] RCY Li and W Zhou. Modulation of western North Pacific tropical cyclone activity by the ISO. Part I: Genesis and intensity. Journal of Climate 2013; 26, 2904-2918.
[50] H Zhao, X Jiang and L Wu. Modulation of northwest Pacific tropical cyclone genesis by the intraseasonal variability. Journal of the Meteorological Society of Japan. Ser. II 2015; 93(1), 81-97.
[51] JM Chen, CH Wu, PH Chung and CH Sui. Influence of intraseasonal-interannual oscillations on tropical cyclone genesis in the western North Pacific. Journal of Climate 2018; 31, 4949- 4961.
[52] C Hohenegger, L Schlemmer and L Silvers. Coupling of convection and circulation at various resolutions. Tellus Series A: Dynamic Meteorology and Oceanography 2015; 67(1), 26678.
[53] G Giarno, MP Hadi, S Suprayogi and SH Murti. Distribution of accuracy of TRMM daily rainfall in Makassar Strait. Forum Geografi 2018; 32(1), 38-52.
[54] JH Qian. Why precipitation is mostly concentrated over Islands in the maritime continent. Journal of the Atmospheric Sciences 2008; 65, 1428-1441.
[55] A Khouakhi, G Villarini and GA Vecchi. Contribution of tropical cyclones to rainfall at the global scale. Journal of Climate 2017; 30, 359-372.
[56] AL Gordon and RA Fine. Pathways of water between the Pacific and Indian oceans in the Indonesian seas. Nature 1996; 379, 146-149.
[57] AM Napitu, K Pujiana and AL Gordon. The Madden-Julian oscillation’s impact on the Makassar Strait surface layer transport. Journal of Geophysical Research: Oceans 2019; 124(6), 3538-3550.
[58] Trismidianto, E Yulihastin, H Satyawardhana, JT Nugroho and S Ishida. The contribution of the mesoscale convective complexes (MCCs) to total rainfall over Indonesian maritime continent. IOP Conference Series: Earth and Environmental Science 2017; 54, 012027.
[59] YM Cheng, J Dias, G Kiladis, Z Feng and LR Leung. Mesoscale convective systems modulated by convectively coupled equatorial waves. Geophysical Research Letters 2023; 50(10), e2023GL103335.
[60] L Guo, NP Klingaman, PL Vidale, AG Turner, ME Demory and A Cobb. Contribution of tropical cyclones to atmospheric moisture transport and rainfall over East Asia. Journal of Climate 2017; 30, 3853-3865.
[61] JH Kim, CH Ho, HS Kim, CH Sui and SK Park. Systematic variation of summertime tropical cyclone activity in the western North Pacific in relation to the Madden-Julian oscillation. Journal of Climate 2008; 21, 1171-1191.
[62] ED Maloney and DL Hartmann. Modulation of eastern North Pacific hurricanes by the Madden-Julian oscillation. Journal of Climate 2000; 13, 1451-1460.
[63] H Zhao, R Yoshida and GB Raga. Impact of the Madden-Julian oscillation on western North Pacific tropical cyclogenesis associated with large-scale patterns. Journal of Applied Meteorology and Climatology 2015; 54, 1413-1429.
[64] L Bai, HL Ren, Y Wei, Y Wang and B Chen. Influence of Madden-Julian oscillation on precipitation over the Tibetan Plateau in boreal summer. Atmosphere 2023; 14(1), 70.
[65] NAD Silva and AJ Matthews. Impact of the Madden-Julian oscillation on extreme precipitation over the western maritime continent and Southeast Asia. Quarterly Journal of the Royal Meteorological Society 2021; 147(739), 3434-3453.
[66] P Haertel. The relationship between Madden-Julian oscillation moist convective circulations and tropical cyclone genesis. Climate 2023; 11(7), 134.
[67] P Haertel and Y Liang. Potential strengthening of the Madden-Julian oscillation modulation of tropical cyclogenesis. Atmosphere 2024; 15(6), 655.
[68] K Kikuchi and B Wang. Formation of tropical cyclones in the northern Indian Ocean associated with two types of tropical intraseasonal oscillation modes. Journal of the Meteorological Society of Japan 2010; 88(3), 475-496.
[69] SJ Camargo, MC Wheeler and AH Sobel. Diagnosis of the MJO modulation of tropical cyclogenesis using an empirical index. Journal of the Atmospheric Sciences 2009; 66, 3061-3074.
[70] PJ Klotzbach and ECJ Oliver. Modulation of Atlantic basin tropical cyclone activity by the Madden-Julian oscillation (MJO) from 1905 to 2011. Journal of Climate 2015; 28, 204-217.
[71] R Raghudhas, J Kuttippurath, A Chakraborty and A Rajeev. Influence of MJO on cyclone activity in the north Indian Ocean and Western North Pacific. In: Proceedings of the EGU23, the 25th EGU General Assembly, Vienna, Austria. 2023, p. 23-44.
[72] W Zhang, Y Leung and JCL Chan. The analysis of tropical cyclone tracks in the western North Pacific through data mining. Part I: tropical cyclone recurvature. Journal of Applied Meteorology and Climatology 2013; 52, 1394-1416.
[73] MD Fowler and MS Pritchard. Regional MJO modulation of northwest Pacific tropical cyclones driven by multiple transient controls. Geophysical Research Letters 2020; 47(11), e2020GL087148.
[74] ED Maloney and DL Hartmann. The Madden-Julian oscillation, barotropic dynamics, and North Pacific tropical cyclone formation. Part I: observations. Journal of the Atmospheric Sciences 2001; 58, 2545-2558.
[75] C Zhao and T Li. Basin dependence of the MJO modulating tropical cyclone genesis. Climate Dynamics 2019; 52, 6081-6069.
[76] B Tang and K Emanuel. Midlevel ventilation’s constraint on tropical cyclone intensity. Journal of the Atmospheric Sciences 2010; 67, 1817-1830.
[77] PJ Klotzbach. The Madden-Julian oscillation’s impacts on worldwide tropical cyclone activity. Journal of Climate 2014; 27, 2317-2330.
[78] JP Peixoto and AH Oort. Physics of Climate. American Institute of Physics, New York, 1992.
[79] SS Chand and KJE Walsh. The influence of the Madden-Julian oscillation on tropical cyclone activity in the Fiji Region. Journal of Climate 2010; 23, 868-886.
[80] K Balaguru, LR Leung, SM Hagos and S Krishnakumar. An oceanic pathway for Madden-Julian oscillation influence on Maritime Continent tropical cyclones. npj Climate and Atmospheric Science 2021; 4, 52.
[81] LMP Olaguera, JA Manalo, A Bathan and J Matsumoto. Quantifying the influence of the Madden-Julian oscillation on rainfall extremes during the northeast monsoon season of the Philippines. Atmospheric Science Letters 2024; 25(7), 1232.
[82] X Li, R Lu, G Chen and R Chen. Western North Pacific tropical cyclones suppress Maritime Continent rainfall. npj Climate and Atmospheric Science 2024; 7, 251.
[83] KE Trenberth and J Fasullo. Water and energy budgets of hurricanes and implications for climate change. Journal of Geophysical Research: Atmospheres 2007; 112, 23107.
[84] WKM Lau and YP Zhou. Observed recent trends in tropical cyclone rainfall over the North Atlantic and the North Pacific. Journal of Geophysical Research 2012; 117, 03104.
[85] S Tu, JCL Chan, J Xu and W Zhou. Opposite changes in tropical cyclone rain rate during the recent El Niño and La Niña years. Geophysical Research Letters 2022; 49, e2021GL097412.
[86] Supari, F Tangang, L Juneng and E Aldrian. Spatio-temporal characteristics of temperature and precipitation extremes in Indonesian Borneo. AIP Conference Proceedings 2016; 1784, 060050.
[87] A Deo, SS Chand, H Ramsay, NJ Holbrook, S McGree, A Magee, S Bell, M Titimaea, A Haruhiru, P Malsale, S Mulitalo, A Daphne, B Prakash, V Vainikolo and S Koshiba. Tropical cyclone contribution to extreme rainfall over southwest Pacific Island nations. Climate Dynamics 2021; 56, 3967-3993.
[88] HH Hendon, MC Wheeler and C Zhang. Seasonal dependence of the MJO–ENSO relationship. Journal of Climate 2007; 20, 531-543.
[89] F Chen, R Wang, P Liu, L Yu, Y Feng, X Zheng and J Gao. Evaluation of GPM IMERG and error sources for tropical cyclone precipitation over eastern China. Journal of Hydrology 2023; 627, 130384.
[90] B Lyon and SJ Camargo. The seasonally varying influence of ENSO on rainfall and tropical cyclone activity in the Philippines. Climate Dynamics 2009; 32, 125-141.
[91] G Bagtasa. Assessment of tropical cyclone rainfall from GSMaP and GPM products and their application to analog forecasting in the Philippines. Atmosphere 2022; 13(9), 1398.
[92] DT Dinh, H Bui-Manh, TH Le, YT Fu, CC Lin and MC Yen. Factors affecting interannual variation in late summer rainfall in the Red River Delta of Vietnam. Terrestrial Atmospheric and Oceanic Sciences 2023; 34, 12.
[93] TR Knutson, JL McBride, J Chan, K Emanuel, G Holland, C Landsea, I Held, JP Kossin, AK Srivastava and M Sugi. Tropical cyclones and climate change. Nature Geoscience 2010; 3, 157-163.
[94] T Knutson, SJ Camargo, JCL Chan, K Emanuel, CH Ho, J Kossin, M Mohapatra, M Satoh, M Sugi, K Walsh and L Wu. Tropical cyclones and climate change assessment: Part II projected response to anthropogenic warming. Bulletin of the American Meteorological Society 2020; 101(3), 303-322.
[95] ML Tan and H Santo. Comparison of GPM IMERG, TMPA 3B42 and PERSIANN-CDR satellite precipitation products over Malaysia. Atmospheric Research 2018; 202, 63-76.
[96] G Wei, H Lü, WT Crow, Y Zhu, J Wang and J Su. Comprehensive evaluation of GPM-IMERG, CMORPH, and TMPA precipitation products with gauged rainfall over mainland China. Advances in Meteorology 2018; 2018, 3024190.
[97] Z He, L Yang, F Tian, G Ni, A Hou and H Lu. Intercomparisons of rainfall estimates from TRMM and GPM multisatellite products over the upper Mekong River basin. Journal of Hydrometeorology 2017; 18, 413-430.
[98] Y Wang, Z Li, L Gao, Y Zhong and X Peng. Comparison of GPM IMERG version 06 final run products and its latest version 07 precipitation products across scales: Similarities, differences and improvements. Remote Sensing 2023; 15(23), 5622.
[99] H Meyer, J Drönner and T Nauss. Satellite-based high resolution mapping of rainfall over Southern Africa. Atmospheric Measurement Techniques 2017; 10(6), 2009-2019.
[100] R Xu, F Tian, L Yang, H Hu, H Lu and A Hou. Ground validation of GPM IMERG and TRMM 3B42V7 rainfall products over Southern Tibetan Plateau based on a high-density rain gauge network. Journal of Geophysical Research: Atmospheres 2017; 122(2), 910-924.
[101] X Chen, YP Guo, ZM Tan and J Zhao. Influence of different types of ENSO events on the tropical cyclone rainfall over the western North Pacific. Climate Dynamics 2023; 60, 3969-3982.
[102] D Katsanos, A Retalis, J Kalogiros, BE Psiloglou, N Roukounakis and M Anagnostou. Performance evaluation of satellite precipitation products during extreme events-the case of the medicane Daniel in Thessaly Greece. Remote Sensing 2024; 16(22), 4216.
[103] NAD Silva, BGM Webber, AJ Matthews, MM Feist, THM Stein, CE Holloway and MFAB Abdullah. Validation of GPM IMERG extreme precipitation in the Maritime Continent by station and radar data. Earth and Space Science 2021; 8(7), e2021EA001738.
[104] S Sakib, D Ghebreyesus and HO Sharif. Performance evaluation of IMERG GPM products during tropical storm Imelda. Atmosphere 2021; 12(6), 687.
[105] JM Chen, PH Tan, L Wu, HS Chen, JS Liu and CF Shih. Interannual variability of summer tropical cyclone rainfall in the western North Pacific depicted by CFSR and associated large-scale processes and ISO modulations. Journal of Climate 2018; 31, 1771-1787.