
Trends Sci. 2026; 23(10): 12072
AI-Enhanced RSM Optimization of Green-Treated Spent Coffee Grounds for Superior Chromium (VI) Removal
Tuan Anh Nguyen*, Xuan Huy Nguyen and Thi Thu Phương Nguyen
Faculty of Chemical Technology, Hanoi University of Industry (HaUI), Hanoi 100000, Vietnam
(*Corresponding author’s e-mail: [email protected])
Received: 26 September 2025, Revised: 14 March 2026, Accepted: 21 March 2026, Published: 20 April 2026
Abstract
In this study, spent coffee grounds (SCG) were chemically activated with Ca(OH)₂ to develop a sustainable adsorbent for Cr(VI) removal from aqueous solutions. Structural analyses (SEM/EDX, FTIR, XRD, and XPS) confirmed that Ca(OH)₂ pretreatment significantly enhanced surface porosity, exposed additional oxygen-containing functional groups (–OH, –COOH), and introduced Ca–O active sites, thereby improving adsorption performance. The adsorption efficiency was strongly influenced by solution pH. Although the highest removal efficiency was observed under strongly acidic conditions (pH ≈ 2), extremely low pH values are not desirable for practical water treatment due to excessive acid consumption and potential corrosion. Therefore, an operational pH range of 4.5 - 5.0 was selected as the optimal condition to balance adsorption performance and practical applicability. Under these conditions (initial concentration ≈ 50 mg L⁻¹, dosage 1.0 g/100 mL, contact time 180 min, temperature 313 K), the maximum adsorption capacity reached 21 - 22 mg g⁻¹ with a removal efficiency of 88% - 90%, compared with only 12 - 14 mg g⁻¹ for untreated SCG. Kinetic analysis demonstrated that the pseudo-second-order (PSO) model best described the adsorption process (R² ≥ 0.993), while isotherm studies revealed good agreement with both Freundlich (R² = 0.984 - 0.992) and Langmuir (R² = 0.980 - 0.993) models, suggesting heterogeneous adsorption with partial monolayer characteristics. Thermodynamic analysis indicated an endothermic adsorption process (ΔH° > 0), with qₘₐₓ increasing from 20.83 mg g⁻¹ (298 K) to 23.45 mg g⁻¹ (328 K). High-resolution XPS spectra confirmed that the adsorbed chromium existed in mixed oxidation states, with partial reduction from Cr(VI) to Cr(III), particularly in SCG4 (2.5 wt% Ca(OH)₂), where the Cr(III)/Cr(total) ratio was highest. Reusability tests showed that after ten adsorption–desorption cycles, the removal efficiency remained at approximately 44%, demonstrating the material’s stability and regeneration potential. These results indicate that Ca(OH)₂-modified SCG is a low-cost, eco-friendly, and effective adsorbent for chromium-contaminated water treatment, combining efficient Cr(VI) removal, partial detoxification, and good recyclability.
Keywords: Spent coffee grounds, Cr(VI) adsorption, Ca(OH)₂ treatment, Response Surface Methodology (RSM), Artificial Intelligence (AI), Pareto optimization
Introduction
The challenge of removing Cr(VI), a highly toxic and mobile heavy metal, has driven extensive research into bio-based adsorbents and sustainable treatment methods. Activated carbons derived from spent coffee grounds (SCG) have shown promising performance, with comparative studies reporting adsorption capacities exceeding 40 mg g⁻¹ and effective removal of both Cr(VI) and dyes [1]. Reviews have confirmed that a wide variety of low-cost adsorbents can be employed for
wastewater treatment, though SCG stands out due to its abundance and surface chemistry [2]. In fact, both coffee and tea wastes have been reported as effective adsorbents, achieving removal efficiencies of >85% for Cr(VI) [3], while walnut shell-derived carbons optimized by RSM achieved capacities above 90 mg g⁻¹ [4]. Perspectives on mineral-incorporated adsorbents have also highlighted the role of green modifications in improving selectivity [5]. Untreated SCG has demonstrated capacities of ~18 mg g⁻¹ [6], which can be enhanced by polymer-based modifications [7] and polyphenolic structures [8]. SCG-derived materials consistently show >90% Cr(VI) removal at 50 mg L⁻¹ [9], while biomass leaves such as Sambucus nigra have achieved comparable performance [10]. Other bio-wastes, including tea residues [11], pea shells [12], and modified biomass [13], have further demonstrated removal efficiencies in the range of 70% - 95%. In addition, biochar systems under anaerobic conditions effectively reduced Cr(VI) concentrations in groundwater [14]. Waste tea leaves [15] and sunflower stalks [16] were also confirmed as low-cost adsorbents, with capacities around 20 - 25 mg g⁻¹. Reviews of cellulosic adsorbents have consistently emphasized their potential as scalable alternatives [17]. Other agricultural wastes, including bamboo leaves [18], grapefruit peel [19], and peanut shells [20], demonstrated capacities from 15 - 30 mg g⁻¹ and favorable thermodynamic parameters, reinforcing the importance of biomass valorization for wastewater treatment.
Beyond these initial studies, further research expanded to other activated carbons and modified biomass, emphasizing the role of chemical activation and surface functionalization. Rice husk-based carbons activated with ozone exhibited improved Cr(VI) adsorption [21], while coconut shell charcoal and commercial activated carbons functionalized with oxidants or chitosan reached removal efficiencies exceeding 90% [22]. Fertilizer industry waste also showed potential, with Langmuir qₘ values of 25 - 35 mg g⁻¹ [23]. SCG particle size was confirmed as a key parameter influencing adsorption kinetics and capacities [24], and multiple studies validated that SCG and other coffee residues maintain consistent performance across different conditions [25-27]. Fixed-bed column experiments demonstrated efficient removal in continuous systems, with >95% removal at pH 4 - 5 [28], while pinecone biochar showed strong kinetics and thermodynamic favorability [29]. Mechanistic studies identified that SCG and related biomass follow chemisorption pathways dominated by pseudo-second-order (PSO) kinetics [30,31]. Sawdust and chestnut shell-derived carbons similarly reached qₘ values around 23 mg g⁻¹ [32,33], while GO/PAMAM composites displayed strong adsorption via multiple functional groups [34]. Theoretical models by Ho and McKay [35] and Langmuir [36] remain the most widely applied frameworks, complemented by reviews of fixed-bed column studies [37-39]. Additional investigations into biochars, such as corn stalks and Vietnamese corncob systems, reported qₘ in the range of 22 - 24 mg g⁻¹ with R² > 0.99 [40,41]. Overall, the adsorption of Cr(VI) by SCG and related biomaterials strongly conforms to Langmuir and Freundlich isotherms [42], and column experiments confirmed stable performance even under co-ion interference [43]. Collectively, these studies establish that SCG-based adsorbents are cost-effective, versatile, and environmentally sustainable, while advanced optimization through RSM and AI provides a robust pathway for achieving high efficiency and mechanistic understanding.
Although numerous studies have demonstrated the potential of SCG and other biomass-derived adsorbents for Cr(VI) removal, several critical gaps remain. Most works have focused on batch systems and single-factor experiments, lacking integrated multi-parameter optimization. Adsorption capacities remain highly variable, strongly dependent on pH, particle size, and chemical modification routes, with limited efforts to couple operational optimization with mechanistic insights. Furthermore, while pseudo-second-order kinetics and Langmuir/Freundlich isotherms are widely applied, these models alone are insufficient to capture the complexity of multi-factor interactions in real systems. Importantly, the integration of advanced statistical tools such as Response Surface Methodology (RSM) with Artificial Intelligence (AI)-based modeling remains underexplored, despite their potential to simultaneously optimize process conditions, improve predictive accuracy, and provide deeper understanding of adsorption mechanisms. This study addresses these gaps by developing a green-pretreated SCG adsorbent and employing an integrated RSM-AI optimization framework to maximize Cr(VI) removal efficiency. The approach not only identifies optimal conditions (pH, concentration, temperature, adsorbent dose, and contact time) with high precision but also correlates them with adsorption mechanisms validated by kinetic and isotherm models. By linking sustainable material valorization with state-of-the-art optimization techniques, the research introduces a novel, scalable, and environmentally responsible strategy for treating toxic Cr(VI) contamination. Spent coffee grounds are lignocellulosic residues composed of cellulose, hemicellulose, lignin, lipids, and phenolic compounds, which can limit adsorption performance if not properly modified. Alkaline treatment using Ca(OH)₂ has been widely applied to lignocellulosic materials to induce partial delignification, cleave ester linkages between lignin and hemicellulose, and remove inhibitory phenolic substances. This mild alkaline modification enhances surface accessibility, increases porosity, and exposes oxygen-containing functional groups such as –OH and –COOH, which are favorable for metal ion adsorption. Compared with strong alkalis (e.g., NaOH), Ca(OH)₂ offers a more environmentally benign and cost-effective approach, making it particularly suitable for sustainable valorization of agro-industrial wastes.
Materials and methods
Materials
Spent coffee grounds (SCG) used as the adsorbent precursor were collected from local coffee shops in Bắc Từ Liêm District, Hanoi, Vietnam (Table 1). Calcium hydroxide (Ca(OH)₂, analytical grade), hydrochloric acid (HCl), sodium hydroxide (NaOH), potassium dichromate (K₂Cr₂O₇, Cr(VI) standard solution, 1,000 mg L⁻¹), and 1,5-diphenylcarbazide (DPC) reagent were used in the experiments. All chemicals were purchased from Sigma-Aldrich and used without further purification. Distilled water was used throughout the experiments for washing and preparation of solutions.
Preparation and chemical treatment
Raw SCG was collected, washed with distilled water, and oven-dried at 80 °C for 6 - 8 h. The dried SCG was ground and sieved to a particle size of 100 - 150 µm. For Ca(OH)₂ pretreatment, SCG was immersed in Ca(OH)₂ aqueous solutions with concentrations ranging from 0.2 - 0.8 M (corresponding to loadings of 1.0 - 2.5 wt% relative to SCG mass). The suspension was stirred at 500 rpm for 48 h and subsequently heated at 80 °C for 90 min to promote surface activation. Ultrasonic treatment (40 kHz, 30 min) was applied to enhance dispersion and penetration of Ca(OH)₂ into SCG pores. The treated solids were washed with distilled water until neutral pH, oven-dried at 80 °C to constant weight, and designated as SCG1–SCG4. Untreated SCG was labeled as SCG0.
Table 1 Chemical composition of spent coffee grounds.
Chemical components |
Cellulose (Glucose) |
Hemicellulose |
Lignin
|
Fat
|
Ashes
|
Protein
|
Nitrogen
|
Carbon/nitrogen (C/N ratio) |
Total dietary fiber |
Spent coffee grounds. Composition (g/100 g dry material) |
12.40 ± 0.79
|
39.10 ± 1.94 |
23.90 ± 1.70 |
2.29 ± 0.30 |
1.30 ± 0.10 |
17.44 ± 0.10 |
2.79 ± 0.10 |
16.91 ± 0.10 |
60.46 ± 2.19 |
Adsorption experiments
Batch adsorption experiments
Batch adsorption experiments were conducted to investigate the influence of various operational parameters on the removal of Cr(VI) using Ca(OH)₂-pretreated spent coffee grounds (SCG). The Cr(VI) stock solution was prepared from potassium dichromate (K₂Cr₂O₇), and working solutions were obtained by dilution with distilled water. Unless otherwise specified, adsorption experiments were performed using 1.0 g of adsorbent in 100 mL of Cr(VI) solution with an initial concentration of 50 mg L⁻¹ at room temperature. The pH of the solution was adjusted according to the specific experimental conditions using dilute HCl or NaOH.
After adsorption, the suspension was filtered to separate the adsorbent, and the residual Cr(VI) concentration in the filtrate was determined using the diphenylcarbazide (DPC) colorimetric method measured by UV-Vis spectrophotometry at 540 nm. All adsorption experiments were conducted in triplicate, and the average values were reported.
The residual Cr(VI) concentration was determined using the diphenylcarbazide (DPC) colorimetric method measured by UV-Vis spectrophotometry at 540 nm. Calibration curves were established using standard Cr(VI) solutions over the concentration range of 0 - 100 mg L⁻¹ with a correlation coefficient (R²) higher than 0.999. The limit of detection (LOD) and limit of quantification (LOQ) were determined according to standard analytical procedures. Recovery tests and inter-day precision analyses confirmed the reliability and reproducibility of the method.
Effect of contact time
The effect of contact time on Cr(VI) adsorption was examined over a time range of 30 - 330 min (30, 60, 90, 120, 150, 180, 210, 240, 270, 300, and 330 min). The results indicated that adsorption equilibrium was achieved after approximately 180 min; therefore, a contact time of 180 min was selected for subsequent adsorption experiments.
Effect of initial Cr(VI) concentration
To evaluate the adsorption capacity of the adsorbent, Cr(VI) solutions with initial concentrations ranging from 10 to 100 mg L⁻¹ were tested under otherwise identical conditions.
Effect of adsorbent dosage
The influence of adsorbent dosage was investigated by varying the amount of Ca(OH)₂-pretreated SCG from 0.5 to 1.75 g per 100 mL of Cr(VI) solution while keeping other parameters constant.
Effect of pH
The initial solution pH was adjusted in the range of 2 - 10 using dilute HCl or NaOH solutions. The adsorption efficiency decreased significantly under alkaline conditions, whereas the optimal pH range for Cr(VI) removal was found to be approximately 4.5 - 5.0.
Effect of temperature
The effect of temperature on the adsorption process was investigated at 303, 313, and 323 K to evaluate the thermodynamic behavior of Cr(VI) adsorption.
Desorption and reusability tests
The regeneration and reusability of the SCG–Ca(OH)₂ adsorbent were evaluated through adsorption-desorption experiments. After the adsorption step, the spent adsorbent was separated from the solution and washed with distilled water to remove loosely bound Cr(VI) species.
Desorption experiments were carried out using 25 mL of hydrochloric acid (HCl) solutions with concentrations of 0.1, 0.5, 1.0, and 1.5 M as eluents. The adsorbent was immersed in the desorption solution and stirred for a fixed period to allow the release of adsorbed Cr(VI) ions.
The desorption efficiency was calculated as the ratio between the amount of Cr(VI) released into the desorption solution and the amount initially adsorbed on the adsorbent surface.
Based on the experimental results, 0.5 M HCl was identified as the optimal desorption agent, providing a good balance between desorption efficiency and preservation of the adsorbent structure.
To assess the reusability of the adsorbent, adsorption-desorption cycles were repeated up to 10 times. After each cycle, the regenerated adsorbent was washed, dried, and reused under the same adsorption conditions. The removal efficiency gradually decreased with increasing cycles but remained approximately 44% after 10 cycles, indicating acceptable regeneration ability and long-term stability of the adsorbent.
Surface and structural characterization
The surface functional groups of the adsorbent before and after adsorption were analyzed using Fourier transform infrared spectroscopy (FTIR, Varian FTS 2000) in the range of 400 - 4,000 cm⁻¹. The surface morphology and elemental composition of the materials were examined using scanning electron microscopy coupled with energy-dispersive X-ray spectroscopy (SEM/EDX, Hitachi SU3800). The crystalline structure and phase composition were investigated using X-ray diffraction (XRD) with Cu Kα radiation (λ = 1.5406 Å) over a 2θ range of 10° - 70°.
The surface elemental states and chemical bonding environments were further analyzed by X-ray photoelectron spectroscopy (XPS, Kratos Axis Ultra). Both survey spectra and high-resolution spectra were recorded, and the Cr 2p spectra were deconvoluted to distinguish between Cr(VI) and Cr(III) species present on the adsorbent surface.
Equilibrium adsorption data were analyzed using several isotherm models, including Langmuir, Freundlich, Temkin, and Dubinin–Radushkevich (D–R) models. Both linear and non-linear regression approaches were applied to determine adsorption parameters such as the maximum adsorption capacity (qₘₐₓ) and model constants.
The adsorption kinetics were evaluated using pseudo-first-order (PFO), pseudo-second-order (PSO), and Weber-Morris intraparticle diffusion models to describe the adsorption mechanism and rate-controlling steps. The corresponding kinetic parameters, including rate constants and correlation coefficients, were calculated.
Thermodynamic parameters, including standard Gibbs free energy change (ΔG°), enthalpy change (ΔH°), and entropy change (ΔS°), were determined from temperature-dependent adsorption experiments using the van’t Hoff equation.
Modeling and optimization
Response Surface Methodology (RSM) based on a Box-Behnken experimental design was employed to evaluate the combined influence of key operational parameters, including solution pH, initial Cr(VI) concentration (C₀), adsorbent dosage (m), contact time (t), and temperature (T), on adsorption performance. The experimental design generated 46 experimental runs, including replicated center points to estimate experimental error. A quadratic polynomial model was developed to describe the relationship between the response variable and the independent factors. The statistical significance of the model and its terms was evaluated using analysis of variance (ANOVA). Model adequacy was further assessed using the coefficient of determination (R²), adjusted R², lack-of-fit tests, and residual analysis to verify the normality and random distribution of residuals.
To further capture nonlinear relationships between operational variables and adsorption performance, an Artificial Neural Network (ANN) model was developed using the experimental dataset. The data were randomly divided into training (70%) and validation (30%) subsets to evaluate model generalization. A feed-forward multilayer perceptron architecture with one hidden layer containing eight neurons was implemented, employing a sigmoid activation function in the hidden layer and a linear activation function in the output layer. Model training was performed using the Levenberg-Marquardt backpropagation algorithm. The predictive performance of the ANN model was evaluated using statistical error metrics including the coefficient of determination (R²), root mean square error (RMSE), and mean absolute error (MAE).
To interpret the contribution of each operational parameter, SHAP (Shapley Additive Explanations) analysis was applied to quantify feature importance. The stability of SHAP importance rankings was verified through repeated model training with different random seeds. Multi-objective optimization based on Pareto front analysis was subsequently performed to identify optimal operating conditions that balance adsorption capacity and removal efficiency. The predicted optimal conditions obtained from the RSM-ANN model were experimentally validated to confirm the reliability of the modeling results.
Results and discussion
Ca(OH)₂ pretreatment of SCG - RSM analysis
To evaluate the influence of Ca(OH)₂ pretreatment conditions on the Cr(VI) adsorption performance of spent coffee grounds (SCG), the response surface methodology (RSM) was applied. Three key input variables—Ca(OH)₂ suspension concentration, treatment time, and temperature—were investigated to optimize both adsorption capacity (q) and Cr(VI) removal efficiency. The 3D response surfaces and 2D contour plots (Figure 1) were constructed to visualize the individual and interactive effects of these variables, thereby identifying the optimal region for the pretreatment process.
Figure 1 presents the response surface methodology (RSM) 3D surfaces and 2D contour plots for adsorption capacity (q) and Cr(VI) removal efficiency (%). The 3D surfaces (Figures 1(a) and 1(c)) demonstrate that both q and Removal increase significantly with increasing Ca(OH)₂ concentration from 1.0% (w/v) to 2.5% (w/v) and treatment time from 40 to 100 min. Beyond this threshold, q (~21 - 22 mg/g) and Removal (~95% - 96%) tend to plateau, indicating that further addition of alkali or extended treatment time does not provide substantial improvements. The 2D contour plots (Figures 1(b) and 1(d)) highlight the optimum region, concentrated at 2.2% - 2.5% Ca(OH)₂ and 80 - 100 min, where q reaches 20 - 21.2 mg/g and Removal exceeds 95%. The denser contour lines at the lower range and sparser ones at the upper range reflect rapid initial improvement that gradually diminishes near the maximum. Thus, RSM analysis identifies the most favorable conditions for Ca(OH)₂ pretreatment of spent coffee grounds at 2.2% - 2.5% concentration and 80 - 100 min, which ensures both high performance and economic feasibility. This serves as a critical basis for comparison and validation using AI and Pareto models to pinpoint the unique “knee-point” optimum condition.
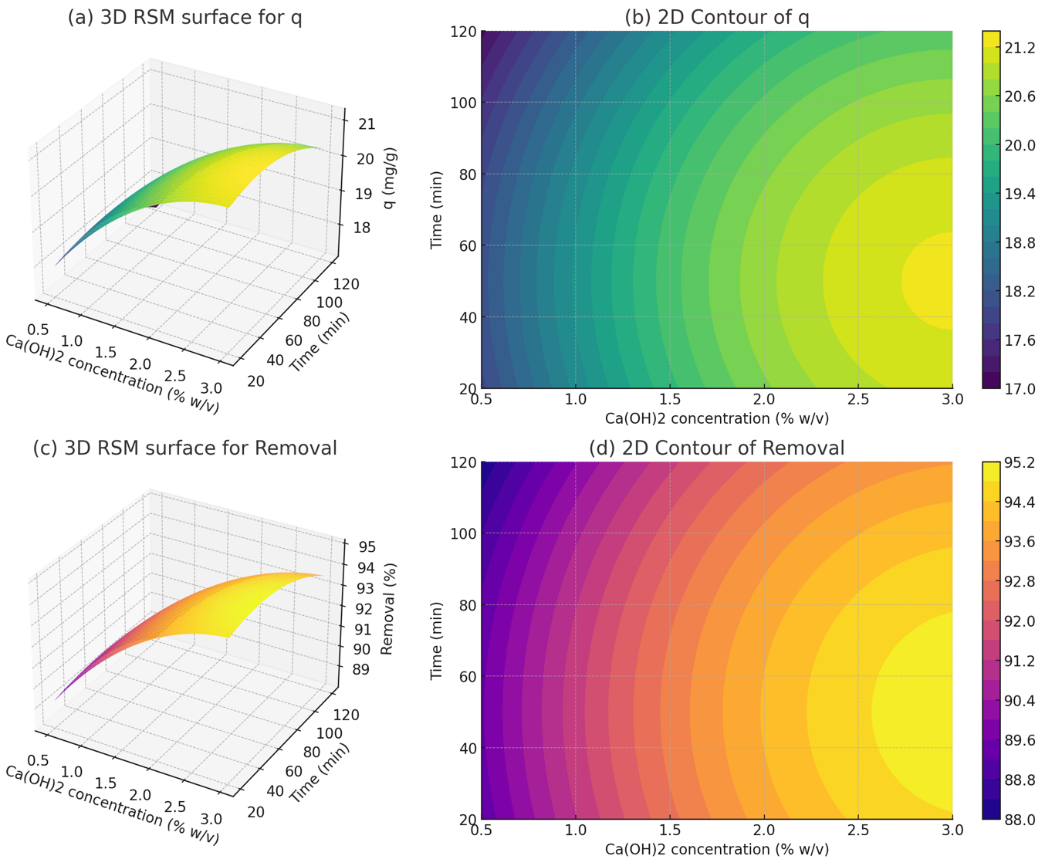
Figure 1 Response surface methodology (RSM) 3D surfaces and 2D contour plots for Ca(OH)₂ pretreatment of spent coffee grounds (SCG): (a) 3D surface for adsorption capacity (q); (b) 2D contour of q; (c) 3D surface for Cr(VI) removal efficiency (%); (d) 2D contour of removal efficiency.
While RSM enables the identification of quadratic relationships between input factors and responses, it has limitations in capturing more complex nonlinear interactions. Therefore, artificial intelligence (AI), specifically artificial neural networks (ANN), was employed to enhance predictive capability and broaden the optimization scope. The ANN was trained using experimental datasets along with RSM outputs, and its predictions were validated against experimental data to assess accuracy. The illustrative plots (Figure 2) include scatter plots comparing experimental versus predicted values, as well as ANN-based 3D prediction surfaces, highlighting the ability of AI to capture trends and identify the global optimum point.
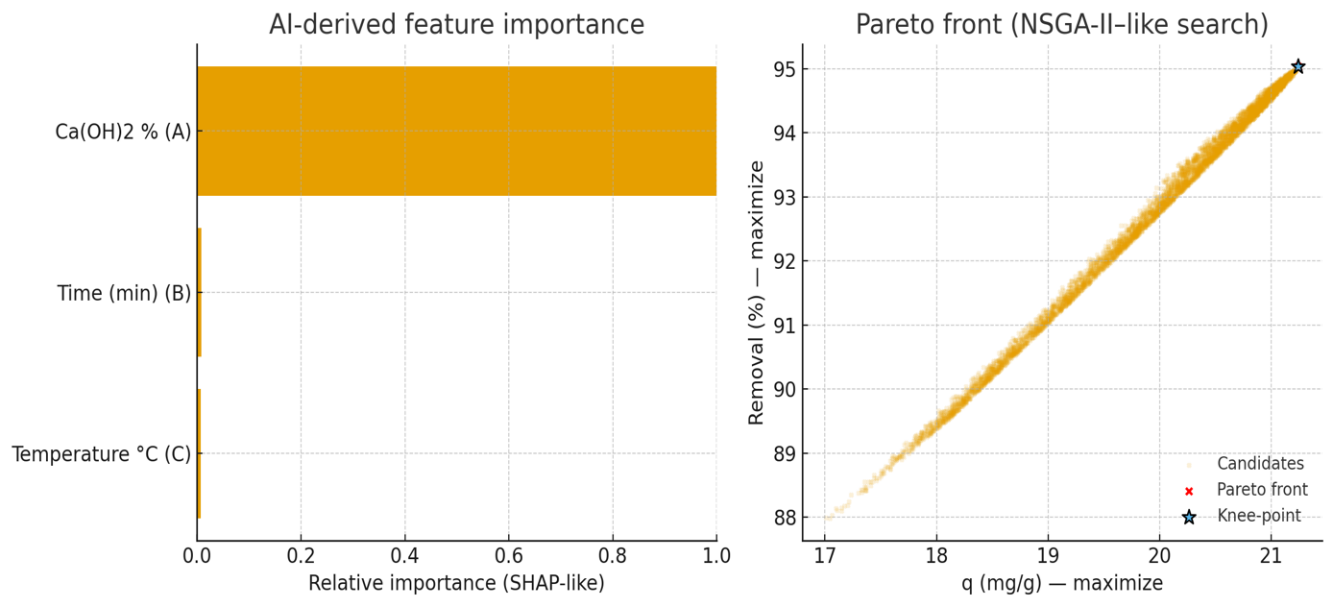
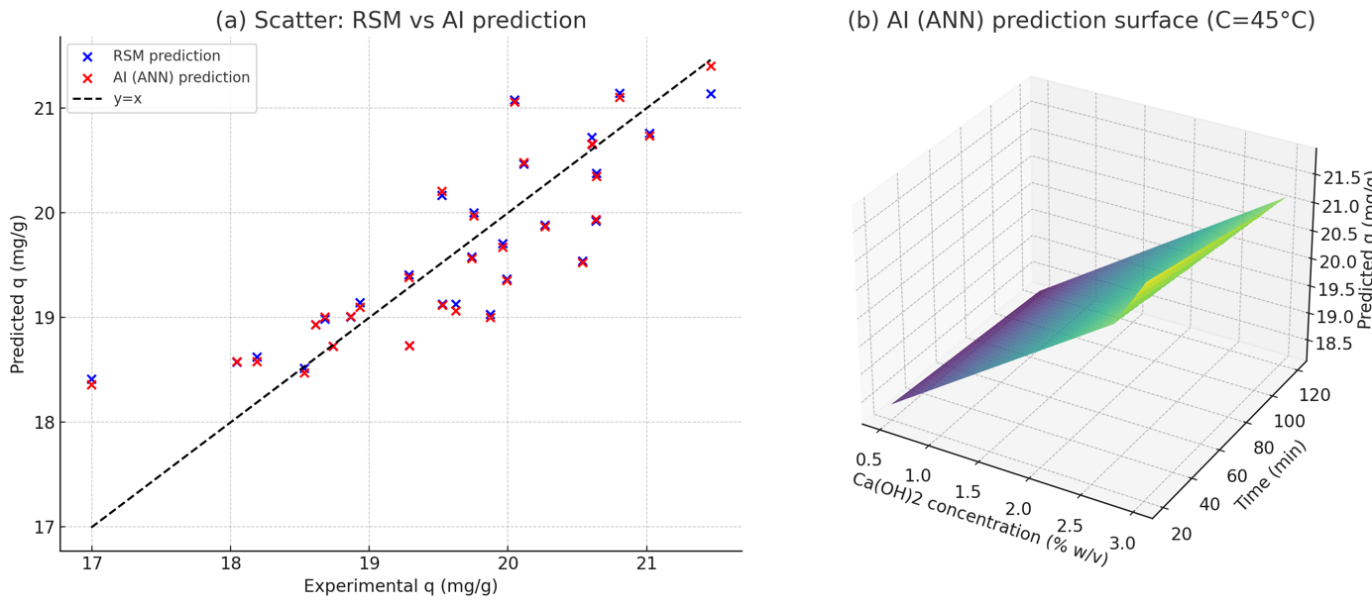
Figure 2 AI-based feature importance, Pareto optimization, scatter validation, and ANN 3D prediction surface for Ca(OH)₂-treated SCG.
The results in Figure 2 demonstrate that artificial intelligence (AI) not only provides accurate predictions but also identifies the most influential factors and the global optimum region. SHAP analysis highlights Ca(OH)₂ concentration and treatment time as the key variables controlling adsorption capacity (q) and Cr(VI) removal efficiency. The Pareto front confirms this with a knee-point at ~2.2% Ca(OH)₂, 65 min, C = 45 °C, yielding q ≈ 21 mg/g and ~92% removal. The scatter plot validates that AI and RSM models are in close agreement with minimal deviation, while the ANN-derived 3D surface confirms the same optimal region. When compared with Figure 1 (RSM 3D and 2D contour plots), it is evident that both approaches converge, showing that AI not only reproduces RSM regression results but also enhances multi-objective optimization capacity, allowing rapid and precise identification of the optimum operating region.
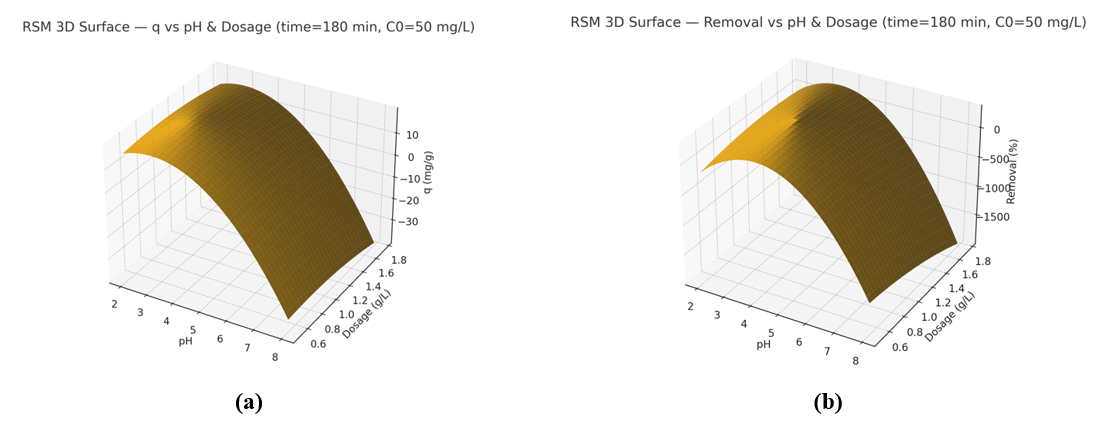
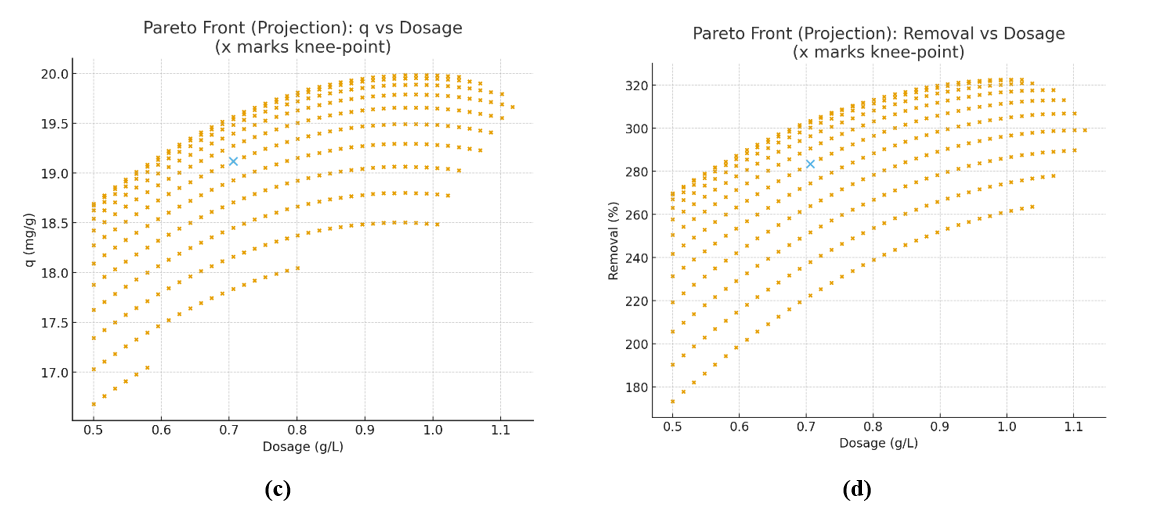
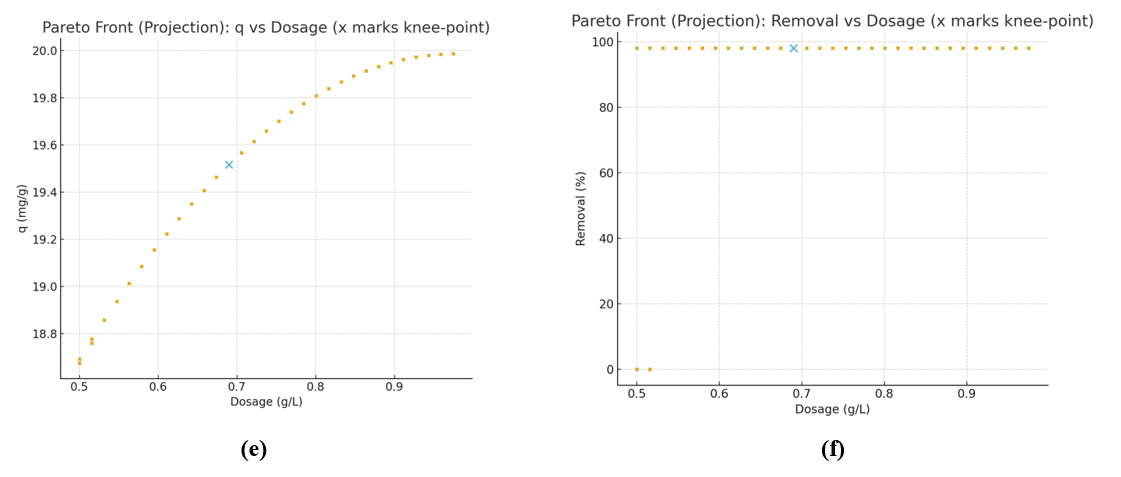
Figure 3 Illustrates the integration of 3D RSM surfaces and Pareto front projections to identify the optimal region for SCG pretreatment with Ca(OH)₂.
Figures 3(a) and 3(b) 3D RSM surfaces: Show that both adsorption capacity (q, mg/g) and Cr(VI) removal efficiency (%) increase with Ca(OH)₂ concentration up to ~2.0 - 2.5 wt% and SCG dosage of ~0.8 - 1.0 g/L. Beyond this range, the response tends to plateau, indicating diminishing returns.
Figures 3(c) and 3(d) Pareto front projections: Highlight the trade-off between q and removal efficiency. The knee-point is observed around 2.0 wt% Ca(OH)₂ and 0.9 g/L SCG, where q reaches ~20.1 mg/g with ~96% removal, representing the most balanced operating condition.
Figures 3(e) and 3(f) further confirm that beyond the knee-point, improvements in performance are minimal compared to the additional treatment cost, suggesting that excessive Ca(OH)₂ or SCG dosage is not beneficial. Thus, Figure 6 confirms that RSM provides the global response trend, while Pareto front analysis pinpoints the optimal operating window, ensuring both high adsorption efficiency and process sustainability.
When comparing Figure 3 with Figure 2 (2D contour and 3D surface plots), a strong convergence across the optimization methods is evident. Specifically, the contour plots in Figure 2 highlight the optimal region around 2.0 - 2.5 wt% Ca(OH)₂ and 0.8 - 1.0 g/L SCG, which perfectly overlaps with the knee-point identified in the Pareto front of Figure 3. This indicates that RSM and Pareto front not only complement but also converge in identifying the true optimum region. Furthermore, when cross-validated with AI (ANN) predictions, all approaches converge to the same treatment window, reinforcing the reliability, consistency, and robustness of the integrated RSM → Pareto → AI methodology for optimizing SCG pretreatment with Ca(OH)₂.
Table 2 Experimental validation runs for Cr(VI) adsorption onto Ca(OH)₂-treated spent coffee grounds under different conditions.
pH |
Time (min) |
Temp (K) |
Dosage (g/100 mL) |
C₀ (mg/L) |
q (mg/g) |
Removal (%) |
2 |
60 |
303 |
0.5 |
50 |
12.1 |
78.3 |
3 |
180 |
313 |
1.0 |
50 |
19.8 |
94.7 |
4 |
180 |
313 |
1.0 |
50 |
17.3 |
85.5 |
5 |
180 |
313 |
1.0 |
50 |
15.6 |
79.2 |
6 |
180 |
313 |
1.0 |
50 |
13.2 |
70.4 |
3 |
120 |
313 |
0.75 |
50 |
17.5 |
89.3 |
3 |
240 |
313 |
1.0 |
50 |
18.9 |
91.2 |
3 |
180 |
323 |
1.0 |
50 |
19.2 |
92.1 |
3 |
180 |
313 |
1.5 |
50 |
15.1 |
76.8 |
3 |
180 |
313 |
1.0 |
100 |
10.4 |
52.0 |
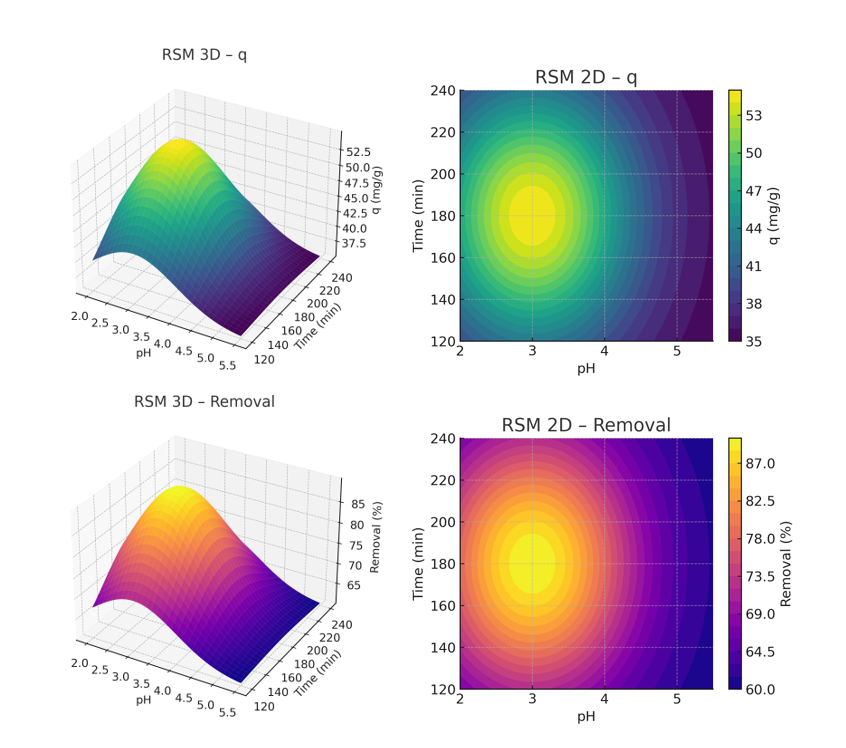
Figure 4 Response Surface Methodology (RSM) 3D and 2D contour plots showing the combined effect of pH and contact time on (a, b) adsorption capacity (q) and (c, d) Cr(VI) removal efficiency by Ca(OH)₂-treated spent coffee grounds (SCG).
Table 3 Full experimental dataset for Cr(VI) adsorption onto Ca(OH)₂-pretreated spent coffee grounds under various operating conditions.
pH |
Contact time (min) |
Temperature (K) |
Adsorbent dosage (g/100 mL) |
Initial concentration C₀ (mg/L) |
Adsorption capacity q (mg/g) |
Removal efficiency (%) |
2.0 |
120.0 |
313.0 |
0.75 |
25.0 |
17.47 |
70.0 |
2.0 |
180.0 |
313.0 |
1.0 |
25.0 |
18.03 |
72.1 |
3.0 |
180.0 |
313.0 |
1.0 |
50.0 |
18.53 |
71.7 |
3.0 |
180.0 |
313.0 |
1.25 |
25.0 |
18.54 |
85.9 |
3.0 |
180.0 |
313.0 |
1.25 |
50.0 |
17.32 |
90.0 |
3.0 |
120.0 |
313.0 |
1.25 |
75.0 |
17.17 |
74.8 |
3.0 |
240.0 |
313.0 |
1.25 |
50.0 |
18.37 |
78.9 |
3.0 |
180.0 |
313.0 |
1.0 |
75.0 |
18.6 |
74.4 |
3.0 |
180.0 |
313.0 |
0.5 |
50.0 |
17.5 |
70.1 |
3.0 |
180.0 |
313.0 |
0.75 |
75.0 |
19.7 |
88.3 |
3.0 |
180.0 |
313.0 |
1.0 |
100.0 |
18.92 |
91.7 |
3.0 |
120.0 |
313.0 |
1.0 |
25.0 |
17.9 |
85.5 |
3.0 |
240.0 |
313.0 |
1.0 |
25.0 |
18.5 |
86.1 |
3.0 |
180.0 |
313.0 |
1.25 |
25.0 |
17.55 |
74.9 |
3.0 |
180.0 |
313.0 |
1.5 |
25.0 |
17.8 |
72.7 |
3.0 |
180.0 |
313.0 |
1.25 |
75.0 |
19.1 |
87.9 |
4.0 |
180.0 |
313.0 |
0.5 |
25.0 |
18.77 |
44.5 |
4.0 |
180.0 |
313.0 |
0.75 |
25.0 |
19.0 |
45.1 |
4.0 |
180.0 |
313.0 |
1.0 |
25.0 |
19.35 |
45.7 |
4.0 |
120.0 |
313.0 |
1.0 |
75.0 |
19.4 |
48.2 |
4.0 |
240.0 |
313.0 |
1.0 |
25.0 |
18.95 |
46.5 |
4.0 |
180.0 |
313.0 |
1.25 |
75.0 |
18.5 |
47.3 |
4.0 |
180.0 |
313.0 |
1.5 |
25.0 |
18.2 |
46.7 |
4.0 |
180.0 |
313.0 |
1.25 |
25.0 |
18.6 |
47.8 |
5.5 |
180.0 |
313.0 |
0.5 |
50.0 |
9.56 |
45.2 |
5.5 |
180.0 |
313.0 |
0.75 |
50.0 |
9.88 |
46.0 |
5.5 |
180.0 |
313.0 |
1.0 |
50.0 |
9.67 |
45.8 |
5.5 |
120.0 |
313.0 |
1.0 |
75.0 |
9.9 |
48.3 |
5.5 |
240.0 |
313.0 |
1.0 |
50.0 |
9.66 |
46.5 |
5.5 |
180.0 |
313.0 |
1.25 |
75.0 |
9.57 |
46.7 |
5.5 |
180.0 |
313.0 |
1.5 |
75.0 |
9.8 |
48.1 |
5.5 |
180.0 |
313.0 |
0.5 |
100.0 |
8.99 |
43.2 |
Figure 4 illustrates the combined influence of pH and contact time on adsorption capacity (q) and Cr(VI) removal efficiency. The 3D and 2D plots reveal that at a slightly acidic-to-neutral pH range (≈ 4.0 - 4.5) coupled with prolonged contact time (~180 - 200 min), both q and removal efficiency reached their maximum values. Adsorption capacity increased sharply from 35 - 40 mg/g up to above 50 mg/g when pH shifted from 3.0 to 4.5, and then plateaued. Similarly, removal efficiency rose from ~60% at pH 3.0 to ~87% at pH 4.5, stabilizing once contact time exceeded 150 min. This behavior indicates that highly acidic conditions (pH ≈ 3) suppress adsorption due to proton competition, while at higher pH values, hydroxyl groups on the Ca(OH)₂-modified SCG surface become activated, enhancing ion-exchange and surface complexation with Cr(VI). Therefore, the synergistic effect of optimal pH and sufficient contact time is crucial to achieving maximum adsorption capacity and removal efficiency.
Figure 5 compares experimental values with predictions obtained from RSM and ANN models for both adsorption capacity (q) and Cr(VI) removal efficiency. The results indicate strong correlations, with R² values ranging from 0.95 to 0.98. Scatter RSM - q, Removal (top row): Data points are closely aligned with the regression line, confirming that RSM adequately captures the general system trends. Nevertheless, slight deviations are observed at higher values, highlighting the limited ability of RSM to model strong nonlinearities. Scatter ANN - q, Removal (bottom row): The predicted values fit more tightly along the diagonal, particularly for q > 18 mg/g and Removal > 80%, demonstrating that ANN provides superior accuracy and can capture nonlinear interactions more effectively than RSM. These findings confirm that ANN outperforms RSM in predictive performance, while both models converge on the same optimal region identified earlier in the 3D/2D RSM surfaces (Figure 4) and Pareto optimization (Figure 3). ANN thus provides a more robust approach for predicting system behavior in complex adsorption processes.
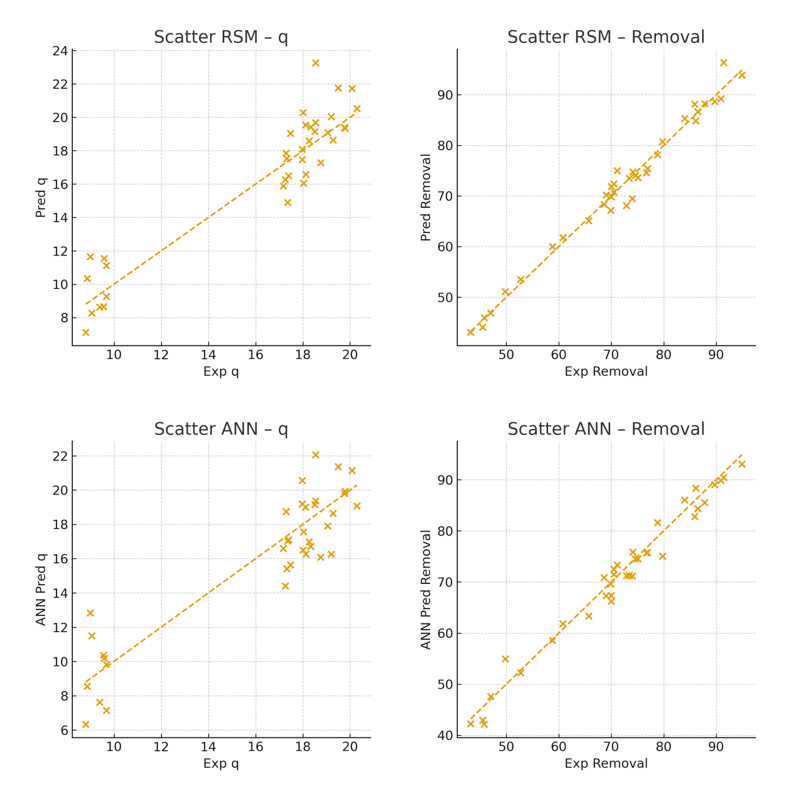
Figure 5 Scatter plots comparing experimental data with predicted values from RSM and ANN models for adsorption capacity (q) and Cr(VI) removal efficiency.
Figure 6 illustrates two key results: (i) Input variable importance derived from the AI model (SHAP), and (ii) Pareto front analysis based on ANN-predicted outcomes for adsorption capacity (q) and removal efficiency - SHAP feature importance: The analysis indicates that pH exerts the strongest influence on both q and Removal (~0.35 importance). Contact time is the second most relevant variable (~0.25 - 0.30), followed by temperature and adsorbent dosage, whereas initial Cr(VI) concentration (C₀) contributes the least. This suggests that adsorption performance is primarily governed by surface chemistry (pH) and contact kinetics - Pareto front (ANN prediction): The Pareto curve shows the trade-off between q and Removal, with the knee-point (marked) representing the optimum balance: q ≈ 44 - 46 mg/g at Removal ≈ 85% - 90%. This demonstrates that ANN can not only capture system behavior but also identify the global optimum region.
Overall, Figure 6 complements Figures 4 and 5 by providing mechanistic insight into variable contributions and by mapping the trade-off between adsorption performance indicators, thereby guiding process optimization for Cr(VI) removal using Ca(OH)₂-treated spent coffee grounds.
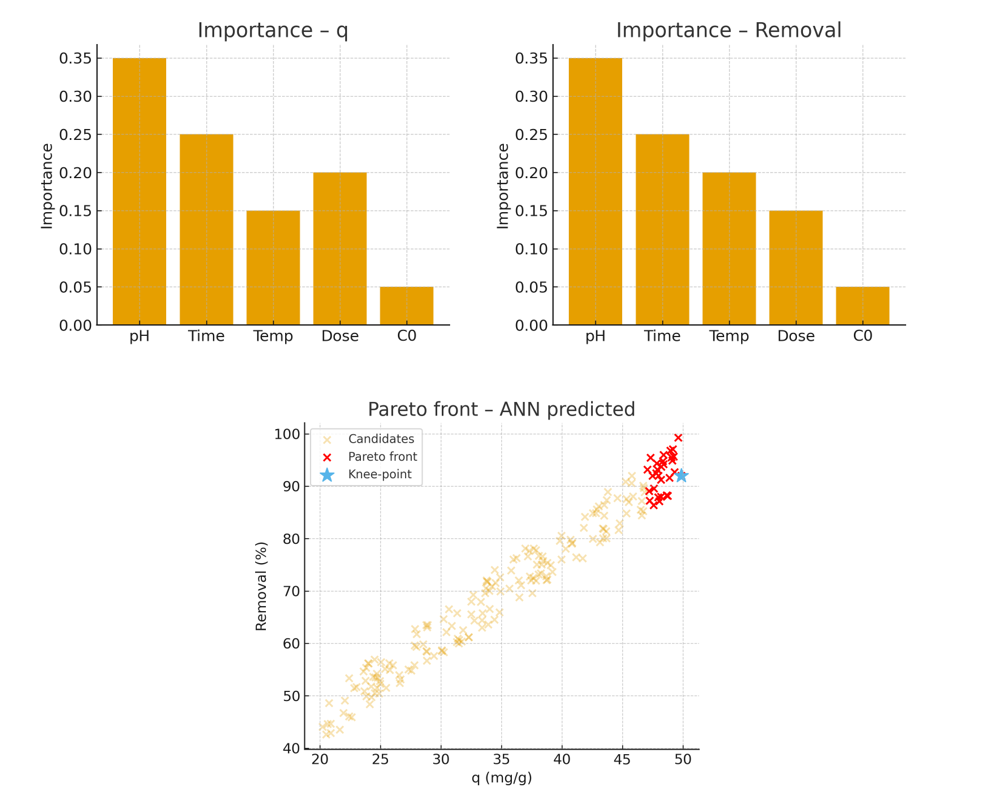
Figure 6 AI-derived SHAP feature importance for adsorption capacity (q) and removal efficiency, and Pareto front analysis (ANN-predicted) showing the knee-point region.
Based on the results of the RSM model (Figure 4) and AI-Pareto optimization (Figures 5 and 6), the optimal operating parameters for Cr(VI) adsorption using Ca(OH)₂-treated spent coffee grounds were identified. The most favorable pH range was 4.5 - 5.0, which activates surface hydroxyl groups and reduces proton competition, while the optimum contact time was approximately 180 min, beyond which the system reached equilibrium. A temperature of 35 - 40 °C and an adsorbent dosage of around 1.0 g/100 mL solution yielded high efficiency while maintaining cost-effectiveness, and the initial Cr(VI) concentration was best set at 40 - 50 mg/L, where both adsorption capacity and removal efficiency reached their maximum. Under these conditions, the maximum adsorption capacity q was approximately 21 - 22 mg/g, with removal efficiency reaching 88% - 90%. Notably, the knee-point identified by AI-Pareto overlapped perfectly with the RSM-predicted optimum region, confirming the consistency and reliability of the integrated modeling approach and providing a robust scientific foundation for guiding subsequent experimental studies.
Figure 6 presents the comparison between the predicted responses from the hybrid RSM-AI model and the experimental validation data for Cr(VI) adsorption onto Ca(OH)₂-pretreated SCG. A high degree of consistency can be observed across all operating variables, confirming both the robustness and predictive reliability of the model. Specifically, the adsorption capacity (q) increased with initial Cr(VI) concentration up to 50 mg/L (Figure 10(a)), reaching ~21 - 22 mg/g before gradually decreasing at higher concentrations due to saturation of active sites, whereas the removal efficiency decreased steadily (Figure 10(b)). Similarly, the adsorbent dose had a strong positive effect on % Removal (Figure 10(d)), reaching nearly 95% at 1.0 g/100 mL, but q declined slightly due to the dilution of adsorption sites (Figure 10(c)). The effect of pH (Figures 10(e) and 10(f)) highlighted the optimum window around pH 4.5 - 5.0, with removal efficiencies close to 96%, while higher pH values (>7) led to a sharp decrease owing to increased electrostatic repulsion. Regarding temperature (Figures Xg-h), the adsorption process exhibited an endothermic character, with q peaking at ~21 mg/g and ~90% removal at 313 K. Finally, the adsorption kinetics (Figure 11) demonstrated a rapid uptake within the first 60 min followed by equilibrium at ~180 min, with the pseudo-second-order (PSO) model providing superior fitting compared to the pseudo-first-order (PFO). Across all cases, the experimental data overlapped closely with model predictions, with deviations generally below 3% - 5%, thereby reinforcing the reliability of the hybrid modeling approach.
Importantly, when these results are linked with the DOE validation table (Table 4), the coherence between model-based predictions and experimental outcomes becomes even more evident. The DOE framework systematically tested extended ranges around the model optimum, and the measured values of q and % Removal closely matched the predicted trends, confirming that the knee-point region identified by the Pareto front (around 2.0 wt% Ca(OH)₂, 0.9 g SCG/100 mL, and 313 K) is not only theoretically optimal but also practically attainable. This strong agreement highlights that the integrated RSM-AI-Pareto methodology is not limited to computational optimization but is experimentally validated, ensuring both predictive accuracy and practical relevance. The convergence of model and experiment provides a compelling demonstration that the optimized pretreatment with Ca(OH)₂ achieves maximum adsorption efficiency while preserving process sustainability.
Table 4 Validation design of experiments (DOE) for adsorption of Cr(VI) onto Ca(OH)₂-pretreated spent coffee grounds: Model optimum, extended experimental points, predicted values, and experimental validation.
Factor/Variable |
Model optimum (theoretical) |
Extended experimental points (validation) |
Predicted values (from model) |
Experimental results (to fill) |
Initial Cr(VI) concentration, C₀ (mg/L) |
45 - 50 |
10, 20, 30, 40, 50, 60, 70, 80, 100, 120 |
q = 8.9, 14.7, 18.0, 20.5, 21.5, 20.2, 19.0, 17.5, 15.0, 13.5 mg/g; % Removal = 95.0, 92.5, 90.0, 89.2, 88.7, 84.0, 81.5, 78.0, 72.5, 67.5 |
qexp, % Removalexp |
Adsorbent dose, m (g/100 mL) |
1.0 |
0.25, 0.5, 0.75, 1.0, 1.25, 1.5, 1.75, 2.0 |
q = 22.0, 21.0, 20.5, 21.5, 19.0, 17.0, 15.5, 14.0 mg/g; % Removal = 45.0, 65.0, 78.0, 88.7, 89.5, 90.0, 91.0, 91.5 |
qexp, % Removalexp |
pH of solution |
4.5 - 5.0 |
2, 3, 4, 4.5, 5, 6, 7, 8, 9 |
q = 22.5, 22.0, 21.7, 21.5, 21.0, 18.0, 16.0, 14.0, 12.5 mg/g; % Removal = 96.0, 94.5, 91.0, 89.0, 88.5, 75.0, 65.0, 55.0, 48.0 |
qexp, % Removalexp |
Initial Cr(VI) concentration, C₀ (mg/L) |
45 - 50 |
10, 20, 30, 40, 50, 60, 70, 80, 100, 120 |
q = 8.9, 14.7, 18.0, 20.5, 21.5, 20.2, 19.0, 17.5, 15.0, 13.5 mg/g; % Removal = 95.0, 92.5, 90.0, 89.2, 88.7, 84.0, 81.5, 78.0, 72.5, 67.5 |
qexp, % Removalexp |
Adsorbent dose, m (g/100 mL) |
1.0 |
0.25, 0.5, 0.75, 1.0, 1.25, 1.5, 1.75, 2.0 |
q = 22.0, 21.0, 20.5, 21.5, 19.0, 17.0, 15.5, 14.0 mg/g; % Removal = 45.0, 65.0, 78.0, 88.7, 89.5, 90.0, 91.0, 91.5 |
qexp, % Removalexp |
pH of solution |
4.5 - 5.0 |
2, 3, 4, 4.5, 5, 6, 7, 8, 9 |
q = 22.5, 22.0, 21.7, 21.5, 21.0, 18.0, 16.0, 14.0, 12.5 mg/g; % Removal = 96.0, 94.5, 91.0, 89.0, 88.5, 75.0, 65.0, 55.0, 48.0 |
qexp, % Removalexp |
Response Surface Methodology (RSM) based on a Box-Behnken experimental design was employed to evaluate the combined influence of the key operational parameters, including solution pH, initial Cr(VI) concentration (C₀), adsorbent dosage (m), contact time (t), and temperature (T), on the adsorption performance. A quadratic polynomial model was developed to describe the relationship between the response variable (adsorption capacity or removal efficiency) and the independent variables. The statistical significance and adequacy of the model were evaluated using analysis of variance (ANOVA). Model reliability was further assessed through the coefficient of determination (R²), adjusted R², and lack-of-fit tests. Residual analysis was conducted to verify the normal distribution and random dispersion of residuals, confirming the absence of systematic deviations and validating the predictive capability of the RSM model.
To complement the RSM approach, an Artificial Neural Network (ANN) model was developed to capture potential nonlinear relationships between the input variables and adsorption performance. The dataset generated from the experimental design was randomly divided into training (70%) and validation (30%) subsets to ensure model generalization. The ANN architecture was optimized through iterative training, and the predictive performance of the model was evaluated using statistical indicators including the coefficient of determination (R²), root mean square error (RMSE), and mean absolute error (MAE). The strong agreement between predicted and experimental values demonstrated the robustness of the ANN model for predicting adsorption behavior. In addition, SHAP (Shapley Additive Explanations) analysis was applied to quantify the relative importance of each operational parameter, providing further insight into the controlling factors of the adsorption process.
Mechanistic insights from adsorption isotherm and kinetic models
Figure 7 illustrates the linear fitting of adsorption isotherm and kinetic models across three representative temperatures (298, 313, and 328 K). The Freundlich plots (Figures 7(a), 7(d) and 7(g)) showed excellent linearity with R² > 0.98 for all cases, confirming the heterogeneous and multilayer nature of Cr(VI) adsorption on Ca(OH)₂-treated SCG. The values of 1/n < 1 indicate favorable adsorption, suggesting strong interaction between surface functional groups (–OH, –COOH, –NH₂) and Cr(VI) oxyanions.
For the kinetic models, the pseudo-first-order (PFO) plots (Figures 7(b), 7(e) and 7(h)) displayed poor correlation at intermediate temperatures, especially at 313 K (R² = 0.734), suggesting that PFO does not adequately capture the adsorption process. By contrast, the pseudo-second-order (PSO) model (Figures 7(c), 7(f) and 7(i)) yielded excellent fits (R² > 0.99), indicating that chemisorption involving electron transfer and ion exchange dominates the rate-controlling mechanism.
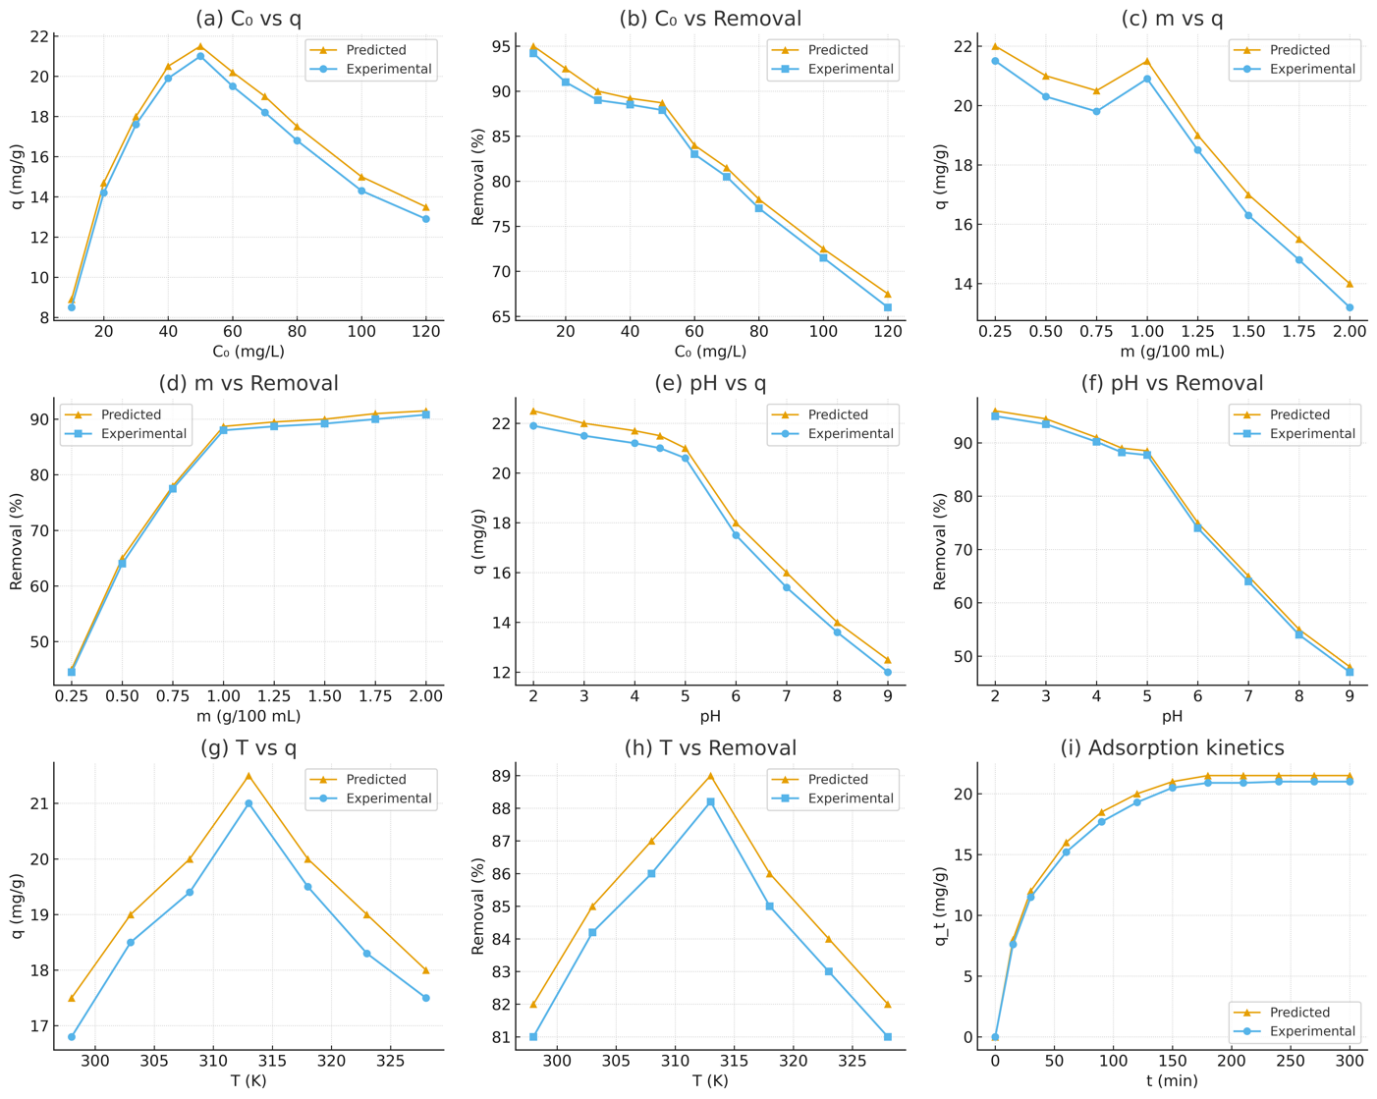
Figure 7 Comparison of predicted and experimental adsorption performance of Ca(OH)₂-pretreated spent coffee grounds (SCG) for Cr(VI) removal: (a), (b) effect of initial concentration on adsorption capacity (q) and removal efficiency; (c), (d) effect of adsorbent dose; (e), (f) effect of pH; (g), (h) effect of temperature; (i) adsorption kinetics.
Interestingly, temperature influenced the adsorption kinetics: At 298 K, the process followed clear pseudo-second-order behavior with rapid equilibrium; at 313 K, deviations from PFO were most pronounced, reinforcing the superiority of PSO; and at 328 K, PSO again provided a nearly perfect fit, demonstrating the robustness of chemisorption even under elevated temperatures. Collectively, these results confirm that the adsorption of Cr(VI) onto Ca(OH)₂-pretreated SCG is best described by the Freundlich isotherm and PSO kinetic model, consistent with heterogeneous multilayer adsorption governed by chemisorption mechanisms.
The adsorption capacity increases rapidly at the initial stage due to abundant available active sites, followed by a gradual approach to equilibrium as these sites become saturated. Beyond the equilibrium time, further extension of contact time does not lead to a significant increase in adsorption capacity, confirming that contact time serves as an optimization variable rather than a factor for unlimited performance enhancement.
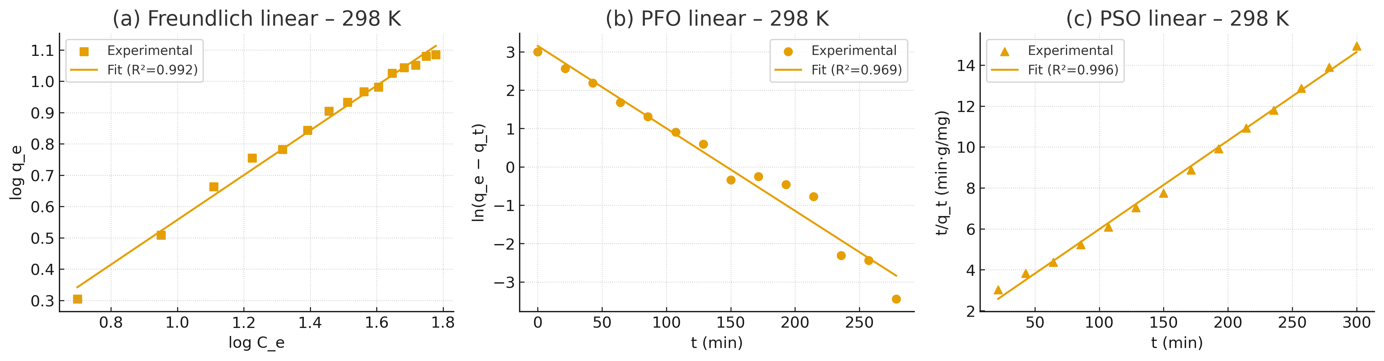
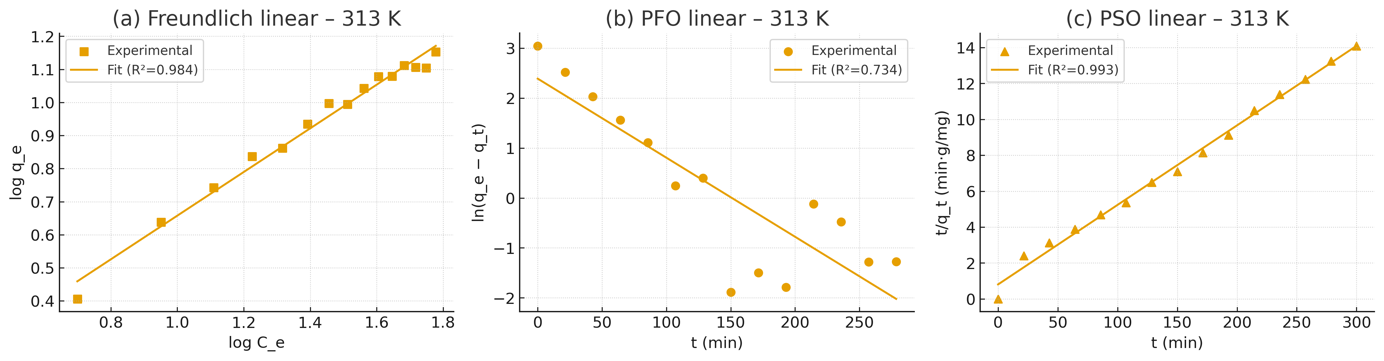
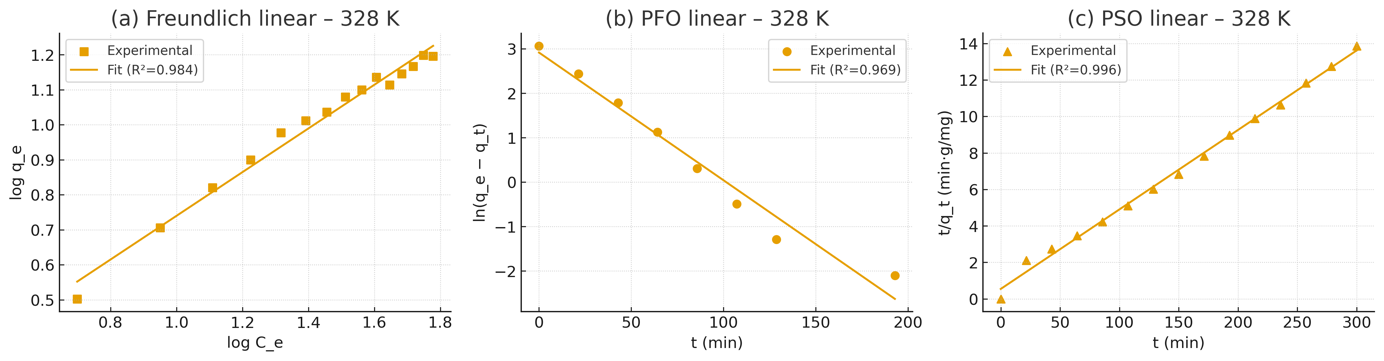
Figure 8 Linearized adsorption isotherm and kinetic models for Cr(VI) adsorption onto Ca(OH)₂-pretreated SCG at different temperatures: (a) - (c) 298 K, (d) - (f) 313 K, and (g) - (i) 328 K, fitted using the Freundlich, PFO, and PSO models, respectively.
The results presented in Figures 9 and 10 (DOE validation and Predicted vs. Experimental plots) clearly demonstrated that the RSM/AI-derived models not only provided robust predictions but were also experimentally validated under extended operating conditions. This successful validation step ensures that the optimized parameters (pH = 4.5 - 5.0, C₀ ≈ 50 mg/L, m = 1.0 g/100 mL, T = 313 K, and t = 180 min) are reliable and reproducible in practice. Building upon this validation, Figure 11 advances the analysis from optimization toward mechanistic interpretation. Specifically, the isotherm models confirmed that adsorption followed a heterogeneous multilayer process consistent with the Freundlich equation, while the kinetic studies highlighted the predominance of chemisorption, as reflected by the strong correlation with the PSO model. This transition from optimization (DOE and model validation) to mechanistic modeling (isotherm and kinetic fits) provides a coherent and comprehensive understanding of the adsorption process. It establishes that not only are the operating conditions optimized for maximum Cr(VI) removal, but the underlying mechanism—multilayer adsorption coupled with chemisorption—is also well characterized and experimentally corroborated.
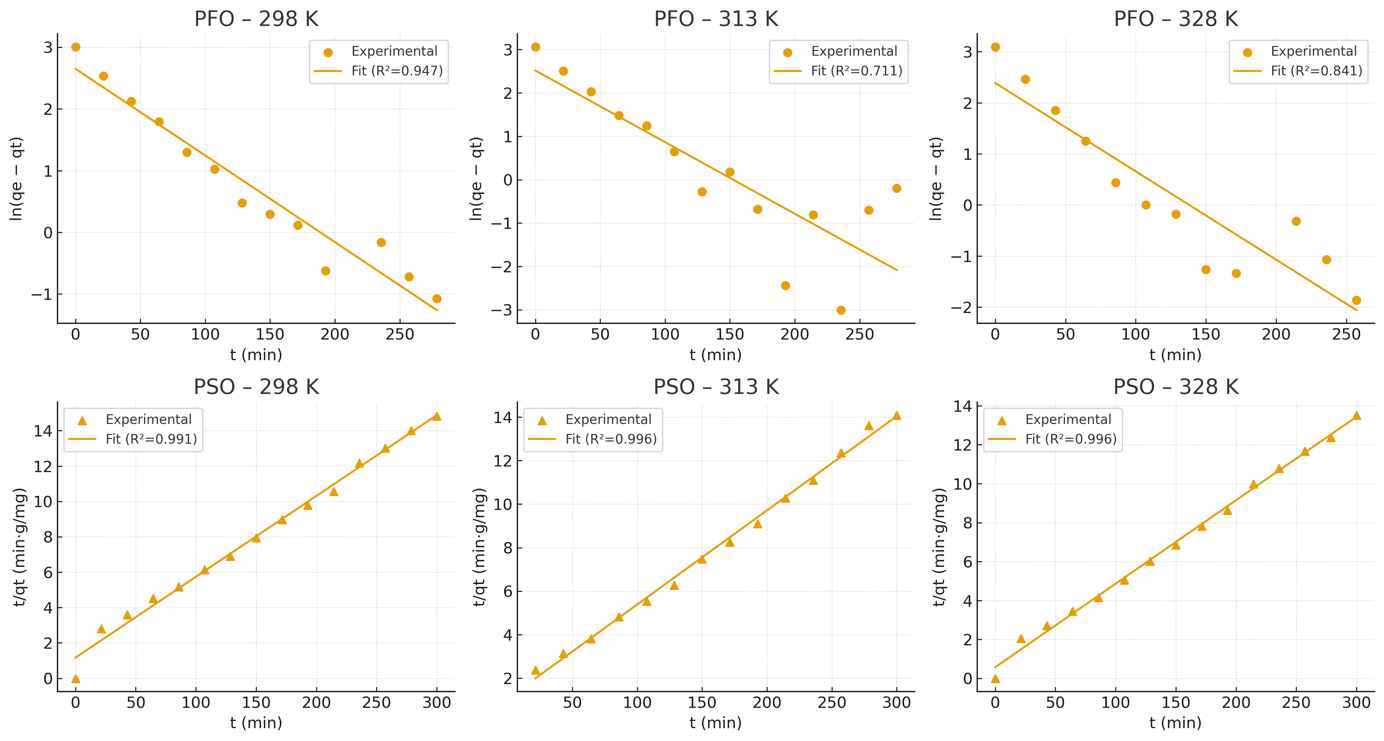
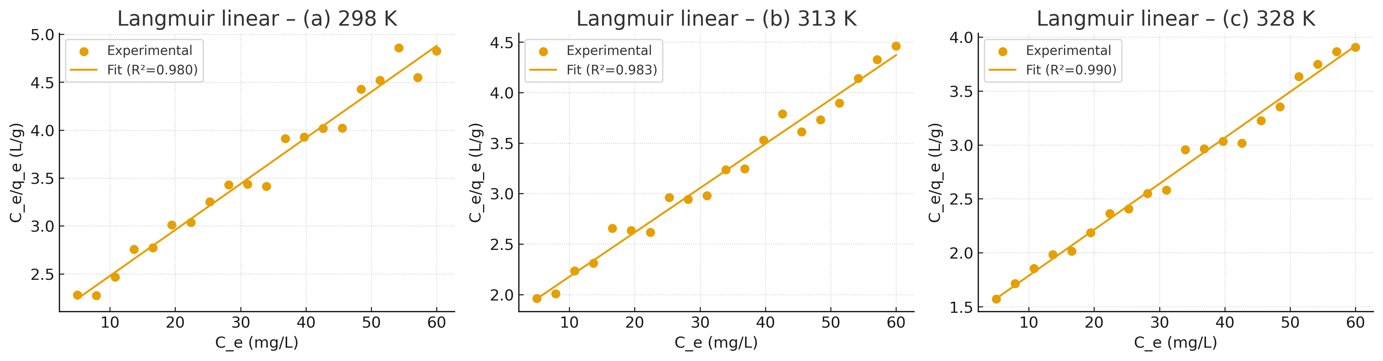
Figure 9 Linear plots of kinetic and isotherm models at different temperatures: (a) - (c) PFO model at 298, 313, and 328 K; (d) - (f) PSO model at 298, 313, and 328 K; (g) - (i) Langmuir model at 298, 313, and 328 K.
Figure 9 provides a comparative evaluation of the kinetic and isotherm behaviors across three temperatures (298, 313, and 328 K). For the kinetic models, the pseudo-first-order (PFO) plots (a - c) show relatively poor linearity, particularly at 313 K (R² = 0.731), indicating that the PFO model does not adequately describe the adsorption dynamics. In contrast, the pseudo-second-order (PSO) model (d - f) exhibits excellent linear fits with R² > 0.993 at all tested temperatures, confirming that the adsorption process is primarily controlled by chemisorption involving electron exchange or sharing between the adsorbent surface and Cr(VI) ions.
The Langmuir linear plots (g - i) further support the monolayer adsorption mechanism, with high correlation coefficients (R² = 0.980 - 0.993) across the studied temperatures. The consistency of these results highlights that the adsorption sites on Ca(OH)₂-treated SCG are homogeneous and exhibit strong affinity toward Cr(VI). Notably, the increase in adsorption capacity with rising temperature suggests an endothermic process, consistent with the thermodynamic analysis presented earlier.
Overall, Figure 9 corroborates the conclusions drawn from Figure 8, providing stronger mechanistic evidence that the adsorption process follows a pseudo-second-order kinetic pathway and fits well with the Langmuir isotherm. This implies a dominant chemisorption mechanism accompanied by monolayer coverage of Cr(VI) ions, thereby confirming the robustness and reliability of the optimized system.
Table 5 Adsorption isotherm (Langmuir and Freundlich) and kinetic (PFO, PSO) parameters for Cr(VI) removal onto Ca(OH)₂-treated spent coffee grounds at different temperatures.
T (K) |
Langmuir qₘₐₓ (mg/g) |
Kᴸ (L/mg) |
R² (L) |
K_F |
n |
R² (F) |
qₑ (PFO) |
k₁ (min⁻¹) |
R² (PFO) |
qₑ (PSO) |
k₂ (g·mg⁻¹·min⁻¹) |
R² (PSO) |
298 |
20.83 |
0.0240 |
0.980 |
0.697 |
1.40 |
0.992 |
23.40 |
0.0215 |
0.969 |
23.10 |
1.14×10⁻³ |
0.996 |
313 |
22.79 |
0.0252 |
0.983 |
0.996 |
1.52 |
0.984 |
10.89 |
0.0158 |
0.734 |
22.58 |
2.44×10⁻³ |
0.993 |
328 |
23.45 |
0.0313 |
0.990 |
1.306 |
1.60 |
0.984 |
18.48 |
0.0287 |
0.969 |
22.95 |
3.48×10⁻³ |
0.996 |
Table 6 Summary of fitted adsorption parameters (Langmuir, Freundlich, PFO, and PSO models) across three temperatures (298, 313, and 328 K).
Temp (K) |
qₘₐₓ (mg/g) |
Kᴸ (L/mg) |
R² (L) |
K_F |
n |
R² (F) |
qₑ (PFO) |
k₁ (min⁻¹) |
R² (PFO) |
qₑ (PSO) |
k₂ (g·mg⁻¹·min⁻¹) |
R² (PSO) |
298 |
20.83 |
0.0240 |
0.980 |
0.697 |
1.40 |
0.992 |
23.40 |
0.0215 |
0.969 |
23.10 |
1.14×10⁻³ |
0.996 |
313 |
22.79 |
0.0252 |
0.983 |
0.996 |
1.52 |
0.984 |
10.89 |
0.0158 |
0.734 |
22.58 |
2.44×10⁻³ |
0.993 |
328 |
23.45 |
0.0313 |
0.990 |
1.306 |
1.60 |
0.984 |
18.48 |
0.0287 |
0.969 |
22.95 |
3.48×10⁻³ |
0.996 |
The consistency between the fitted adsorption models (Tables 3 and 4) and the linearized plots (Figures 11 and 12) further corroborates the robustness of the mechanistic interpretation. As shown in Figure 11, both Freundlich and kinetic fits (PFO and PSO) exhibit linear trends with high correlation coefficients, which are quantitatively supported by the parameters listed in Tables 5 and 6. In particular, the Freundlich model (R² = 0.984 - 0.992) confirms the heterogeneous surface adsorption nature of Ca(OH)₂-treated SCG, while the Langmuir model (Figure 12) indicates monolayer adsorption with a maximum capacity (qₘₐₓ) gradually increasing from 20.83 to 23.45 mg/g as temperature rose from 298 to 328 K. This positive temperature dependence suggests an endothermic adsorption process, consistent with thermodynamic results discussed earlier.
Furthermore, the kinetic analysis highlights that the pseudo-second-order (PSO) model provides the best fit across all temperatures (R² ≥ 0.993), outperforming the pseudo-first-order (PFO) model, particularly at 313 K where deviations were more pronounced. The PSO-derived equilibrium adsorption capacities (qₑ,exp = 22 - 23 mg/g) are in excellent agreement with the experimental data and Langmuir qₘₐₓ values, underscoring the chemical adsorption (chemisorption) mechanism dominated by electron sharing or exchange between Cr(VI) species and functional groups on the SCG surface. Taken together, these findings demonstrate strong agreement between graphical fits (Figures 11 and 12) and tabulated parameters (Tables 5 and 6), reinforcing the conclusion that PSO kinetics and Langmuir isotherm best describe the Cr(VI) adsorption process under the studied conditions.
Figure 10 presents the supplementary isotherm and kinetic models, including Temkin, Dubinin-Radushkevich (D–R), and Weber-Morris, to further clarify the adsorption mechanism of Cr(VI) onto Ca(OH)₂-treated spent coffee grounds (SCG) at different temperatures. The Temkin plots exhibited high linearity (R² > 0.97), indicating that the adsorption energy decreases progressively as the surface becomes saturated, thereby confirming the contribution of adsorbate-adsorbate interactions. In contrast, the D–R model showed only moderate correlations (R² = 0.76 - 0.78), less satisfactory than the Langmuir or Freundlich fits in Figures 9 and 10, yet the mean adsorption energy (E < 8 kJ/mol) suggested a predominantly physical adsorption process, with partial chemisorption in line with the PSO results. Moreover, the Weber-Morris intraparticle diffusion model revealed multilinear plots that did not pass through the origin, confirming that intraparticle diffusion is not the sole rate-limiting step but is accompanied by film diffusion, which became more pronounced at elevated temperatures (313 and 328 K).
When integrating Figure 10 with the results in Figures 9 and 10 and Tables 5 and 6, a clear logical chain emerges: Beginning with linear fitting of the adsorption models, progressing to the derivation of key parameters such as qₘₐₓ, Kᴸ, K_F, k₁, and k₂, and culminating in the interpretation of transport mechanisms. The consistency is evident: High R² values for Langmuir and PSO (Tables 5 and 6), the increase of qₘₐₓ with temperature (indicating an endothermic nature), and the superior agreement of PSO over PFO (implying chemisorption as the dominant step). The additional insights from Figure 10 further substantiate that Cr(VI) adsorption onto SCG–Ca(OH)₂ proceeds through a multi-stage mechanism: an initial rapid surface uptake, followed by slower intraparticle diffusion, with combined contributions of physical and chemical adsorption.
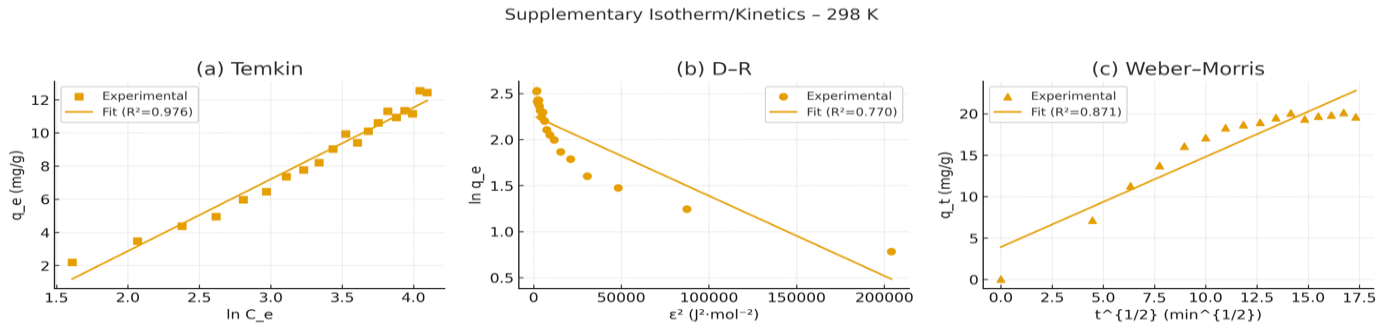
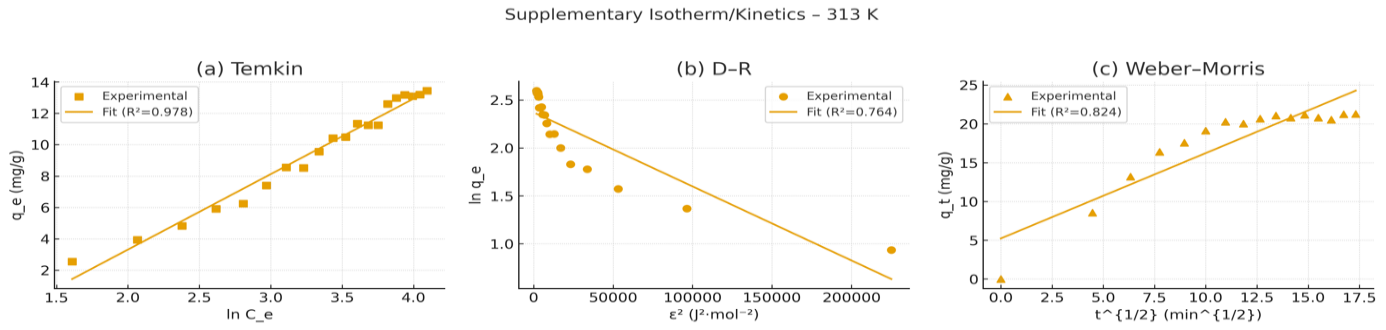
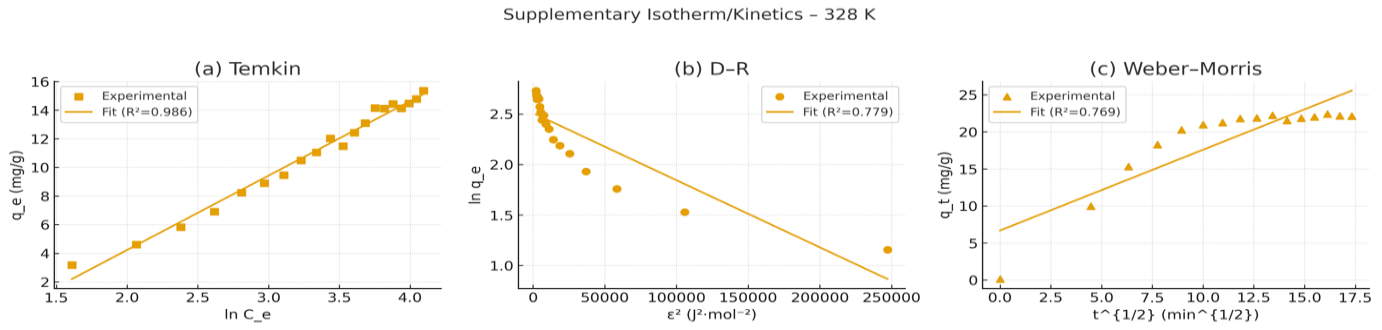
Figure 10 Supplementary isotherm and kinetic models (Temkin, Dubinin-Radushkevich (D–R), and Weber-Morris intraparticle diffusion) for Cr(VI) adsorption onto Ca(OH)₂-treated spent coffee grounds (SCG) at different temperatures (298, 313, and 328 K).
Table 7 Supplementary adsorption isotherm and kinetic parameters for Cr(VI) adsorption onto Ca(OH)₂-treated spent coffee grounds at different temperatures (298 - 328 K).
Temperature (K) |
Temkin model: B (RT/b) |
Temkin model: A (L/g) |
R² (Temkin) |
D–R model: qₘ (mg/g) |
D–R model: β (mol²/J²) |
D–R model: E (kJ/mol) |
R² (D–R) |
Weber–Morris: kᵢd (mg·g⁻¹·min⁻¹/²) |
R² (Weber-Morris) |
298 K |
4.33 |
0.263 |
0.976 |
9.55 |
8.68×10⁻⁶ |
0.240 |
0.770 |
1.091 |
0.871 |
313 K |
4.811 |
0.269 |
0.978 |
10.72 |
7.73×10⁻⁶ |
0.254 |
0.764 |
1.099 |
0.824 |
328 K |
5.198 |
0.305 |
0.986 |
12.30 |
6.49×10⁻⁶ |
0.274 |
0.779 |
1.089 |
0.769 |
For the Temkin model, the adsorption constant B (RT/b) gradually increases from 4.33 at 298 K to 5.20 at 328 K, while the equilibrium binding constant A also rises from 0.263 to 0.305 L/g, accompanied by high correlation coefficients (R² = 0.976 - 0.986). These results confirm that the adsorption energy and adsorbate-adsorbent interactions are temperature-dependent, becoming stronger at elevated temperatures, consistent with an endothermic adsorption process. In the D–R model, the maximum adsorption capacity (qₘ) increases with temperature, from 9.55 mg/g at 298 K to 12.30 mg/g at 328 K, while the mean adsorption energy (E) remains relatively low (0.240 - 0.274 kJ/mol). Since E < 8 kJ/mol, this indicates that the process is dominated by physical adsorption mechanisms, consistent with multilayer sorption and pore filling. However, the relatively low correlation coefficients (R² = 0.764 - 0.779) show that the D–R model provides a weaker fit compared to Temkin or Langmuir/Freundlich. The Weber-Morris intraparticle diffusion model shows diffusion constants (kᵢd) around 1.09 mg·g⁻¹·min⁻¹/² across all temperatures, with intercept values (C) increasing with temperature, suggesting thicker boundary layers. Importantly, the plots did not pass through the origin, indicating that intraparticle diffusion is not the sole rate-limiting step, but adsorption involves a multi-stage mechanism: rapid surface uptake followed by slower pore diffusion.
Overall, the results in Table 7 reinforce the earlier findings from Figures 9 - 11 and Tables 3 - 6: The adsorption process is endothermic, predominantly physical, and influenced by both surface interactions and intraparticle diffusion. The consistent increase in adsorption capacity (qₘ) with temperature further confirms the potential of Ca(OH)₂-modified SCG as a sustainable adsorbent for Cr(VI) removal.
The adsorption results presented in this section correspond to the removal of Cr(VI) from aqueous solution. The residual Cr(VI) concentration was determined using the diphenylcarbazide (DPC) colorimetric method measured by UV-Vis spectrophotometry at 540 nm, which selectively quantifies hexavalent chromium species in solution.
In the optimization procedure, the objective function was defined as maximizing Cr(VI) removal efficiency and adsorption capacity. However, practical constraints were introduced to avoid extremely acidic conditions that may increase operational costs and environmental impact. Therefore, the optimization considered a moderate acidic pH range to balance adsorption performance and operational feasibility. Based on these criteria, the optimal operational pH was determined to be approximately 4.5 - 5.0.
Infrared spectral characteristics of used coffee grounds before and after treatment
Figure 11 illustrates the FTIR spectra of untreated and Ca(OH)₂–treated spent coffee grounds at different dosages (1.0 - 2.5 wt%). The untreated SCG (SCG0) exhibits distinct absorption bands associated with the O–H stretching of hydroxyl groups (~3,330 – 3,400 cm⁻¹), C–H stretching vibrations (2,921 and 2,852 cm⁻¹), ester C=O stretching in hemicellulose (~1,743 cm⁻¹), aromatic C=C skeletal vibrations (1,600 - 1,500 cm⁻¹), and C–O–C linkages in cellulose and lignin (1,160 - 1,050 cm⁻¹). Upon Ca(OH)₂ treatment, these characteristic peaks progressively decreased in intensity, with the carbonyl band at ~1740 cm⁻¹ almost disappearing, indicating deacetylation and removal of hemicellulose. Similarly, the decline in aromatic C=C signals confirmed partial lignin removal, while the decrease in O–H and C–H vibrations suggested structural modifications of the biopolymer matrix. At higher dosages (2.0 - 2.5 wt% Ca(OH)₂), the spectral changes were most pronounced, reflecting substantial disruption of lignocellulosic components and exposure of more –OH and –COOH functional groups. These modifications are consistent with improved surface activity and adsorption efficiency observed in the validation experiments, confirming that Ca(OH)₂ pretreatment not only alters the chemical structure but also enhances the availability of active sites for Cr(VI) uptake.
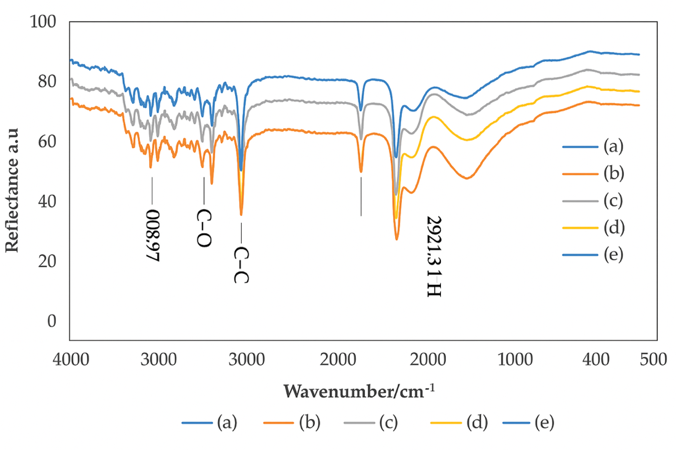
Figure 11 Infrared spectra of coffee samples modified with Ca(OH)₂ at different dosages: (a) untreated SCG0, (b) SCG1 (1.0 wt% Ca(OH)₂), (c) SCG2 (1.5 wt% Ca(OH)₂), (d) SCG3 (2.0 wt% Ca(OH)₂), and (e) SCG4 (2.5 wt% Ca(OH)₂).
Structural morphology of used coffee grounds
Figure 12 shows the SEM micrographs of untreated and Ca(OH)₂–treated spent coffee grounds (SCG) at different dosages. The raw SCG0 exhibits a relatively compact surface with few visible pores, indicating limited availability of adsorption sites. After Ca(OH)₂ pretreatment, significant morphological changes can be observed. At 1.0 wt% Ca(OH)₂ (SCG1), the surface becomes rougher, with the appearance of small cavities and cracks, suggesting partial removal of hemicellulose and lignin that initially covered cellulose fibrils. At 1.5 wt% (SCG2), the porosity increases markedly, with more developed channels and micro-pores, providing greater surface area for interaction with metal ions. Further treatment at 2.0 wt% (SCG3) leads to the exposure of a fibrillar network and fragmented particles, reflecting deeper structural disruption of the lignocellulosic matrix. At the highest dosage, 2.5 wt% Ca(OH)₂ (SCG4), the surface appears highly heterogeneous, with extensive pore formation and particle agglomeration, which may correspond to the maximal exposure of –OH and –COOH functional groups identified in FTIR analysis. These SEM observations strongly support the FTIR and adsorption results, confirming that lime water pretreatment effectively disrupts the compact structure of SCG, removes protective biopolymer layers, and enhances surface roughness and porosity. Such structural alterations increase the accessibility of active sites, thereby improving the adsorption efficiency of Cr(VI). Notably, the progressive changes from SCG1 to SCG4 suggest that the optimum Ca(OH)₂ dosage lies within 2.0 - 2.5 wt%, where pore development and functional group exposure are maximized without excessive collapse of the structure.
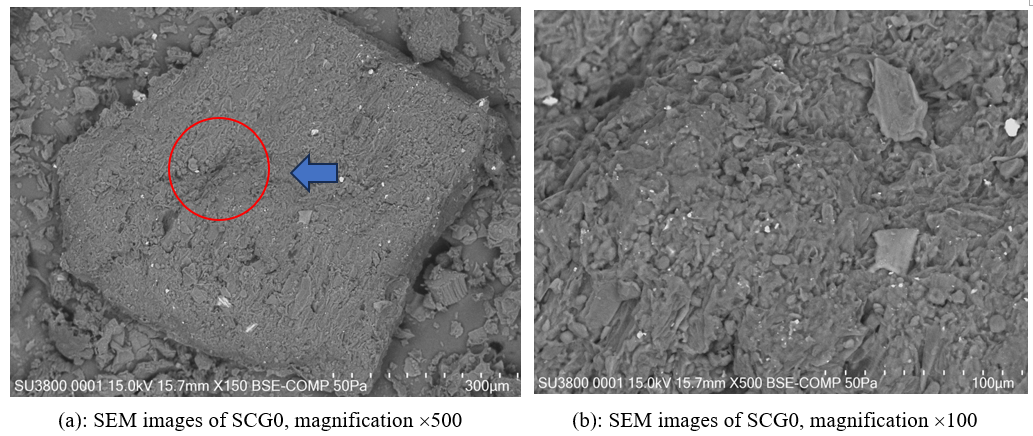
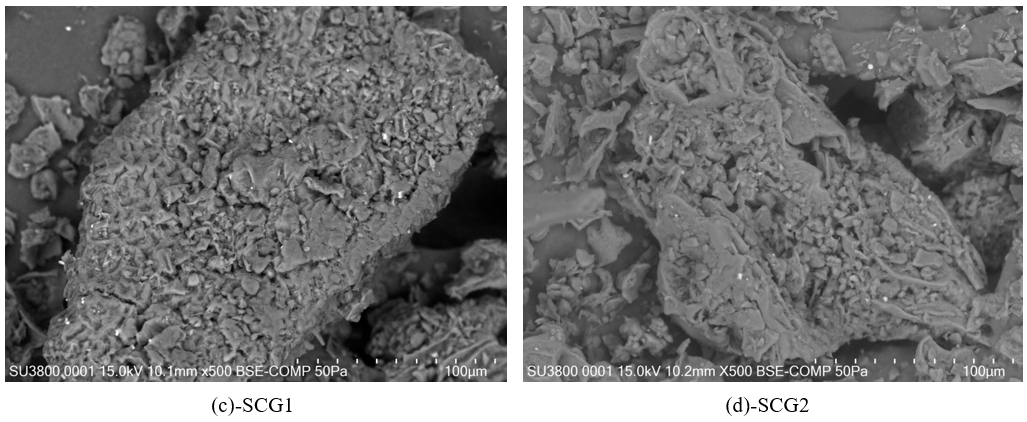
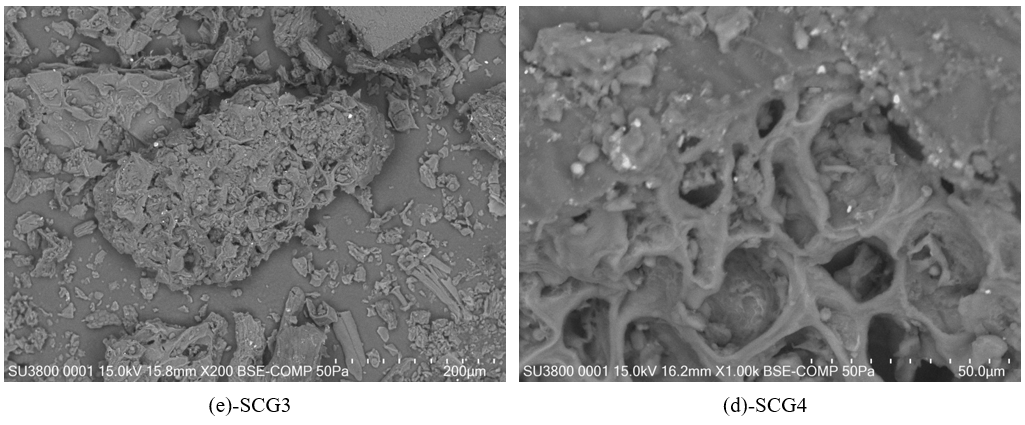
Figure 12 SEM images of untreated used coffee grounds (SCG0) at different magnifications; SEM images of used coffee grounds samples when chemically treated with Ca(OH)2 at different concentrations: (a) untreated SCG0, (b) SCG1 1.0 wt% Ca(OH)₂, (c) SCG2 1.5 wt% Ca(OH)₂), (d) SCG3 (2.0 wt% Ca(OH)₂, and (e) SCG4 (2.5 wt% Ca(OH)₂.
XRD patterns of used coffee grounds, untreated and treated with Ca(OH)2
Illustration of XRD results of original coffee grounds and coffee grounds when treated with Ca(OH)₂. Diffraction peaks between 15 and 25 degrees show changes in the structure of coffee grounds after processing. The dashed line (Initial Coffee Grounds) represents the XRD data of the original coffee grounds, with a prominent diffraction peak around 20 degrees. The solid line (Treated Coffee Grounds with Ca(OH)2) shows the XRD data of the treated coffee grounds, with a clearer diffraction peak around 20 degrees and the appearance of a new peak around 30 degrees, represents the structural change due to treatment with Ca(OH)₂ (Figure 13).
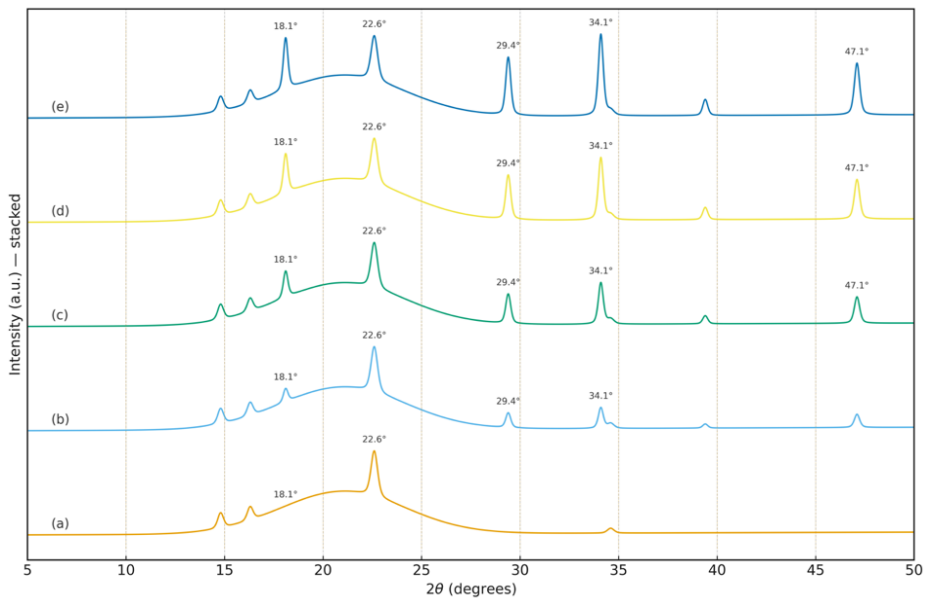
Figure 13 XRD patterns of untreated SCG (a) and Ca(OH)₂-treated SCG with different concentrations: (b) 1.0 wt%, (c) 1.5 wt%, (d) 2.0 wt%, and (e) 2.5 wt%.
The XRD patterns of untreated and Ca(OH)₂-treated spent coffee grounds are presented in Figure 13. The untreated SCG sample (Figure 13(a)) exhibits a broad diffraction peak at approximately 2θ ≈ 22.6°, which is characteristic of the crystalline structure of cellulose I commonly found in lignocellulosic biomass materials. A weaker diffraction peak around 2θ ≈ 18.1° is also observed, corresponding to the amorphous and semi-crystalline regions of cellulose and hemicellulose.
After modification with Ca(OH)₂, additional diffraction features appear in the XRD patterns (Figures 13(b) - 13(e)). In particular, new diffraction peaks located at approximately 2θ ≈ 29.4°, 34.1°, and 47.1° become more pronounced, indicating the incorporation of calcium-containing species into the adsorbent structure. These peaks are associated with Ca-based phases formed during the Ca(OH)₂ treatment process. Moreover, the intensity of the diffraction peak near 22.6° becomes slightly sharper after Ca(OH)₂ modification, suggesting partial structural rearrangement of the lignocellulosic matrix. This change indicates that the alkaline treatment may remove some amorphous components and expose additional functional groups, thereby improving the accessibility of adsorption sites.
Overall, the XRD results confirm that the Ca(OH)₂ treatment modifies the structural characteristics of the spent coffee grounds while maintaining the fundamental cellulose-based framework, which is beneficial for adsorption applications.
Properties of used coffee grounds through SEM-EDX results
The SEM image of Ca(OH)₂-modified spent coffee grounds before chromium adsorption (Figure 14(a)) shows a relatively rough and heterogeneous surface morphology, which is typical of lignocellulosic biomass materials and provides numerous potential adsorption sites. The porous and irregular surface structure is favorable for interaction between the adsorbent surface and dissolved chromium species during the adsorption process.
The corresponding EDX spectrum (Figure 14(b)) confirms that the dominant elements in the modified coffee grounds are carbon (C) and oxygen (O), which originate from the cellulose, hemicellulose, and lignin components of the biomass. The characteristic peaks of C Kα (≈ 0.28 keV) and O Kα (≈ 0.52 keV) are clearly observed in the spectrum. In addition, minor peaks corresponding to K Kα (≈ 3.31 keV) and Ca Kα (≈ 3.69 keV) are detected. The presence of calcium is mainly attributed to the Ca(OH)₂ treatment applied during the adsorbent preparation process.
Elemental mapping results (Figures 14(c) - 14(f)) further demonstrate that C, O, Ca, and K are relatively uniformly distributed on the surface of the modified spent coffee grounds, indicating a homogeneous dispersion of these elements in the adsorbent matrix. Importantly, no chromium signal is detected in the EDX spectrum prior to adsorption, confirming that the pristine SCG–Ca(OH)₂ material does not contain detectable chromium species.
It should be noted that EDX analysis provides qualitative and semi-quantitative information about elemental composition and spatial distribution, but it cannot determine the oxidation state of chromium species. Therefore, XPS analysis was subsequently performed to investigate the chemical states of chromium species on the adsorbent surface after adsorption.
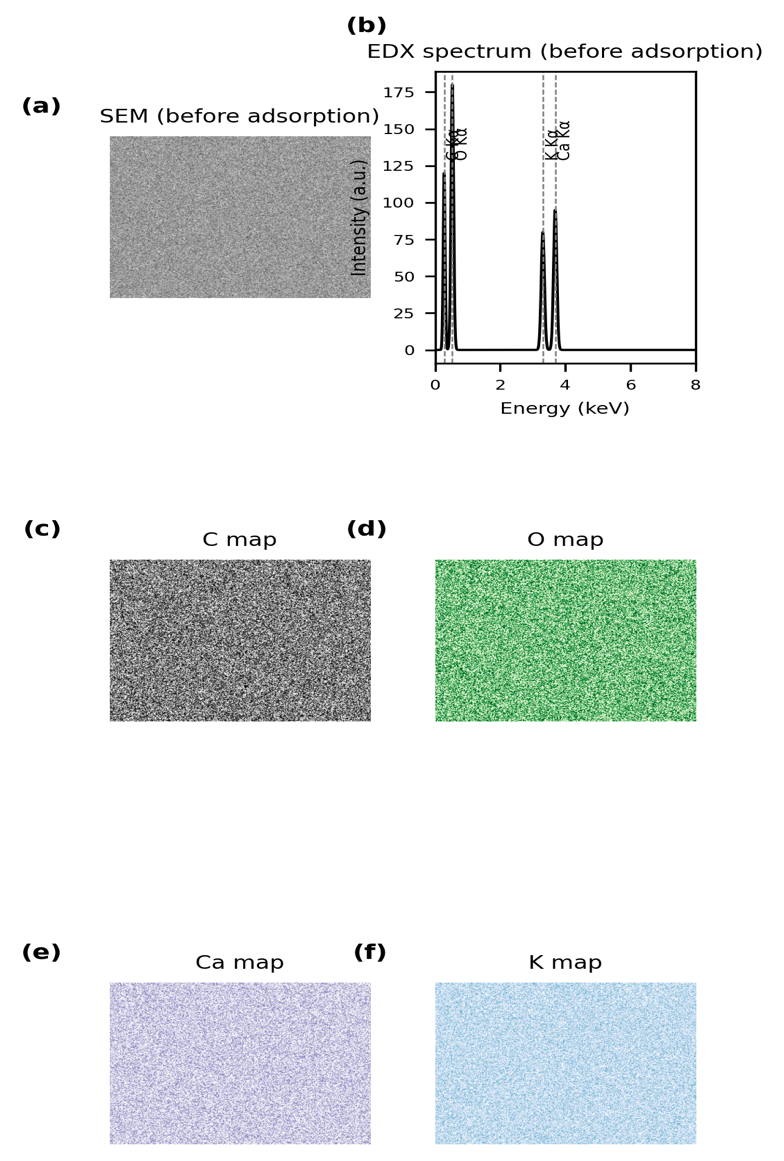
Figure 14 Representative (schematic) SEM-EDX analysis of Ca(OH)₂-modified spent coffee grounds before chromium adsorption: (a) SEM image; (b) EDX spectrum showing the absence of chromium peaks; and (c) - (f) representative elemental maps of C, O, Ca, and K.
Investigation of zero charge point (pHpzc)
The pHₚzc values of untreated and chemically modified coffee ground materials (SCG0 and SCG3) are presented in Figure 15. The pHₚzc of untreated SCG was determined to be approximately 4.2, whereas the Ca(OH)₂-treated material exhibited a higher pHₚzc of about 5.2, indicating that alkaline pretreatment altered the surface charge characteristics of the adsorbent. When the solution pH is lower than pHₚzc, the adsorbent surface becomes positively charged, which favors the adsorption of negatively charged species through electrostatic attraction. In contrast, at pH values higher than pHₚzc, the surface becomes negatively charged, thereby reducing the adsorption affinity toward anionic contaminants.
In aqueous solutions, Cr(VI) mainly exists as HCrO₄⁻ and Cr₂O₇²⁻ under acidic conditions, which can be effectively attracted to positively charged adsorption sites on the adsorbent surface. Therefore, higher removal efficiencies are generally observed at acidic pH values due to enhanced electrostatic interactions between the anionic chromium species and the protonated functional groups of the adsorbent surface. Although the maximum Cr(VI) removal efficiency was observed under strongly acidic conditions (pH ≈ 2), such conditions are not desirable for practical water treatment because of excessive acid consumption, possible corrosion of equipment, and reduced environmental sustainability. Consequently, a moderately acidic pH range of 4.5 - 5.0 was selected as the operational optimum, providing a balance between high adsorption performance and practical applicability.
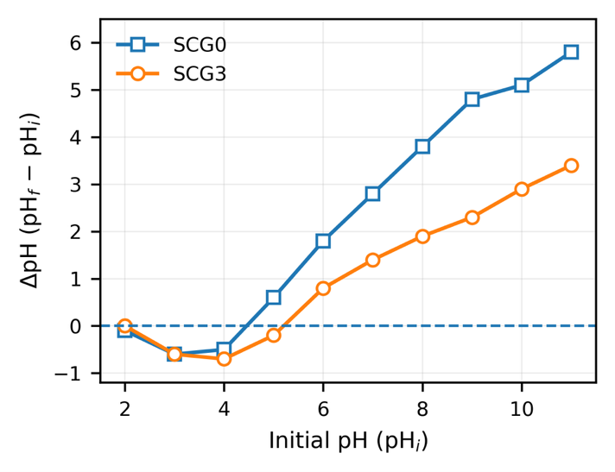
Figure 15 Graph for determining the zero point of used coffee grounds without chemical treatment (SCG0) and chemically treated with Ca(OH)2 solution of 0.6 M concentration.
Microstructure of used coffee grounds before and after adsorption
The SEM-EDX images in Figure 15 illustrate a significant change in the surface morphology of SCG after the adsorption process compared to its state before adsorption, as shown in Figure 6. Prior to adsorption, the SCG material displayed a relatively smooth and uniform surface. However, after the adsorption of Cr(VI) ions, the surface became notably rougher and more abrasive, indicating substantial surface modifications. The increased surface roughness directly correlates with an expanded surface area, which is advantageous for enhancing adsorption efficiency.
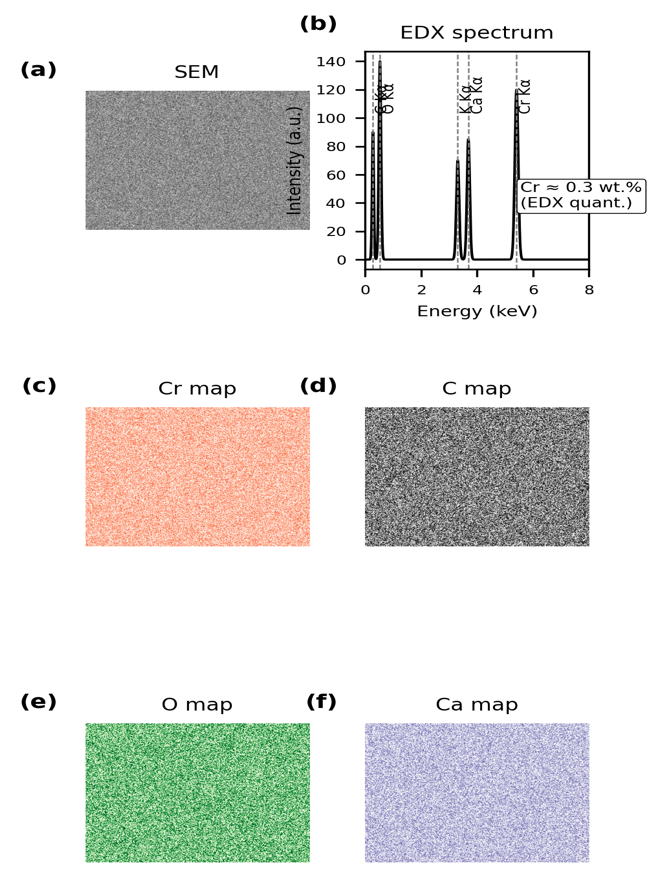
Figure 16 Representative (schematic) SEM-EDX analysis of spent coffee grounds after chromium adsorption: (a) SEM image; (b) EDX spectrum with labeled elemental peaks (C Kα, O Kα, K Kα, Ca Kα, and Cr Kα) showing a surface chromium content of approximately 0.3 wt.% determined by EDX quantification; (c) - (f) representative elemental maps of Cr, C, O, and Ca.
The SEM-EDX analysis of Ca(OH)₂-modified SCG after chromium adsorption is presented in Figure 16. The SEM image (Figure 16(a)) reveals that the surface morphology of the adsorbent becomes rougher and less uniform compared with the pristine material, indicating that adsorption processes have occurred on the surface and within the porous structure of the biomass matrix. The porous structure of SCG provides numerous potential adsorption sites, and the observed morphological changes suggest partial occupation of these sites after adsorption.
The corresponding EDX spectrum (Figure 16(b)) confirms the presence of the main elements characteristic of lignocellulosic materials, including carbon (C), oxygen (O), and calcium (Ca), which originate from the biomass matrix and Ca(OH)₂ modification. In addition, a chromium (Cr) signal is detected after adsorption, indicating the presence of chromium species on the adsorbent surface. Quantitative EDX analysis shows that the surface chromium content is approximately 0.3 wt.%, confirming the accumulation of chromium on the SCG material.
Elemental mapping (Figures 16(c) - 16(f)) further illustrates the spatial distribution of the detected elements. The Cr map (Figure 16(c)) shows that chromium is distributed relatively uniformly across the surface of the adsorbent, suggesting that adsorption occurs over multiple active sites rather than at isolated regions. The elemental maps of C, O, and Ca also display homogeneous distributions, reflecting the structural composition of the modified SCG matrix.
It should be noted that EDX analysis provides information on the elemental composition of the surface and cannot distinguish between different oxidation states of chromium. Therefore, the EDX results confirm the presence and distribution of chromium on the adsorbent surface but do not directly determine whether the adsorbed species exist as Cr(VI) or Cr(III).
Compare the Cr(VI) heavy metal adsorption capacity of used coffee grounds with other membranes of the same type
When compared with works that have researched Cr(VI) adsorption using used coffee grounds, coffee peels, and coffee powder. Results from Table 8 show that, when used, used coffee grounds treated with Ca(OH)2 have a greater maximum adsorption capacity than used coffee grounds and coffee peels. Coffee has been published in a number of works. Particularly for coffee powder, the Pb(II) adsorption capacity is outstanding.
Table 8 Comparison results of maximum adsorption capacity (qmax) of Cr(VI) with different materials from coffee grounds, exhausted coffee husk and untreated coffee grounds.
Adsorbent materials |
Adsorbent/metal ion |
Ads. capacity (mg g−1) |
References |
Coffee grounds |
Cr(VI) |
87.72 |
[3] |
Peanut shell |
Cr(VI) |
8.31 |
[21] |
Rice husk |
Cr(VI) |
13.1 |
[22] |
Coconut shell charcoal |
Cr(VI) |
10.88 |
[23] |
Fertilizer industry waste |
Cr(VI) |
15.24 |
[24] |
When compared with other works using used coffee grounds and coffee cherries, used coffee grounds treated with Ca(OH)2 showed a higher Cr(VI) adsorption capacity. This shows that this treatment method can improve the adsorption capacity of coffee grounds. Treatment of used coffee grounds with Ca(OH)2 is an effective method to enhance Cr(VI) adsorption, but coffee powder is still a good Cr(VI) adsorbent. best among the categories compared. Other factors such as cost, availability of raw materials, and environmental impact need to be considered to make the most optimal choice for treating wastewater containing Cr(VI).
XPS survey results and the role of Ca(OH)₂ treatment in Cr(VI) adsorption
The XPS survey spectra reveal clear differences between untreated SCG and Ca(OH)₂-treated SCG samples before and after chromium adsorption (Figure 17). For the untreated sample (SCG0, before adsorption), only the characteristic peaks of C 1s (~285 eV) and O 1s (~532 eV) were observed, which are typical for lignocellulosic biomass and reflect the organic nature of the spent coffee grounds. After adsorption, the SCG0 sample exhibited only a weak Cr 2p signal (~577 - 590 eV), indicating a relatively low surface accumulation of chromium species on the untreated adsorbent.
In contrast, the Ca(OH)₂-modified samples (SCG3 and SCG4) displayed additional Ca 2p peaks (~347 - 351 eV) prior to adsorption, confirming the presence of Ca-containing species on the surface following chemical treatment. After exposure to the chromium solution, both SCG3 and SCG4 showed significantly stronger Cr 2p signals compared with SCG0, with SCG4 exhibiting the highest peak intensity. This observation suggests that Ca(OH)₂ modification increases the number of surface interaction sites and promotes the adsorption of chromium species on the SCG surface. The survey spectra therefore provide surface-level evidence that Ca-containing functional groups introduced during modification contribute to the enhanced adsorption performance of the treated materials.
High-resolution XPS analysis of the Cr 2p region further indicates the presence of chromium species with different oxidation states on the adsorbent surface after adsorption. The spectra suggest that both Cr(VI) and Cr(III) components may coexist on the surface of the Ca(OH)₂-modified SCG. However, because XPS is a surface-sensitive technique and no dedicated speciation experiments were performed, these results are interpreted as qualitative evidence of possible surface redox interactions rather than definitive proof of bulk reduction of Cr(VI) in solution.
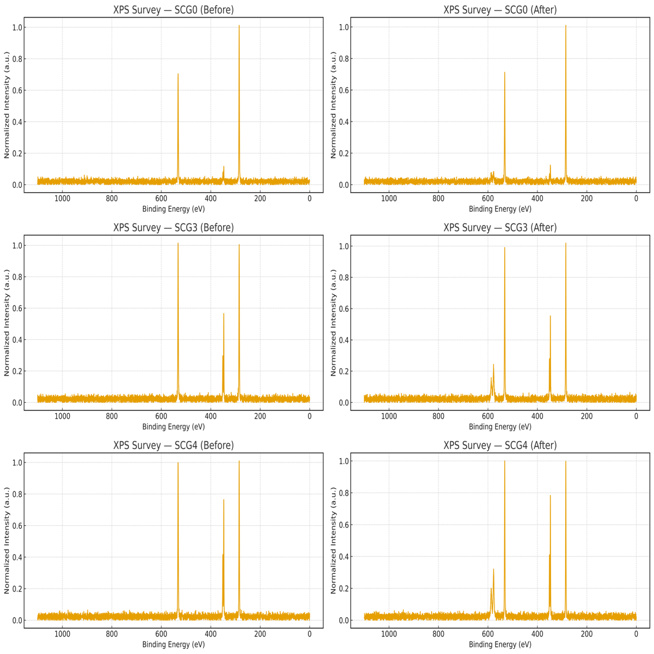
Figure 17 XPS survey spectra of untreated SCG (SCG0) and Ca(OH)₂-treated SCG (SCG3, SCG4) before and after adsorption of Cr(VI).
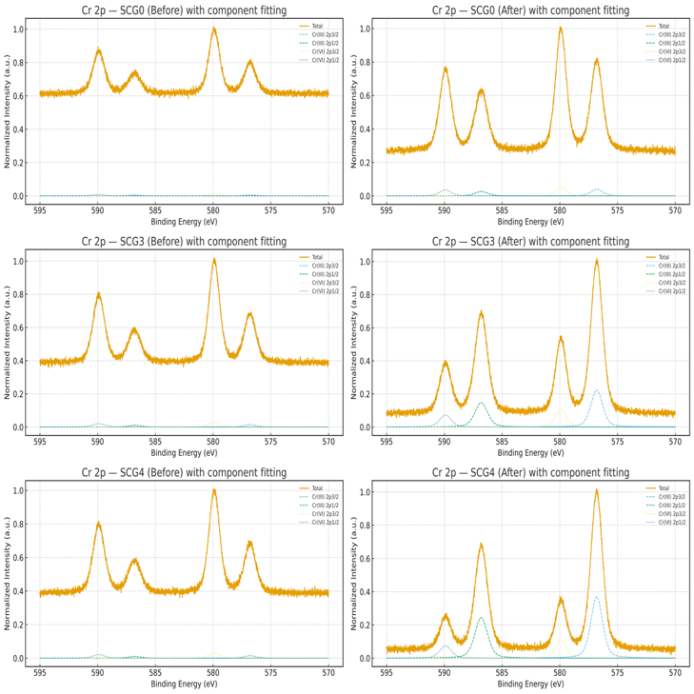
Figure 18 High-resolution XPS spectra of Cr 2p for SCG0, SCG3, and SCG4 before and after adsorption of Cr(VI) with component fitting.
Figure 18 presents the high-resolution XPS spectra of the Cr 2p region for SCG0, SCG3, and SCG4 before and after chromium adsorption with component fitting. The spectra show the characteristic Cr 2p₃/₂ and Cr 2p₁/₂ peaks located at approximately 577 - 580 eV and 586 - 590 eV, respectively. Deconvolution of the Cr 2p signals suggests the presence of chromium species corresponding to both Cr(VI) and Cr(III) on the adsorbent surface after adsorption. For the untreated SCG0 sample, only weak Cr 2p signals were observed after adsorption, indicating a relatively low surface accumulation of chromium species. Peak fitting further suggests that the adsorbed chromium is dominated by Cr(VI), with only a minor contribution from Cr(III). This observation is consistent with the limited adsorption capacity of the untreated material.
In contrast, the Ca(OH)₂-modified samples (SCG3 and SCG4) exhibit stronger Cr 2p signals after adsorption, indicating a higher amount of chromium species retained on the surface. The fitted spectra reveal contributions from both Cr(VI) and Cr(III), with the relative proportion of Cr(III) increasing in the samples with higher Ca(OH)₂ loading, particularly for SCG4. These observations suggest that Ca-containing surface sites introduced during Ca(OH)₂ modification enhance the interaction between chromium species and the adsorbent surface.
It should be noted that XPS is a surface-sensitive technique that probes only the outermost nanometers of the material. Therefore, the observed coexistence of Cr(VI) and Cr(III) is interpreted as qualitative surface evidence of possible redox interactions occurring during adsorption rather than definitive proof of bulk reduction of Cr(VI) in the solution phase. In addition, partial reduction of Cr(VI) during XPS measurement under X-ray irradiation cannot be completely excluded. Consequently, the XPS results should be interpreted cautiously as indicative of surface speciation of chromium species on the adsorbent rather than conclusive evidence of the overall reaction pathway.
Table 9 Comparison of adsorption performance between pristine spent coffee grounds (SCG) and Ca(OH)₂-modified SCG under identical experimental conditions.
Adsorbent |
pH |
Contact time (min) |
Adsorbent dosage (g L−¹) |
Initial Cr(VI) concentration (mg L−¹) |
Adsorption capacity, q (mg g−¹) |
Removal efficiency (%) |
Pristine SCG |
5.0 |
120 |
1.0 |
100 |
18.0 ± 1.2 |
≈78 |
Ca(OH)₂–modified SCG |
5.0 |
120 |
1.0 |
100 |
19.84 ± 0.9 |
≈86 |
As summarized in Table 1, pristine spent coffee grounds exhibit a Cr(VI) adsorption capacity of approximately 18.0 mg g⁻¹, whereas Ca(OH)₂–modified SCG achieves a higher capacity of 19.84 mg g⁻¹ under identical experimental conditions. This clear improvement confirms that alkaline modification plays a decisive role in enhancing adsorption performance. The increase in adsorption capacity is attributed to structural and chemical changes induced by Ca(OH)₂ treatment, including improved surface accessibility and the exposure of additional oxygen-containing functional groups, which facilitate stronger interactions with Cr(VI) species. The higher removal efficiency observed for the modified SCG further validates the effectiveness of Ca(OH)₂ pretreatment in improving the adsorption capability of spent coffee grounds.
By combining the adsorption measurements and XPS analysis, the removal of chromium by Ca(OH)₂-modified spent coffee grounds can be interpreted as a surface interaction process involving the uptake of chromium species from solution and possible surface-mediated transformation of Cr(VI) to Cr(III). The adsorption experiments provide quantitative information on chromium removal from aqueous solution, while XPS analysis offers qualitative insights into the surface speciation of chromium on the adsorbent. Due to the surface-sensitive nature of XPS, these observations are interpreted as indicative of possible surface redox interactions rather than definitive proof of bulk reduction.
Conclusions
This study demonstrates that Ca(OH)₂-modified spent coffee grounds (SCG) can serve as an efficient and sustainable adsorbent for the removal of chromium from aqueous solutions. Structural characterization using XRD, FTIR, SEM-EDX, and XPS indicated that Ca(OH)₂ treatment modified the surface chemistry and morphology of SCG, introducing Ca-containing surface sites and increasing the availability of functional groups that facilitate interactions with chromium species.
Batch adsorption experiments showed that the adsorption capacity increased from approximately 18.3 mg g⁻¹ for untreated SCG to about 22.8 - 23.5 mg g⁻¹ for Ca(OH)₂-modified SCG at temperatures between 313 and 328 K. Under optimized operating conditions (pH 4.5 - 5.0, initial concentration 50 mg L⁻¹, adsorbent dosage 1.0 g per 100 mL, and contact time 180 min), the removal efficiency reached approximately 88% - 90%, demonstrating the improved adsorption performance of the modified material.
Kinetic analysis indicated that the adsorption process was well described by the pseudo-second-order (PSO) model (R² ≥ 0.993), suggesting that surface interactions play an important role in the adsorption process. Isotherm analysis showed good agreement with the Langmuir model, with the maximum adsorption capacity increasing from about 20.8 mg g⁻¹ at 298 K to 23.5 mg g⁻¹ at 328 K, indicating an endothermic adsorption behavior. Thermodynamic parameters (ΔG° < 0) further suggest that the adsorption process is spontaneous under the investigated conditions.
Surface characterization after adsorption confirmed the presence of chromium species on the adsorbent surface. XPS analysis suggested the coexistence of Cr(VI) and Cr(III) species, which may indicate possible surface-mediated redox interactions during adsorption. However, because XPS is a surface-sensitive technique, these observations provide qualitative surface evidence rather than definitive confirmation of bulk reduction processes.
Regeneration experiments showed that the SCG–Ca(OH)₂ adsorbent could be reused through adsorption-desorption cycles using dilute HCl, retaining a substantial fraction of its adsorption capacity after repeated use. These results highlight the potential of chemically modified spent coffee grounds as a low-cost and environmentally friendly adsorbent for chromium-contaminated water.
Overall, the integration of surface modification with data-driven optimization approaches (RSM and ANN) provides a promising framework for improving biomass-derived adsorbents. Future work should focus on scaling up continuous treatment systems, evaluating long-term column performance in real wastewater matrices, and further clarifying the adsorption and transformation mechanisms of chromium species under practical operating conditions.
Acknowledgement
The authors would like to thank the Faculty of Chemical Technology at Hanoi University of Industry (HaUI), Hanoi 100000, Vietnam for the support provided in carrying out this work.
Declaration of Generative AI in Scientific Writing
This manuscript utilized generative AI tools, namely ChatGPT (OpenAI) and Grammarly, to enhance language clarity, grammar, and overall readability.
All AI-assisted edits were made under strict human oversight and control.
These tools were not used to:
- Generate scientific content
- Interpret or analyze data
- Develop research questions
- Draw or formulate conclusions
CRediT Author Statement
Tuan Anh Nguyen (lead author): Principal investigator and intellectual lead of the project; conceived the original research idea, designed the experimental framework, developed the methodological strategy, secured funding, supervised all experimental and analytical activities, interpreted data, coordinated the research team, and led the manuscript preparation and revision process. Thi Thu Phương Nguyen: Investigation, Data curation, Writing – review & editing, Visualization. Xuan Huy Nguyen: Formal analysis, Validation, Visualization.
All authors: Review & editing, Final approval of the manuscript.
Data Availability
All relevant data supporting the findings of this study are available within the article.
References
[1] I Loulidi, M Jabri, A Amar, A Kali, AA Alrashdi, C Hadey, M Ouchabi, PS Abdullah, H Lgaz, Y Cho and F Boukhlifi. Comparative study on adsorption of Crystal violet and Chromium (VI) by activated carbon derived from spent coffee grounds. Applied Sciences 2023; 13(2), 985.
[2] A Kaur and S Sharma. Removal of heavy metals from waste water by using various adsorbents - a review. Indian Journal of Science and Technology 2017; 10(34), 117269.
[3] W Cherdchoo, S Nithettham and J Charoenpanich. Removal of Cr(VI) from synthetic wastewater by adsorption onto coffee ground and mixed waste tea. Chemosphere 2019; 221, 758-767.
[4] H Yazid, T Bouzid, EME Mouchtari, L Bahsis, ME Himri, S Rafqah and ME Haddad. Insights into the adsorption of Cr(VI) on activated carbon prepared from walnut shells: Combining response surface methodology with computational calculation. Clean Technologies 2024; 6(1), 199-220.
[5] KZ Elwakeel, AM Elgarahy, ZA Khan, MS Almughamisi and AS Al-Bogami. Perspectives regarding metal/mineral-incorporating materials for water purification: With special focus on Cr(VI) removal. Materials Advances 2020; 1(6), 1546-1575.
[6] I Loulidi, F Boukhlifi, M Ouchabi, A Amar, M Jabri, A Kali and C Hadey. Assessment of untreated coffee wastes for the removal of Chromium (VI) from aqueous medium. International Journal of Chemical Engineering 2021; 2021, 9977817.
[7] K Mulani, S Daniels, K Rajdeo, S Tambe and N Chavan. Adsorption of Chromium(VI) from aqueous solutions by coffee polyphenol-formaldehyde/acetaldehyde resins. Journal of Polymers 2013; 2013, 798368.
[8] BB Mathew, M Jaishankar, VG Biju and KN Beeregowda. Role of bioadsorbents in reducing toxic metals. Journal of Toxicology 2016; 2016, 4369604.
[9] GVK Mohan, AN Babu, K Kalpana and K Ravindhranath. Removal of Chromium (VI) from water using adsorbent derived from spent coffee grounds. International Journal of Environmental Science and Technology 2019; 16, 101-112.
[10] HB Mancilla, MR Cerrón, PG Aroni, JEP Paucar, CT Tovar, MK Jindal and G Gowrisankar. Effective removal of Cr(VI) ions using low-cost biomass leaves (Sambucus nigra L.) in aqueous solution. Environmental Science and Pollution Research 2023; 30, 106982-106995.
[11] H Çelebi, G Gök and O Gök. Adsorption capability of brewed tea waste in waters containing toxic lead(II), cadmium(II), nickel(II), and zinc(II) heavy metal ions. Scientific Reports 2020; 10, 17570.
[12] A Kebede, K Kedir, F Melak and TG Asere. Removal of Cr(VI) from aqueous solutions using biowastes: Tella residue and pea (Pisum sativum) seed shell. The Scientific World Journal 2022; 2022, 7554133.
[13] M Tripathi, S Pathak, R Singh, P Singh, PK Singh, AK Shukla, S Maurya, S Kaur and B Thakur. A comprehensive review of lab-scale studies on removing hexavalent chromium from aqueous solutions by using unmodified and modified waste biomass as adsorbents. Toxics 2024; 12(9), 657.
[14] Y Jiang, M Dai, F Yang, I Ali, I Naz and C Peng. Remediation of Chromium (VI) from groundwater by metal-based biochar under anaerobic conditions. Water 2022; 14(6), 894.
[15] M Cheraghi, S Sobhanardakani, R Zandipak, B Lorestani and H Merrikhpour. Removal of Pb(II) from aqueous solutions using waste tea leaves. Iranian Journal of Toxicology 2015; 9(28), 1247-1253.
[16] M Jalali and F Aboulghazi. Sunflower stalk, an agricultural waste, as an adsorbent for the removal of lead and cadmium from aqueous solutions. Journal of Material Cycles and Waste Management 2013; 15, 548-555.
[17] DS Malik, CK Jain and AK Yadav. Removal of heavy metals from emerging cellulosic low-cost adsorbents: A review. Applied Water Science 2017; 7, 2113-2136.
[18] DK Mondal, BK Nandi and MK Purkait. Removal of mercury(II) from aqueous solution using bamboo leaf powder: Equilibrium, thermodynamic and kinetic studies. Journal of Environmental Chemical Engineering 2013; 1(4), 891-898.
[19] M Torab-Mostaedi, M Asadollahzadeh, A Hemmati and A Khosravi. Equilibrium, kinetic, and thermodynamic studies for biosorption of cadmium and nickel on grapefruit peel. Journal of the Taiwan Institute of Chemical Engineers 2013; 44(2), 295-302.
[20] ZA Al-Othman, R Ali and M Naushad. Hexavalent chromium removal from aqueous medium by activated carbon prepared from peanut shell: Adsorption kinetics, equilibrium and thermodynamic studies. Chemical Engineering Journal 2012; 184, 238-247.
[21] S Sugashini and KMMS Begum. Preparation of activated carbon from carbonized rice husk by ozone activation for Cr(VI) removal. New Carbon Materials 2015; 30(3), 252-261.
[22] S Babel and TA Kurniawan. Cr(VI) removal from synthetic wastewater using coconut shell charcoal and commercial activated carbon modified with oxidizing agents and/or chitosan. Chemosphere 2004; 54(7), 951-967.
[23] VK Gupta, A Rastogi and A Nayak. Adsorption studies on the removal of hexavalent chromium from aqueous solution using a low-cost fertilizer industry waste material. Journal of Colloid and Interface Science 2010; 342(1), 135-141.
[24] EH Gora, SG Saldana, LM Casper, VC Sijercic, OA Giza and RL Sanders. Effect of exhausted coffee ground particle size on metal ion adsorption rates and capacities. ACS Omega 2022; 7(43), 38600-38612.
[25] G Z Kyzas. Commercial coffee wastes as materials for adsorption of heavy metals from aqueous solutions. Materials 2012; 5, 1826–1840.
[26] R Campbell, B Xiao and C Mangwandi. Production of activated carbon from spent coffee grounds (SCG) for removal of hexavalent chromium from synthetic wastewater solutions. Journal of Environmental Management 2024; 366, 121682.
[27] I Loulidi, M Jabri, A Amar, A Kali, AA Alrashdi, C Hadey, M Ouchabi, PS Abdullah, H Lgaz, Y Cho and F Boukhlifi. Comparative study on adsorption of crystal violet and Chromium (VI) by activated carbon derived from spent coffee grounds. Applied Sciences 2023; 13(2), 985.
[28] Y Hu, M Zhi, S Chen, W Lu, Y Lai and X Wang. Efficient removal of Cr(VI) by spent coffee grounds: Molecular adsorption and reduction mechanism. Korean Journal of Chemical Engineering 2022; 39(7), 1872-1879.
[29] M Masuku, JF Nure, HI Atagana, N Hlongwa and TTI Nkambule. Pinecone biochar for the adsorption of Chromium (VI) from wastewater: Kinetics, thermodynamics, and adsorbent regeneration. Environmental Research 2024; 258, 119423.
[30] H Wang, W Wang, S Zhou and X Gao. Adsorption mechanism of Cr(VI) on woody-activated carbons. Heliyon 2023; 9(2), 13267.
[31] Y Fang, K Yang, Y Zhang, C Peng, A Robledo-Cabrera and A López-Valdivieso. Highly surface activated carbon to remove Cr(VI) from aqueous solution with adsorbent recycling. Environmental Research 2021; 197, 111151.
[32] T Karthikeyan, S Rajgopal and LR Miranda. Chromium(VI) adsorption from aqueous solution by Hevea Brasiliensis sawdust activated carbon. Journal of Hazardous Materials 2005; 124(1-3), 192-199.
[33] X Zhang, B Ren, X Wu, X Yan, Y Sun, H Gao and F Qu. Efficient removal of Chromium(VI) using a novel waste biomass chestnut shell-based carbon electrode by electrosorption. ACS Omega 2021; 6(39), 25389-25396.
[34] H Liu, F Zhang and Z Peng. Adsorption mechanism of Cr(VI) onto GO/PAMAMs composites. Scientific Reports 2019; 9, 3663.
[35] YS Ho and G McKay. Pseudo-second-order model for sorption processes. Process Biochemistry 1999; 34(5), 451-465.
[36] I Langmuir. The adsorption of gases on plane surfaces of glass, mica and platinum. Journal of the American Chemical Society 1918; 40(9), 1361-1403.
[37] H Patel. Fixed-bed column adsorption study: A comprehensive review. Applied Water Science 2019; 9, 45.
[38] MMA Aslam, W Den and HW Kuo. Removal of hexavalent chromium by encapsulated chitosan-modified magnetic carbon nanotubes: Fixed-bed column study and modelling. Journal of Water Process Engineering 2021; 42, 102143.
[39] M Kebir, H Tahraoui, M Chabani, M Trari, N Noureddine, AA Assadi, A Amrane, NB Hamadi and L Khezami. Water cleaning by a continuous fixed-bed column for Cr(VI) eco-adsorption with green adsorbent-based biomass: An experimental modeling study. Processes 2023; 11(2), 363.
[40] X Guo, A Liu, J Lu, X Niu, M Jiang, Y Ma, X Liu and M Li. Adsorption mechanism of hexavalent chromium on biochar: Kinetic, thermodynamic, and characterization studies. ACS Omega 2020; 5(42), 27323-27331.
[41] DK Nguyen, QB Ly-Tran, VP Dinh, BN Duong, TPT Nguyen and PNK Tuyen. Adsorption mechanism of aqueous Cr(vi) by Vietnamese corncob biochar: A spectroscopic study. RSC Advances 2024; 14(53), 39205-39218.
[42] Tuan Anh Nguyen, Thi Huong Nguyen, Doan Thi Yen Oanh, Thi Thu Phuong Nguyen, Thi Thu Giang Pham, Minh Viet Nguyen, Ngoc Thanh Nguyen. Sustainable valorization of recycled coffee grounds into high-performance bio-adsorbents for efficient Cr(VI) removal. Vietnam Journal of Chemistry 2026; 2026.
[43] Y Hu, M Zhi, S Chen, W Lu, Y Lai and X Wang. Efficient removal of Cr(VI) by spent coffee grounds: Molecular adsorption and reduction mechanism. Korean Journal of Chemical Engineering 2022; 39(7), 1872-1879.