
Trends
Sci.
2026;
23(10):
13546
Mitochondrial Marker-Based EvaGreen Real-Time PCR for Specific Detection and Quantification of Exserohilum rostratum in Rice Tissues
Yatavee Boonkorn, Veeranee Tongsri,
Patcharavipa Chaijuckam and Pattavipha Songkumarn*
Department of Plant Pathology, Faculty of Agriculture, Kasetsart University, Bangkok 10900, Thailand
(*Corresponding author’s e-mail: [email protected])
Received: 3 February 2026, Revised: 24 March 2026, Accepted: 1 April 2026, Published: 10 May 2026
Abstract
Exserohilum rostratum is a globally distributed ascomycetous fungus with a broad host range, including rice, where it causes brown to reddish-brown leaf spots and grain discoloration. The temperature-dependent development of rice leaf spot disease highlights E. rostratum as a promising model pathogen for studying rice-fungus interactions under elevated temperature conditions. However, disease diagnosis remains challenging due to symptom overlap with other rice-associated fungi and the presence of numerous small, scattered lesions that hinder reliable disease assessment. In addition, sensitive and specific molecular tools for accurate quantification of E. rostratum in rice tissues remain limited. To address this gap, and to our knowledge for the first time, we developed a dye-based real-time PCR assay using EvaGreen chemistry for the specific detection and quantification of E. rostratum in rice tissues. Primers were designed from nuclear loci, including the actin (ACT) and glyceraldehyde-3-phosphate dehydrogenase (GAPDH) gene regions, and from mitochondrial loci, including cytochrome c oxidase subunits 1 and 2 (COX1/2), cytochrome c oxidase subunit 3 (COX3), and apocytochrome b (COB). The COX3 and COB assays showed high specificity for E. rostratum, with no amplification of other common rice-associated fungi. The COX3 assay demonstrated superior performance, with higher amplification efficiency (94.65% - 109.08%) and approximately 7.5-fold greater sensitivity (LOD95 = 61.50 pg μL-1) than the COB assay (59.04% - 75.44% and LOD95 = 464.50 pg μL-1). Both assays enabled successful monitoring of fungal colonization in inoculated rice tissues and showed strong positive correlations between symptom development and pathogen DNA levels. These assays provide accurate and reliable tools for pathogen diagnosis, quantitative disease assessment, cultivar screening, and studies of disease dynamics in the rice–E. rostratum pathosystem.
Keywords: Rice, Leaf spot, Exserohilum rostratum, Setosphaeria rostrata, Real-time PCR, qPCR assay, Mitochondrial markers
Introduction
Rice (Oryza sativa L.) is a major staple food crop and one of Thailand’s most important agricultural commodities. It ranks among the top 3 agricultural products in terms of export value [1]. Plant diseases affecting rice are considered one of the major obstacles to the countryʼs rice production. Considerable attention has been given to major diseases affecting Thai rice yields, such as rice blast and bacterial leaf blight. However, rice grain discoloration, a minor disease, has recently gained attention as a significant threat to rice
quality. This disease adversely affects rice quality, as infected grains become more prone to breakage [2].
Exserohilum rostratum (anamorphic stage), also known as Setosphaeria rostrata (teleomorphic stage), is a dematiaceous fungus belonging to the family Pleosporaceae within the phylum Ascomycota [3]. It exhibits a broad host range, causing leaf spots and blight in more than thirty plant species, including economically important crops such as rice, corn, wheat, sugarcane, and tomato [4-8]. In rice, E. rostratum is associated with small brown or reddish-brown spots, seed discoloration and spikelet rot [9,10]. These symptoms have been increasingly reported in tropical and subtropical regions [4,9-15]. Recent genomic studies of E. rostratum strains associated with rice have identified potential pathogenicity-related genes. These findings highlight its capacity for host infection and adaptation [10]. Furthermore, outbreaks of this pathogen may be driven by rising temperatures due to global climate change [4]. Correspondingly, the expression of leaf spots in rice has been shown to be influenced by relatively higher temperatures (33 °C compared to 27 °C) [9]. Due to its thermotolerance, pathogenic versatility, and ease of culture and inoculation, E. rostratum represents a promising model fungal pathogen. It is particularly useful for elucidating rice-fungus interactions under elevated temperature conditions. Studying this system may provide valuable insights into how rising global temperatures modulate the balance between host resistance and fungal aggressiveness. Such knowledge could contribute to the development of climate-resilient disease management strategies.
Diagnosing rice symptoms caused by E. rostratum remains challenging, because they can resemble those caused by other pathogens, such as Curvularia spp. and Alternaria spp. [9]. Furthermore, accurate visual assessment of E. rostratum disease severity is difficult because infections typically produce numerous small, scattered lesions [9]. These symptom characteristics complicate disease assessment by both visual inspection and automated visible-range image analysis. In addition, disease evaluation is influenced by individual interpretation, leading to high observer variability and reduced precision across treatments [16,17].
Accurate diagnosis of E. rostratum using conventional procedures is time-consuming and labor-intensive. These procedures typically involve pathogen isolation, morphological characterization, and pathogenicity confirmation. Therefore, molecular diagnostic technique such as polymerase chain reaction (PCR) can help accelerate this process. Both conventional and real-time PCR use species-specific primers to amplify target sequences from genomic DNA, providing high accuracy, reproducibility, and rapid results [18]. Real-time PCR, also known as quantitative PCR (qPCR), offers several advantages over conventional PCR, including greater sensitivity and the elimination of post-PCR processing [19]. Moreover, it enables reliable quantification of target DNA in a sample, making it well suited for assessing pathogen load in plants and facilitating disease evaluation [20]. Real-time PCR assays have been successfully developed for the detection and quantification of several rice fungal pathogens. These include Pyricularia oryzae, the causal agent of rice blast [21]; Rhizoctonia solani, which causes rice sheath blight [22]; and Bipolaris oryzae, responsible for rice brown spot [23].
With respect to E. rostratum, real-time PCR hybridization assays (e.g., TaqMan and molecular beacon-based assays) targeting the internal transcribed spacer (ITS) region have been successfully developed. These assays have been primarily used for detection and quantification in human clinical samples, where the fungus has been reported as an opportunistic pathogen causing infections such as keratitis and meningitis [24], and they demonstrate high sensitivity and specificity [25,26]. These studies highlight the feasibility of molecular detection of E. rostratum. However, their application has largely been limited to clinical contexts and has not yet been extended to plant tissues. Furthermore, several important gaps remain. First, no real-time PCR assay has been established for the detection and quantification of E. rostratum in planta, particularly in rice. Second, cost-effective dye-based real-time PCR assays, which are more accessible for routine plant pathology studies, remain largely unexplored for this pathogen. Third, the potential of mitochondrial gene markers as alternative detection targets has not yet been systematically evaluated. Finally, the quantitative association between E. rostratum biomass and disease severity in rice tissues remains unclear.
To address these gaps, this study aimed to develop a dye-based real-time PCR assay using EvaGreen chemistry for the specific detection and quantification of E. rostratum in rice tissues. To our knowledge, this study represents the first report of an EvaGreen-based real-time PCR assay for in planta detection and quantification of E. rostratum in rice. Unlike previously reported probe-based assays developed for clinical samples, this approach provides a cost-effective and accessible method suitable for routine plant pathology applications. In addition, we evaluated mitochondrial and nuclear gene targets for assay development. We also assessed the association between E. rostratum DNA levels and disease severity in infected rice leaves to validate the assay for quantitative disease assessment in plant pathology studies.
Materials and methods
Fungal isolates and culture conditions
A total of 27 fungal isolates associated with rice (Table 1) were used for genomic DNA preparation and were subjected to the determination of the sensitivity and specificity of real-time PCR primer sets. Specifically, the fungal species tested in this study included E. rostratum (n = 10), B. oryzae (n = 4), P. oryzae (n = 3), Curvularia lunata (n = 4), Alternaria padwickii (n = 2), Rhizoctonia spp. (n = 2), and Fusarium spp. (n = 2). All fungal isolates were originally isolated from rice tissue samples. For fungal cultivation, all isolates were grown on a half strength Potato Dextrose Agar (PDA, HiMedia; Bangalore, India) and incubated at 27 °C for 5 days. For genomic DNA preparation, mycelial tissue from each isolate was aseptically scraped and transferred to complete medium (6 g L−1 yeast extract, 6 g L−1 casein hydrolysate, and 10 g L−1 sucrose). The fungal cultures were then grown at room temperature under shaking conditions at 200 rpm, 27 °C for 72 h.
Table 1 Fungal isolates used in this study.
Organism |
Isolate code |
References or Nearest BLAST match* |
Laboratory collection/ Contributor |
Exserohilum rostratum (n = 10) |
ER-AT1, ER-BKK11-3, ER-BKK16-1, ER-BKK17-3, ER-BKK18-1, ER-CCO2, ER-CN1, ER-CNT13-1, ER-PTE33-1, and ER-PTE2-1 |
[9] |
The fungal laboratory (514), Dept. of Plant Pathology, Kasetsart University |
Bipolaris. oryzae (n = 4) |
BO-SBR93, BO-SBR92, BO-PT1, and BO-CN7 |
[27] |
The fungal laboratory (514), Dept. of Plant Pathology, Kasetsart University |
Pyricularia oryzae (n = 3) |
MO-001 MO-002 MO-003 |
P. oryzae, OR492543 (100%) P. oryzae, KY967404 (98.39%) P. oryzae, MH714733 (98.03%) |
The fungal laboratory (514), Dept. of Plant Pathology, Kasetsart University |
Curvularia lunata (n = 4) |
C-NP11 C-NP12 and C-CN22 C-NB4 |
C. lunata, KP638342 (100%) C. lunata, MH010917 (99.82%) C. lunata, MK174964 (99.48%) |
The fungal laboratory (514) Dept. of Plant Pathology, Kasetsart University |
Alternaria padwickii (n = 2) |
TP-01 and TP-02
|
A. padwickii isolate O, OM899918 (100%) |
The fungal laboratory (514), Dept. of Plant Pathology, Kasetsart University |
Rhizoctonia solani (n = 2) |
RS-Ppath RS-DOA |
R. solani strain AG 1-IA isolate WLP2-01, MG397056 (100%) R. solani isolate DP01, MG385683 (99.72%) |
Natural Products for Plant Protection Laboratory, Dept. of Plant Pathology, Kasetsart University Department of Agriculture, Thailand |
Fusarium spp. (n = 2) |
F-PTL1 F-PTL2 |
F. oxysporum ON795989 (97.65%) Fusarium sp., MT135013 (100%) |
The fungal laboratory (Room 514), Dept. of Plant Pathology, Kasetsart University |
*Isolates previously molecularly characterized were identified based on published references. Isolates not previously characterized were identified using DNA barcode sequences, and taxonomic assignment at the genus or species level was based on the nearest BLAST match.
Plant growth conditions and fungal inoculation
Khao Dawk Mali 105 (KDML105), the most economically significant rice cultivar in Thailand and Jao Hom Nin (JHN), which exhibit varying levels of susceptibility to E. rostratum, ranging from highly susceptible to less susceptible, respectively [28], were utilized as plant materials for E. rostratum inoculation. KDML105 rice seeds were purchased from the Surin Rice Seed Center of the Rice Department (DOA), Thailand, while JHN rice seeds were provided by the Rice Science Center at Kasetsart University, Kamphaeng Saen Campus. Healthy rice seeds of each cultivar were soaked in water overnight and then placed on moist paper towels in containers for seed germination. After 7 days, the germinated seeds were transferred into 20 cm pots filled with a commercial soil mixture. Each pot was divided in half for growing the germinated seeds (n = 5). The pots were maintained in a greenhouse and received granular urea fertilizer every 7 days. One-month-old seedlings of KDML105 and JHN were prepared for fungal inoculation on their leaves.
For fungal inoculation, the representative isolate of E. rostratum (ER-PTE33-1), which consistently produced spores, was used to prepare the spore suspension following a previously described protocol [9]. The spore suspension was adjusted to 1×10⁵ spore mL−1 and used for spray inoculation. Inoculated plants were incubated at high relative humidity for 24 h in a growth room at ambient temperature, then transferred to a greenhouse and regularly misted to maintain favorable conditions. For the negative control, plants were sprayed with sterile water containing 0.01% Tween 20. At 0, 24, 48, and 72 h post-inoculation, E. rostratum-inoculated and mock-treated leaves were harvested, photographed, and analyzed using Photopea (www.photopea.com) for image analysis to determine the percentage of diseased leaf area. Disease severity was calculated as the ratio of symptomatic to total leaf area. Samples were then ground in liquid nitrogen and stored at −80 °C for genomic DNA extraction.
DNA extraction and qualification
Genomic DNA from all fungal isolates and rice samples, either infected with E. rostratum or treated with sterile water containing 0.01% Tween 20, was extracted using the conventional cetyl trimethylammonium bromide (CTAB) method [29]. The mycelia of each fungal isolate grown in complete medium were harvested and transferred into 2.0 mL microcentrifuge tubes. One milliliter of sterile water was added to the tubes to wash off the remaining liquid media, and a pipette was used to remove the excess water. For the rice samples ground into a powder, 100 mg was transferred to a 2.0 mL microcentrifuge tube for further DNA isolation steps. The fungal mycelial samples and rice samples were then added with 300 µL of CTAB extraction buffer (2% CTAB (hexadecyltrimethylammonium bromide), 100 mM Tris HCl (pH = 8), 20 mM EDTA, 1.4 M NaCl, 0.2% beta-mercaptoethanol). All samples were homogenized using modified drilling machines in conjunction with stainless steel beads for 5 min, followed by incubation at 65 °C for 30 min. Subsequently, 300 µL of chloroform was added to each tube, which were then inverted gently to mix. The samples were centrifuged at 10,000 rpm for 10 min. The supernatant from each sample was transferred to a 1.5 mL centrifuge tube. Each supernatant was treated with RNase A (Bioneer, Daejeon, Korea) at a final concentration of 25 µg mL−1 for 30 min at 37 °C, and then purified again using an equal volume of chloroform. Following centrifugation at 10,000 rpm for 10 min, the supernatant was transferred to a 1.5 mL centrifuge tube. To this, 1/10 volume of 3 M sodium acetate (pH 5.2) and 200 µL of cold isopropanol were added, and the mixture was gently mixed before centrifugation for 10 min. The supernatant was then removed, and the fungal and rice DNA pellets were washed with cold 70% ethanol and centrifuged at 10,000 rpm for 10 min, after which the supernatant was discarded. The DNA pellets from all samples were allowed to dry at room temperature. The DNA was subsequently dissolved in 50 µL of sterile ultrapure water. The quantity of DNA from each sample was measured using a NanoDrop 8,000 spectrophotometer (Thermo Fisher Scientific, Wilmington, USA).
Real-time PCR primer design
To identify suitable loci for real-time PCR primer development specific to E. rostratum, we first designed primer sets based on the well-known primary fungal DNA barcodes, including the internal transcribed spacer (ITS) region (ITS1, 5.8S and ITS2) and other fungal DNA barcodes such as DNA sequences of genes, including translational elongation factor 1- α (EF1α), actin (ACT), the glyceraldehyde-3-phosphate dehydrogenase (GAPDH). The DNA sequences from each loci (ITS, EF1α, ACT and GAPDH) of E. rostratum isolates (n = 5) were retrieved from Genbank (https://www.ncbi.nlm.nih.gov/nucleotide/) and were used to identify regions of similarity among these different isolates by multiple sequence alignment using Clustal Omega (https://www.ebi.ac.uk/jdispatcher/msa/clustalo). Subsequently, regions of DNA containing conserved sequences for each locus were utilized for primer design using Primer-BLAST (https://www.ncbi.nlm.nih.gov/tools/primer-blast/). Default parameters were applied, with the exception that the minimum and maximum PCR product sizes were set between 70 and 350 bp to enhance the likelihood of designing E. rostratum-specific primers. Furthermore, for the primer pair specificity checking parameters, nr database and exclusion organisms, i.e., the fungal pathogens associated with rice [P. oryzae (taxid:318829), B. oryzae (taxid:101162), R. solani AG-1 IA (taxid:983506), Fusarium fujikuroi species complex (taxid:171627), A. padwickii (taxid:714880), C. lunata (taxid:5503), Oryza sativa Indica group (taxid:39946), and Oryza sativa Japonica group (taxid:39947)] were selected prior to running the software. Utilizing the described process, Primer-BLAST can generate candidate primer sets specific to ACT, and GAPDH sequences. However, it is unable to produce specific primers for ITS and EF1α regions due to non-specific binding with the input fungal species. The sequence of mitochondrial cytochrome c oxidase subunit I (COI) gene region has been proposed as a universal DNA barcode and has demonstrated effectiveness in some fungal species of Ascomycota and hyphomycetes [30]. We further aimed to design more specific primer sets by utilizing the mitochondrial DNA sequences of E. rostratum (GenBank accession number: NC_063082), specifically from the regions of cytochrome c oxidase subunits 1 and 2 (COX1/2) and subunit 3 (COX3). Additionally, the mitochondrial nucleotide sequence from apocytochrome b (COB) region was included in the design of the specific primer sets for this study. The DNA sequences of COX1/2, COX3, and COB regions were then submitted to Primer-BLAST for primer set design based on the parameters described above. The details of all primer sets generated from ACT, GAPDH, COX1/2, COX3, and COB regions with Primer-BLAST are presented in Table 2.
Table 2 Primer sequences designed in the present study.
Locus |
Primer sequences (5’-3’) |
Amplicon size (bps) |
Product Tm (°C) |
Annealing temperature (°C) |
actin (ACT) |
ActFn: CTCGACTTCGAGCAGGAGA ActRn: TGTGTTAGCTGCCTGTGCTCGA |
286 |
88.0 |
62 |
ActFn: CTCGACTTCGAGCAGGAGA ActR1: GACCGTCAGGAAGCTCGTAG |
76 |
85.0 |
60 |
|
ActF1: CTGGGTCTTGAGAGCGGTGG ActRn: TGTGTTAGCTGCCTGTGCTCGA |
148 |
85.5 |
60 |
|
glyceraldehyde-3-phosphate dehydrogenase (GAPDH) |
GDP-F1: TTCTTTCGTCAGGACCGTGG GDP-R1: CTTCTCCATGTGGAAGCGGA |
147 |
89.0 |
60 |
GDP-F2: AAGGCTCACTTGAAGGGTGG GDP-R2: GAGCACCTCAATGTCGGACT |
117 |
85.5 |
60 |
|
cytochrome c oxidase subunits 1 and 2 (COX1/2) |
COXI-II-F1: CCACCGGCTAAGACAGGTAA COXI-II-R: TCTCAAGTTTACTTGGGGCTATGA |
150 |
77.5 |
60 |
COXI-II-F2: AATCTTATACCAGGACTTCTCATGT COXI-II-R: TCTCAAGTTTACTTGGGGCTATGA |
70 |
75.5 |
60 |
|
cytochrome c oxidase subunit 3 (COX3) |
COX3-F1: CTGCTTCCAACCCAAGGTGA COX3-R1: ATGATAACAAAATTGTCCACGGAT |
120 |
78.5 |
65 |
COX3-F2: ATCTTATACCAGGACTTCTCATGT COX3-R1: ATGATAACAAAATTGTCCACGGAT |
70 |
74.0 |
60 |
|
apocytochrome b (COB)
|
COB-F1: ACCGTTAGGGCTGACGGATA COB-R1: ATCAAATTGCGAATTGTTTGCCA |
139 |
76.0/76.5 |
67 |
COB-F2: TGGCTGAAACGCTGCTTAATG COB-R2: TGTTACCGGCAATACCGATGT |
148 |
77.0 |
60 |
Note: Primers for each locus were designed based on multiple E. rostratum sequences retrieved from GenBank. The accession numbers for each locus are as follows: ACT (HE664072, HE664074, HE664076, HE664078, HE664079), GAPDH (LT882538, LT883543, KP311328, AF081379, MW448217). For mitochondrial targets (COX1/2, COX3, and COB), sequences were obtained from the complete mitochondrial genome of E. rostratum (GenBank accession number: NC_063082), and gene regions were manually identified for primer design.
Real-time PCR amplification: specificity and sensitivity testing
All real-time PCR experiments were designed, performed, and reported in line with the Minimum Information for Publication of Quantitative Real-Time PCR Experiments (MIQE) guidelines. Real-time PCR assays and data analyses were conducted using the primer sets listed in Table 2 on a CFX96™ Deep Well real-time PCR detection system (Bio-Rad Corporation, Hercules, CA, USA). The optimization of assay conditions was conducted primarily by adjusting primer concentrations and annealing temperatures for each primer set through gradient PCR analysis against the genomic DNA templates of each representative fungal isolate, including E. rostratum, P. oryzae, B. oryzae, C. lunata, A. padwickii, R. solani and Fusarium spp. An optimal primer concentration of 100 nM and suitable annealing temperature of each primer were finally chosen for the real-time PCR assay against all genomic DNA samples of either target or non-target fungal species and rice cultivar KDML105. Each reaction was performed in a total volume of 20 µL using 0.2 mL 8-tube strips. The PCR reaction mixture included 4 µL of 5x HOT FIREPol® EvaGreen® qPCR Mix (no ROX) (Solis BioDyne, Tartu, Estonia), 50 ng of fungal DNA, and 100 nM of each specific primer, with nuclease-free water added to reach the final volume of 20 µL. The thermocycling profile consisted of an initial denaturation at 95 °C for 12 min, followed by 40 cycles of denaturation at 95 °C for 15 s, annealing at the appropriate temperature as indicated in Table 2 for 20 s, and extension at 72 °C for 30 s. A melting curve analysis was performed at the end of amplification, comprising one cycle that began at 95 °C for 10 s, followed by 65 °C for 0.5 s, with the temperature then increasing to 95 °C at a rate of 0.5 °C/s. The specificity of each primer set in real-time PCR was assessed against 50 ng genomic DNA of the target fungus and other non-target fungi as well as rice. Additionally, a negative control (sterile water) was included in the real-time PCR run, with 3 technical replicates for each assay and 2 independent biological replicates. The specificity of the fluorescent dye-based real-time PCR products was verified using the melting curves recorded after each run. Furthermore, the products were analyzed by gel electrophoresis on 2% agarose gels and RedSafeTM (iNtRON Biotechnology, Sungnam, Korea) and run at 80 V for 1 h to confirm the presence of a single specific band and the absence of primer dimer products.
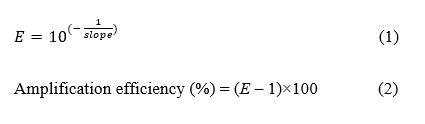
To evaluate the amplification efficiency of each real-time PCR assays, genomic DNA from representative E. rostratum isolates was prepared at concentrations ranging from approximately 1 to 150 ng and subjected to real-time PCR using each primer set under the conditions described above. The amplification efficiency (% E) was assessed by plotting the mean quantification cycle (Cq) values from at least 2 of 3 technical replicates against the logarithm of DNA concentration to generate a standard curve. Linear regression analysis was performed to determine the slope and coefficient of determination (R²) of the standard curve. The per-cycle amplification factor (E) was calculated from the slope using Eq. (1), and the amplification efficiency (%) was subsequently calculated using Eq. (2).
To assess analytical sensitivity, genomic DNA from representative E. rostratum isolates (ER-CCO2, ER-PTE2-1, ER-PTE33-1, and ER-BKK11-3) was serially diluted and used to determine the LOD95 (defined as the DNA concentration yielding a 95% probability of detection) of the COB and COX3 assays. DNA concentrations ranged from 0.01 to 10.0 ng for the COB assay and from 0.005 to 5.0 ng for the COX3 assay. These concentrations were selected based on preliminary tests that identified the transition range where detection rates declined from nearly 100% to sporadic. For each DNA concentration tested, at least 20 real-time PCR reactions were performed using DNA templates derived from 4 different fungal isolates, with multiple reactions prepared for each isolate under the reaction conditions described above. A reaction was scored as positive when it produced a Cq value accompanied by the reliable amplification curve and melt-curve profile. Hit rates (proportion of positive reactions) were calculated for each concentration. The LOD95 was determined by fitting a logistic regression model to the relationship between the log-transformed template DNA concentration (X-axis) and the probability of detection (Y-axis), using Microsoft Excel for data analysis.
Detection and quantification of Exserohilum rostratum in infected rice leaves
Real-time PCR assays were conducted using genomic DNA extracted from KDML105 and JHN leaves inoculated with E. rostratum and collected at 0, 24, 48, and 72 h post-inoculation, in order to evaluate primer suitability for fungal detection and quantification. Each sample was analyzed in 3 technical replicates, with at least 2 biological replicates per time point. The reaction mixture contained 4 µL of 5× HOT FIREPol® EvaGreen® qPCR Mix (no ROX) (Solis BioDyne, Tartu, Estonia), 100 ng of genomic DNA template, and 100 nM of each primer, with nuclease-free water added to a final volume of 20 µL. Thermocycling conditions followed the protocol described previously. Relative fungal biomass was quantified by normalizing the Cq values of the E. rostratum-specific primers to those of rice reference genes. Two rice primers were evaluated as internal controls: (i) elongation factor 1α (EF1α; Os03g08020) [EF1α-F: GTCATTGGCCACGTCGACTC; EF1α-R: TGTTCATCTCAGCGGCTTCC [32], and (ii) ubiquitin (Ub) [OsUG-F: TTCTGGTCCTTCCACTTTCAG; OsUG-R: ACGATTGATTTAACCAGTCCA [33]. Relative fungal growth was originally calculated using the method described by [33] (Eq. (3)), in which fungal biomass is expressed as the ratio of a fungal reference gene to a rice reference gene. This approach assumes equal amplification efficiencies for both primer sets and that PCR products double perfectly during each cycle of exponential amplification (i.e., E = 2). In the present study, this assumption was not applied. Instead, relative fungal growth was quantified using a modified, efficiency-corrected approach (Eq. (4)), adapted from Eq. (3) and derived from principles established in previous studies [34,35]. In this model, the actual per-cycle amplification factor (E) for each fungal and rice reference primer was obtained from standard curve analysis, as described in an earlier section. This modification allows for more accurate estimation of relative fungal growth by accounting for differences in amplification efficiency between primer sets.

Data analysis
Means and standard deviations (SDs) of Cq values from replicate experiments were calculated using Microsoft Excel. Statistical analyses were performed using R version 3.6.2 [36]. Prior to analysis, data normality was assessed using the Shapiro-Wilk test, and homogeneity of variances was evaluated using Levene’s test. Student’s t-test was used for pairwise comparisons, while one-way analysis of variance (ANOVA) followed by Tukey’s post hoc test (p ≤ 0.05) was applied to determine significant differences among treatments. The relationship between relative fungal biomass and the percentage of affected leaf area was assessed using Pearson’s correlation coefficient (r).
Results and discussion
Primer specificity
Among the eleven primer pairs evaluated in this study (Table 2), only two (COX3-F1/COX3-R1 and COB-F1/COB-R1) successfully and consistently amplified E. rostratum DNA. These primers target the mitochondrial COX3 and COB regions, respectively. No amplification was detected from non-target rice-associated fungal species, rice cultivars (KDML105 and JHN), or negative controls. This confirms the high specificity of both primer sets (Figure 1; Supplementary Table S1; Supplementary Figure S1). In EvaGreen-based real-time PCR assays, COX3-F1/COX3-R1 generated a single, uniform melting peak at 78.5 °C across all E. rostratum isolates. This peak corresponded to a 120-bp amplicon, with no evidence of primer-dimer formation. In contrast, the COB-F1/COB-R1 primer pair produced 139-bp amplicons with slight but reproducible variation in melting temperature (76.0 - 76.5 °C) among isolates. This variation likely reflects underlying nucleotide polymorphisms within the targeted region (Figure 2; Supplementary Figure S2). Together, these results demonstrate that both primer pairs are highly specific to E. rostratum, while the COB assay additionally enables discrimination of intraspecific sequence variation. Based on these findings, this study established EvaGreen-based real-time PCR assays for the specific detection of E. rostratum in rice tissues, providing a robust molecular tool for diagnosing rice leaf spot disease. The assays address key limitations of conventional diagnostic approaches, as symptoms caused by E. rostratum are often indistinguishable from those induced by Alternaria and Curvularia spp. [9]. By enabling objective and reproducible quantification of pathogen biomass, this approach improves upon visual or image-based disease assessments. Such assessments may vary between observers [16,17]. The successful targeting of mitochondrial gene regions further strengthens assay specificity. It also supports broader applications in epidemiological and host-pathogen interaction studies involving E. rostratum.
Fungal mitochondrial genomes display substantial sequence divergence, intron variability, and structural rearrangements. Consequently, mitochondrial genes provide valuable markers for species discrimination within genera and among closely related lineages [37,38]. For example, short mitochondrial barcode sequences, including those from the COX3 region, are sufficient for fungal species identification. However, they have limited utility for inferring detailed phylogenetic relationships [39]. Similarly, the COB region has been successfully used to resolve phylogenetic relationships within fungal genera, including Aspergillus section Fumigati [40] and cryptic species within the Fusarium graminearum species complex [38]. These examples further support the feasibility of using COX3 and COB regions for species-level discrimination in fungi. In contrast, the failure of ACT-, GAPDH-, and COX1/2-targeted primers designed in this study to generate specific amplicons is likely attributable to the highly conserved nature of these gene regions across diverse fungal taxa [30,41,42]. Such conservation can hinder the development of species-specific primers. It may also result in nonspecific amplification or reduced primer annealing efficiency.
Previously, probe-based quantitative PCR assays for E. rostratum detection and quantification were developed for clinical diagnostics. These assays target fungal DNA in patient tissues and body fluids. In these assays, primers and hydrolysis (TaqMan) probes were designed based on the internal transcribed spacer (ITS) region sequences of E. rostratum. This approach achieved high sensitivity, specificity, and rapid detection in clinical samples [25,26]. In contrast, attempts in the present study to design species-specific primers from the ITS region (ITS1–5.8S–ITS2) using NCBI Primer-BLAST were unsuccessful. The predicted primer sets exhibited potential cross-reactivity with B. oryzae and Alternaria spp. (data not shown). The superior performance of the ITS-based primers and probes in previous assays may be attributed to the use of a hydrolysis probe, which enhances assay specificity by discriminating against non-target amplification [43]. It may also reflect differences in the diversity of fungal species assessed in those studies. Similarly, attempts to design primer sets targeting the EF1α region were unsuccessful due to predicted cross-binding with Curvularia spp. (data not shown).
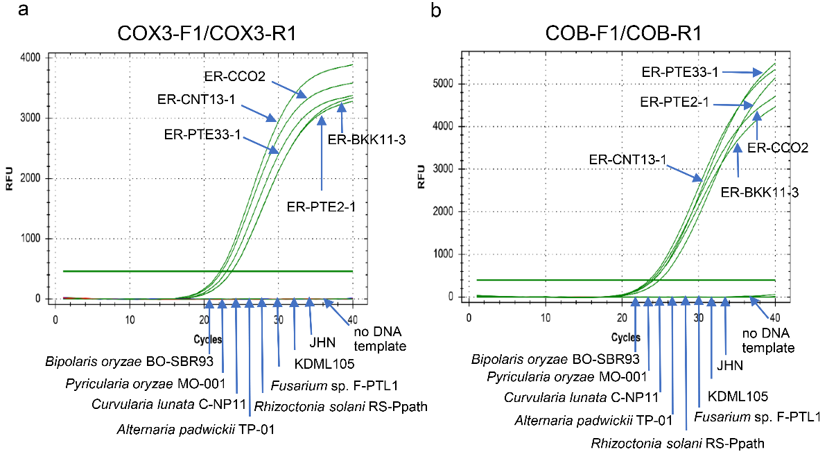
Figure 1 Specificity of the primer pairs, COX3-F1/COX3-R1 (a) and COB-F1/COB-R1 (b), in EvaGreen-based real-time PCR assays. Amplification curves display relative fluorescence units (RFU) plotted against cycle number for an individual technical replicate. The amplification curves for Exserohilum rostratum from 5 representative E. rostratum isolates are plotted in green using genomic DNA template with the concentration of approximate 50 ng, compared to genomic DNA from representative isolates of other rice-associated fungi, including Bipolaris oryzae BO-SBR93, Pyricularia oryzae MO-001, Curvularia lunata C-NP11, Alternaria padwickii TP-01, Rhizoctonia solani RS-Ppath, Fusarium spp. F-PTL1, and DNA from 2 rice cultivars, KDML105 and JHN, as well as a negative control (no DNA template).
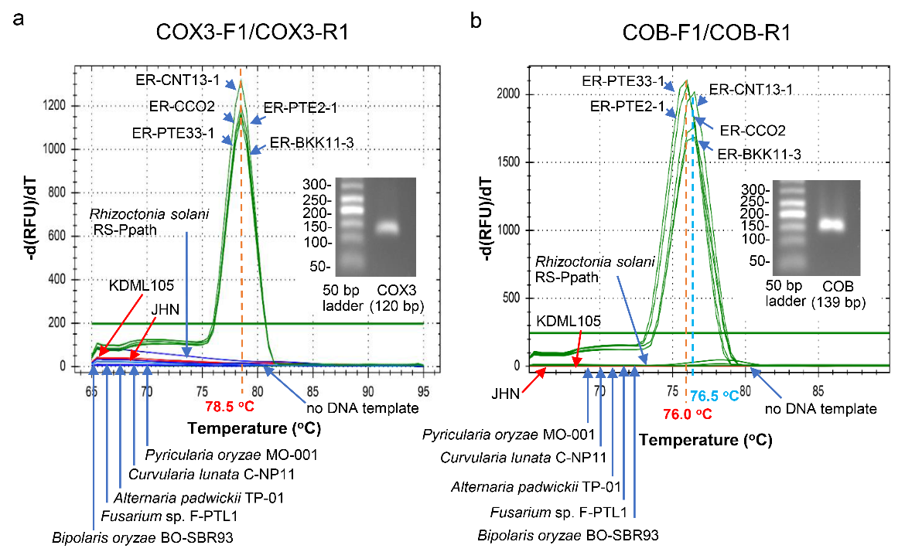
Figure 2 Melting peaks from EvaGreen-based real-time PCR assays of amplicons generated using the primer pairs COX3-F1/COX3-R1 and COB-F1/COB-R1 with 50 ng of genomic DNA from 5 representative Exserohilum rostratum isolates and other fungal species associated with rice, along with qPCR amplicon visualized on 2% agarose gel stained with RedSafe fluorescent dye. (a) A single peak at a melting temperature of 78.5 °C was obtained from the real-time PCR assays of COX3 amplicons using genomic DNA from 5 representative E. rostratum isolates. (b) Two distinct peaks, at melting temperatures of 76.0 °C and 76.5 °C, were obtained from the real-time PCR assays of COB amplicons among the E. rostratum isolates tested.
Primer efficiency and sensitivity
Standard curves were constructed for 2 primer pairs (COX3-F1/COX3-R1 and COB-F1/COB-R1) using genomic DNA from the representative E. rostratum isolates ER-PTE2-1, ER-PTE33-1, and ER-BKK11-3. The COX3-F1/COX3-R1 primer pair produced a linear standard curve across a range of diluted DNA templates from individual E. rostratum isolates. The assay showed R² values between ~0.97 and 0.99, with amplification efficiencies ranging from 94.65% to 109.08%. In contrast, the COB-F1/COB-R1 primer pair displayed R² values between ~0.94 and 0.99. However, it showed significantly lower amplification efficiencies (59.04% - 75.44%) (Table 3, Supplementary Figure S3). The COX3 real-time PCR assay exhibited higher analytical sensitivity. It detected genomic DNA at concentrations as low as 0.25 pg μL−1 (equivalent to 0.005 ng per 20 μL reaction). The LOD95 was approximately 61.5 pg μL−1. In contrast, the COB assay detected genomic DNA down to 0.5 pg μL−1 (0.01 ng per 20 μL reaction). Its LOD95 was approximately 464.5 pg μL−1. These results indicate that the COX3 assay was approximately 7.5-fold more sensitive than the COB assay (Figure 3).
The COX3 assay exhibited strong specificity, as indicated by a single melting peak at 78.5 °C, along with high amplification efficiency and reproducibility. Its amplification efficiency fell within the desirable range of 90% - 110% [44], indicating optimal assay performance. In contrast, the COB assay exhibited suboptimal amplification efficiency. This is likely due to local secondary structures within the 139-bp target region rather than template quality, as the same DNA templates yielded high efficiency with the COX3 assay. DNA secondary structure prediction using MFold (http://www.unafold.org/mfold/applications/dna-folding-form.php) revealed 2 hairpin structures overlapping the forward primer binding site. An additional hairpin was located immediately adjacent to this region (see Supplementary Figure S4). Although these structures are relatively weak, they may transiently hinder primer annealing or impede DNA polymerase progression during amplification, thereby reducing reaction efficiency. This observation is consistent with previous reports showing that hairpin structures within or near primer-binding regions can inhibit primer–template hybridization, resulting in reduced amplification efficiency [45]. These structural features likely contributed to the reduced sensitivity observed for the COB assay.
In addition to mechanistic factors influencing amplification efficiency, the analytical sensitivity of the assay was compared with previously published qPCR systems. The assay developed in this study exhibited lower sensitivity than some earlier reports. For example, hydrolysis probe-based triplex real-time PCR assays targeting the translation elongation factor 1-alpha or β-tubulin regions have achieved detection limits as low as 10 fg of genomic DNA for Botryosphaeriaceae species causing canker diseases in woody crops [46], whereas SYBR Green–based qPCR assays targeting β-tubulin have reported detection limits of approximately 100 fg of pure fungal DNA for Septoria pistaciarum, the causal agent of pistachio leaf spot [47].
Despite its comparatively lower analytical sensitivity, the assay developed in this study was not intended for ultra-sensitive early detection in field samples or for quarantine surveillance. Instead, it was designed for use in controlled experimental conditions, such as studies of host-pathogen interactions, disease progression, and cultivar resistance. Under these conditions, the assay showed high specificity, good reproducibility, and reliable quantitative performance. Therefore, it is well suited for detecting and quantifying E. rostratum in inoculated plant tissues where sufficient pathogen biomass is present, and provides a practical and cost-effective tool for experimental plant pathology research.
Table 3 Summary of amplification performance metrics for the real-time PCR assays.
Primer/isolate code |
Equation1 |
Coefficient of determination (R²) |
Per-cycle amplification factor (E)2 |
Percentage of amplification efficiency (% E)3 |
COX3 primer pair (COX3-F1/COX3-R1) |
||||
ER-PTE2-1 |
|
|
|
|
rep 1 |
y = −3.1219x + 32.419 |
0.9921 |
2.09 |
109.08 |
rep 2 |
y = −3.2064x + 32.782 |
0.9836 |
2.05 |
105.06 |
ER-PTE33-1 |
|
|
|
|
rep 1 |
y = −3.1514x + 27.600 |
0.9710 |
2.08 |
107.64 |
rep 2 |
y = −3.368x + 28.024 |
0.9705 |
1.99 |
99.38 |
ER-BKK11-3 |
|
|
|
|
rep 1 |
y = −3.4572x + 29.866 |
0.9788 |
1.95 |
94.65 |
rep 2 |
y = −3.1589x + 28.058 |
0.9653 |
2.07 |
107.28 |
COB primer pair (COB-F1/COB-R1) |
||||
ER-PTE2-1 |
|
|
|
|
rep 1 |
y = −4.7422x + 38.998 |
0.9651 |
1.63 |
62.51 |
rep 2 |
y = −4.0964x + 41.431 |
0.9844 |
1.75 |
75.44 |
ER-PTE33-1 |
|
|
|
|
rep 1 |
y = −4.7992x + 31.064 |
0.9929 |
1.62 |
61.57 |
rep 2 |
y = −4.3141x + 30.582 |
0.9841 |
1.71 |
70.53 |
ER-BKK11-3 |
|
|
|
|
rep 1 |
y = −4.9626x + 30.865 |
0.9409 |
1.59 |
59.04 |
rep 2 |
y = −4.2492x + 36.466 |
0.9421 |
1.72 |
71.92 |
Note: That results are based on 2 biological replicates, designated as Rep 1 and Rep 2. In addition, amplification curves of each assay for representative isolates are shown in Supplementary Figure S3.
1Standard curves were generated by plotting the mean quantification cycle (Cq) values (from at least 2 from 3 technical replicates) obtained from a series of stepwise DNA dilutions (100, 50, 25, 10, 5, and 1 ng) of genomic DNA against the logarithm of DNA concentration, from which the linear equation (slope and intercept) and coefficient of determination (R²) were derived.
2per-cycle amplification factor was calculate as E = 10(-1/slope).
3amplification efficiency (%E) was calculate as (E – 1) × 100.
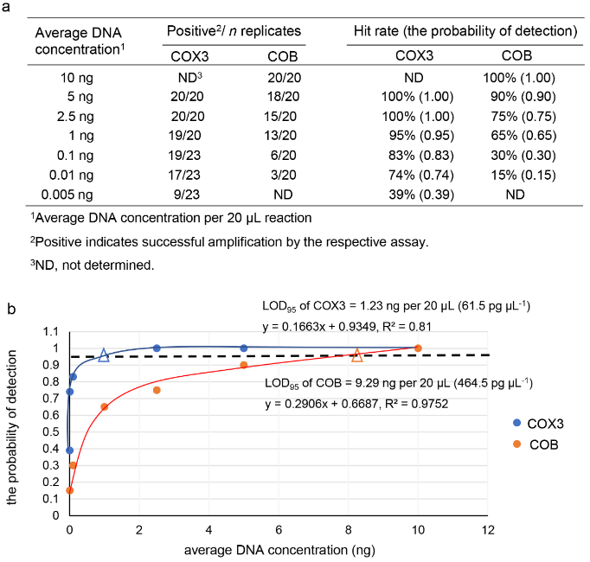
Figure 3 Sensitivity assessment of COX3 and COB real-time PCR assays represented through LOD95. (a) Detection results obtained from serial dilutions of Exserohilum rostratum genomic DNA from at least 20 replicate reactions per DNA level and used for probability-of-detection analysis. (b) Logistic regression analysis describing the relationship between DNA concentration and detection probability; the estimated DNA concentration associated with a 95% likelihood of successful amplification, LOD95 is represented by open triangle symbols positioned on the horizontal dotted reference line.
Detection and quantification of Exserohilum rostratum growth on rice using real-time PCR
We evaluated the specificity of primer pairs targeting the rice EF1α and Ub regions. These primer pairs successfully amplified the target sequences from the genomic DNA of the tested rice cultivars, KDML105 and JHN, with high amplification efficiency (99.21% - 100.47%). No amplification was observed from the genomic DNA of E. rostratum (Supplementary Figure S5). The applicability of the assay for detecting and quantifying E. rostratum in plant tissues was evaluated using the susceptible rice cultivar KDML105 exhibiting varying levels of disease severity. A strong positive correlation (r = 0.7220 - 0.7721) was observed between relative E. rostratum biomass and the percentage of leaf area affected. This relationship was determined by normalizing fungal DNA (COX3 or COB) against rice reference DNA (EF1α or Ub) (Supplementary Figure S6). These results demonstrate the effectiveness of the assay for both detection and quantitative assessment of E. rostratum. The observed correlations serve to validate assay performance rather than to indicate causal biological relationships.
The assay was further applied to quantify E. rostratum in leaf tissues of the susceptible cultivar KDML105 and the resistant cultivar JHN at multiple time points following inoculation. The real-time PCR detected the initial spore inoculum on the rice leaf surface at 0 h post inoculation. From 24 h post inoculation onwards, relative fungal growth in KDML105 was significantly higher than that in JHN. This indicates that JHN exhibits greater resistance to E. rostratum (Figure 4). To further validate the quantitative accuracy of the assay, correlations between relative E. rostratum biomass and the percentage of leaf area affected were analyzed across all samples. A very strong positive correlation (r > 0.900) was observed (Figure 5). This supports the reliability of the assay for quantitative disease assessment. Importantly, these correlations are used to validate the quantitative performance of the assay and its ability to reflect disease severity, rather than to infer causal relationships between fungal biomass and symptom development.
The real-time PCR assays developed in this study target the mitochondrial COX3 and COB regions. They provide effective tools for quantifying E. rostratum biomass in infected rice tissues. Based on its superior amplification efficiency, sensitivity, and specificity, the COX3 assay was identified as the primary assay for reliable detection and quantification. It demonstrated strong quantitative performance, with high correlation between fungal biomass and disease severity. It also enabled effective monitoring of fungal colonization dynamics without the need for external standard curves. Although the COB assay exhibited lower amplification efficiency and sensitivity, it showed consistent amplification patterns across samples and reflected the biological trend of fungal colonization. Therefore, the COB assay is best considered a supporting or confirmatory assay rather than a primary quantitative tool. Its inclusion provides independent validation of fungal biomass trends, thereby increasing confidence in the results obtained from the COX3 assay.
In this study, the rice EF1α and Ub were employed as internal reference targets for normalization, as these primer pairs have been widely validated and successfully applied for quantification in rice tissues [32,33]. Both reference targets exhibited high amplification efficiency and stable performance in our assays. Their use enables correction for experimental noise and sample-to-sample variation. This enhances the accuracy, reliability, and reproducibility of real-time PCR quantification [31,48]. Furthermore, an efficiency-corrected quantification approach helps reduce bias caused by differences in amplification efficiency between target and reference genes. This approach is recommended to ensure quantitative accuracy and biologically meaningful interpretation of real-time PCR data [35].
Notably, the COX3-based assay exhibited amplification efficiencies that were highly comparable to those of both rice reference primer sets designed from EF1α and Ub regions. This indicates minimal efficiency bias between target and reference reactions. Under such conditions, relative fungal biomass can be reliably estimated using the simplified equation 2Cq(rice reference) – Cq(fungal reference), without the need for additional efficiency correction. Therefore, for routine assessment of E. rostratum growth in rice tissues, the COX3 assay offers a robust and practical option with reduced analytical complexity. In contrast, the COB assay is more appropriately applied using an efficiency-corrected ΔCq approach and serves as a secondary reference for validation purposes.
One limitation of this study is that the developed dye-based real-time PCR assay (EvaGreen) was not directly compared with probe-based qPCR approaches, such as TaqMan assays. These approaches may offer higher analytical sensitivity and specificity. Future studies incorporating such comparisons would further strengthen confidence in the assay. Overall, the COX3 assay serves as the primary and most reliable tool for quantitative detection, while the COB assay provides supporting validation. Together, they offer a robust and flexible framework for studying rice–E. rostratum interactions.
Conclusions
The EvaGreen-based real-time PCR assays developed in this study provide a specific, reproducible, and cost-effective tool for quantifying E. rostratum in rice tissues. They can be effectively applied for molecular diagnosis of E. rostratum leaf spot, evaluation of disease severity, and analysis of host responses across different rice cultivars. Furthermore, these assays offer a robust approach for investigating pathogen dynamics and host–pathogen interactions, particularly as E. rostratum represents a promising model fungus for studying rice–pathogen relationships under elevated temperature conditions.
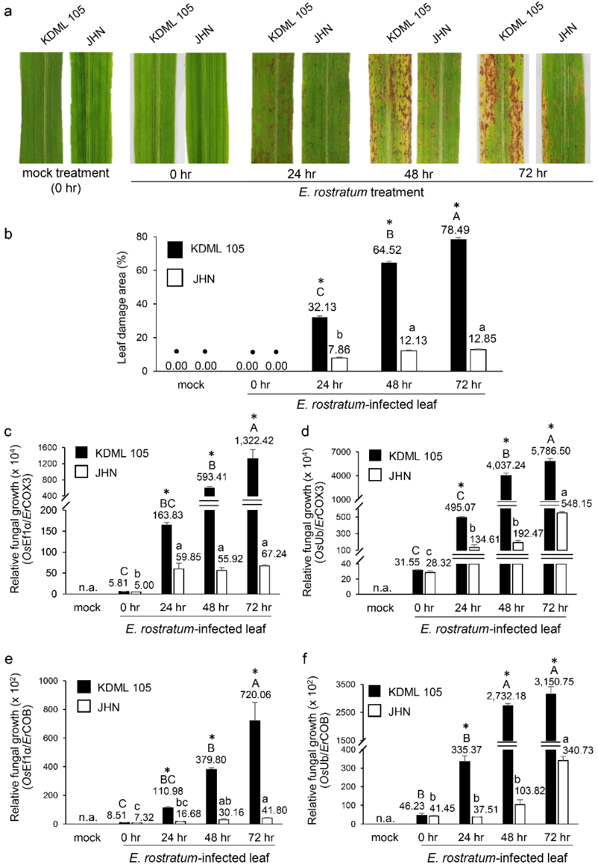
Figure 4 Quantification of Exserohilum rostratum growth in rice leaf tissues. (a) Leaves of KDML105 and JHN cultivars showing progressive leaf spot symptoms following inoculation with E. rostratum isolate ER-PTE33-1 at 0, 24, 48, and 72 h post-inoculation. Mock treatment refers to leaves treated with sterile water. (b) Percentage of leaf area affected at each time point in both cultivars. Data are presented as mean ± SD from 3 biological replicates (n = 3 leaves from independent plants per time point and cultivar). Data points marked with a dot symbol (•) indicate samples excluded from statistical analysis. Relative fungal DNA levels were determined by real-time PCR using (c) COX3-F1/COX3-R1 normalized to rice EF1α, (d) COX3-F1/COX3-R1 normalized to rice Ub, (e) COB-F1/COB-R1 normalized to rice EF1α, and (f) COB-F1/COB-R1 normalized to rice Ub. For each time point and cultivar, 3 biological replicates (n = 3) were analyzed, each with 3 technical replicates (qPCR reactions), which were averaged prior to statistical analysis. Data are presented as mean ± SE. Identical capital and lowercase letters indicate no significant differences across time points within KDML105 and JHN, respectively, according to ANOVA followed by Tukey’s test (p = 0.05). Asterisks (*) indicate significant differences between cultivars based on Student’s t-test (p = 0.05). Values above each bar represent the relative fungal growth (ratio of E. rostratum reference DNA to rice reference DNA).
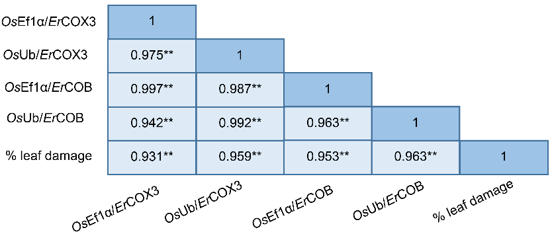
Figure 5 Multiple correlation matrix showing relationships between relative fungal growth determined using different combinations of Exserohilum rostratum primer pairs (COX3-F1/COX3-R1 or COB-F1/COB-R1) and rice reference primer pairs targeting the EF1α and Ub DNA regions (Ef1α-F/Ef1α-R and OsUG-F/OsUG-R, respectively), and the percentage of leaf area affected in KDML105 and JHN by E. rostratum isolate ER-PTE33-1. Correlation coefficients (r) represent Pearson’s correlation values, indicating the strength and direction of the linear relationship between each pair of variables, with values close to 1.0 indicating a strong positive correlation. Asterisks (**) indicate statistically significant correlations at p < 0.01. Correlation analysis was performed using biological replicate data pooled across all time points and both cultivars (n = 24). Technical replicates were averaged prior to analysis.
Acknowledgements
This project is supported by grants from the Coordinating Center for Thai Government Science and Technology Scholarship Students (CSTS), National Science and Technology Development Agency (NSTDA). The authors thank the Rice Science Center, Kasetsart University, Kamphaeng Saen Campus, Nakhon Pathom 73140, Thailand for providing healthy JHN seeds. In addition, the authors thank the Department of Agriculture, Thailand, and Dr. Tida Dethoup (Natural Products for Plant Protection Laboratory, Department of Plant Pathology, Kasetsart University, Bangkok 10900, Thailand) for providing Rhizoctonia solani strains.
Declaration of Generative AI in Scientific Writing
During the preparation of this manuscript, the authors used GPT-5.2 solely for language editing and assistance with scientific writing. All content was subsequently reviewed and critically revised by the authors, who take full responsibility for the scientific accuracy, originality, and integrity of the work. The use of AI was limited to writing support and did not involve data generation, data analysis, or interpretation; all experimental design, data acquisition, analysis, and conclusions were performed exclusively by the research team.
CRediT Author Statement
Yatavee Boonkorn: Investigation; Formal analysis; Validation; Visualization; Writing original draft. Veeranee Tongsri: Investigation (morphological and molecular confirmation of the fungal strains used in the study). Patcharavipa Chaijuckam: Writing - Review & Editing. Pattavipha Songkumarn: Conceptualization; Methodology; Writing - Review & Editing; Supervision; Project administration; Funding acquisition.
References
[1] Office of Agricultural Economics, Available at: https://oae.go.th/uploads/files/2025/08/07/853f981624250b80.pdf, accessed September 2025.
[2] S Raghu, MS Baite, NB Patil, P Sanghamitra, MK Yadav, SR Prabhukarthikeyan, U Keerthana, GG Pandi, S Aravindan and PC Rath. Grain discoloration in popular rice varieties (Oryza sativa L) in eastern India, associated mycoflora, quality losses and management using selected biocontrol agents. Journal of Stored Products Research 2020; 88, 101682.
[3] M Hernández-Restrepo, H Madrid, YP Tan, KC da Cunha, J Gené, J Guarro and PW Crous. Multi-locus phylogeny and taxonomy of Exserohilum. Persoonia - Molecular Phylogeny and Evolution of Fungi 2018; 41, 71-108.
[4] KH Kaboré, D Diagne, J Milazzo, H Adreit, MH Lebrun and D Tharreau. First report of rice brown spot caused by Exserohilum rostratum in Mali. Plant Disease 2022; 106(6), 1747.
[5] SK Aggarwal, MA Ahangar, A Singh, M Gupta, SI Harlapur, VS Shinde, N Mallikarjuna, H Kaur, P Kumar, R Kaur, P Goyal and HS Jat. First report of Exserohilum rostratum causing leaf blight on maize (Zea mays) in India. Plant Disease 2025; 109(11), 2435.
[6] T Korra, S Navathe, S Biradar and R Chand. Pathogenicity and infection behaviour of Exserohilum rostratum on wheat and associated collateral hosts. Journal of Plant Pathology 2023; 105, 695-709.
[7] J Li, S Zhou, X Huang and W Shen. First report of leaf spot disease on sugarcane caused by Exserohilum rostratum in China. Plant Disease 2026; 110(4), 1474.
[8] XD Sun, QQ Pang, FH Gao, W Zhang, XL Cai and M Zhou. First report of leaf spot on cherry tomatoes caused by Exserohilum rostratum in Hainan Province, China. Plant Disease 2023; 107(9), 2842.
[9] Y Boonkorn, V Tongsri, O Piasai and P Songkumarn. Characterization, pathogenicity and fungicide response of Exserohilum rostratum causing leaf spot on rice in Thailand. European Journal of Plant Pathology 2024; 170, 549-566.
[10] K He, C Zhao, M Zhang, J Li, Q Zhang, X Wu, S Wei, Y Wang, X Chen and C Li. The Chromosome-scale genomes of Exserohilum rostratum and Bipolaris zeicola pathogenic fungi causing rice spikelet rot disease. Journal of Fungi 2023; 9(2), 177.
[11] R Cardona and MS González. First report of Exserohilum rostratum associated with rice seed in Venezuela. Plant Disease 2007; 91(2), 226.
[12] FJA Silva, SLP Maich, PR Meneses, C Bellé, DR de Barros and CRJ Farias. First report on Exserohilum rostratum pathogenicity causing brown spot to rice in Brazil. Plant Disease 2016; 100(12), 2531.
[13] RA Majeed, AA Shahid, GA Liaqat, K Saleem, M Asif, M Shafiq, MS Haider and M Noreen. First report of Setosphaeria rostrata causing brown leaf spot of rice in Pakistan. Plant Disease 2016; 100(10), 2162.
[14] KH Kaboré, AI Kassankogno, H Adreit, J Milazzo, S Guillou, L Blondin, L Chopin, S Ravel, F Charriat, M Barro, C Tollenaere, MH Lebrun and D Tharreau. Genetic diversity and structure of Bipolaris oryzae and Exserohilum rostratum populations causing brown spot of rice in Burkina Faso based on genotyping-by-sequencing. Frontiers in Plant Science 2022; 13, 1022348.
[15] MFA Khan, A Riaz, R Ahsan, I Ahmad, S Ullah, A Raza and M Zakria. Genetic variability among isolates of Curvularia lunata and Exserohilum rostratum causing brown leaf spot of rice from Pakistan. Current Microbiology 2025; 82, 436.
[16] JGA Barbedo. A review on the main challenges in automatic plant disease identification based on visible range images. Biosystems Engineering 2016; 144, 52-60.
[17] TM Matsunaga, D Ogawa, F Taguchi-Shiobara, M Ishimoto, S Matsunaga and Y Habu. Direct quantitative evaluation of disease symptoms on living plant leaves growing under natural light. Breeding Science 2017; 67(3), 316-319.
[18] MS Mirmajlessi, E Loit, M Mand and SM Mansouripour. Real-time PCR applied to study on plant pathogens: Potential applications in diagnosis - a review. Plant Protection Science 2015; 51(4), 177-190.
[19] CJ Smith and AM Osborn. Advantages and limitations of quantitative PCR (Q-PCR)-based approaches in microbial ecology. FEMS Microbiology Ecology 2009; 67(1), 6-20.
[20] Y Zhang, Z Wei, J Zhang, C Chen and F Liu. Application of PCR and PCR-derived technologies for the detection of pathogens infecting crops. Physiological and Molecular Plant Pathology 2025; 136, 102589.
[21] S Kumar, PL Kashyap, S Mahapatra, P Jasrotia and GP Singh. New and emerging technologies for detecting Magnaporthe oryzae causing blast disease in crop plants. Crop Protection 2021; 143, 105473.
[22] YH Lin, SM Shen, CJ Wen, YJ Lin, TD Chang and SC Chu. Molecular detection assays for rapid field-detection of rice sheath blight. Frontiers in Plant Science 2021; 11, 552916.
[23] K Singh, S Sharma, A Tyagi, S Gupta, BM Bashyal, MS Gurjar, MS Saharan, M Choudhary and R Aggarwal. Development, validation and utility of conventional and real-time PCR based marker for the detection of Bipolaris oryzae causing brown spot disease of rice. Australasian Plant Pathology 2025; 54, 101-110.
[24] GM Gauthier and NP Keller. Crossover fungal pathogens: The biology and pathogenesis of fungi capable of crossing kingdoms to infect plants and humans. Fungal Genetics and Biology 2013; 61, 146-157.
[25] L Gadea, DE Grgurichb, TM Kerkeringb, ME Brandta and AP Litvintseva. Utility of real-time PCR for detection of Exserohilum rostratum in body and tissue fluids during the multistate outbreak of fungal meningitis and otheri infections. Journal of Clinical Microbiology 2015; 53(2), 618-625.
[26] Y Zhao, R Petraitiene, TJ Walsh and DS Perlin. A real-time PCR assay for rapid detection and quantification of Exserohilum rostratum, a causative pathogen of fungal meningitis associated with injection of contaminated methylprednisolone. Journal of Clinical Microbiology 2013; 51(3), 1034-1036.
[27] P Chaijuckam, P Songkumarn and JJG Guerrero. Genetic diversity and aggressiveness of Bipolaris oryzae in North-Central Thailand. Applied Science and Engineering Progress 2019; 12(2), 116-125.
[28] Y Boonkorn, V Tongsri and P Songkumarn. Response of some rice varieties against the fungus, Exserohilum rostratum, causing leaf spot disease on rice and expression of plant hormone responsive genes in rice during infection. Thai Agricultural Research Journal 2024; 42(3), 257-271.
[29] JJ Doyle and JL Doyle. A rapid DNA isolation procedure for small quantities of fresh leaf tissue. Phytochemical Bulletin 1987, 19(1), 11-15.
[30] KA Seifert, RA Samson, JR deWaard, J Houbraken, CA Lévesque, JM Moncalvo, G Louis-Seize and PDN Hebert. Prospects for fungus identification using CO1 DNA barcodes, with Penicillium as a test case. PNAS 2007; 104(10), 3901-3906.
[31] SA Bustin, V Benes, JA Garson, J Hellemans, J Huggett, M Kubista, R Mueller, T Nolan, MW Pfaffl, GL Shipley, J Vandesompele and CT Wittwer. The MIQE guidelines: Minimum information for publication of quantitative real-time PCR experiments. Clinical Chemistry 2009; 55(4), 611-622.
[32] C Caldana, WR Scheible, B Mueller-Roeber and S Ruzicic. A quantitative RT-PCR platform for high-throughput expression profiling of 2500 rice transcription factors. Plant Methods 2007; 3, 7.
[33] CH Park, S Chen, G Shirsekar, B Zhou, CH Khang, P Songkumarn, AJ Afzal, Y Ning, R Wang, M Bellizzi, B Valent and GL Wang. The Magnaporthe oryzae effector AvrPiz-t targets the RING E3 ubiquitin ligase APIP6 to suppress pathogen-associated molecular pattern-triggered immunity in rice. The Plant Cell 2012; 24, 4748-4762.
[34] MW Pfaffl. A new mathematical model for relative quantification in real-time RT-PCR. Nucleic Acids Research 2001; 29(9), 45.
[35] JM Ruijter, RJ Barnewall, IB Marsh, AN Szentirmay, JC Quinn, RV Houdt, QD Gunst and MJBVD Hoff. Efficiency correction is required for accurate quantitative PCR analysis and reporting. Clinical Chemistry 2021; 67(6), 829-842.
[36] The R Foundation. The R Project for Statistical Computing. The R Foundation, Vienna, Austria, 2019.
[37] PLC Fonseca, RB De-Paula, DS Araújo, LMR Tomé, T Mendes-Pereira, WFC Rodrigues, LE Del-Bem, ERGR Aguiar and A Góes-Neto. Global characterization of fungal mitogenomes: New insights on genomic diversity and dynamism of coding genes and accessory elements. Frontiers in Microbiology 2021; 12, 787283.
[38] J Wyrębek, T Molcan, K Myszczyński, ADV Diepeningen, AA Stakheev, M Żelechowski, K Bilska and T Kulik. Uncovering diagnostic value of mitogenome for identification of cryptic species Fusarium graminearum Sensu Stricto. Frontiers in Microbiology 2021; 12, 714651.
[39] XJ Min and DA Hickey. Assessing the effect of varying sequence length on DNA barcoding of fungi. Molecular Ecology Notes 2007; 7(3), 365-373.
[40] L Wang, K Yokoyama, M Miyaji and K Nishimura. Mitochondrial cytochrome b gene analysis of Aspergillus fumigatus and related species. Journal of Clinical Microbiology 2000; 38(4), 1352-1358.
[41] JO Lima, JF Pereira, J Rincones, JG Barau, EF Araújo, GAG Pereira and MV Queiroz. The glyceraldehyde-3-phosphate dehydrogenase gene of Moniliophthora perniciosa, the causal agent of witchesʼ broom disease of Theobroma cacao. Genetics and Molecular Biology 2009; 32(2), 362-366.
[42] K Voigt and J Wöstemeyer. Reliable amplification of actin genes facilitates deep-level phylogeny. Microbiological Research 2000; 155(3), 179-195.
[43] E Navarro, G Serrano-Heras, MJ Castaño and J Solera. Real-time PCR detection chemistry. Clinica Chimica Acta 2015; 439, 231-250.
[44] D de Gonzalo-Calvo, M Marchese, J Hellemans, F Betsou, NLS Frisk, LT Dalgaard, P Lakkisto, C Foy, A Scherer, MLG Bermejo and Y Devaux. Consensus guidelines for the validation of qRT-PCR assays in clinical research by the CardioRNA consortium. Molecular Therapy Methods & Clinical Development 2022; 24, 171-180.
[45] H Fan, J Wang, M Komiyama and X Liang. Effects of secondary structures of DNA templates on the quantification of qPCR. Journal of Biomolecular Structure and Dynamics 2019; 37(11), 2867-2874.
[46] L Romero-Cuadrado, A Aguado, D Ruano-Rosa and N Capote. Triplex real-time qPCR for the simultaneous detection of Botryosphaeriaceae species in woody crops and environmental samples. Frontiers in Plant Science 2024; 15, 1435462.
[47] MI Drais, G Gusella, A Mazzaglia and G Polizzi. A quantitative PCR assay for the detection and quantification of Septoria pistaciarum, the causal agent of pistachio leaf spot in Italy. PLoS One 2023; 18(5), 0286130.
[48] S Guénin, M Mauriat, J Pelloux, O Wuytswinkel, C Bellini and L Gutierrez. Normalization of qRT-PCR data: The necessity of adopting a systematic, experimental conditions-specific, validation of references. Journal of Experimental Botany 2009; 60(2), 487-493.
Supplementary Material
Table S1 Quantification cycle (Cq) values and melting temperature (Tm) determined by EvaGreen-based real-time PCR assays using 2 Exserohilum rostratum-specific primer pairs (COX3-F1/COX3-R1 and COB-F1/COB-R1) and 2 rice-specific primer pairs (Ef1α-F/Ef1α-R and OsUG-F/OsUG-R) against approximately 50 ng of genomic DNA from rice-associated fungi and from 2 rice cultivars (KDML105 and JHN).
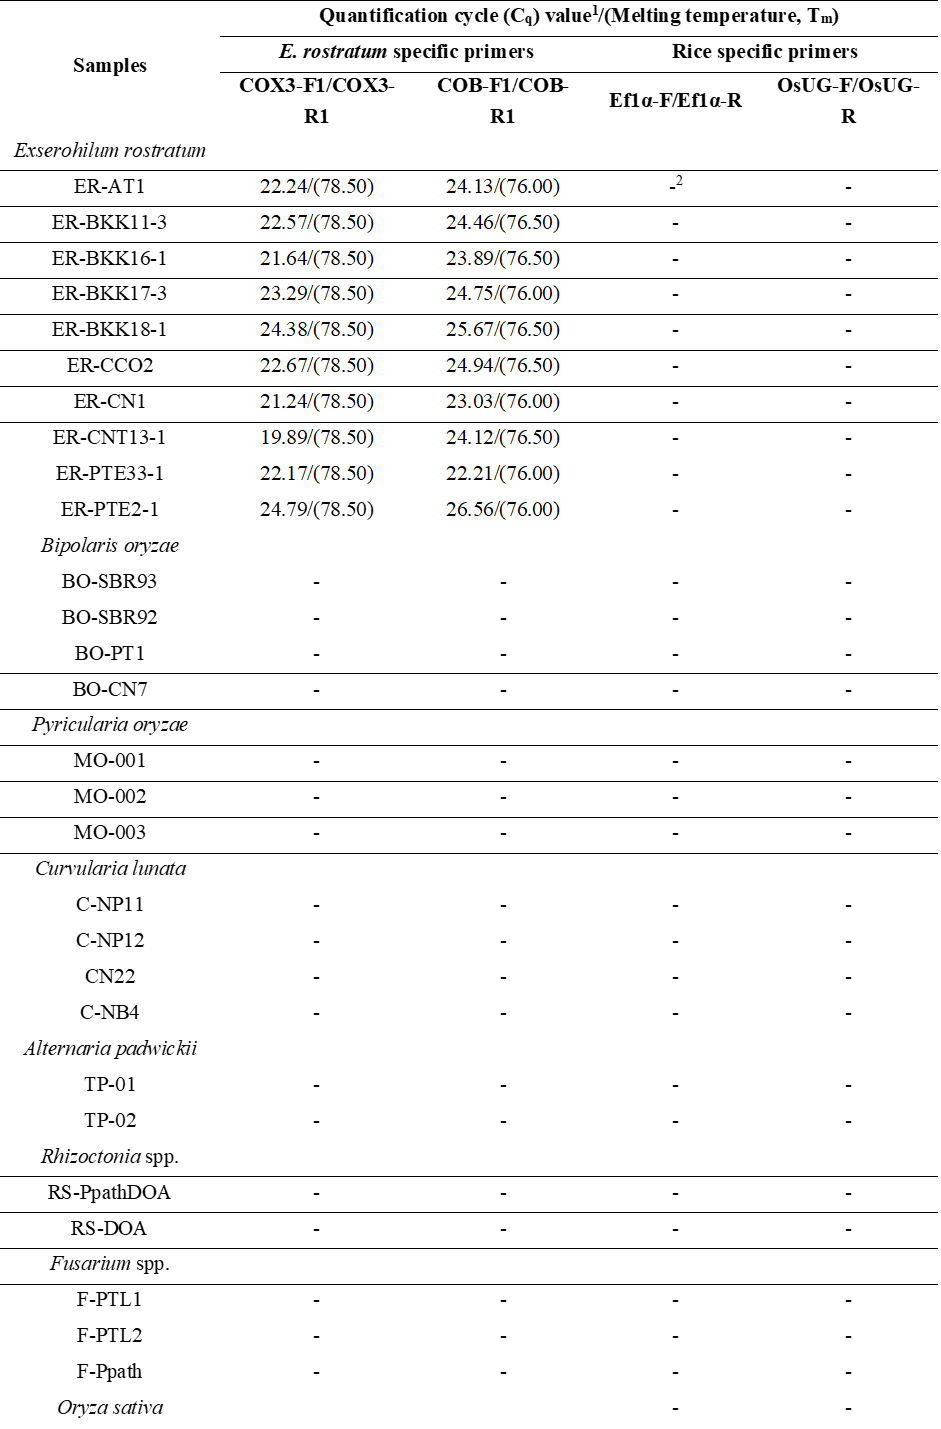
1Cq
value
represents as the average Cq
value of 3 technical replicates.
2(-) indicates that no Cq value was obtained in the assay.
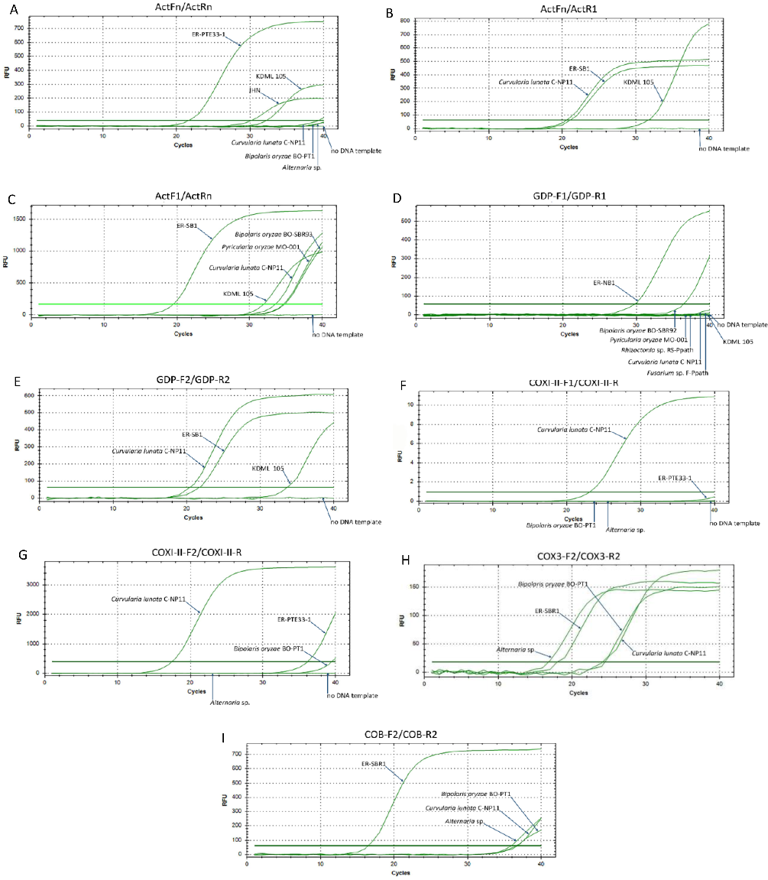
Figure S1 Non-specific amplification of candidate primer pairs in EvaGreen-based real-time PCR assays, showing cross-amplification with non-target fungi and rice, indicating lack of specificity for Exserohilum rostratum.
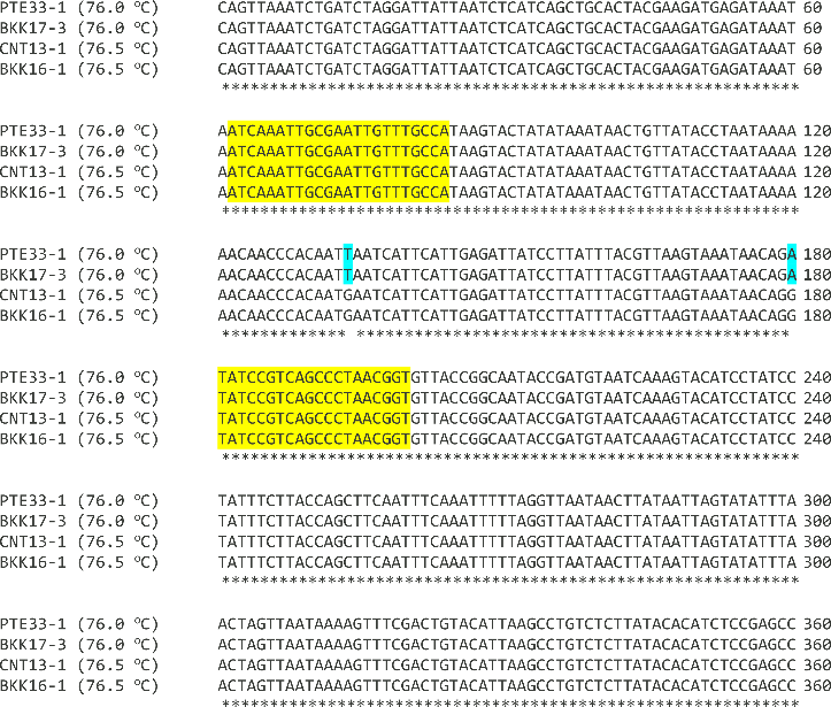
Figure S2 Multiple nucleotide sequence alignment of the COB region from Exserohilum rostratum isolates amplified by conventional PCR, highlighting SNPs underlying distinct melting peaks detected with the COB-F1/COB-R1 primer pair. Single nucleotide polymorphisms (SNPs) are marked in blue. Asterisks indicate conserved nucleotides across the sequences analyzed.
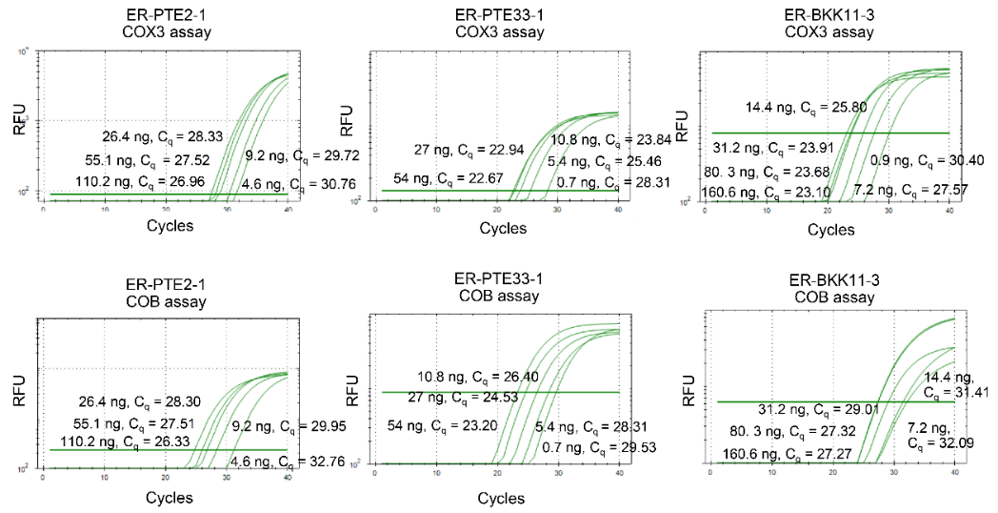
Figure S3 Amplification curves of COX3 and COB real-time PCR assays for representative Exserohilum rostratum isolates ER-PTE2-1, ER-PTE33-1, and ER-BKK11-3.
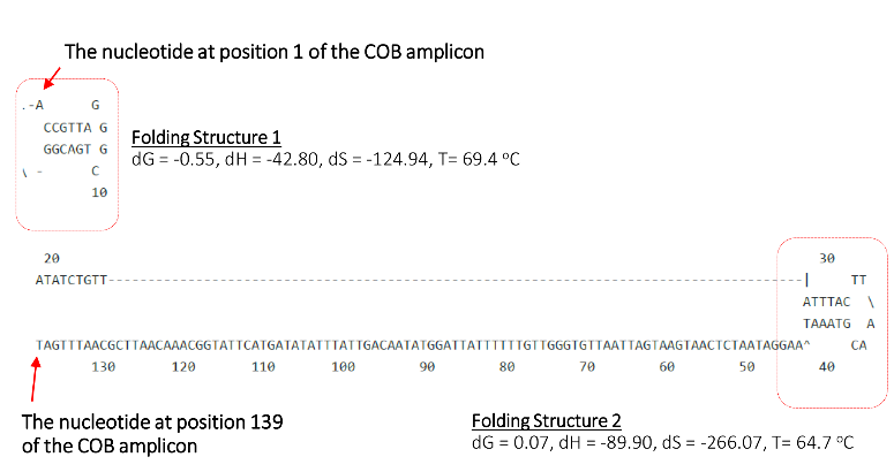
Figure S4 Predicted DNA secondary structure of the COB target region generated using MFold (http://www.unafold.org/mfold/applications/dna-folding-form.php). The folding model reveals 2 hairpin structures overlapping the forward primer binding site, as well as an additional hairpin located immediately adjacent to this region. These predicted secondary structures may interfere with primer annealing and contribute to the reduced amplification efficiency observed for the COB-based assay.
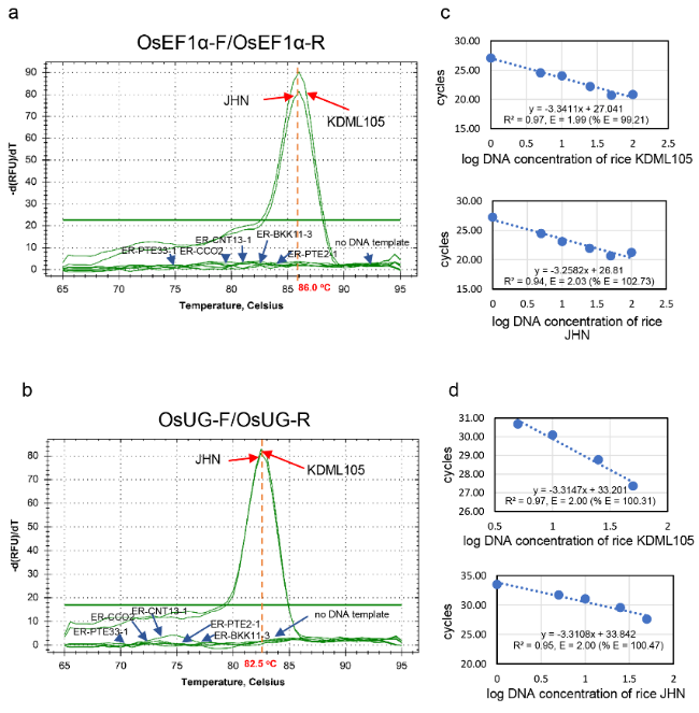
Figure S5 Melting peak analysis and standard curves demonstrating amplification efficiency of EF1α-F/R and OsUG-F/R primer pairs in EvaGreen-based real-time PCR using rice genomic DNA.
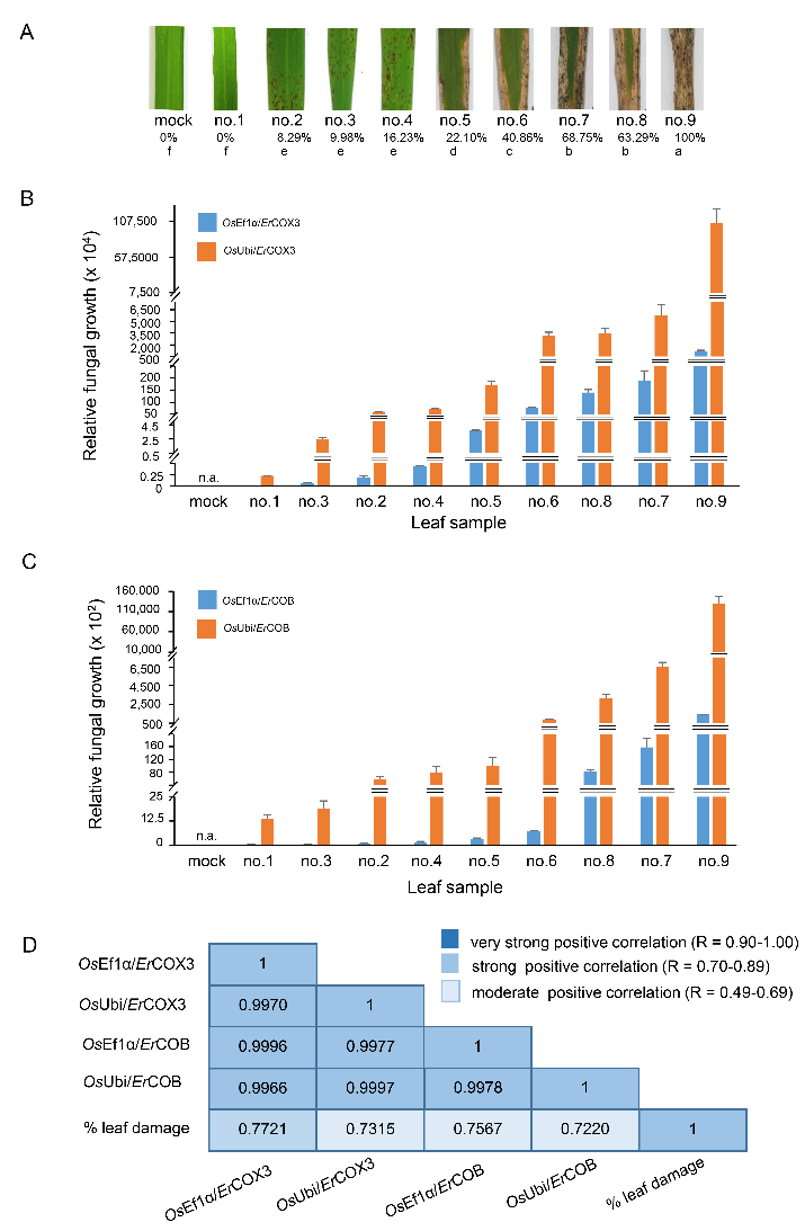
Figure S6 Quantification of Exserohilum rostratum growth in rice KDML105 leaves. (A) Representative KDML105 leaves showing leaf spot symptoms at different time points after inoculation with E. rostratum isolate ER-PTE33-1; mock-treated leaves were sprayed with sterile water. The percentage of leaf area affected is indicated in parentheses. (B) Relative fungal biomass quantified using COX3-F1/COX3-R1 normalized to rice EF1α or Ub. (C) Relative fungal biomass quantified using COB-F1/COB-R1 normalized to rice EF1α or Ub. (D) Pearson correlation matrix showing relationships among fungal biomass estimates obtained using different E. rostratum primer pairs, rice reference regions, and percentage of leaf area affected in KDML105.