
Trends
Sci.
2026;
23(10):
13493
Chemometric Evaluation, and LC-MS/MS-Based Phytochemical Identification: Elephant Ginger (Zingiber officinale Roscoe) Ethanolic Extract
Rika Hartati, Flaviana Selina, Atina Rizkiya Choirunnisa*,
Hegar Pramastya and Irda Fidrianny
Department of Pharmaceutical Biology, School of Pharmacy, Bandung Institute of Technology, Jawa Barat, Indonesia
(*Corresponding author’s e-mail: [email protected])
Received: 28 January 2026, Revised: 2 April 2026, Accepted: 9 April 2026, Published: 25 May 2026
Abstract
This study investigated the effects of solvent concentration and extraction technique on the antioxidant properties and phytochemical profile of elephant ginger (Zingiber officinale Roscoe). Extracts were prepared using maceration and reflux with 70% and 96% ethanol, and their total phenolic content (TPC), total flavonoid content (TFC), and antioxidant activities were evaluated using 2,2-diphenyl-1-hydrazyl (DPPH) radical scavenging assay, ferric reducing antioxidant power (FRAP), cupric ion reducing antioxidant capacity (CUPRAC), β-carotene bleaching (BCB), and phosphomolybdenum (PM) assays. Extracts obtained with 96% ethanol exhibited the highest TPC, TFC, and antioxidant capacities, indicating that less aqueous solvents more effectively extract medium-polar constituents. Correlation analysis showed strong associations between phenolic levels and redox-based assays, supported by thin layer chromatogram (TLC) visualization of phenolic and antioxidant-responsive bands. Liquid chromatography-mass spectrometry/mass spectrometry (LC-MS/MS) profiling identified several bioactive metabolites, including ferulic acid, α-linolenic acid, oleamide, and glyceride derivatives. High performance liquid chromatography (HPLC) analysis confirmed ferulic acid as a key phenolic marker in the optimized maceration extract. These findings demonstrated that high-ethanol concentration enhances the recovery of antioxidant-active compounds in elephant ginger.
Keywords: Elephant ginger, Ethanol extraction, Phenolics, Antioxidant activity, LC-MS/MS, HPLC
Introduction
Ginger (Zingiber officinale Roscoe) is a widely used medicinal rhizome containing abundant phenolics such as gingerols and shogaols, which contribute to its antioxidant and anti-inflammatory effects [1]. These constituents help mitigate oxidative stress and neutralize free radicals linked to chronic diseases. Recent reports showed that the antioxidant properties of ginger extracts are influenced by both their phytochemical profiles and the extraction method and solvent used [2]. Optimizing extraction conditions is therefore important to maximize the recovery of antioxidant compounds.
Extraction methods such as maceration and reflux are commonly used in natural product research because they are simple, reproducible, and effective for isolating polar bioactive compounds [3]. Solvent polarity and
concentration strongly influence extraction efficiency by affecting the solubility and diffusion of phenolic and flavonoid constituents. Ethanol-water mixtures, especially those between 70% and 96%, are widely applied because they provide an appropriate polarity balance for extracting both polar and semi-polar compounds [4]. Previous studies have reported that maceration with variations in extraction duration, sample-to-solvent ratio, and ethanol concentration can significantly alter total phenolic content, total flavonoid content, and antioxidant activity as assessed by the 2,2-diphenyl-1-picrylhydrazyl (DPPH) radical scavenging assay, ferric reducing antioxidant power (FRAP) assay, and cupric ion reducing antioxidant capacity (CUPRAC) assay, and identified an optimized maceration condition with an extraction time of 40 min, a sample-to-solvent ratio of 1:3, and 96% ethanol [5]. In addition, several studies on elephant ginger have demonstrated that extraction techniques and solvent composition significantly influence the yield of phenolic compounds and antioxidant capacity, highlighting the importance of optimizing extraction parameters for this specific variety.
Using multiple antioxidant assays, including DPPH, FRAP, CUPRAC, β-carotene bleaching (BCB), and phosphomolybdenum (PM), provides a broader assessment of antioxidant capacity because each reflects a different reaction mechanism [6]. Previous studies have shown strong associations between TPC, TFC, and antioxidant activity, suggesting that phenolics are the primary contributors to free radical scavenging [7]. Ginger occurs in several cultivated forms, commonly classified as small white ginger, red ginger, and elephant ginger, which differ in rhizome morphology, pungency, and phytochemical composition. Among these varieties, elephant ginger is characterized by its larger rhizomes, higher biomass yield, and milder pungency, leading to its predominant use in food products and herbal formulations. Despite these advantages, studies focusing specifically on extraction optimization and antioxidant profiling of elephant ginger using multiple analytical approaches remain limited. However, only a few comparative investigations have examined how extraction method and solvent concentration jointly influence the antioxidant profile of elephant ginger (Z. officinale) when assessed through several validated assays. This study therefore evaluates the effects of maceration and reflux extraction using 70% and 96% ethanol on the antioxidant activity of elephant ginger rhizomes, supported by TPC and TFC measurements to identify the most effective extraction conditions.
Materials and methods
Materials
The principal reagents used in this study included acetic anhydride, aluminium chloride, ammonium molybdate, ascorbic acid, β-carotene, chloroform, copper (II) chloride, distilled water, ethanol, Folin–Ciocalteu reagent, gallic acid, hydrochloric acid, HPLC-grade methanol, iron (III) chloride, linoleic acid, methanol (analytical grade), neocuproine, quercetin, sodium acetate, sodium carbonate, sodium phosphate, sulfuric acid, Tween 20, and 2,2-diphenyl-1-picrylhydrazyl (DPPH); all obtained from Merck (Germany) or Sigma-Aldrich (USA). The UV-Visible spectrophotometer used was a Trace 1300 (Thermo Fisher Scientific, USA), while high-performance liquid chromatography (HPLC) analysis was conducted using a Shimadzu HPLC system (Shimadzu Corporation, Japan). The UV lamp was supplied by Camag (Muttenz, Switzerland), and microscopic observations were performed using an Olympus microscope (Japan). LC–MS/MS analysis was performed using a Thermo Scientific™ Vanquish™ UHPLC system coupled to a Q Exactive™ Orbitrap™ mass spectrometer (Thermo Fisher Scientific, USA). All chemicals were of analytical or HPLC grade.
Plant material and identification
The plant material was authenticated as Zingiber officinale Roscoe (Zingiberaceae) by the Herbarium Bandungense, School of Life Sciences and Technology, Bandung Institute of Technology, under identification letter No. 7562/IT1.C11.2/TA.00/2024. Only the rhizome was examined, with verification based on its key macroscopic traits, including a pale yellow to brown interior, pungent aroma, thick branched structure, and the presence of nodal rings and root scars. The sample was collected from Batang Regency, Central Java, Indonesia (GPS: −7.0390° S, 109.7191° E), and exclusively the rhizome portion was used for all subsequent analyses.
Preparation of crude drug
Fresh rhizomes of elephant ginger (Z. officinale) were thoroughly washed and air-dried, then sliced into small pieces using a mechanical chopper. The samples were subsequently oven-dried at 40 - 50 °C until a constant weight was achieved. The dried material was finely milled to obtain crude powdered rhizomes, which were then stored in tightly sealed containers under dry conditions.
Extraction
A total of 300 g of elephant ginger rhizome powder was extracted using maceration and reflux, each carried out in 3 cycles. Maceration was conducted for 24 h at room temperature, while reflux extraction was performed for 2 h per cycle. Ethanol concentrations of 70% and 96% were used with an approximate sample to solvent - ratio of 1:3. An additional optimized maceration extraction followed the procedure of [5], using 96% ethanol and 40 min maceration at a 1:3 ratio. All filtrates were concentrated under reduced pressure at 40 - 50 °C, then dried at 40 °C and stored in sealed amber containers. Extraction yield was determined from the mass of dried extract relative to the initial powder weight to compare the efficiency of each method and solvent system.
Total phenolic content (TPC)
The total phenolic content (TPC) of elephant ginger extracts was determined using the Folin-Ciocalteu colorimetric assay. Gallic acid solutions (60 - 130 μg/mL) were utilized to construct the calibration curve. For each analysis, 50 μL of extract was mixed with 400 μL of 1 M sodium carbonate and 500 μL of 10% Folin-Ciocalteu reagent, then allowed to react for 30 min in the dark at room temperature. Absorbance measurements were taken at 765 nm using a UV-Visible spectrophotometer. Methanol served as the blank solution, and a reagent control was also prepared under identical conditions in the absence of the sample. All measurements were carried out in 6 replicates, and TPC values were reported as gallic acid equivalents (GAE) per gram of extract based on the calibration curve [8].
Total flavonoid content (TFC)
The total flavonoid content (TFC) of elephant ginger extracts was determined using the aluminium chloride colorimetric assay, with quercetin employed as the reference standard. A calibration curve was generated from quercetin solutions at concentrations of 45 - 100 µg/mL. For the analysis, 100 µL of each standard or sample was mixed with methanol, 1 M sodium acetate, aluminium chloride, and distilled water, followed by incubation for 30 min at room temperature. Absorbance was measured at 415 nm using a UV-Visible spectrophotometer. Methanol was used as a blank, and a reagent control was prepared under the same conditions without the sample. All samples were analyzed in 6 replicates, and TFC was expressed as quercetin equivalent (QE) per gram of extract based on the calibration curve [9].
Antioxidative activity: 2,2-Diphenyl-1-picrylhydrazyl (DPPH) radical scavenging method
The antioxidant activity of the extracts was assessed through their capacity to neutralize DPPH free radicals using a modified established protocol [10]. Each extract (M70, R70, M96, R96, Opt) was diluted with methanol to obtain a total volume of 125 μL and combined with 750 μL of DPPH solution (50 μg/mL). The mixture was kept in the dark for 30 min at room temperature, after which absorbance was recorded at 517 nm using a UV-Visible spectrophotometer. Methanol functioned as the blank, and a control solution containing DPPH without sample was similarly prepared under identical conditions. Antioxidant activity was determined using an ascorbic acid calibration curve (2 - 5 μg/mL), which was prepared in triplicate for each concentration level. All samples were tested in 6 replicates, and the results were reported as milligrams of ascorbic acid equivalent antioxidant capacity (AEAC) per gram of extract.
Antioxidative activity: Cupric ion reducing antioxidant capacity (CUPRAC) method
The cupric ion reducing antioxidant capacity (CUPRAC) analysis was carried out based on a previously reported method [11]. The CUPRAC working solution was freshly prepared by combining CuCl₂, neocuproine, and ammonium acetate buffer (pH 7.0) in equal proportions. For each analysis, standard solutions and ginger extracts (M70, R70, M96, R96 and Opt) were adjusted with buffer to reach a total volume of 250 μL and then mixed with 750 μL of the CUPRAC reagent. The reaction mixtures were left to stand for 30 min at room temperature, after which absorbance was recorded at 450 nm using a UV-Visible spectrophotometer. A reagent blank was prepared by substituting the sample with buffer, and a control solution was processed under the same conditions. Antioxidant capacity was determined using an ascorbic acid calibration curve (4 - 7 μg/mL), with each concentration analyzed in triplicate. All samples were tested in 6 replicates, and the results were expressed as milligrams of ascorbic acid equivalent antioxidant capacity (AEAC) per gram of extract.
Antioxidative activity: Ferric reducing antioxidant power (FRAP) method
The ferric reducing antioxidant power (FRAP) assay was conducted following a previously reported method [11]. The FRAP working reagent was freshly prepared by mixing 0.02 M FeCl₃·6H₂O, 0.01 M TPTZ, and 0.04 M acetate buffer (pH 3.6) in a ratio of 1:1:10. For each determination, standard solutions and ginger extracts (M70, R70, M96, R96 and Opt) were diluted with distilled water to a final volume of 500 µL and then reacted with an equal volume of FRAP reagent. The mixtures were incubated for 30 min in the dark at room temperature, after which absorbance was recorded at 595 nm using a UV-Visible spectrophotometer. A reagent blank was prepared using buffer instead of sample, and a control solution was treated under the same conditions. Antioxidant capacity was calculated from an ascorbic acid standard curve (1 - 3 µg/mL), prepared in triplicate. All samples were analyzed in 6 replicates, and results were expressed as milligrams of ascorbic acid equivalent antioxidant capacity (AEAC) per gram of extract.
Antioxidative activity: Phosphomolybdenum (PM) method
The antioxidant capacity was determined using the phosphomolybdenum (PM) method, based on a previously published protocol with slight modifications [12]. The reagent solution was composed of 28 mM sodium phosphate, 0.6 M sulfuric acid, and 4 mM ammonium molybdate, all dissolved in distilled water. A reagent blank was prepared by replacing the sample with distilled water, and a control solution was processed under identical conditions. Ascorbic acid was used as the reference standard. A set of standard solutions with concentrations ranging from 40 to 72 μg/mL was prepared and analyzed in triplicate, where 500 μL of each standard solution was combined with 500 μL of the reagent. The reaction mixtures were tightly sealed and incubated in a water bath at 95 °C for 90 min, followed by cooling to room temperature. Absorbance was recorded at 695 nm using a UV-Visible spectrophotometer. All samples were analyzed in 6 replicates using the same procedure, and antioxidant capacity was reported as milligrams of ascorbic acid equivalent antioxidant capacity (AEAC) per gram of extract based on the calibration curve.
Antioxidative activity: β-Carotene bleaching (BCB) method
The β-carotene bleaching (BCB) assay was performed following a previously reported method with slight modifications [13]. Briefly, β-carotene (0.2 mg) was dissolved in 1 mL of chloroform and subsequently combined with linoleic acid (0.02 mL) and Tween 20 (0.2 mL). The chloroform was then evaporated at room temperature under reduced pressure using a rotary evaporator. The remaining residue was emulsified by the addition of 50 mL of distilled water and vigorous shaking. Ascorbic acid standard solutions (4 - 9 µg/mL) were prepared and analyzed in triplicate for each concentration. For each assay, 1 mL of the emulsion was mixed with 100 µL of the extract, while ethanol was used as the control, and a blank was prepared under the same conditions without β-carotene. The mixtures were incubated at 50 °C, after which absorbance was measured at 470 nm using a UV-visible spectrophotometer. All samples were processed under identical conditions in 6 replicates. Antioxidant activity was calculated as the percentage inhibition of β-carotene oxidation relative to the control and expressed as ascorbic acid equivalent antioxidant capacity (AEAC), reported as milligrams of ascorbic acid equivalents per gram of extract based on the corresponding standard calibration curve.
Thin-layer chromatography
Thin-layer chromatography (TLC) analysis was conducted using silica gel GF₂₅₄ plates, with a mixture of n-hexane and ethyl acetate (5:2, v/v) employed as the mobile phase. A 10 µL aliquot of the 1% extract solutions (M70, R70, M96, R96 and Opt) was applied as individual spots. Plates were developed in a pre-saturated chamber until the solvent front reached the marked distance. The chromatograms were examined under UV light at 254 and 366 nm (Camag, Switzerland). Phytochemical visualization was performed by spraying various detecting reagents, including citroboric reagent, 10% Folin-Ciocalteu, 0.2% DPPH, 0.15% CUPRAC, 0.8% FRAP, 0.005% PM and 0.33% BCB solutions. All tracks were aligned to a common reference point for comparison [5].
Statistical analysis
Statistical analyses were conducted using Minitab 22 software. Data from 6 independent measurements were presented as mean ± standard deviation, and normality as well as homogeneity of variance were evaluated prior to analysis. One-way analysis of variance (ANOVA) was applied to determine significant differences among extraction conditions, followed by Tukey’s post hoc test when appropriate, with a significance threshold set at p < 0.05. Pearson correlation analysis was performed to examine linear associations among total phenolic content, total flavonoid content, and antioxidant activity parameters, and the resulting correlation matrix was visualized in the form of a heatmap. Chemometric analysis was further carried out using MetaboAnalyst (version 6.0) to explore multivariate relationships and sample discrimination; prior to analysis, data were mean-centered and auto-scaled. Both principal component analysis (PCA) and hierarchical cluster analysis (HCA) were employed as unsupervised methods to visualize clustering patterns, evaluate sample similarity, and identify key variables contributing to differences among elephant ginger extracts.
LC-MS/MS profiling and compound identification
The chemical constituents of the extract were analyzed using a Thermo Scientific™ Vanquish™ UHPLC system coupled to a Q Exactive™ Orbitrap™ mass spectrometer. Separation was performed on an Accucore™ Phenyl-Hexyl column (100×2.1 mm, 2.6 µm) at 40 °C using water and methanol (both with 0.1% formic acid) under a 5% - 90% B gradient for 0 - 16 min at 0.3 mL/min. A 3 µL injection of the sample (1 mg/mL) was analyzed in positive ESI mode with a scan range of m/z 66.7 - 1,000. Metabolite identification was based on accurate mass and MS/MS fragmentation matched against MzCloud, ChemSpider, and PubChem reference databases, and was assigned as Level 2 (putatively annotated compounds) according to the Metabolomics Standards Initiative (MSI) guidelines [14].
Determination of ferulic acid by high-performance liquid chromatography (HPLC)
The identification and determination of ferulic acid in the optimized maceration elephant ginger extract were performed using a high-performance liquid chromatography (HPLC) system. The mobile phase comprised methanol and water, applied in a linear gradient program increasing from 40% to 60% methanol (eluent B) over 5 min, increased to 70% at 10 min, and returned to 40% at 15 min for re-equilibration. Separation was achieved on a LiChrospher 100 RP-C18 column (5 µm, 100×4 mm2) maintained at 30 °C, with a flow rate of 1 mL/min and an injection volume of 20 µL. Detection was conducted at a wavelength of 360 nm using a UV-visible detector. Ferulic acid was selected as the target compound based on prior tentative identification obtained from LC-MS/MS profiling, and both standard solutions and extract samples were prepared in methanol prior to analysis [5].
Results and discussion
Extraction and extract characterization
Extraction of elephant ginger rhizomes with 70% and 96% ethanol using maceration (M70 and M96) and reflux (R70 and R96), together with the optimized maceration extract (Opt), produced yields of 4.129% - 11.484%, with the highest yield obtained from M70. This trend reflects the stronger ability of aqueous ethanol to solubilize polar constituents such as phenolics and flavonoids, whereas 96% ethanol extracts fewer polar compounds, resulting in lower yields. The specific gravity values (0.795 - 0.894 g/mL) varied only slightly, indicating similar physical characteristics across extracts. Using 2 solvent strengths (70% and 96% ethanol) enabled the evaluation of solvent polarity in extracting both polar and semi-polar compounds, while comparing maceration with reflux allowed assessment of diffusion-based extraction versus heat-assisted extraction that improves solute diffusion and cell wall permeability. These parameters provided insight into the influence of solvent polarity and extraction temperature on the composition of elephant ginger extracts.
Total phenolic content (TPC) and total flavonoid content (TFC)
The TPC and TFC measurements varied markedly across extraction conditions. As shown in Figure 1, extracts obtained with 96% ethanol consistently yielded the highest phenolic (78.282 - 87.288 mg GAE/g) and flavonoid levels (16.555 - 28.252 mg QE/g), indicating that low-water solvents more efficiently extract medium-polar phenolic acids and flavonoid aglycones. The M96 showed the greatest values, suggesting that non-heating conditions help preserve phenolics while maintaining good solvent penetration. In contrast, M70 produced lower TPC and TFC, likely due to the co-extraction of more hydrophilic, non-phenolic constituents that reduce the relative abundance of phenolic compounds. Overall, these findings underscore the critical role of solvent polarity in determining phenolic and flavonoid recovery from elephant ginger rhizomes.
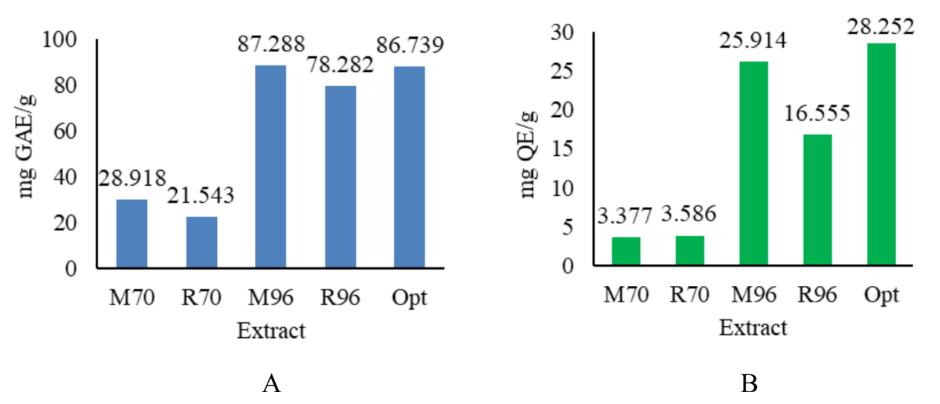
Figure 1 (A) Total phenolic content (TPC) and (B) total flavonoid content (TFC) of elephant ginger extracts. M70: 70% ethanol maceration; R70: 70% ethanol reflux; M96: 96% ethanol maceration; R96: 96% ethanol reflux; Opt: optimized maceration (96% ethanol maceration for 40 min, ratio sample - solvent 1:3).
Antioxidative activity
The ginger extracts showed clear differences in antioxidant activity across extraction conditions, as summarized in Table 1. Extracts M96 and R96 consistently exhibited the strongest responses, meanwhile the Opt extract presenting the highest CUPRAC (174.291 ± 8.431 mg AEAC/g) and FRAP (173.693 ± 3.233 mg AEAC/g) values. Both M96 and R96 also performed better than M70 and R70, which M70 produced the lowest activities with DPPH values 38.614 ± 1.307 mg AEAC/g, meanwhile Opt extract gave DPPH 94.491 ± 0.317 mg AEAC/g. These results indicated that higher ethanol concentrations improve the extraction of medium-polar phenolics and flavonoid aglycones, while 70% ethanol co-extracts more hydrophilic constituents that contribute little to antioxidant capacity. Similar solvent-related patterns in phenolic recovery have been reported previously [15]. To achieve a comprehensive understanding of antioxidant behavior, 5 assays were employed because individual phytochemicals often respond differently depending on their redox characteristics (their ability to participate in electron transfer reactions) and solubility.
Table 1 Antioxidant activities of ethanolic elephant ginger extracts.
Extract |
DPPH |
CUPRAC |
FRAP |
BCB |
PM |
M70 |
38.614 ± 1.307a |
23.972 ± 6.476a |
55.654 ± 2.027a |
79.325 ± 7.248a |
94.309 ± 6.297a |
R70 |
41.229 ± 1.345a |
49.440 ± 5.884b |
55.722 ± 2.059a |
79.793 ± 3.274a |
60.540 ± 5.480b |
M96 |
92.056 ± 4.901b |
156.165 ± 6.799c |
139.469 ± 1.897b |
146.370 ± 7.415b |
146.329 ± 9.112c |
R96 |
90.807 ± 1.524b |
120.977 ± 8.617d |
127.327 ± 3.480c |
86.815 ± 3.617a |
122.213 ± 9.434d |
Opt |
94.491 ± 0.317b |
174.291 ± 8.431e |
173.693 ± 3.233d |
167.952 ± 5.778c |
164.617 ± 6.981e |
M70: 70% ethanol maceration; R70: 70% ethanol reflux; M96: 96% ethanol maceration; R96: 96% ethanol reflux; Opt: optimized maceration (96% ethanol maceration for 40 min, sample - solvent ratio 1:3). Values are mean ± SD (n = 6). Different superscript letters indicate significant differences (p < 0.05).
Differences among assays are expected because each method targets a distinct antioxidant mechanism. DPPH evaluates hydrogen atom transfer (HAT), indicating the ability of compounds to directly quench a stable radical. In contrast, CUPRAC and FRAP rely on electron-transfer (ET) (redox-based assays) and therefore measure reducing power. CUPRAC detects the reduction of the Cu2+-neocuproine complex to Cu1+-neocuproine and is most responsive to antioxidants with standard reduction potentials (E°) below 0.60 V [16]. FRAP monitors the reduction of Fe3+-TPTZ to Fe2+-TPTZ and only reacts with compounds having E° values lower than the Fe3+-TPTZ to Fe2+-TPTZ at 0.70 V. Consequently, extracts with comparable phenolic levels may yield different CUPRAC or FRAP responses depending on individual redox properties. The high CUPRAC and FRAP values of the 96% ethanol extracts indicate a greater presence of strong electron-donating constituents.
The BCB assay showed a distinct pattern compared with the radical-scavenging and electron-transfer assays. The Opt extract still showed the highest value (167.952 ± 5.778 mg AEAC/g); however, sample-to-sample differences were less pronounced because the BCB assay, which is conducted in a lipid medium, preferentially responds to lipophilic or amphiphilic antioxidants, resulting in lower agreement with DPPH, CUPRAC, and FRAP outcomes. Its inclusion was essential for assessing lipid-phase protection that hydrophilic UV-Vis assays cannot capture [15]. The PM assay yielded uniformly high reducing capacities across extracts, with the Opt extract sample again showing the strongest activity (164.617 ± 6.981 mg AEAC/g). Since this method quantifies total reductants through Mo6+/Mo5+ reduction at a relatively low redox potential (0.30 - 0.45 V) [12], it reflects broad antioxidant potential rather than mechanism-specific pathways. Overall, the contrasting patterns across assays highlight the necessity of complementary methods to characterize antioxidant behavior comprehensively, while the consistently superior performance of extracts prepared with 96% ethanol underscores the importance of solvent polarity in maximizing the recovery of active constituents from elephant ginger.
Quantitative correlation between TPC, TFC, and antioxidative activity
The correlation heatmap (Figure 2) highlights the relationships among TPC, TFC, and multiple antioxidant assays (DPPH, CUPRAC, FRAP, BCB, PM) across different extraction conditions. Overall, correlations ranging from strong to very strong are observed among several antioxidant assays, particularly CUPRAC, FRAP, and DPPH, indicating that these methods respond consistently to the antioxidant constituents present in the extracts. In the heatmap, the color scale represents Pearson correlation coefficients ranging from 0.72 (blue) to 1.00 (red), with redder hues indicating stronger positive correlations and bluer tones reflecting relatively weaker, yet still positive, relationships among the evaluated parameters. Such strong assay-to-assay correlations are commonly reported in natural product studies because these assays share similar underlying redox mechanisms [17]. TPC and TFC also exhibit high correlations with multiple antioxidant indicators, supporting the widely recognized contribution of phenolic and flavonoid compounds to antioxidant activity in plant extracts [18]. These relationships reinforce the biochemical relevance of phenolics as key electron-donating or radical-scavenging agents in Zingiberaceae species. Variations in correlation strength among the different solvent systems indicate that extraction conditions affect both the yield of compounds and the functional relationships among antioxidant indicators. Extracts produced with higher polarity tend to solubilize phenolics more effectively, often resulting in stronger clustering between TPC and redox-based assays. In contrast, lower-polarity extracts may show weaker correlations because different compound classes dominate their chemical profiles. Moderate or low correlations in certain assay pairs also arise from methodological differences, such as lipid-phase versus aqueous-phase radical systems, which represent different facets of antioxidant activity [19].
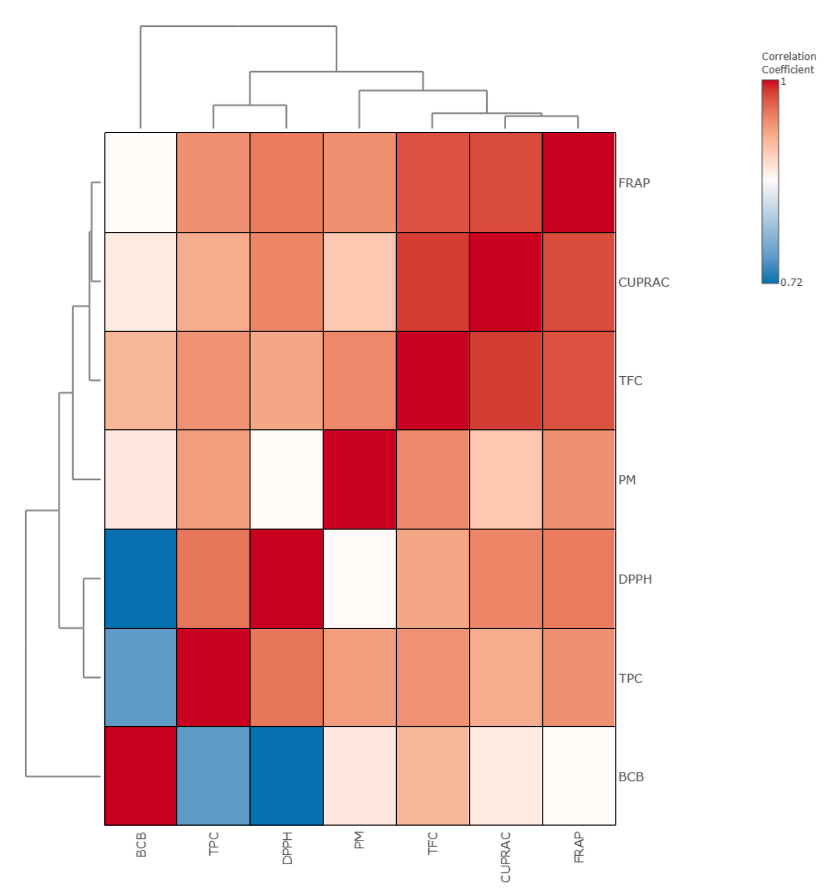
Figure 2 Correlation heatmap of TPC, TFC, and antioxidant assays (DPPH, CUPRAC, FRAP, BCB, PM) across different extraction conditions of elephant ginger. Color scale ranges from blue (r = 0.72) to red (r = 1.00), indicating increasing positive correlation strength.
Chemometric analysis
Principal component analysis (PCA) and hierarchical cluster analysis (HCA) are widely applied chemometric techniques for exploring patterns and relationships within complex phytochemical and antioxidant datasets. PCA reduces data dimensionality by transforming correlated variables into orthogonal principal components, thereby highlighting the dominant sources of variation and enabling effective sample discrimination. In turn, HCA groups samples based on similarity measures and hierarchical relationships, offering a complementary clustering perspective that can reinforce and validate the grouping patterns suggested by PCA in multivariate studies of plant metabolites and antioxidant profiles [20,21]. In contrast, HCA classifies samples based on similarity measures and hierarchical relationships, offering a complementary visualization of sample grouping that can reinforce patterns observed in PCA and provide additional insight into sample similarity structures in multivariate datasets. [22]. The combined application of PCA and HCA is therefore well suited for assessing the influence of extraction parameters on the chemical and antioxidant profiles of plant-derived extracts.
The PCA score plot showed a clear discrimination among elephant ginger extracts based on ethanol concentration and extraction approach, indicating substantial differences in their antioxidant activities and phytochemical characteristics (Figure 3(A)). The first principal component (PC1), accounting for 93.3% of the total variance, represents the main contributor to sample differentiation and distinctly separates extracts obtained using 70% ethanol from those prepared with 96% ethanol. Samples M70 and R70 cluster tightly on the negative side of PC1, whereas M96, R96, and Opt extract were positioned on the positive axis, demonstrating that solvent polarity is the primary factor influencing extract composition. This separation suggests that higher ethanol concentrations preferentially enhance the extraction of compounds in elephant ginger with differing polarity and antioxidant relevance compared to more aqueous systems. The second principal component (PC2), explaining 3.9% of the variance, provides additional discrimination among the high-ethanol extracts, likely reflecting differences in extraction technique and optimization parameters. The close grouping of replicate samples within each extraction condition indicates good analytical reproducibility and consistent extraction performance.
The HCA dendrogram further corroborates the PCA results by classifying the extracts into 2 major clusters corresponding to 70% and 96% ethanol extraction conditions (Figure 3(B)). All replicates within each extraction condition cluster closely together, reflecting high extraction consistency and analytical reliability. Within the high-ethanol cluster, additional sub-grouping among M96, R96, and Opt highlights the secondary influence of extraction method and optimization parameters on extract similarity. Overall, the clustering pattern confirms that ethanol concentration is the dominant factor governing sample discrimination, while extraction approach contributes to secondary but systematic variations in the chemical and antioxidant profiles of elephant ginger extracts.
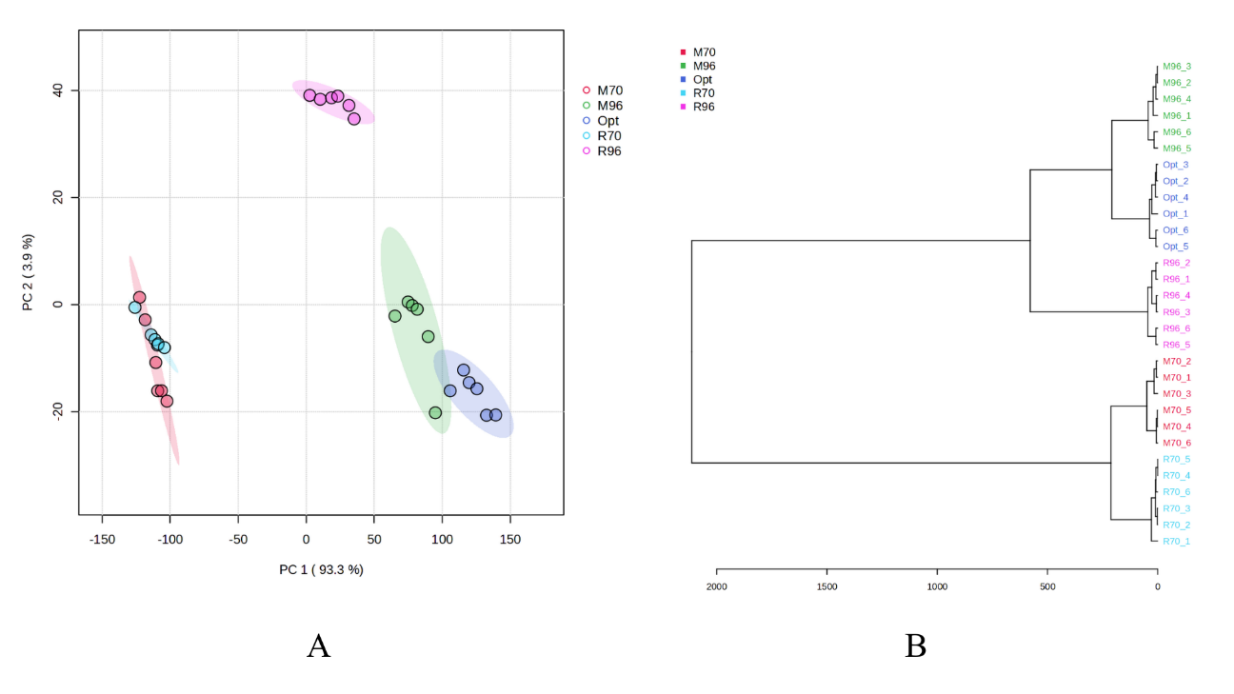
Figure 3 PCA score plot and HCA dendrogram of ethanolic elephant ginger extracts based on antioxidant and phytochemical parameters. (A) = PCA score plot, (B) = HCA dendrogram, R70: 70% ethanol reflux; M96: 96% ethanol maceration; R96: 96% ethanol reflux; Opt: optimized maceration (96% ethanol maceration for 40 min, ratio sample - solvent 1:3).
Qualitative correlation between TPC, TFC, and antioxidative activity
The qualitative TLC patterns were consistent with the quantitative antioxidant data, as shown in Figure 4. Extracts with higher phenolic and flavonoid contents produced stronger or more numerous reactive bands when visualized using Folin-Ciocalteu, CUPRAC, FRAP, and PM reagents, indicating greater reducing capacity and aligning with the strong correlations between TPC, TFC, and electron-transfer-based assays. The BCB plate also showed inhibition zones, although the color contrast was much weaker, reflecting the lower visual sensitivity of this HAT-based method on TLC despite the presence of detectable bands. These patterns still suggested differences in lipid-peroxidation inhibitory activity and were consistent with the moderate correlations obtained for BCB. Overall, the TLC profiles complement the instrumental assays by visually confirming that band intensity corresponds to the polyphenolic richness and antioxidant potential of the extracts.
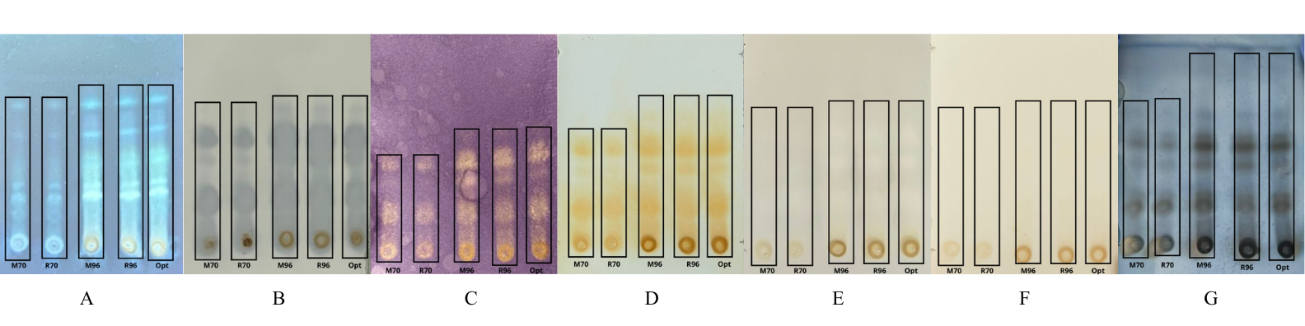
Figure 4 Qualitative TLC profiles of ethanolic elephant ginger extracts on silica gel GF254 using n-hexane–ethyl acetate (5:2) as the mobile phase. Plates were visualized with (A) sitroborate (UV 366 nm), (B) Folin-Ciocalteu 10%, (C) DPPH 0.2%, (D) CUPRAC 0.15%, (E) FRAP 0.8%, (F) BCB 0.33%, and (G) PM 0.005%.
Determination of phytochemical constituent by LC-MS/MS profiling and compound identification
The LC-MS/MS profiling was performed on Opt extract, obtained using the Box-Behnken extraction conditions consisting of 40 min extraction time, a material-to-solvent ratio of 1:3 and ethanol concentration of 96%, followed by mechanical pressing This extract was selected because it produced the highest antioxidant activity compared to the other extracts (M70, M96, R70 and R96). Analysis of the Opt extract revealed a diverse array of semi-polar and non-polar metabolites, with compound identifications restricted to features exhibiting mzCloud similarity scores above 90%. Compounds such as oleamide, ferulic acid, α-eleostearic acid, methyl cinnamate, α-linolenic acid, monoolein, 1-linoleoyl glycerol, and acetylarginine were detected, indicating that ethanol efficiently extracts constituents beyond the typically examined gingerols and shogaols. This chemical diversity agrees with recent metabolomic reports showing that ginger contains a broad range of fatty acids, phenolic acids, glycerides, and amide-type metabolites. The observed phenolic acid profile corresponds well with the findings of Tohma et al. [23], while the overall metabolite distribution aligns with the extensive LC–MS fingerprinting described by Pande et al. [24] who highlighted substantial variation in metabolite distribution across ginger samples. A detailed summary of the identified metabolites is provided in Table 2.
Table 2 Tentative compound identification of the optimized maceration extract by LC-MS/MS
No. |
Identified compounds |
Molecular weight |
Relative abundance* |
Confidence of identification (mzCloud similarity, %) |
1 |
Oleamide |
281.2718 |
Medium |
99.2 |
2 |
Ferulic acid |
194.0582 |
High |
99.5 |
3 |
α-Eleostearic acid |
278.2249 |
Medium |
99.1 |
4 |
Methyl cinnamate |
162.0681 |
Medium |
99.7 |
5 |
1-Linoleoyl glycerol |
354.2761 |
High |
98.4 |
6 |
α-Linolenic acid |
278.2249 |
Low |
97.3 |
7 |
Acetylarginine |
216.1222 |
Low |
98.4 |
8 |
Monoolein |
356.2921 |
High |
97.9 |
Compound identifications were restricted to features exhibiting mzCloud similarity scores above 90%. Relative abundance was estimated semi-quantitatively based on LC-MS peak area values and does not represent absolute concentration.
Several metabolites identified in the extract have been previously associated with antioxidant mechanisms, suggesting their contribution to the observed activity. Ferulic acid is known for its strong radical-scavenging and electron-donating properties [25], and α-linolenic acid also shows notable antioxidant effects [26]. Fatty acid derivatives and related lipid components contribute to membrane homeostasis and can modulate cellular redox responses, which underlies their role in protecting membrane integrity against oxidative stress [27], while oleamide has been linked to oxidative stress regulation [28]. These metabolites therefore provide a plausible chemical basis for the extract’s antioxidant performance. Although LC-MS/MS offers valuable compositional insight, the annotations remain tentative because level-2 identification relies on spectral matching rather than validation with standards. Even so, the metabolite profile aligns with recent chemical characterizations of elephant ginger, reinforcing the connection between detected constituents and the antioxidant responses reported in this study.
Determination of ferulic acid by High-Performance Liquid Chromatography (HPLC)
The HPLC chromatogram provides targeted confirmation of ferulic acid in the optimized maceration extract (Opt extract) that was analyzed by LC–MS/MS. This targeted verification strengthens the reliability of the LC-MS/MS results and supports the broader metabolite profile obtained from the untargeted analysis. A distinct peak corresponding to the ferulic acid standard appears at 1.383 min, while the extract shows a closely aligned peak at 1.413 min, confirming the presence of ferulic acid. Quantification of ferulic acid in the Opt extract was performed using the one-point method, resulting in a content of 0.3688 ± 0.01 mg/g. Ferulic acid was selected as the reference marker because it is a well-established phenolic acid in elephant ginger and has been consistently reported in recent phytochemical studies [29,30]. Its detection by both LC–MS/MS and HPLC strengthens the analytical reliability and provides cross-platform validation of its identity. The chromatogram, including the ferulic acid standard peak and the Opt extract peak, is illustrated in Figure 5.
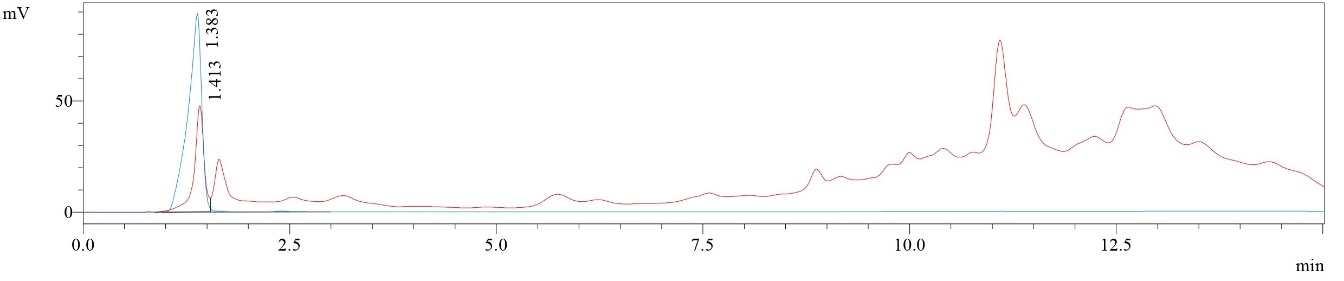
Figure 5 HPLC chromatogram of optimized maceration extract and ferulic acid standard. Red line = optimized maceration extract, green line = ferulic acid.
Quantitative analysis using the area-under-the-curve (AUC) approach showed that the optimized maceration extraction condition markedly increased the recovery of ferulic acid, indicating that the chosen ethanol concentration and extraction parameters promote efficient solubilization of phenolic compounds. This outcome is consistent with previous findings reporting that ethanol-water systems enhance the extraction of hydroxycinnamic acids because their intermediate polarity facilitates matrix disruption and diffusion [31]. The presence of ferulic acid is particularly important, as it contributes to antioxidant activity through hydrogen atom donation, radical stabilization, and modulation of redox-related pathways [18]. Its higher level in the Opt extract therefore provides a clear chemical explanation for the stronger antioxidant responses observed across the assays.
The confirmation of ferulic acid further supports the phytochemical profile of elephant ginger. Ferulic acid is widely recognized as a strong antioxidant and has been reported to contribute to the biological activity of ginger extracts [32]. The chromatographic evidence presented here thus strengthens the interpretation that phenolic acids, particularly ferulic acid, are key contributors to the functional properties of the optimized maceration extract. Moreover, integrating targeted HPLC quantification with non-targeted LC–MS/MS profiling offers a robust analytical approach for verifying bioactive compounds (compounds contributing to biological activity, particularly antioxidant effects) in natural product research, ultimately enhancing the reliability and reproducibility of the findings.
Conclusions
This study aimed to evaluate the effect of extraction techniques and solvent concentrations on the antioxidant properties and phytochemical profile of elephant ginger. The comparison of extraction conditions showed that maceration with 70% ethanol produced the highest extraction yield, while maceration with 96% ethanol resulted in higher phenolic and flavonoid levels, and the strongest antioxidant activity across the DPPH, FRAP, CUPRAC, BCB, and PM assays. This method outperformed reflux extraction and all treatments using 70% ethanol, indicating that short, low-temperature maceration with a high-ethanol solvent is more efficient for recovering antioxidant-active constituents from elephant ginger. Nonetheless, this conventional approach did not reach the performance predicted by the Box-Behnken Design in the previous study. The optimized maceration extraction, consisting of 40 min of maceration, ratio sample - solvent (1:3) and 96% ethanol followed by pressing, yielded higher phenolic content, stronger antioxidant responses in all assays, and improved extraction efficiency. HPLC analysis confirmed a higher ferulic acid concentration in the optimized maceration extract, and LC-MS/MS profiling revealed a more diverse set of bioactive metabolites, supporting the superior antioxidant potential of the optimized conditions.
Acknowledgements
The authors thank to Institut Teknologi Bandung through the Program of Research, Community Service and Innovation (PPMI) 2026.
Declaration of Generative AI in Scientific Writing
The authors acknowledge the use of generative AI tools (ChatGPT) in the preparation of this manuscript, specifically for language editing and grammar correction. No content generation or data interpretation was performed by AI. The authors take full responsibility for the content and conclusions of this work.
CRediT Author Statement
Rika Hartati: Validation; Writing - Review & Editing. Flaviana Selina: Conceptualization; Methodology; Software; Validation; Investigation; Formal Analysis; Resources; Writing - Original Draft; Writing - Review & Editing. Atina Rizkiya Choirunnisa: Conceptualization, Project Administration; Formal Analysis; Resources; Supervision; Validation; Writing - Original Draft; Writing - Review & Editing. Hegar Pramastya: Validation; Writing - Review & Editing. Irda Fidrianny: Conceptualization, Project Administration; Formal Analysis; Resources; Supervision; Validation; Writing - Original Draft; Writing - Review & Editing.
References
[1] M Gonzalez-Gonzalez, BJ Yerena-Prieto, C Carrera, M Vazquez-Espinosa, AV Gonzalez-de-Peredo, MA Garcia-Alvarado, M Palma, GC Rodriguez-Jimenes and GF Barbero. Determination of gingerols and shogaols content from ginger (Zingiber officinale Rosc.) through microwave-assisted extraction. Agronomy 2023; 13(9), 2288.
[2] AF Abdul-Majeed and HA Al-Krad. Influence of ginger as an antioxidant on the physiological performance of male quail stressed by hydrogen peroxide. Mesopotamia Journal of Agriculture 2023; 50(1), 141-151.
[3] CP Mungwari, CK King’Ondu, P Sigauke and BA Obadele. Conventional and modern techniques for bioactive compounds recovery from plants. Scientific African 2025; 27, e02509.
[4] JE Lee, JTM Jayakody, JI Kim, JW Jeong, KM Choi, TS Kim, C Seo, I Azimi, JM Hyun and BM Ryu. The influence of solvent choice on the extraction of bioactive compounds from Asteraceae: A comparative review. Foods 2024; 13(19), 3151.
[5] AR Choirunnisa, F Selina, D Rizaldy, H Pramastya, R Hartati and I Fidrianny. Response surface methodology for optimization of antioxidative activity: Elephant ginger (Zingiber officinale Roscoe). Journal of Pharmacy and Pharmacognosy Research 2025; 13(6), 1947-1962.
[6] I Gulcin. Antioxidants: A comprehensive review. Archives of Toxicology 2025; 99(5), 1893-1997.
[7] A Ali, Z Asgher, JJ Cottrell and FR Dunshea. Screening and characterization of phenolic compounds from selected unripe fruits and their antioxidant potential. Molecules 2024; 29(1), 167.
[8] F Pourmorad, SJ Hosseinimehr and N Shahabimajd. Antioxidant activity, phenol and flavonoid contents of some selected Iranian medicinal plants. African Journal of Biotechnology 2006; 5(11), 1142.
[9] CC Chang, MH Yang, HM Wen and JC Chem. Estimation of total flavonoid content in propolis by 2 complementary colorimetric methods. Journal of Food and Drug Analysis 2002; 10(3), 3.
[10] E Celep, M Charehsaz, S Akyuz, ET Acar and E Yesilada. Effect of in vitro gastrointestinal digestion on the bioavailability of phenolic components and the antioxidant potentials of some Turkish fruit wines. Food Research International 2015; 78, 209-215.
[11] M Ozyurek, B Bektasoglu, K Guclu, N Gungor and R Apak. Simultaneous total antioxidant capacity assay of lipophilic and hydrophilic antioxidants in the same acetone-water solution containing 2% methyl-beta-cyclodextrin using the cupric reducing antioxidant capacity (CUPRAC) method. Analytica Chimica Acta 2008; 630(1), 28-39.
[12] P Prieto, M Pineda and M Aguilar. Spectrophotometric quantitation of antioxidant capacity through the formation of a phosphomolybdenum complex: Specific application to the determination of vitamin E 1. Analytical Biochemistry 1999; 269(2), 337.
[13] A Othman, A Ismail, GN Abdul and I Adenan. Antioxidant capacity and phenolic content of cocoa beans. Food Chemistry 2007; 100(4), 1523-1530.
[14] H Suhendy, M Insanu and I Fidrianny. Extracts, fractions, and subfractions from purple-orange sweet potato (Ipomoea batatas L.): Xanthine oxidase inhibitory potential and antioxidant properties. Molecules 2025; 30(11), 2442.
[15] M Sharifi-Rad, NVA Kumar, P Zucca, EM Varoni, L Dini, E Panzarini, J Rajkovic, PVT Fokou, E Azzini, I Peluso, AM Prakash, M Nigam, Y El Rayess, ME Beyrouthy, L Polito, M Iriti, N Martins, M Martorell, AO Docea and J Sharifi-Rad. Lifestyle, oxidative stress, and antioxidants: Back and forth in the pathophysiology of chronic diseases. Frontiers in Physiology 2020; 11, 552535.
[16] R Apak, M Ozyurek, K Guclu and E Capanoglu. Antioxidant activity/capacity measurement. 1. Classification, physicochemical principles, mechanisms, and electron transfer (ET)-based assays. Journal of Agricultural and Food Chemistry 2016; 64(5), 997-1027.
[17] J Rumpf, R Burger and M Schulze. Statistical evaluation of DPPH, ABTS, FRAP, and Folin-Ciocalteu assays to assess the antioxidant capacity of lignins. International Journal of Biological Macromolecules 2023; 233, 123470.
[18] F Imtiaz, D Ahmed, OA Mohammed, U Younas and M Iqbal. Optimized recovery of phenolic and flavonoid compounds from medicinal plant extracts for enhanced antioxidant activity: A mixture design approach. Results in Chemistry 2025; 13, 101960.
[19] E Knez, K Kadac-Czapska and M Grembecka. Evaluation of spectrophotometric methods for assessing antioxidant potential in plant food samples-A critical approach. Applied Sciences 2025; 15(11), 5925.
[20] NH Atta, H Handoussa, I Klaiber, B Hitzmann and RS Hanafi. Chemometric approach for profiling of metabolites of potential antioxidant activity in apiaceae species based on LC-PDA-ESI-MS/MS and FT-NIR. Separations 2023; 10(6), 347.
[21] Q Xie and Z Liu. Chemometrics of the composition and antioxidant capacity of essential oils obtained from 6 Cupressaceae taxa. Scientific Reports 2024; 14(1), 18612.
[22] RE Quero, K Lucas, J Higgins and ERE Mojica. ATR-FTIR characterization and multivariate analysis classification of different commercial propolis extracts. Measurement: Food 2025; 18, 100224.
[23] H Tohma, I Gulcin, E Bursal, AC Goren, SH Alwasel and E Koksal. Antioxidant activity and phenolic compounds of ginger (Zingiber officinale Rosc.) determined by HPLC-MS/MS. Journal of Food Measurement and Characterization 2017; 11(2), 556-566.
[24] A Pande, A Majeed, S Majeed, K Nagabhushanam, M Majeed, M Sengodagounder and SK Thiruppathi. Comparative LC-MS chemical fingerprinting, antioxidant potential, and in silico analysis of anti-emetic and pain modulation activity of dry and fresh white ginger extracts. Natural Product Communications 2025; 20(9), 1934578X251375515.
[25] K Pyrzynska. Ferulic acid - A brief review of its extraction, bioavailability and biological activity. Separations 2024; 11(7), 204.
[26] N Ando, N Nosaka, C Arai and K Kato. The effects of alpha-linolenic acid intake on skin and blood vessel health and subjective fatigue in middle-aged Japanese females: A randomized, double-blind, placebo-controlled, parallel-group comparative trial. The Journal of Nutrition 2025; 155(10), 3304-3320.
[27] M Pandey, J Ganotra, A Singh, P Parchuri and J Giri. Lipid-mediated responses to nutrient and other stresses: roles in plant adaptation and signaling. Journal of Experimental Botany 2025. https://doi.org/10.1093/jxb/eraf482
[28] CY Reyes-Soto, M Villaseca-Flores, EA Ovalle-Noguez, J Nava-Osorio, S Galvan-Arzate, E Rangel-Lopez, M Maya-Lopez, S Retana-Marquez, I Tunez, AA Tinkov, M Aschner and A Santamaria. Oleamide reduces mitochondrial dysfunction and toxicity in rat cortical slices through the combined action of cannabinoid receptors activation and induction of antioxidant activity. Neurotoxicity Research 2022; 40(6), 2167-2178.
[29] R Jan, A Gani, MM Dar and NA Bhat. Bioactive characterization of ultrasonicated ginger (Zingiber officinale) and licorice (Glycyrrhiza glabra) freeze dried extracts. Ultrasonics Sonochemistry 2022; 88, 106048.
[30] EA Shalaby, SM Shanab, RM Hafez and AE El-Ansary. Chemical constituents and biological activities of different extracts from ginger plant (Zingiber officinale). Chemical and Biological Technologies in Agriculture 2023; 10(1), 14.
[31] V Jevtovic, KFS Alabbosh, RA Alyami, MA Alreshidi, MR Alshammari, B Alshammari, J Mitic and M Mitic. Optimization and kinetic modelling of hydroxycinnamic acid extraction from Anethum graveolens leaves. Processes 2025; 13(5), 1297.
[32] JR Purushothaman and MD Rizwanullah. Ferulic acid: A comprehensive review. Cureus Journal of Medical Science 2024; 16(8), e68063.