
Trends
Sci.
2026;
23(11):
13729
Ultrasonic-Assisted Extraction of Bee Pollen as Antioxidant Activity for Develop to Nanoemulsion in Topical Formulation by Box-Behnken Design
Wannisa Keawbankrud1, Saroj Charoensak2,3, Phichamon Noisuwan2,3, Petch Suthiporn2,3, Wasana Phantewee2,3, Sasiwimol Wootthikanokkhan4 and Rutairat Suttisuwan2,3,*
1Health Science and Aesthetic Program, Department of Science, Faculty of Science and Technology,
Rajamangala University of Technology Krungthep, Bangkok 10120, Thailand
2Department of Biology, Faculty of Science and Technology, Rajamangala University of Technology Krungthep, Bangkok 10120, Thailand
3Biodiversity and Sustainable Utilization Research Unit, Faculty of Science and Technology,
Rajamangala University of Technology Krungthep, Bangkok 10120, Thailand
4Department of Chemistry, Faculty of Science and Technology, Rajamangala University of Technology Krungthep, Bangkok 10120, Thailand
(*Corresponding author’s e-mail: [email protected])
Received: 1 March 2026, Revised: 4 May 2026, Accepted: 11 May 2026, Published: 15 June 2026
Bee pollen is a natural supplement composed of flower pollen, nectar and the secretions of bees. This research analyzed the composition of bee pollen using FTIR-ATR, which showed that bee pollen contains components that enhance antioxidant activity such as protein. The antioxidant potential of bee pollen extract was evaluated. Analyses on bee-pollen from ultrasonic extraction exhibited impressive radical scavenging properties in DPPH, ABTS and NO assay, without being a cell-toxic, and own potential for the investigations into gene expression and inflammatory cytokine modulation. For developing nanoemulsion in formulation, Box-Behnken Design using Response Surface Methodology (RSM) was used to determine the significant stability variables of particle size (PS), viscosity, and type of surfactant Tween. Phase separation was observed in 8 of 17 experimental trials, where higher pressure (7,000 psi) increased particle size and higher surfactant concentrations slightly enlarged particles but reduced zeta potential. Time exhibited a negligible impact. A combination of 2% surfactant and 5,000 psi pressure applied for 30 min was the optimal process condition, producing nanoparticles of 140.46 nm with a corresponding ZP of −24.46 mV, as corroborated by triplicate measurements. Formulations 1 - 3, 6, 9, 12 - 15, and 17 passed all stability tests. Conversely, formulations 4 - 5, 7 - 8, 10 - 11, and 16 showed phase separation and need further modification. These results are in accordance with known stiffness stabilization mechanisms in nanoemulsion systems, evidencing a surfactant assisted particle dispersion enhancement. This 2-dimensional strategy further promotes the functional possibility of bee pollen through powerful antioxidant profiling and rationally designed delivery systems.
Keywords: Bee pollen extract, Antioxidant activity, Cytotoxicity, Nanoemulsion, Box-Behnken design, Response Surface Methodology
Introduction
Bee pollen is a ball or pellet of field-gathered flower pollen packed by worker honeybees, and used as the primary food source for the hive. It is a nutritionally rich food, containing sugars, proteins, minerals,
vitamins, fatty acids, enzymes, antioxidants and other bioactive substances with more than 250 reported constituents. The chemical composition of bee pollen depends on botanical source, geographical origin, and environmental factors, and generally consists of 40% - 85% carbs, 14% - 30% proteins and 1% - 10% lipids. It’s also packed with loads of vitamins and minerals including calcium, magnesium and potassium. Bee pollen is collected throughout the world and produced predominantly in nations such as Brazil, the Philippines and Morocco and is considered as having a good nutritional value comprising essential amino acids, flavonoids and phenolic compounds responsible for its bioactivity [1,2]. Its metabolites, especially the polyphenols and flavonoids, are metabolized through cytochrome P450 enzymes, which might affect on their bioavailability and health benefits [3]. Additionally, bee pollen has been found to have strong antioxidant and anti-inflammatory effects which are mainly due to its phenolic acid and flavonoid content. Recent studies further confirm that polyfloral bee pollen exhibits strong antioxidant and antimicrobial activities and can attenuate inflammation in TNF-α-stimulated airway epithelial cells through modulation of NF-κB signaling, supporting its potential as a health-promoting ingredient in pharmaceutical and nutraceutical formulations [4,5]. It has been shown to neutralize free radicals and decrease oxidative stress, and antioxidant potential is positively correlated with total phenolic content, although the amount varies as a function of the pollen type and method of extraction. Moreover, bee pollen extracts have been found to possess potent anti-inflammatory effects, demonstrated by their ability to inhibit pro-inflammatory cytokines as TNF-α and IL-1β resulting in the diminished leukocyte accumulation, granulation tissue formation and angiogenesis in experimental models. Results of cytotoxicity studies show that most bee pollen extracts exhibit poor toxic behavior, supporting therapeutic use. Several extraction methods such as maceration and ultrasonic-assisted extraction have been used to maximize yield and recovery of bioactive compounds, and ultrasonic extraction was found to give higher phenolic content due to better cell wall disruption [6-11]. In line with this, recent investigations on rose and camellia bee pollen have demonstrated that ultrasonic or ultrasound-assisted treatments effectively disrupt pollen walls, enhance the release of nutritional components, and significantly improve in vitro and in vivo antioxidant capacity, highlighting ultrasound as a green technology for upgrading the biological activity of bee pollen ingredients [12,13].
Nano emulsions are emulsions with droplet sizes in the nanometer range (20 - 200 nm). They are prepared by the dispersion of 2 immiscible compounds (i.e., either surfactants or co-surfactants) containing thermodynamically stable and transparent systems which enhance the bioavailability and stability of the encapsulated substances. The ingredients primarily consist of an oil phase, an aqueous phase, and emulsifiers like Tween 80 and glycerol. Nano emulsions have also found various applications in pharmaceutical, cosmetic, food and the related fields where they are generally employed for the enhancement of solubility, stability and skin permeation of active compounds. Recent studies have been aimed at creating bee pollen nano emulsions to overcome the drawbacks (low solubility and stability) of bee pollen extracts with improvement of antioxidant and antibacterial activities as well as permeation and extending shelf life. These formulations have potential applications as functional foods and as cosmetics [14-18].
Thus, in the present study, it is desired that bee pollen could be extracted using maceration and ultrasonic approaches with a view to compare both yields since it is expected to follow by the evaluation of antioxidant, anti-inflammation and cytotoxic activities of the resulted extracts. The extracts will then be processed into nano emulsions using design of experiments software (Design Expert) for optimization and maximal efficacy and stability. The whole target is to obtain novel nano emulsion formulation to bee product of ordinary pollens so that it can be widely used in cosmetic and healthcare industry and directly absorbed to body because nano emulsion could improve the bioavailability and functional properties of ingredients. This practice shares the raising interest to obtain natural, effective and stable bioactive formulations in cosmetic production and more. To the best of our knowledge, there is still limited information on the integrated use of ultrasonic-assisted extraction and statistical optimization to simultaneously maximize the antioxidant and anti-inflammatory activities of bee pollen extracts and to tailor their incorporation into topical nanoemulsion. Previous study has either optimized the extraction of bee pollen bioactive using response surface methodology or developed pollen-based nanoemulsion for food applications, but they did not address cosmetic skin-care formulations or systematically link extraction efficiency, bioactivity, and colloidal stability within a single experimental framework [19]. In this context, the present work provides a 2-dimensional strategy that combines ultrasound-assisted extraction with Box-Behnken design-guided nanoemulsion formulation to generate a non-cytotoxic bee pollen extract with strong radical scavenging and NO-inhibitory capacity and to identify process parameters that yield physically stable, skin-compatible nanoemulsions suitable as cosmetic delivery vehicles.
Materials and methods
Materials
Bee pollen granules were obtained from Big Bee Farm, Samut Prakan, Thailand, and kept in airtight containers at 4 °C until use. Ethanol (analytical grade, 95% v/v; Merck, Germany) was used as the extraction solvent. For antioxidant experiments, 2,2-diphenyl-1-picrylhydrazyl (DPPH), 2,2′-azino-bis(3-ethylbenzothiazoline-6-sulfonic acid) diammonium salt (ABTS), potassium persulfate, sodium nitroprusside, sulfanilamide, N-(1-naphthyl)ethylenediamine dihydrochloride, Trolox and MTT (3‑(4,5‑dimethylthiazol‑2‑yl)-2,5‑diphenyltetrazolium bromide) were purchased from Sigma-Aldrich (St. Louis, MO, USA), while isopropanol, phosphoric acid and other routine reagents were of analytical grade (Merck, Germany). Cell culture reagents including RPMI‑1640 medium, fetal bovine serum, L‑glutamine, penicillin G and streptomycin were obtained from Gibco (Thermo Fisher Scientific, Waltham, MA, USA). FTIR‑ATR spectra of bee pollen were recorded on a JASCO FT/IR‑4600 spectrometer equipped with a diamond ATR crystal (JASCO Corporation, Tokyo, Japan). Rotary evaporation of extracts was performed using a Rotavapor R‑210 (BUCHI, Flawil, Switzerland), and ultrasonic‑assisted extraction employed a DRAWELL ultrasonic extractor (DRAWELL, USA). Nanoemulsions were produced using a high‑pressure homogenizer (Microfluidizer M‑110P, Microfluidics, Westwood, MA, USA), and particle size and zeta potential were evaluated using a dynamic light scattering instrument (Zetasizer Nano ZS, Malvern Panalytical, Malvern, UK). Absorbance in antioxidant, anti‑inflammatory and cytotoxicity assays was measured using a microplate reader (Bio‑Rad, Richmond, CA, USA).
Preparation of bee pollen extract
Bee pollen processed 2 ways, obtained from Big Bee Farm in Thailand, was prepared as follows:
Maceration method
For the extraction, the bee pollen was grounded to a fine powder and then extracted with 95% v/v ethanol in the proportion of 1:4 (w/v). The combination was shaken at 30 °C and 100 rpm for 8 h, and then incubated at room temperature for 24 h. The filtrate was filtered using Whatman No. 1 filter paper after which a clear, sediment free solution was obtained. This extraction was repeated 5 times. Finally, the solvent was evaporated using a rotary evaporator (BUCHI, Switzerland) under vacuum pressure of 175 mbar at 50 °C, 20 rpm, for approximately 60 min until complete solvent removal [20].
Ultrasonic-assisted extraction method
Bee pollen was pulverized and then extracted with 95% v/v ethanol (1:4 w/v). The mixture was ultrasonicated at a frequency of 25 kHz (DRAWELL ultrasonic extractor, USA) at controlled parameters (60 °C for 60 min) using sonication for extraction. The extract was further filtered with Whatman No. 1 filter paper until a clear and free from sediments solution was obtained. This extraction step was repeated 5 times. The solvent was evaporated using a rotary evaporator (BUCHI, Switzerland) at the same conditions as in the maceration method (175 mbar vacuum pressure and 50 °C, 20 rpm) for approximately 60 min until complete solvent removal. The extracts obtained by both the methods were assured by percentage yield (%) using the equation:

The extract was preserved in a dark container at 4 °C to prevent damage until further analysis.
Antioxidant activity of bee pollen extract
DPPH assay
The DPPH solution (0.2 mM) was obtained by dissolving 0.04 g of DPPH in 100 mL of ethanol. The mixture was homogenized with the aid of a vortex mixer before being covered with aluminum foil or kept in a dark container and stored at 4 °C prior to analysis. For the assay, 0.1 mL of crude BP extract was placed in triplicate test tubes. Then 2.9 mL of the prepared DPPH solution was added to each of the tubes of the extract to start the reaction. All samples were combined and incubated in the dark for 30 min. The absorbance was measured at 517 nm. The antioxidant capacity of the crude bee pollen extract was calculated and the IC50 value (the concentration of the extract which inhibits 50% of DPPH radicals) was established [21,22].
ABTS radical scavenging assay
The antioxidant ability of bee pollen extract was measured using the 2,2′-azino-bis(3-ethylbenzothiazoline-6-sulfonic acid) (ABTS) radical cation decolorization assay [23]. Briefly, the ABTS stock solution was prepared by dissolving 0.0496 g of ABTS in DI water, in a volume of 50 mL using a volumetric flask. The solution was wrapped with aluminum foil to avoid light exposure and aged for 14 - 16 h [24]. The potassium persulfate (K₃S₅O₈–) solution was generated by dissolving 0.0166 g of K3S5O8 in DI water, and the volume was made up to 25 mL using a volumetric flask, also kept in the dark using aluminum foil for 14 - 16 h. Working ABTS radical solution was prepared by mixing the ABTS solution with K3S5O8 at 1:0.5. The resulting mixture was diluted 20 times to obtain an absorbance of 0.7 - 1.0. Trolox was employed as the standard antioxidant and was prepared at 1,000 mg/L concentration in methanol by dissolving 0.0499 g of Trolox, and the total volume was made up to 50 mL in a volumetric flask. The reference solution was kept in the dark by covering it with an aluminum foil [25].
Nitric Oxide (NO) radical scavenging assay
Nitric oxide radical scavenging activity (NO) was evaluated according to the method described earlier. NO scavenging activity was evaluated by sodium nitroprusside NO-generating method. The assay comprised 50 μL 10 mM sodium nitroprusside in PBS into wells of 96-well plate with bee pollen crude extract supplemented. After then, 100 μL of Griess reagent (2% sulfanilamide in 4% phosphoric acid plus 0.2% naphthylethylenediamine) was added and incubated for 2 h. The absorbance was read at 540 nm, and the antioxidant activity (AE) of the bee pollen crude extract was determined. The scavenging takes place when the antioxidants compete with oxygen resulting in decreased generation of NO. This technique allows a quantitative evaluation of the capacity of the extract to prevent nitrite release by scavenging NO [26].
All IC50 values for antioxidant and anti‑inflammatory assays are reported as micrograms of bee pollen extract per milliliter (µg/mL) of the corresponding reaction or culture medium.
Anti-inflammatory activity
Murine monocyte-derived macrophage cell line, RAW 264.7 cells, were maintained in the complete medium, RPMI-640 medium containing 3.7 µg/mL NaHCO3, 2 mM glutamine, 100 U/mL penicillin G, 100 µg/mL streptomycin, and 10% fetal bovine serum. The cells were incubated at 37° C under a humidified atmosphere of 5% CO2. The adherent cells were disassociated by trypsin-EDTA solution prior to the experiments. The cells were incubated with 10, 20, 30 and 40 µg/mL of bee pollen extract or 10, 25, 50 and 100 µg/mL of Eryngium foetidum extract for 24 h in a CO2 incubator [27]. The 100 µL of supernatant were mixed in 100 µL Griess reagent (0.5% sulfanilamide, 0.05% N-(1-Naphthyl) ethylenediamine dihydrochloride in 2.5% H3PO4) in 96-well tissue culture plates [28] after incubation. The reaction mixture was incubated for 20 min at 37 °C, and absorbance at 570 nm was assessed in an ELISA plate reader. The data were obtained by subtracting values from unstimulated control wells without LPS stimulus, and IC50 values (as-free concentrations) were determined relative to control wells without test substance [29]. This approach allows assessing anti-inflammatory properties by suppressing nitric oxide production, an important inflammatory mediator generated by activated macrophages.
Cytotoxicity MTT assay
Cell cytotoxicity was evaluated by the MTT (3-(4,5-dimethylthiazol-2-yl)-2,5-diphenyltetrazolium bromide) assay, that determines mitochondrial dehydrogenase activity in living cells. RAW264. Seven macrophage cells were cultured in 96-well flat-bottomed plates in 100 μl medium containing 5×10⁴ cells per well and co-incubated in a CO2 incubator for 1 - 2 h for adherence of cells. Test compounds (100 μL) were added at nominal concentrations of 10, 25, 50, and 100 µg/mL and the cells were then incubated for 48 h at 37 °C in a humidified atmosphere of 5% CO2. Following an incubation, the culture media was aspirated from the cells and 10 μL of MTT solution (5 µg/mL in PBS) was added into each well. The plates were then re-incubated for another 2 h for the formazan crystals to form. Afterwards, adding 100 μl of 0.04 N HCl in isopropanol dissolved the purple formazan crystals. The absorbance was read at 570 nm in an ELISA reader (Bio-Rad, Richmond, CA). Cell viability (%) was estimated by comparing OD values obtained from treated and untreated control cells. Each experiment was conducted in triplicate [30].
Experimental designs of nanoemulsion by Response Surface Methodology (RSM)
The experimental design used for optimization of nano emulsion formulations by Response Surface Methodology (RSM) was performed using Design-Expert software, a dedicated tool for multi-factor Design of Experiments (DOE) that allows to analyze and optimize the process through mathematical models. In this study, a Box-Behnken Design (BBD) was adopted to develop quadratic models using surfactant concentration (X₁, 1% - 3%), homogenization time (X₂, 10 - 30 min), and the pressure (X₃, 2,500 - 7,500 psi) as independent variables at 3 coded levels (−1, 0 and +1). These experimental and coded values of the 3 independent factors were employed to optimize the design of bee pollen extract nano emulsion for best performance using Response Surface Methodology (RSM) at high, medium and low levels (Table 1).
Table 1 The actual levels of independent variables at factor levels used in RSM.
Symbols |
Independent variables |
Actual levels at factor levels |
||
−1 |
0 |
1 |
||
X1 |
Surfactant Percentage (%) |
1 |
2 |
3 |
X2 |
Time (Min.) |
10 |
20 |
30 |
X3 |
Pressure (psi) |
2,500 |
5,000 |
7,500 |
In this study, the 3 independent factors were fixed at the following actual ranges: Surfactant concentration 1% (w/w) - 3% (w/w), homogenization time 10 - 30 min, and homogenization pressure 2,500 - 7,500 psi, which correspond to the coded levels −1, 0, and +1 listed in Table 1. These ranges were selected based on preliminary screening experiments, which showed that surfactant contents below 1% led to rapid phase separation, whereas levels above 3% did not further reduce droplet size and tended to decrease the magnitude of zeta potential, processing times shorter than 10 min yielded incompletely emulsified systems, while times longer than 30 min caused over-processing without meaningful size reduction, and pressures below 2,500 psi produced coarse emulsions, whereas pressures beyond 7,500 psi increased droplet size due to shear-induced coalescence.
The 1st degree Hadamard spherical response surface plane was utilized to analyze the impact of independent variables (X1, X2 and X3) on the observations for 2 years based on a set of a total of 17 experiments conducted to produce the appropriate conditions for the size of the nanoparticle and zeta potential, involving 3 experiments at the center point. Response Surface Methodology was utilized for optimizing experimental conditions via response surface methodology via Box-Behnken designs in Design Expert Ver. 13. This elaborate statistical tool depends on the principles of experimental design and mathematical modeling to determine the relationships between multiple independent variables and the outcome. Result analysis depends on the anticipated quadratic regression models, which are used to create optimal response points based on a composite desirability function values between 0 and 1. The primary steps include experimental design, such as central composite design data collection, number of factors response equations, and parameter optimization, undertaken via algorithms such as modified differential evolution, to produce accuracy according to several constraints. The study was developed as follows: Factor 1 Surfactant: 1% - 3%, Factor 2 Pressure: 2,500 - 7,500 psi and Factor 3 Time: 10 - 130 min. As shown in Table 2. After determining the 17 conditions by the analytical program, the formulations of the nano emulsion were conducted using a high-pressure homogenizer reducing the size of the particle, which was the Microfluidizer (MODEL: M-110P, USA). The formulations were then analyzed about the size of the particle and the zeta potential to explore correlations between the 2 observations over the various conditions. The conditions chosen by the program were finally formulated experimentally 3 times to increase accuracy and verify the predicted point.
Table 2 Experimental design based on the Box–Behnken method for factor variation.
| Run | Factor 1 (X1): Surfactant (%) |
Factor 2 (X2): Pressure (psi) |
Factor 3 (X3): Time (min) |
|---|---|---|---|
| 1 | 2 | 5,000 | 20 |
| 2 | 1 | 5,000 | 30 |
| 3 | 1 | 5,000 | 10 |
| 4 | 3 | 5,000 | 10 |
| 5 | 2 | 5,000 | 20 |
| 6 | 3 | 5,000 | 10 |
| 7 | 1 | 2,500 | 20 |
| 8 | 2 | 2,500 | 30 |
| 9 | 3 | 5,000 | 30 |
| 10 | 3 | 7,500 | 20 |
| 11 | 1 | 2,500 | 20 |
| 12 | 2 | 5,000 | 20 |
| 13 | 2 | 7,500 | 10 |
| 14 | 2 | 5,000 | 20 |
| 15 | 2 | 5,000 | 20 |
| 16 | 1 | 7,500 | 20 |
| 17 | 2 | 7,500 | 30 |
FTIR-ATR spectroscopy and spectral data processing
Bee pollen samples were analyzed for their structural characteristics and functional groups using attenuated total reflection-Fourier transform infrared (ATR‑FTIR) spectroscopy. The measurements were carried out with a JASCO 4,600 spectrometer equipped with a diamond crystal, on which individual bee pollen granules were placed and pressed to ensure intimate contact with the ATR surface. Spectra were recorded in the wavenumber range of 400 - 4,000 cm−1, with 32 scans accumulated at a resolution of 4 cm−1 for each sample, and the resulting spectra were exported and re‑plotted using GraphPad Prism 10 for subsequent analysis of the absorption bands corresponding to characteristic functional groups present in the bee pollen matrix [31].
Particle size and Zeta potential measurement of nano emulsion
Particle Size and Zeta Potential Measurement of Nano emulsion the prepared nano emulsion formulations with the proper ratio were chosen for measurement of particle size by using a particle size analyzer, Zetasizer Nano Micromeritics; MODEL: Nanoplus. Scattering was performed in an optical quality 3 mL borosilicate cell in 90° angle. The samples were iso-osmotically diluted in distilled water to avoid multiple scattering effects [32]. A diluted sample of the emulsion with approximately 250 µL, was put into 50 mL beaker with 100 mL of deionized water whilst gently mixing with glass rod [33]. The temperature was kept at 25 °C constant style [34]. The nanoparticle size, polydispersity index, and zeta potential of the nano emulsions are reported herein. The process is based on dynamic light scattering, using a helium-neon laser of 633 nm wavelength and detection angle of 173°. In this process, every measurement was performed in quintuplicate to achieve accuracy.
Stability testing
The formulation of the product was titrated with distilled water to 3,000 μL and showed no phase separation after storing at room temperature for 3 days and so was picked for the experiments. Stability of the emulsions was determined by the centrifugal test with 3,500 rpm for 30 min. The accelerated stability protocol applied in this study was adapted from ICH Q1A(R2) guidelines for stability testing of new drug products. Visual inspection of the resultant appearance was used to check for any phase separation, indicating emulsion instability. Emulsions that showed no phase separation were further subjected to a Heating-Cooling cycle test for assessment on the influence of temperature variation on product stability. Product samples were held at 4 °C for 48 h and subsequently at test temperature for 48 h. The cycle sequence was repeated 6 times (24 days) and visual assessments were conducted during the testing period. Afterwards, the samples were retained at 25 °C and the experiment was conducted 3 times (12 days), with visual assessment. No phase separation showed emulsion stability, 24 adapted from Shafiq-un-Nabi et al. [35].
Statistical data analysis
The data are presented as means and standard deviations from at least 3 independent experiments. Statistical differences between groups were analyzed using One-Way ANOVA, and difference comparisons were further made with a post-hoc test (p < 0.05) in GraphPad Prism 10 (GraphPad Software, Boston, MA, USA).
Results and discussion
FTIR-ATR spectroscopy and spectral data processing
The absorbance of bee pollen was recorded in the wavenumber range of 400 - 4,000 cm−1, and the resulting spectrum is presented in Figure 1. These spectral features are consistent with previous reports on bee pollen, where ATR‑FTIR bands associated with proteins, phenolics and polysaccharides have been correlated with high total polyphenol content and antioxidant activity. In the ATR‑FTIR spectra of the bee pollen, broad bands in the region 3,200 - 3,400 cm−1 were assigned to O–H and N–H stretching vibrations of phenolic compounds and proteins, whereas bands at 2,800 - 3,000 cm−1 corresponded to C–H stretching of carbohydrates and lipids. Prominent absorption in the amide I (around 1,600 - 1,700 cm−1) and amide II (around 1,500 - 1,540 cm−1) regions indicated the presence of proteinaceous constituents, which are known contributors to the nutritional and antioxidant profile of bee pollen. In addition, the signals observed between 900, and 1,200 cm−1 were attributed to C–O stretching and C–O–C vibrations of polysaccharides and other phenolic‑rich carbohydrates, further supporting the contribution of these functional groups to the overall antioxidant potential of the samples [36,37]. Previous reports have indicated that the main constituents of bee pollen are carbohydrates, proteins, amino acids and lipids, together with other minor components present at levels below 2% [38]. In this analysis, the IR spectra were interpreted based on peak positions corresponding to the functional groups of these molecular components. The absorption bands attributed to the functional groups of the compounds present in the bee pollen samples are summarized in Table 3.
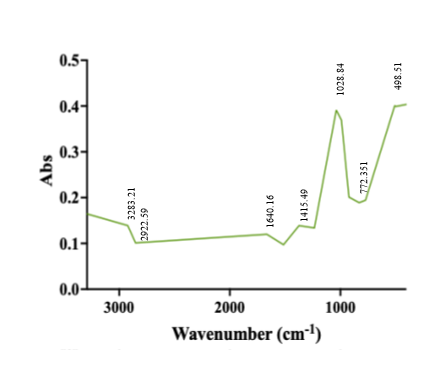
Figure 1 Characteristic FTIR-ATR spectrum of bee pollen with the assignation of major underlying molecular vibrations. The broad band around 3,283 cm−1 corresponds to O–H stretching vibrations of hydroxyl groups, while peaks near 2,922 cm−1 are attributed to C–H stretching of aliphatic chains. The band at 1,640 cm−1 is associated with C=O stretching of amide or conjugated carbonyl groups, and the peaks at 1,415 - 772 cm−1 indicate C–O and C–O–C stretching typical of carbohydrates and other pollen components.
Table 3 FTIR-ATR peak assignments of bee pollen samples.
| Peak no. | Absorption peaks from bee pollen sample (cm-1) | Assignment | Ref. |
|---|---|---|---|
| 1 | 3,283.21 | N–H stretching mode from protein and O–H stretching mode from carbohydrates (primarily glucose, fructose, and sucrose) and water. | [39] |
| 2 | 2,922.59 | C–H stretching mode from sugars, glucans, and lipids | [39] |
| 3 | 1,640.16 | C=O stretching mode from amide I of proteins | [31] |
| 4 | 1,415.49 | C-H deformation mode from lipids and cellulose | [40] |
| 5 | 1,028.84 | C-O and C-C stretching mode from sugar and protein | [39] |
The result of bee pollen extraction
The comparison of bee pollen extraction, displayed in Figure 2(a), shows that the extract produced by using ultrasonic method Figure 2(c) was darker and viscous compared to the maceration method Figure 1(b). Quantitatively, the ultrasonic extraction process extracts highest percent of crude extract and recorded as 15.8318 ± 0.13, whereas in case of maceration its value was found to be 12.1564 ± 0.06 (Table 4). The improved yield of the ultrasound-assisted extraction could be ascribed to the cavitation effect induced by ultrasonic waves that can destroy the integrity and structure of pollen matrix, promoting the bioactive compounds diffusing from inside to outside and increasing contact surface area between solvent and pollen so that resulted in a higher extraction efficiency. The effectiveness of ultrasonic extraction has been justified based on its capacity to destroy matrix structure and improve mass transfer of bioactive compounds [41,42]. Several research have reported the increase in bioactive content based on Ultrasonic extraction, especially Total Phenolic Content (TPC) and Total Flavonoid Content (TFC), that increased antioxidant property with reducing the processing time and used solvent [43]. The influence of cavitation phenomenon, caused by the ultrasonic waves, on increasing the solvent-pollen interface favors enhanced bioactive compounds release [44] making this method more efficient and eco-friendlier than conventional extraction (maceration for comparison).
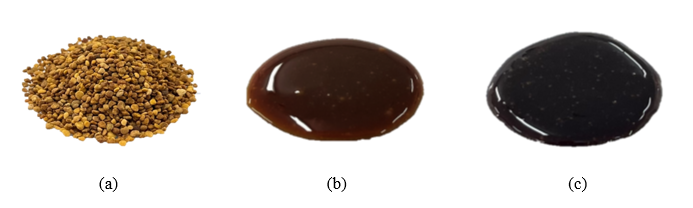 Figur
e 2 Visual characteristics of bee pollen and its extracts. (a) Bee pollen granules before extraction. (b) Bee pollen extract obtained by maceration, showing a viscous brown appearance. (c) Bee pollen extract obtained by ultrasonic extraction, exhibiting a darker and more concentrated appearance than the macerated extract.
Table 4 The comparison percentage of yield of crude bee pollen extract.
| Extraction Method | Percentage of yield (Mean ± S.D.) |
|---|---|
| Maceration | 12.1564 ± 0.06a |
| Ultrasonic | 15.8318 ± 0.13b |
Note: The values in the same column with different superscript letters are significantly different at p < 0.05.
Antioxidant activities based on test of DPPH, ABTS and NO methods
The bee pollen extracts obtained from Maceration and Ultrasonic-Assisted Extraction were screened for its antioxidant activity by DPPH and ABTS methods and anti-inflammatory (NO method). Results are shown in Table 5.
Table 5 The comparison of antioxidant activity of bee pollen extracts.
| Method | Antioxidant Activity (IC50: µg/mL) | ||
|---|---|---|---|
| DPPH | ABTS | NO | |
| Maceration | 4.00 ± 0.02a | 15.29 ± 0.50b | 15.73 ± 0.27b |
| Ultrasonic Assisted | 2.81 ± 0.02a | 12.84 ± 0.29b | 9.54 ± 0.07a |
Note: Mean values with different superscript letters within the same column are significantly different (p ≤ 0.05).
The difference in scavenging activity of DPPH on the maceration and ultrasonic method was mainly due to the cavitation effect produced during sonication. Besides, comparing IC50 values in Table 5 extract obtained from ultrasonic extractions shown significantly lower (2.81 ± 0.02 µg/mL) than that of macerations (4.00 ± 0.02 µg/mL), which is showing superior antioxidant activity. An observed acceleration effect of ultrasonication upon extraction rate is the increased localized high temperature and pressure from cavitation bubble collapse that facilitates disruption of cell walls and increases the mass transfer of antioxidant compounds into the solvent [45]. The cavitation favors the release of compounds complexed on the cell wall, such as polyphenols and other antioxidant components that are not so available by maceration [46]. This mechanism explains why the DPPH radical scavenging activity cannot rise more than 16% - 40% in SSAE of different plant materials compared to their corresponding maceration. Regarding ABTS radical scavenging activity, ultrasonic extraction (IC50 = 12.84 ± 0.29 µg/mL) is more efficient than maceration (IC50 = 15.29 ± 0.50 µg/mL). ABTS assay The ABTS assay acts through a different mechanism than DPPH and is based on the use of the radical cation (ABTS•+; = 414, 645, 734 and 815 nm) [47]. Ultrasonic extraction is more effective than small sample preparation in the ABTS method due to a wider range of extracted antioxidant substances, including both polar and non-polar antioxidants. Contrary to DPPH that is an adequate indicator of the activity that involves solely hydrogen atom transfer, the ABTS assay may also detect compounds which act through electron transfer [48]. The advantage of the ultrasonic treatment lies in part in its ability to extract substances with different stoichiometry to ABTS radicals as those compounds that have a larger reaction stoichiometry may scavenge several ABTS molecules per antioxidant molecule. Regarding NO inhibition, the UE is much more effective (IC50 = 9.54 ± 0.07 µg/mL) than maceration (IC50 = 15.73 ± 0.27 µg/mL). These IC50 values correspond to 9.54 ± 0.07 µg/mL and 15.73 ± 0.27 µg/mL of bee pollen extract in the reaction mixture, respectively. This difference is especially interesting because NO, although necessary for functions like blood pressure regulation and immune response under basal conditions, can cause tissue damage and inflammatory disease if produced in excess [49]. The better inhibitory effect of NO from ultrasonic extracts may be attributed to the higher content that they contain phenolic compounds and flavonoids, which have been proven to inhibit NO production in LPS-stimulated RAW 264.7 macrophage cells [50]. Ultrasounds cavitation effect of extraction seems to more effectively release components that can either scavenge NO or block the production of this molecule and inflammation pathways involved in its synthesis, to induce potential anti-inflammatory applications [51]. Taken together, it can be seen that ultrasonic assisted extraction is superior to conventional maceration in all of 3 antioxidant activity assays (DPPH assay, ABTS method and NO inhibition), with reduced IC50 values (higher antioxidant activity). This superiority might be due to the distinctive physical mechanism of UA extraction, cavitation force can enhance cell disruption and mass transfer, and release more varieties of bioactive compounds from plant materials. Differences observed between the 2 methods are more evident in complex matrices where antioxidant compounds are tightly held to cellular structures or form complexes with other biomolecules. These results indicate that the extraction method plays a crucial role in the determination of antioxidant capacity of natural products, and ultrasonic extraction demonstrates unique merits for the development of functional foods, research of medical pharmaceuticals, and examination on natural product. In agreement with our findings, several comparative studies have demonstrated that ultrasound-assisted extraction is more efficient than conventional maceration and other techniques in concentrating antioxidant constituents. Previous reported that ultrasonication of propolis using 70% ethanol yielded higher extraction efficiency, total phenolic content and flavonoid content than both maceration and microwave extraction, resulting in extracts with superior radical scavenging activity. Likewise, ultrasound-assisted extraction of crude pollen significantly enhanced total polyphenol and flavonoid contents under optimized conditions, which translated into improved antioxidant capacity of the pollen extracts. Together with the lower IC50 values observed for the ultrasonic bee pollen extracts in DPPH, ABTS and NO assays in this study, these data support ultrasound-assisted extraction as a comparatively more effective and green strategy for enhancing the antioxidant activity of bee-derived ingredients [52,53]. When comparing the 3 assays, a coherent pattern was observed, in which the ultrasonic bee pollen extract consistently exhibited lower IC50 values than the macerated extract in DPPH, ABTS and NO tests, indicating a globally higher antioxidant and NO-scavenging potential. Although DPPH and ABTS are both based on radical scavenging, they operate through partially different reaction mechanisms and solvent environments, so only a moderate correlation between their results is generally expected, while the NO assay reflects the ability of phenolic- and flavonoid-rich extracts to modulate a biologically relevant reactive nitrogen species rather than a stable synthetic radical. In this context, the agreement across DPPH, ABTS and NO assays in our study suggests that the phenolic profile enriched by ultrasound-assisted extraction confers a broad-spectrum antioxidant response, consistent with previous reports that combined DPPH/ABTS/NO measurements provide complementary and partially correlated information on the antioxidant capacity of plant and bee pollen extracts [54-57].
Results of cytotoxic activity
The aims of this study were to prepare products contained of bee pollen extract in addition as skin care cosmetic ingredients. In order to determine appropriate test conditions including concentration and exposure time ensuring that analysis is not disturbed by cytotoxicity, the authors performed a cytotoxicity test using RAW 264.7 macrophage cells. The cytotoxicity was determined in RAW264.7 macrophage cells by MTT assay. This assay assesses mitochondrial activity through the number of viable cells with active mitochondria and complete reactions convert yellow reagent to purple formazan crystals [58]. The bee pollen extract extracted by an ultrasound extraction was also analyzed, and when tested against LPS-stimulated macrophages in a control experiment. This IC50 value is equivalent to 3.17 ± 0.07 µg/mL of extract per mL of culture medium. These results suggest that US-EEBP was not cytotoxic to cells. Therefore, the MTT assay is employed as a basic screening test to find out non-toxic doses of any chemical/drug agents and for calculating the inhibitory concentration (IC50) which refers to the concentration where 50% cell loss was observed [59]. This lack of effects at the cellular level may be explained by the mode of extract action (lack of involvement in apoptotic-induced cell death and no impact on mitochondrial metabolism) [60]. Mechanistically, the absence of cytotoxicity in RAW 264.7 macrophages at the concentrations tested is likely related to the balanced phytochemical profile of the bee pollen extract, in which phenolic compounds, flavonoids, amino acids and vitamins act predominantly as antioxidants and modulators of redox-sensitive signaling rather than as direct pro-apoptotic agents. Several studies have shown that polyphenol-rich bee pollen preparations can upregulate endogenous antioxidant defenses and attenuate oxidative and inflammatory damage in epithelial and immune cells without impairing basal cell viability, mainly through scavenging reactive oxygen and nitrogen species and downregulating NF-κB- and MAPK-dependent inflammatory pathways. In this context, the maintenance of mitochondrial dehydrogenase activity and cell morphology observed in our MTT assay suggests that, under the tested conditions, bee pollen constituents support cellular homeostasis and exert cytoprotective rather than cytotoxic effects in macrophages [61,62]. There is some indication that some extracts may cause false positives by chemical reaction [58]. Nevertheless, in the present study, it is clearly shown that bee pollen extract has no effects on cell viability throughout all test conditions. This information provides evidence for the safe use of this extract as a cosmetic ingredient, according to cytotoxicity evaluation standards prescribed in ISO 10993-5. In our study, no significant loss of RAW 264.7 cell viability was observed over the tested range of bee pollen extract concentrations, and the calculated IC50 for cytotoxicity was higher than the maximal concentration used in subsequent mechanistic assays, indicating that the extract can be regarded as non-cytotoxic under the experimental conditions employed.
Results of the anti-inflammatory activity
Nitric Oxide Inhibitory Assay measures the level of nitric oxide (NO), an important inflammatory mediator generated by macrophage cells, which reflects the capacity of bee pollen extracted using ultrasonic extraction to suppress NO generation. The extract suppressed the release of nitric oxide from the sample (control) up to sequential concentrations of 100, 75, 50, 25 and 10 µg/mL respectively in a concentration-dependent manner. These results indicate the anti-inflammatory activity of bee pollen extract, ultrasonic solvent extraction in decreasing nitric oxide release from LPS-stimulated macrophage as IC50 of 2.54 ± 0.21 µg/mL. The anti-inflammatory activity of the ultrasonic-extracted bee pollen in RAW 264.7 macrophages showed a remarkable decrease in NO production in a dose-dependent manner. In other words, the concentration required to inhibit 50% of NO production was 2.54 ± 0.21 µg of bee pollen extract per mL. This suggests high correlation between the concentration and inhibitory effects on nitric oxide release. Elevation of the extract concentration may result in NO inhibition rate increment between 10 to 100 µg/mL. These results coincide with the outcomes of a study on Clerodendrum petasites leaf extract where further NO inhibitory properties were observed at higher concentrations [63]. As to the mechanism of NO inhibition, it could be concerned with blocked NF-κB signaling pathways or downregulation of NOS enzyme expression. This study evidences the potential anti-inflammatory activity of bee pollen extract obtained by ultrasonic extraction method, in NO inhibition mechanisms from macrophage culture cells which is corroborated with other medicinal herb extracts.
Results of nano emulsion formulation
The optimization of nano emulsion formulations with a statistical technique such as Response Surface Methodology (RSM) combined with the Box-Behnken Design (BBD) was performed using Design Expert Ver. 13. formulation samples were found by this software. The external appearance and color of the formulations were creamish white in color, which were found to be similar for all tested samples as evident by the experimental observations. In case of the phase separation, formulation numbers 4, 5, 7, 8, 10, 11, 16 and17 exhibited separate layer formation (Figure 3), indicating that instability occurred in these nano emulsion systems. Such phase separation is also due to the coalescence of oil droplets or Ostwald ripening by energy accumulation inside the system [64]. It was reported that Ostwald ripening is considered as the main degradation in nano emulsions, especially in those retarded with low oil phase fractions [65,66].
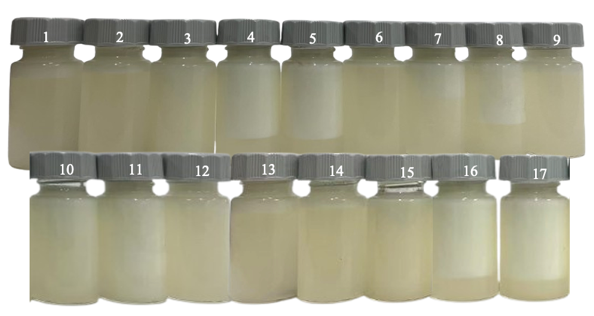
Figure 3 Nano emulsion formulations developed using Box-Behnken design (BBD) methodology from Design Expert software Ver. 13, n = 17.
Results on factor correlation in nano emulsion development
The relationships between factors (Surfactant (%), Pressure (psi), Time (min)) and responses (Particle size(nm), Zeta potential(mV)) in Table 6 show that particle size positively correlates with pressure. PARTICLE SIZE Specifically, increase in pressure to 7,000 psi causes to significantly increase the particle size (327.33 nm), decrease pressure to 3,000 psi results reduces the particle size (113.33 nm). Interestingly, the increase in homogenization pressure to 7,000 psi did not further reduce the droplet size but instead led to larger particles, which can be attributed to over-processing of the nanoemulsion. At very high energy inputs, the intense shear and turbulence increase the collision frequency between newly formed small droplets, and when the surfactant adsorption to the fresh interface is not fast enough to provide complete coverage, shear-induced coalescence and partial Ostwald ripening can occur, resulting in an apparent increase in mean particle size. Similar pressure-dependent behavior has been reported for microfluidized and high-pressure homogenized emulsions, where droplet size decreases only up to an optimum pressure, beyond which additional pressure or passes cause re-coalescence and a slight growth of the average droplet diameter [67-69]. In addition, the particle size is varied to certain extent by surfactant concentration (%), higher surfactant content (4%) has a few larger particles than 2%. By contrast, it seems that time has little influence on the particle size and only minor differences were observed across a variety of different time-points. Determination of Zeta Potential (mV) shows that the values decrease slightly with % surfactant concentration. In our system, increasing the concentration of Tween surfactant slightly enlarged the mean droplet size and reduced the magnitude of the negative zeta potential, indicating that excess non‑ionic surfactant may promote limited droplet growth and partial screening of surface charge at the oil-water interface. This trend is consistent with previous nanoemulsion studies reporting that higher Tween 80 levels can initially decrease droplet size by lowering interfacial tension, but beyond an optimum range further addition leads to droplet growth and decreased absolute zeta potential due to changes in interfacial packing and electrostatic environment [70,71]. This discovery is supported by previous studies that proposed the possibility of higher surfactant concentration resulting in lower Zeta potential values reaching till or near to the iso-electric point, beyond which it rises in some cases [72]. Furthermore, was observed that pressure has an important impact on Zeta potential with the greatest one (7,000 psi) causing a higher value of -10 mV which may be due to structural changes occurring at particle surfaces. But a very strong concentration of surfactant can reduce the Zeta potential (and its system stability). Other findings imply that the size and Zeta potential could be well controlled through pressure and production time [73]. Accordingly, such experimental observations are in general agreement with the established research activities, particularly as for the effects of pressure and surfactant on particle size and Zeta potential.
Table 6 Box-Behnken design (BBD) showing the variation of formulation conditions.
| Run | Factor 1 (X1): Surfactant (%) |
Factor 2 (X2): Pressure (psi) |
Factor 3 (X3): Time (min) |
Response 1: Particle size (nm) |
Response 2: Zeta potential (mV) |
|---|---|---|---|---|---|
| 1 | 2 | 5,000 | 20 | 262 | −20 |
| 2 | 1 | 5,000 | 30 | 284.67 | −15 |
| 3 | 1 | 5,000 | 10 | 284.33 | −14 |
| 4 | 3 | 5,000 | 10 | 113.33 | −25 |
| 5 | 2 | 5,000 | 20 | 262.33 | −20 |
| 6 | 3 | 5,000 | 10 | 113.33 | −25 |
| 7 | 1 | 2,500 | 20 | 204.67 | −22 |
| 8 | 2 | 2,500 | 30 | 275 | −17 |
| 9 | 3 | 5,000 | 30 | 114 | −24 |
| 10 | 3 | 7,500 | 20 | 327.33 | −29 |
| 11 | 1 | 2,500 | 20 | 291 | −13 |
| 12 | 2 | 5,000 | 20 | 263 | −20 |
| 13 | 2 | 7,500 | 10 | 293.33 | −22 |
| 14 | 2 | 5,000 | 20 | 262.67 | −20 |
| 15 | 2 | 5,000 | 20 | 264.67 | −20 |
| 16 | 1 | 7,500 | 20 | 312.67 | −17 |
| 17 | 2 | 7,500 | 30 | 298 | −22 |
Particle size distribution analysis and measurement of zeta potential yield important information on the stability degree of colloidal systems. Figure 4(a) shows the particle size distribution in nanometers measured by Dynamic Light Scattering (DLS), a technique related to Brownian motion where larger particles move more slowly than small ones. The latter data also show particle homogeneity with the mean particle size and Polydispersity Index (PDI) are important parameters indicating system stability [74]. The surface charge property was determined in terms of zeta potential measured by Electrophoretic Light Scattering (ELS) as shown in Figure 4(b). Values of approximately 0 mV represent a state of electrostatic instability, and higher abs vol are correlated with increased stability (preventing particle aggregation) [75]. Interdependence of particle size and zeta potential plays a key role in colloidal stability: Larger particles with lower zeta potentials have higher chances to aggregate, whereas either pH or formulation changes may optimize both properties for better dispersion integrity .
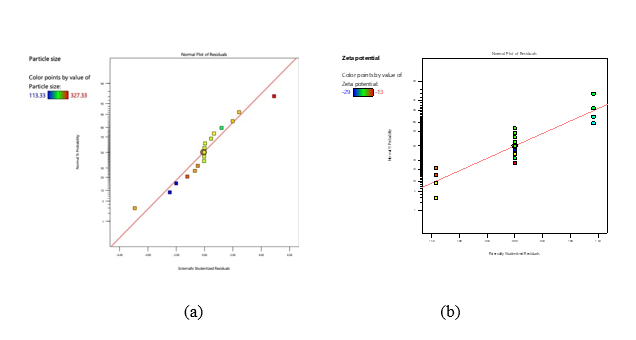
Figure 4 Normal probability plots of particle size and zeta potential. (a) Normal plot of externally studentized residuals for particle size (nm), showing that most data points fall close to the reference line, indicating an approximately normal distribution of residuals. (b) Normal plot of externally studentized residuals for zeta potential (mV), with data points also clustering around the reference line, supporting the adequacy of the model assumptions for zeta potential.
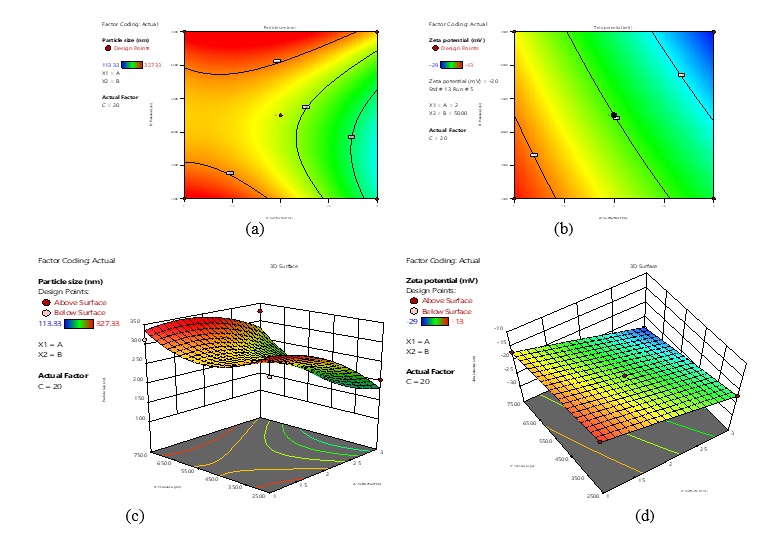
Figure 5 Contour and 3D surface plots describing the effects of pressure and surfactant concentration on particle size and zeta potential. (a) Contour plot of particle size (nm) as a function of pressure (psi) and surfactant concentration (%), illustrating regions where smaller particle sizes are obtained. (b) Contour plot of zeta potential (mV) as a function of pressure and surfactant concentration, highlighting conditions that yield more negative surface charge. (c) Three-dimensional response surface of particle size showing the combined influence of pressure and surfactant concentration on nanoscale dimensions. (d) Three-dimensional response surface of zeta potential depicting how changes in pressure and surfactant concentration modify the surface charge of the particles.
The contour plot s of Figure 5(a) show that the particle size decreases with increase in pressure and
surfactant concentration. The increased shear forces caused by pressure increase particle fragmentation while surfactants prevent particles from aggregating due to stabilization at the interface [77,78]. As can be seen in Figure 4(b), the value of zeta potential increased with surfactant concentration, which implies a better electrostatic stabilization due to better surface charge density [79,80]. The 3D surface plot of Figure 5(c) exhibits the particle size reduction in optimum pressure-surfactant regions, however; above optimum surfactant concentration leads to the particles re-aggregation due to micelles formation. Moreover, the correlation between surfactant concentration and zeta potential increment shown in Figure 5(d), further supports colloidal stability via an electrostatic repulsion mechanism [81]. Collectively, these observations emphasize the vital role of process parameters in establishing stability of nano-colloidal systems.
Prior studies have shown that increasing surfactant will significantly reduce particle size due to reduction of surface tension and depressing particle aggregation. Higher Zeta potential is also related to better stability of the system, so non-ionic surfactants including Tween 80 are able to increase Zeta potential dramatically. In addition, application of high shear forces between particles during product formation (e.g. microfluidization or homogenization) facilitates reduction in particle size. Use of surfactant with these high-pressure techniques produce smaller and more stable particles. Graph data and studies provide evidence that the pressure and surfactant are key factors to control particle size and zeta potential: first, while pressure drives particle size down by means of physical breakdown mechanisms, Surfactant plays a role maintaining system stability acting on Zeta potential values which in turn reduce aggregation [77].
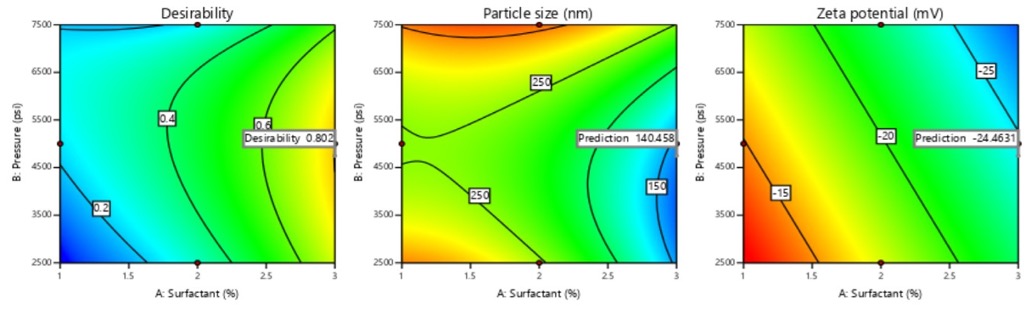
Figure 6 Desirability and response contour plots used to determine the optimal formulation conditions. (a) Desirability contour plot as a function of surfactant concentration (%) and pressure (psi), indicating the region with the highest overall desirability for simultaneous optimization. (b) Contour plot of particle size (nm) showing the predicted nanoparticle size at the optimal conditions suggested by the model. (c) Contour plot of zeta potential (mV) illustrating the predicted surface charge at the same optimal conditions, ensuring sufficient colloidal stability.
Figure 6 plots the outcomes of our study through 3 different graphical parts: Design log, Particle size (nm), Zeta potential (mV). These sections demonstrate the effects of different parameters on the measured responses by the experimental system. The log of the experimental design as a function of changes in the parameter values for X₁, and X₂ is based on Model (C = 10). The green shaded region shows the values of response for the balanced combination of X₁ and X₂ which will lead to optimal experimental parameters. The Particle size analysis demonstrates that nanoparticles on smaller sizes, marked by green and yellow areas in the figure, would contribute to improve process efficiency of chemical and biological processes due to surface area exposure [82]. The Zeta potential curve reveals the colloidal stability, and green and yellow areas point to optimal stability range. Within these ranges, higher absolute potential values inhibit particle aggregation via electrostatic repulsion according to the colloidal science principles.
Results of emulsion stability tests
The stability analysis data of the nanoemulsion formulations shown in Table 7 revealed that most formulations passed through centrifugation, cooling heating and freeze thaw studies, which are typical accelerated testing to simulate long term storage conditions however few (formulations 4, 5, 7, 8, 10, 11 and 16) showed phase separation at least during thermal cycling and freeze-thaw stress studies. This finding is in accordance with the confirmations of Restu et al. [83] that reported these methods as suitable approaches for physical stability prediction of nanoemulsions. The poor stability observed in some formulations was probably due to the unfavorable surfactant proportions combined with interfacial film properties, since particle size distribution and viscosity can act directly on emulsion destabilization mechanisms including coalescence and Ostwald ripening. Overall, the formulations that exhibited macroscopic phase separation are unlikely to be suitable for direct commercialization without further optimization. To prevent this instability, future work should focus on adjusting the surfactant-to-oil ratio, introducing an appropriate cosurfactant, and modifying the oil phase composition to reduce Ostwald ripening, while simultaneously increasing the viscosity of the continuous phase and refining homogenization parameters to obtain smaller and more narrowly distributed droplets. These strategies have been widely reported to expand the nanoemulsion region and to improve the long-term physical stability of cosmetic and food-grade nanoemulsions [84,85].
Table 7 Emulsion stability test results.
Method |
Condition |
Result |
Centrifugal test |
Centrifuged at 3,500 rpm for 30 min |
Samples 4, 5, 7, 8, 10, 11, and 16 showed phase separation in sample 17 |
Cooling-Heating cycle |
Stored at 4 and 40 °C for 48 h per cycle, alternating for 6 cycles (total 12 days) |
Samples 4, 5, 7, 8, 10, 11, and 16 showed phase separation in sample 17 |
Freezing-Thawing cycle |
Frozen at −21 °C and thawed at 25 °C for 48 h per cycle, alternating for 3 cycles (total 12 days) |
Samples 4, 5, 7, 8, 10, 11, and 16 showed phase separation in sample 17 |
Results of particle size and zeta potential measurements of nano emulsions
The in vitro studies represented in Figure 7 identifying the optimization and validation nano emulsion formulation with bee pollen extract through Response Surface Methodology (RSM) following Box-Behnken design. The appearance of the optimized nano emulsions formulations was shown in Figure 7(a) under optimal conditions (n = 3), and they appeared as transparent and homogenous liquid preparations, which indicated successful emulsion formation and its stability. What is more, Figure 7(b) also provides strong proof for the predictability of RSM-BBD model as an excellent agreement between predicted and observed experimental values for both critical quality attributes of interest is obtained. Statistical analysis shows no significant differences (p > 0.05) between the predicted values (140.46 nm for the particle size and −24.46 mV for zeta potential) and experimentally confirmed results (141.07 nm, −23.99 mV, respectively). The excellent correlation between model and experiment (∼1% variance) attests to the effectiveness and reliability of the optimization routine used for the conditioning of critical parameters for colloidal stability. The negative zeta potentials of both predicted and measured data ensure sufficient electrostatic stabilization. Moreover, with the particle size about 140 nm, nanoparticle preparation of nano emulsion has been optimized successfully by a surfactant concentration of 2% (w/w) at pressure as high as 5,000 psi in homogenizer's headspace and for a period of 30 min.
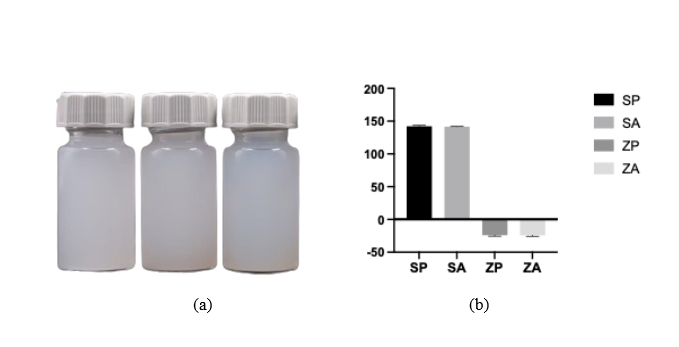
Figure 7 Nanoemulsion formulation at optimal conditions and comparison between predicted and experimental values. (a) Photograph of the nanoemulsion formulation prepared under the optimal conditions (n = 3), showing a homogeneous and visually stable dispersion. (b) Bar graph comparing predicted and actual values of particle size (SP vs. SA) and zeta potential (ZP vs. ZA); no significant differences are observed between predicted and experimental data (p > 0.05), confirming the reliability of the optimization model.
Additionally, Figure 8 shows the correlation between particle size (Figure 8(a)) and zeta potential (Figure 8(b)) for nanoemulsions with respect to nanoparticle size in terms of which decreasing particle size is associated with a decrease in its zeta potential, i.e., larger particles have relatively lower values of zeta potentials. The decreased electrostatic repulsion forces between larger particles that can facilitate particulate aggregation may account for this behavior. In the case of smaller nanoparticles with high zeta potentials, interparticle repulsion is more significant and would therefore lead to better system stability. In line with this observation, increased zeta potentials were proven to support nanoemulsion stability by enhanced electrostatic repulsion forces against coalescence [86]. The following studies reported by Mohammed et al. [87]; Zhao et al. [88] also verify that the size-zeta potential relationship is an important factor to consider when optimizing colloidal stability, where smaller highly charged particles with retained dispersion integrity exhibit repulsive forces due to electro-static charges.
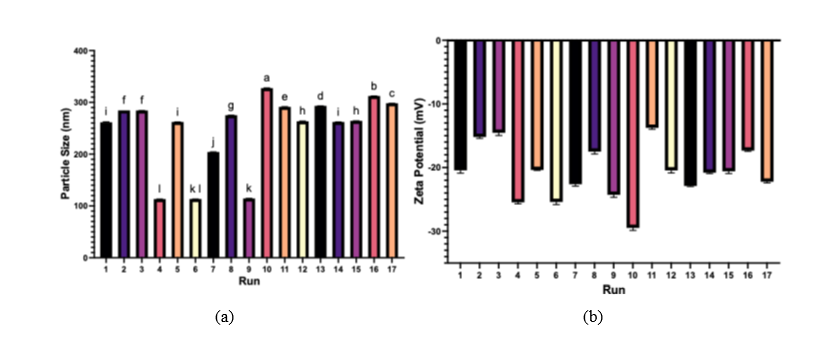
Figure 8 Particle size and zeta potential of nanoemulsions across 17 experimental runs. (a) Bar graph of particle size (nm) for each run, showing the variation in droplet size under different combinations of pressure and surfactant concentration, with error bars representing standard deviation. (b) Bar graph of zeta potential (mV) for the same runs, indicating negatively charged droplets with varying magnitudes of surface charge that reflect differences in colloidal stability among formulations.
Conclusions
The research shows that bee pollen extract had considerable antioxidant activities in DPPH, ABTS, and NO assays, while the ultrasound-assisted extract was non-cytotoxic to RAW 264.7 macrophages at the concentrations tested in the MTT assay, supporting its safe use as a cosmetic ingredient. Optimized nano emulsion formulations were designed by Box-Behnken Design (BBD) and Response Surface Methodology (RSM); instability problems, including phase separation in 8 of the 17 prepared formulations, were considered to be associated with particle size, viscosity, and selection of surfactant (Tween). Stability is influenced by surfactant concentration and the pressure used for homogenization. Higher pressure (7,000 psi) led to larger particles whereas lower pressure (3000 psi) caused stability problem. High levels of surfactant slightly increased the size of particles and decreased zeta potential, while time had almost no effect on particle size. Optimization using Design Expert 13 resulted in selecting optimum conditions (surfactant concentration: 2%, pressure: 5,000 psi, and time of formation: 30 min) to produce the nano emulsion having particle size of 140.46 nm with zeta potential of −24.46 mV checked by its reproducibility while performing experiment. Stability evaluation demonstrated that under some centrifugal, thermal and freeze-thaw conditions there were encapsulated systems which withstood comparable stresses and others that required refocusing for potential commercialization due to separation. This highlights the importance of selective tuning of surfactant systems or homogenization schemes to improve long term stability. Beyond confirming the well-established antioxidant potential of bee pollen, our study advances the field by quantitatively coupling extraction technology, bioactivity profiling and nanoemulsion engineering in a single workflow, thereby enabling a rational translation of bee pollen into a topical cosmetic platform rather than a conventional oral supplement. This explicit comparison with earlier bee pollen nanoemulsion works underscores that the novelty of our contribution lies not only in the use of RSM and Box–Behnken design, but in the combined, application-driven optimization of extraction, biological activity and nanoemulsion stability for a topical cosmetic platform. By identifying an ultrasound-assisted extract that exhibits potent DPPH, ABTS and NO scavenging without cytotoxicity and by defining an optimized set of homogenization and surfactant conditions that minimize phase separation, this work offers a practically applicable formulation space for future development of bee pollen-based dermocosmetic products.
Acknowledgements
This research was supported by the Rajamangala University of Technology Krungthep the Research fund, Thailand (F1-2567-1004).
Declaration of Generative AI in Scientific Writing
The authors used generative AI (ChatGPT) when writing this manuscript, primarily for language editing and readability. All automated processes were overseen by authors escalation, and nothing was generated or inferred by the AI.
CRediT author statement
Wannisa Keawbankrud: Methodology, Validation, Formal analysis, Writing - Original Draft, Writing - Review & Editing. Saroj Charoensak: Investigation. Phichamon Noisuwan: Methodology. Wasana Phantewee: Methodology. Petch Suthiporn: Methodology. Sasiwimol Wootthikanokkhan: Investigation and Methodology. Rutairat Suttisuwan: Conceptualization, Methodology, Investigation, Resoruces, Writing - Original Draft, Writing - Review & Editing and Project administration.
References
[1] AE Ghouizi, M Bakour, H Laaroussi, D Ousaaid, NE Menyiy, C Hano and B Lyoussi. Bee pollen as functional food: Insights into its composition and therapeutic properties. Antioxidants 2023; 12(3), 557.
[2] SI Anjum, A Ullah, F Gohar, G Raza, MI Khan, M Hameed, A Ali, CC Chen and IT Gajger. Bee pollen as a food and feed supplement and a therapeutic remedy: Recent trends in nanotechnology. Frontiers in Nutrition 2024; 11, 1371672.
[3] A Rzepecka-Stojko, J Stojko, A Kurek-Górecka, M Górecki, A Kabała-Dzik, R Kubina, A Moździerz and E Buszman. Polyphenols from bee pollen: Structure, absorption, metabolism and biological activity. Molecules 2015; 20(12), 21732- 21749.
[4] A Cavallero, F Vidotto, C Sbrana, L Peres Fabbri, G Petroni and M Gabriele. Antioxidant-rich polyfloral bee pollen exerts antimicrobial activity and anti-inflammatory effect in A549 lung epithelial cells by modulating the NF-κB pathway. Foods 2025; 14(5), 802.
[5] SI Anjum, A Ullah, F Gohar, G Raza, MI Khan, M Hameed, A Ali, CC Chen and IT Gajger. Bee pollen as a food and feed supplement and a therapeutic remedy: Recent trends in nanotechnology. Frontiers in Nutrition 2024; 11, 1371672.
[6] HR El-Seedi, N Zhao, Y Al-Naggar, SM Alsharif, HE Tahir, B Xu, K Wang, SAEid, AAA El-Wahed, ME Rateb, HS Afifi, AF Algethami and CM Khalifa. Honey bee products: Preclinical and clinical studies of their anti-inflammatory and immunomodulatory properties. Frontiers in Nutrition 2022; 8, 761267.
[7] NM Naibaho, W Fatriasari, IW Kusuma and ET Arung. Phytochemical screening, antioxidant and anti-inflammatory properties of several stingless bee pollens processed using different drying methods. Uludağ Bee Journal 2023; 23(2), 153-166.
[8] M Oroian, F Dranca and F Ursachi. Comparative evaluation of maceration, microwave and ultrasonic-assisted extraction of phenolic compounds from propolis. Journal of Food Science and Technology 2020; 57(1), 70-78.
[9] CI Ilie, E Oprea, EI Geana, A Spoiala, M Buleandra, GG Pircalabioru, IA Badea, D Ficai, E Andronescu, A Ficai and LM Ditu. Bee pollen extracts: Chemical composition, antioxidant properties, and effect on the growth of selected probiotic and pathogenic bacteria. Antioxidants 2022; 11(5), 959.
[10] T Eteraf-Oskouei, A Shafiee-Khamneh, F Heshmati-Afshar and A Delazar. Anti-inflammatory and anti-angiogenesis effect of bee pollen methanolic extract using air pouch model of inflammation. Research in Pharmaceutical Sciences 2020; 15(1), 66-75.
[11] J Kocot, M Kiełczykowska, D Luchowska-Kocot, J Kurzepa and I Musik. Antioxidant Potential of Propolis, Bee Pollen, and Royal Jelly: Possible Medical Application. Oxidative Medicine and Cellular Longevity 2018; 2018, 7074209.
[12] Y Yang, JL Zhang, Q Zhou, L Wang, W Huang and RD Wang. Effect of ultrasonic and ball-milling treatment on cell wall, nutrients, and antioxidant capacity of rose (Rosa rugosa) bee pollen, and identification of bioactive components. Journal of the Science of Food and Agriculture 2019; 99(12), 5350-5357.
[13] Y Bi, S Luo, J Ni, S Miao, Z Ning, Z Zhang, S Xu, W Tian, W Peng and X Fang. Effect of ultrasonic treatment on the microstructure, antioxidant activities and metabolites of camellia bee pollen. Ultrasonics Sonochemistry 2025; 118, 107359.
[14] AS Rozman, N Hashim, B Maringgal and K Abdan. Optimisation of stingless bee honey nanoemulsions using response surface methodology. Foods 2021; 10(9), 2133.
[15] Preeti, S Sambhakar, R Malik S Bhatia, A Al Harrasi, C Rani, R Saharan, S Kumar, Geeta and R Sehrawat. Nanoemulsion: An emerging novel technology for improving the bioavailability of drugs. Scientifica 2023; 2023, 6640103.
[16] B Iskandar, TW Liu, HC Mei, IC Kuo, MDC Surboyo, HM Lin and CK Lee. Herbal nanoemulsions in cosmetic science: A comprehensive review of design, preparation, formulation, and characterization. Journal of Food and Drug Analysis 2024; 32(4), 4.
[17] RY Valdivia-Olivares, EA Martinez-González, G Montenegro, R Bridi, MJ Alvarez-Figueroa and JV González-Aramundiz. Innovative multiple nanoemulsion (W/O/W) based on Chilean honeybee pollen improves their permeability, antioxidant and antibacterial activity. Food Research International 2023; 168, 112767.
[18] M Jaiswal, R Dudhe and PK Sharma. Nanoemulsion: An advanced mode of drug delivery system. 3 Biotech 2015; 5(2), 123-127.
[19] RY Valdivia-Olivares, EA Martinez-González, G Montenegro, R Bridi, MJ Alvarez-Figueroa and JV González-Aramundiz. Innovative multiple nanoemulsion (W/O/W) based on Chilean honeybee pollen improves their permeability, antioxidant and antibacterial activity. Food Research International 2023; 168, 112767.
[20] P Lertkaeo, J Yansakol, K Yoothit, S Kongputorn and T Promma. Comparison of traditional and ultrasonic-assisted extraction methods on anthocyanin, total phenolic compounds and antioxidant activity of Homdaeng st.1 and Homdum st.2 brown rice. PSRU Journal of Science and Technology 2021; 6(1), 109-122.
[21] AJO Lopes, CC Vasconcelos, JBS Garcia, MS Dória Pinheiro, FAN Pereira, DS Camelo, SV Morais, JRB Freitas, CQD Rocha, MN de Sousa Ribeiro and MS do Socorro de Sousa Cartágenes. Anti-Inflammatory and antioxidant activity of pollen extract collected by Scaptotrigona affinis postica: In silico, in vitro, and in vivo studies. Antioxidants 2020; 9(2), 103.
[22] J Deng, W Cheng and G Yang. A novel antioxidant activity index (AAU) for natural products using the DPPH assay. Food Chemistry 2011; 125(4), 1430-1435.
[23] R Re, N Pellegrini, A Proteggente, A Pannala, M Yang and C Rice-Evans. Antioxidant activity applying an improved ABTS radical cation decolorization assay. Free Radical Biology and Medicine 1999; 26(9-10), 1231-1237.
[24] IR Ilyasov, VL Beloborodov, IA Selivanova and RP Terekhov. ABTS/PP decolorization assay of antioxidant capacity reaction pathways. International Journal of Molecular Sciences 2020; 21(3), 1131.
[25] Y Cai, Q Luo, M Sun and H Corke. Antioxidant activity and phenolic compounds of 112 traditional Chinese medicinal plants associated with anticancer. Life Sciences 2004; 74(17), 2157-2184.
[26] R Govindarajan, S Rastogi, M Vijayakumar, A Shirwaikar, AKS Rawat, S Mehrotra and P Pushpangadan. Studies on the antioxidant activities of Desmodium gangeticum. Biological and pharmaceutical Bulletin 2003; 26(10), 1424-1427.
[27] T Saisavoey, P Sangtanoo, C Chanchao, O Reamtong and A Karnchanatat. Identification of novel anti-inflammatory peptides from bee pollen (Apis mellifera) hydrolysate in lipopolysaccharide-stimulated RAW264.7 macrophages. Journal of Apicultural Research 2021; 60(2), 280-289.
[28] E Moita, A Gil-Izquierdo, C Sousa, F Ferreres and LR Silva. Integrated analysis of COX-2 and iNOS derived inflammatory mediators in LPS-stimulated RAW macrophages pre-exposed to Echium plantagineum L. bee pollen extract. PLoS One 2013; 8(3), 59131.
[29] JE Kwak, JY Lee, JY Baek, SW Kim and MR Ahn. The antioxidant and anti-inflammatory properties of bee pollen from acorn (Quercus acutissima Carr.) and Darae (Actinidia arguta). Antioxidants 2024; 13(8), 981.
[30] P Srikoon, R Kariya, E Kudo, H Goto, K Vaeteewoottacharn, M Taura, S Wongkham and S Okada. Diethyldithiocarbamate suppresses an NF-κB dependent metastatic pathway in cholangiocarcinoma cells. Asian Pacific Journal of Cancer Prevention 2013; 14(7), 4441-4446.
[31] S Prđun, L Svečnjak, M Valentić, Z Marijanović and I Jerković. Characterization of bee pollen: physico-chemical properties, headspace composition and FTIR spectral profiles. Foods 2021; 10(9), 2103.
[32] SNA S Azhar, SE Ashari and N Salim. Development of a kojic monooleate-enriched oil-in-water nanoemulsion as a potential carrier for hyperpigmentation treatment. International Journal of Nanomedicine 2018; 13, 646.
[33] R Raviadaran, D Chandran, LH Shin and S Manickam. Optimization of palm oil in water nano-emulsion with curcumin using microfluidizer and response surface methodology. LWT 2018; 96, 58-65.
[34] V Piazzini, E Monteforte, C Luceri, E Bigagli, AR Bilia and MC Bergonzi. Nanoemulsion for improving solubility and permeability of Vitex agnus-castus extract: Formulation and in vitro evaluation using PAMPA and Caco-2 approaches. Drug Delivery 2017; 24(1), 380-390.
[35] S Shafiq-Un-Nabi, F Shakeel, S Talegaonkar, J Ali, S Baboota, A Ahuja, RK Khar and M Ali. Formulation development and optimization using nanoemulsion technique: A technical note. Journal of the American Association of Pharmaceutical Scientists 2007; 8(2), 28.
[36] S Zeghoud, A Rebiai, H Hemmami, B Ben Seghir, N Elboughdiri, S Ghareba, D Ghernaout and N Abbas. ATR-FTIR spectroscopy, HPLC chromatography, and multivariate analysis for controlling bee pollen quality in some Algerian regions. ACS Omega 2021; 6(7), 4878-4887.
[37] A Kenđel and B Zimmermann. Chemical analysis of pollen by FT-Raman and FTIR spectroscopies. Frontiers in Plant Science 2020; 11, 352.
[38] SAM Khalifa, MH Elashal, N Yosri, M Du, SG Musharraf, L Nahar, S Sarker, Z Guo, W Cao, X Zou, AA El-Wahed, J Xiao, HA Omar, MF Hegazy and HR El-Seedi. Bee pollen: Current status and therapeutic potential. Nutrients 2021; 13(6), 1876.
[39] S Castiglioni, P Astolfi, C Conti, E Monaci, M Stefano and P Carloni. Morphological, physicochemical and FTIR Spectroscopic properties of bee pollen loads from different botanical origin. Molecules 2019; 24(21), 3974.
[40] R Bleha, TV Shevtsova, M Živčáková, A Korbářová, M Ježková, I Saloň, J Brindza and A Synytsya. Spectroscopic discrimination of bee pollen by composition, color, and botanical origin. Foods 2021; 10(8), 1682.
[41] OW Lyric, MC Jozlyn and EM Elmer-Rico. Comparative study of the extraction methods for the instrumental analysis of bee propolis. Journal of Teaching & Research 2021; 1, 51-60.
[42] P Shiqin, ZZ Meifei, LL Shanshan, M Xiaobin and H Fuliang. Ultrasound-assisted extraction of polyphenols from Chinese propolis. Frontiers in Sustainable Food System 2023; 7, 1131959.
[43] S Çelik, N Kutlu, YC Gerçek, S Bayram, R Pandiselvam and NE Bayram. Optimization of ultrasonic extraction of nutraceutical and pharmaceutical compounds from bee pollen with deep eutectic solvents using response surface methodology. Foods 2022; 11(22), 3652.
[44] M Oroian, F Ursachi and F Dranca. Ultrasound-assisted extraction of polyphenols from crude pollen. Antioxidants 2020; 9(10), 982.
[45] P Momchev, P Ciganović, M Jug, E Marguí, J Jablan and MZ Končić. Comparison of maceration and ultrasonication for green extraction of phenolic acids from Echinacea purpurea aerial parts. Molecules 2020; 25(21), 5142.
[46] GAKD Puspawati, Y Marsono, Supriyadi and R Armunanto. Comparison of sonication with maceration on antioxidant potency of anthocyanin and Karotenoid of Tamarillo (Solanum betaceaum Cav.). Agritech 2019; 38(3), 304-312.
[47] IR Ilyasov, VL Beloborodov, IA Selivanova and RP Terekhov. ABTS/PP decolorization assay of antioxidant capacity reaction pathways. International Journal of Molecular Sciences 2020; 21(3), 1131.
[48] JW Dong, L Cai, Y Xing, J Yu and ZT Ding. Re-evaluation of ABTS assay for total antioxidant capacity of natural products. Natural Product Communications 2015; 10(12), 2169-2172.
[49] HL Chen, XZ Lan, YY Wu, YW Ou, TC Chen and WT Wu. The antioxidant activity and nitric oxide production of extracts obtained from the leaves of Chenopodium quinoa Willd. Biomedicine 2017; 7(4), 24.
[50] Y Chung, JY Park, JE Lee, KT Kim and HD Paik. Antioxidant activity and inhibitory effect on nitric oxide production of hydroponic ginseng fermented with lactococcus lactis KC24. Antioxidants 2021; 10(10), 1614.
[51] OE Etim, SE Ekanem and SM Sam. In vitro antioxidant activity and nitric oxide scavenging activity of Citrullus lanatus seeds. Journal of Natural Sciences Research 2013; 3(12), 126-132.
[52] M Oroian, F Ursachi and F Dranca. Ultrasound-assisted extraction of polyphenols from crude pollen. Antioxidants 2020; 9(4), 322.
[53] S Peng, M Zhu, S Li, X Ma and F Hu. Ultrasound-assisted extraction of polyphenols from Chinese propolis. Frontiers in Sustainable Food Systems 2023; 7, 1131959.
[54] A Untea, A Lupu, M Saracila and T Panaite. Comparison of ABTS, DPPH, phosphomolybdenum assays for estimating antioxidant activity and phenolic compounds in five different plant extracts. Bulletin UASVM Animal Science and Biotechnologies 2018; 75(2), 110.
[55] A Łepecka and D Kołożyn-Krajewska. Antioxidant properties of food-derived lactic acid bacteria: A review. Microbial Biotechnology 2025; 18(9), 70229.
[56] N Chaves, A Santiago and JC Alías. Quantification of the antioxidant activity of plant extracts: Analysis of sensitivity and hierarchization based on the method used. Antioxidants 2020; 9(1), 76.
[57] M Platzer, S Kiese, T Herfellner, U Schweiggert-Weisz, O Miesbauer and P Eisner. Common trends and differences in antioxidant activity analysis of phenolic substances using single electron transfer based assays. Molecules 2021; 26(5), 1244.
[58] M Sirirak and M Saowanee. Selection of appropriate methods analysis of cytotoxicity. PSU Medical Journal 2023; 3(2), 85-91.
[59] D Karakas, F Ari and E Ulukaya. The MTT viability assay yields strikingly false positive viabilities although the cells are killed by some plant extracts. Turkish Journal of Biology 2017; 41, 919-925.
[60] P Supattar, P Intira and S Kasem. Cytotoxicity Activity of beauvericin and crude extracts from Beauveria sp. Rajabhat Phranakhon Research Journal 2012; 7(1), 35-43.
[61] C Rodríguez-Pólit, R Gonzalez-Pastor, J Heredia-Moya, SE Carrera-Pacheco, F Castillo-Solis, R Vallejo-Imbaquingo, C Barba-Ostria and LP Guamán. Chemical properties and biological activity of bee pollen. Molecules 2023; 28(23), 7768.
[62] A El-Ghouizi, M Bakour, H Laaroussi, D Ousaaid, N-El Menyiy, C Hano and B Lyoussi. Bee pollen as functional food: Insights into its composition and therapeutic properties. Antioxidants 2023; 12(3), 557.
[63] B Longsri, N Kanpipit, P Puthongking, P Mahakunakorn, S Tiyaworanant, BSB Sungthong and S Thapphasaraphong. Determination of a chemical marker in dipterocarpus alatus oleoresin samples and bioactivity screening via antioxidants, nitric oxide inhibition on murine RAW 264.7 cells, and collagen production on normal human dermal fibroblasts. Tropical Journal of Natural Product Research 2021; 5(5), 850-856.
[64] AD Gadhave. Nanoemulsions: Formation, stability and applications. International Journal for Research in Science and Advanced Technologies 2014; 2(3), 38-43.
[65] J Park, U Scheler and RJ Messinger. Molecular-level understanding of phase stability in phase-change nanoemulsions for thermal energy storage by NMR spectroscopy. ACS Journal of Surfaces and Colloids 2024; 40(41), 21814-21823.
[66] Q Liu, H Huang, H Chen, J Lin and Q Wang. Food-grade nanoemulsions: Preparation, stability and application in encapsulation of bioactive compounds. Molecules 2019; 24, 4242.
[67] A Gawin-Mikołajewicz, U Nawrot, KH Malec, K Krajewska, KP Nartowski and BL Karolewicz. The effect of high-pressure homogenization conditions on the physicochemical properties and stability of designed fluconazole-loaded ocular nanoemulsions. Pharmaceutics 2023; 16(1), 11.
[68] SS Galooyak and B Dabir. Three-factor response surface optimization of nano-emulsion formation using a microfluidizer. Journal of Food Science and Technology 2015; 52(5), 2558-2571.
[69] A Kumar, A Dhiman, R Suhag, R Sehrawat, A Upadhyay and DJ McClements. Comprehensive review on potential applications of microfluidization in food processing. Food Science and Biotechnology 2021; 31(1), 17-36.
[70] S Zhao, Z Wang, X Wang, B Kong, Q Liu, X Xia and H Liu. Characterization of nanoemulsions stabilized with different emulsifiers and their encapsulation efficiency for oregano essential oil: Tween 80, soybean protein isolate, tea saponin, and soy lecithin. Foods 2023; 12, 3183.
[71] T Chuacharoen, S Prasongsuk and CM Sabliov. Effect of surfactant concentrations on physicochemical properties and functionality of curcumin nanoemulsions under conditions relevant to commercial utilization. Molecules 2019; 24(15), 2744.
[72] A Yagmur and MG Zeynep. Effects of surfactants on albumin nanoparticles. Journal of Research in Pharmacy 2022; 26(5), 1177-1189.
[73] KJ Tristan, A S Ian, D Benjamin, HC Victor, G Thomas, DP Nestor and T Fangyuan. Zeta potential and size analysis of zeolitic imidazolate framework-8 nanocrystals prepared by surfactant-assisted synthesis. Langmuir 2024; 40(12), 6138-6148.
[74] TR Smith, Y Watanabe and Q Chen. Advances in dynamic light scattering for nanomaterial characterization. Analytical Chemistry Reviews 2021; 94(7), 3215-3228.
[75] LP Johnson and SH Lee. Zeta potential thresholds for nanoparticle stabilization. Langmuir 2023; 39(12), 4451-4460.
[76] R Garcia, K Tanaka and A Müller. Colloidal stability optimization through coupled DLS-ELS analysis. Journal of Nanomaterials 2022; 15(4), 112-128.
[77] V Iyer, C Cayatte, B Guzman, K Schneider-Ohrum, R Matuszak, A Snell, GM Rajani, MP McCarthy and B Muralidhara. Impact of formulation and particle size on stability and immunogenicity of oil-in-water emulsion adjuvants. Human Vaccines & Immunotherapeutics 2015; 11(7), 1853-1864.
[78] MBZ Maryam and P Akram. Effect of surfactant concentration on the particle size, stability and potential zeta of beta carotene nano lipid carrier. International Journal of Current Microbiology and Applied Sciences 2015; 4(9), 924-932.
[79] P Riangjanapatee and S Okonogi. Effect of surfactant on lycopene-loaded nanostructured lipid carriers. Drug Discoveries & Therapeutics 2012; 6(3), 163-168.
[80] MN Nur Afiqah, BM Helal Uddin, IS Zaidul, YL Chew and KB Liew. Effect of concentration of lipid with surfactant and ultrasonification power on the formation of naringenin-loaded solid lipid nanoparticles. Journal of Pharmaceutical Negative Results 2022; 13(7), 104-108.
[81] S Gupta, R Kesarla, N Chotai, A Misra and A Omri. Systematic approach for the formulation and optimization of solid lipid nanoparticles of efavirenz by high pressure homogenization using design of experiments for brain targeting and enhanced bioavailability. BioMed Research International 2017; 2017, 5984014.
[82] W Jiang, BYS Kim, JT Rutka and WCW Chan. Nanoparticle-mediated cellular response is size-dependent. Nature Nanotechnology 2020; 5(3), 146-150.
[83] WK Restu, Y Sampora, Y Meliana and A Haryono. Effect of accelerated stability test on characteristics of emulsion systems with chitosan as a stabilizer. Procedia Chemistry 2015; 16, 171-176.
[84] TB Schreiner, A Santamaria-Echart, A Ribeiro, AM Peres, MM Dias, SP Pinho and MF Barreiro. Formulation and optimization of nanoemulsions using the natural surfactant saponin from Quillaja Bark. Molecules 2020; 25(7), 1538.
[85] Y Guo, X Zhang, X Wang, L Zhang, Z Xu and D Sun. Nanoemulsions stable against Ostwald ripening. Langmuir 2024; 40(2), 1364-1372.
[86] E Bouyer, G Mekhloufi, V Rosilio, JL Grossiord and F Agnely. Proteins, polysaccharides, and their complexes used as stabilizers for emulsions: Alternatives to synthetic surfactants in the pharmaceutical field. International Journal of Pharmaceutics 2012; 436, 359-378.
[87] NK Mohammed, BJ Muhialdin and ASM Hussin. Characterization of nanoemulsion of Nigella sativa oil and its application in ice cream. Food Science and Nutrition 2020; 8(6), 2608-2618.
[88] Y Zhao, F Peng and Y Ke. Design and characterization of oil-in-water nanoemulsion for enhanced oil recovery stabilized by amphiphilic copolymer, nonionic surfactant, and LAPONITE® RD. RSC Advances 2021; 11(4), 1952-1959.