Trends
Sci.
2026;
23(5):
12144
Large-Scale Synthesis and Comprehensive Validation of 2-Hydroxypropyl-β-Cyclodextrin Equivalent to Commercial Product
Truyen
Duc Phung1,
![]() ,
Son Le Hoang2,
,
Son Le Hoang2,
![]() ,
,
Thanh
Nguyen-Kim Le2,*
![]() and
Anh Thi-Phuong Phung2
and
Anh Thi-Phuong Phung2
1Faculty of Pharmacy, Hong Bang International University, Ho Chi Minh City 700000, Vietnam
2Department of Applied Biochemistry, Faculty of Biotechnology, Ho Chi Minh City International University-
Vietnam National University, Ho Chi Minh City 700000, Vietnam
(*Corresponding author’s e-mail: [email protected])
Received: 2 October 2025, Revised: 16 October 2025, Accepted: 1 November 2025, Published: 5 January 2026
Abstract
This study was a development from a previous study, which established the method for synthesizing 2-hydroxypropyl-β-cyclodextrin (HPβCD) from β-cyclodextrin and successfully applied it in large-scale production. The large-scale synthesis of HPβCD produced 1.38 ± 0.05 kg of 2-Hydroxypropyl-β-cyclodextrin, yielding 86.77 ± 0.68%, and a degree of substitution of 5.91. The synthesis was monitored using thin-layer chromatography. The synthesized product was then structurally characterized using infrared spectroscopy, nuclear magnetic resonance spectroscopy, and mass spectroscopy, along with the commercial HPβCD. As a comparative analysis, the spectroscopic data revealed no significant structural differences between the synthesized HPβCD and a commercially available counterpart. These findings validate the developed synthesis method, highlighting its potential for industrial application and future research into the uses of HPβCD in drug development.
Keywords: β-cyclodextrin, Characterization, Hydroxypropyl-β-cyclodextrin, Structure, Synthesis
Introduction
In pharmaceutical research and development, a significant challenge lies in the poor solubility of active pharmaceutical ingredients (APIs), which have been estimated as nearly one-third of recently developed drug candidates exhibit inadequate solubility, and approximately half fail during pharmacokinetic trials [1]. Poorly soluble drugs often demonstrate slow absorption rates, insufficient bioavailability, and increased toxicity due to prolonged residence on mucosal surfaces. According to the Biopharmaceutics Classification System, for drugs with low aqueous solubility, when administered orally, the dissolution rate becomes the rate-limiting step controlling both the speed and extent of absorption [2]. Various techniques have been employed to improve the solubility and dissolution rate of poorly water-soluble drugs, including solid dispersions, nanocrystals, co-crystals, co-evaporation, co-precipitation, polymer conjugation, surface adsorption, and complexation [3,4]. Among these methods, complexation with cyclodextrins has proven highly effective in improving both solubility and dissolution rates. Within the cyclodextrin family, beta-cyclodextrin (βCD) has been extensively studied for its ability to form complexes and enhance the solubility of APIs.
However, the relatively low aqueous solubility and potential renal toxicity of βCD limit its applicability [5,6]. Hydroxyalkyl derivatives of βCD, on the other hand, offer higher aqueous solubility and lower renal toxicity [7,8]. Importantly, their ability to form complexes with drug substances remains largely unchanged, leading to a significantly greater enhancement in drug solubility and dissolution rate compared to drug-βCD complexes [9]. Globally, hydroxyalkyl derivatives of βCD have been widely adopted in drug research and development, with current research predominantly focusing on 2-hydroxypropyl-β-cyclodextrin (HPβCD) (Figure 1), with some emerging studies exploring 2-hydroxybutyl-β-cyclodextrin for improving API solubility [10,11]. Nevertheless, these materials have not yet been synthesized domestically in Vietnam and are not readily available in the local market. The successful domestic production of and related derivatives will offer local researchers and chemical manufacturers greater autonomy, enabling them to bypass complex and costly technology transfer procedures, avoid high-priced commercial imports, and mitigate the supply chain availability constraints imposed by foreign suppliers, thus a step toward national self-sufficiency in key pharmaceutical excipients.
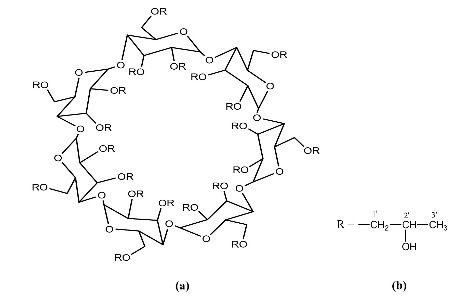
Figure 1 (a) Hydroxypropyl-β-cyclodextrin structure; (b): 1,2-propylylene oxide as the substituent unit.
This study focused on providing a method for synthesizing HBβCD, detailing its structure, and comparing the synthesized HBβCD with a commercial one available in the Vietnamese market, thereby evaluating its potential for further drug development.
Materials and methods
Preparation of the large-scale synthesized 2-Hydroxypropyl-β-cyclodextrin (in kg)
The synthesis procedure was optimized and standardized for large-scale production; the structure of the large-scale product was also characterized in the previous research of Phung et al. [12]. The large-scale synthesis commenced by dissolving 1,135 g of βCD in 150 mL NaOH 1.5% (w/v) solution within a 2,000 mL-Quickfit® round-bottom glass (FR2L/3S) and refluxing for 1.5 h. Then, 565.5 mL of 1,2-propylene oxide (2.35 g, 99% purity, 40 mmol) was added portion-wise over a period of 1 h, along with continuous refluxing at room temperature until the reaction reached completion.
The progress of the reaction was monitored by thin-layer chromatography (TLC) [13,14]. The silica gel GF254 plates were used as the stationary phase and composed of isopropanol, ethyl acetate, and water in a 5:2:2 (v/v/v) ratio as the mobile phase. Two separate TLC plates were prepared for βCD (10 μL of 0.5% aqueous solution) and the HPβCD plate, on which 10 µL of the reaction mixture and 10 µL of a 0.5% aqueous solution of an HPβCD reference standard were spotted. The spots on both plates were visualized using saturated iodine vapor. The reaction was considered complete when, on the chromatogram of the first plate, the βCD spot was no longer detected in the reaction mixture. On the second plate, the criteria for completion were that the spot corresponding to the formed product did not exhibit tailing and showed a similar Rf value to that of the HPβCD reference standard.
After neutralization at pH 7.0 by 1 M HCl, the reaction mixture was concentrated in vacuo (80 °C). The residue was dissolved in 99.5% ethanol, filtered to remove NaCl, and the product precipitated from the filtrate using acetone (0 - 5 °C). The precipitate was purified by multiple reprecipitations from 99.5% ethanol/acetone to yield a fine powder, subsequently dried in vacuo (80 °C) to constant weight. This synthesized HPβCD was then ready for further analysis.
Characterization of synthesized and commercial 2-hydroxypropyl-β-cyclodextrin
The product obtained from the initial reaction stage, after purification to ensure adequate purity, was subjected to spectroscopic analysis, including Infrared (IR) spectroscopy, 1H and 13C Nuclear Magnetic Resonance (NMR) spectroscopy, and Mass Spectrometry (MS) to confirm its structure. The standard HPβCD used as a reference for this comparison was purchased from Roquette (France), which was aligned with the European. Ph/USP standard.
Infrared spectroscopy
Infrared Spectroscopy (IR) spectra were recorded using the potassium bromide pellet technique [15]. For sample preparation, approximately 1 - 2 mg of the test substance was intimately ground with 100 - 200 mg of previously dried, spectroscopic grade KBr powder. This mixture was then uniformly spread in a suitable die and compressed under vacuum at a pressure of approximately 800 MPa to form a 13 mm diameter pellet, designed to yield a spectrum of appropriate intensity. The IR spectrum of the sample was acquired, and the presence of characteristic absorption bands for O-H, C-H, and C-O functional groups was examined. The obtained spectrum was subsequently compared with the IR spectrum of an HPβCD reference standard.
Nuclear magnetic resonance spectroscopy
1H-NMR, 13C-NMR, Distortionless Enhancement by Polarization Transfer (DEPT), Correlation Spectroscopy (COSY), Heteronuclear Single Quantum Coherence (HSQC), and Heteronuclear Multiple Bond Correlation (HMBC) spectra were acquired in deuterium oxide D2O as the solvent [16]. Measurements were performed on a Bruker AC 500 MHz NMR spectrometer. These analyses were conducted to determine H-H and H-C correlations and to elucidate the structure of the synthesized product. The resulting spectra were compared with those of β-cyclodextrin (βCD) and commercially available HPβCD.
Mass spectrometry
Mass spectra (MS) were obtained using an electrospray ionization (ESI) technique [17]. Samples were dissolved in methanol and analyzed over a mass-to-charge (m/z) range of 0 to 2,000. This analysis aimed to determine the distribution of HPβCD molecules with varying degrees of substitution (DS) within the synthesized product.
Results and discussion
Large-scale production of 2-Hydroxypropyl-β-cyclodextrin
TLC analysis yielded distinct results (Figure 2) for the starting material, the synthesized product, and the commercial product. The chromatogram of the βCD starting material displayed a single, discrete circular spot with a retention factor (Rf) value of 0.27. In contrast, the synthesized HPβCD exhibited a well-defined spot at Rf = 0.72, with no detectable trace of the unreacted βCD at Rf = 0.27. A comparative TLC analysis of the synthesized HPβCD standard revealed equivalent Rf values and comparable spot shapes, confirming the purity and identity of the synthesized product.
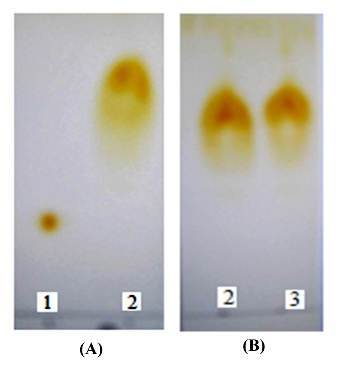
Figure 2 Chromatograms of (A): synthesized HPβCD vs. βCD and (B) synthesized HPβCD vs. commercial HPβCD, where (1): βCD, (2): synthesized HPβCD and (3) commercial HPβCD.
The large-scale synthesis of HPβCD was triplicated, given the results recorded in Table 1. The average quantity was calculated to be 1.38 ± 0.05 kg of the desired product, yielding 86.77 ± 0.68%, and a DS of 5.91, which was approximately equal to the record previous study of Truyen et al. [12] with 1.28 kg product, yielding 86.79%, and a DS of 5.91 [12].
Table 1 Large-scale production of HPβCD in triplicate under the same conditions.
|
HPβCD (kg) |
Yield (%) |
Degree of substitution |
Replicate 1 |
1.42 |
87.46 |
5.96 |
Replicate 2 |
1.39 |
86.75 |
5.87 |
Replicate 3 |
1.32 |
86.11 |
5.9 |
Mean ± STEM |
1.38 ± 0.05 |
86.77 ± 0.68 |
|
Comparison of the synthesized and commercial HPβCD
Infrared spectroscopy
The IR absorbance peaks showed absolute similarities in all analyzed functional groups between the synthesized and commercial HPβCD, functional groups at their respective characteristic wave numbers are presented in Figure 3 and described in Table 2. The spectrum of the synthesized HPβCD exhibited characteristic absorption maxima (or peaks/bands) exactly corresponding to O-H at 3,384.8 cm−1, C-H at 2,927.7 cm−1, and the C-O at 1,031.8 cm−1 for both samples. Moreover, the signals of the C-O-C bond were at 1,159.1 and 1,158.2 cm−1, interpreting this functional group in the synthesized and commercial HPβCD, respectively.
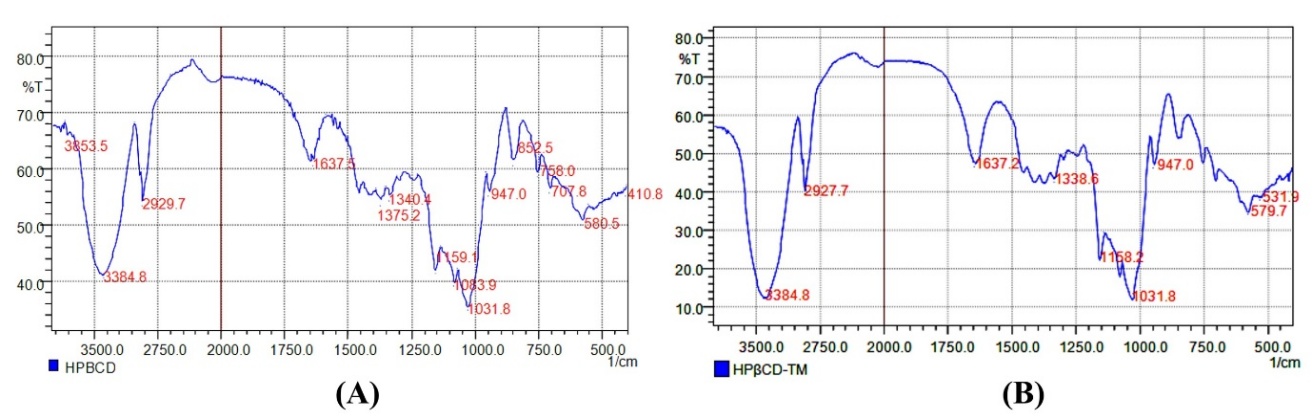
Figure 3 Infrared spectrum of: (A)- synthesized and (B): commercial HPβCD.
Table 2 IR spectra of the synthesized and commercially available HPβCD.
Functional groups |
Absorbance peaks (cm−1) |
|
Synthesized HPβCD |
Commercial HPβCD |
|
O-H |
3,384.8 |
3,384.8 |
C-H |
2,929.7 |
2,927.7 |
C-O |
1,031.8 |
1,031.8 |
Nuclear magnetic resonance spectroscopy
A comparison of the 2 samples presented in Figure 4 and Table 3 revealed minor variations in their 1H and 13C chemical shifts (for 1H and 13C, respectively). These differences are likely due to variations in the DS between the synthesized and commercial products. Nevertheless, the overall comparison of 1H and 13C-NMR chemical shift data supports the conclusion that the synthesized HPβCD has a structure consistent with that anticipated.
The NMR data of 1H and 13C for the synthesized HPβCD (A) and (B) closely matched those of the commercial reference (C) and (D), affirming the successful synthesis, by clarifying as both 1H spectra (Figures 4(A) and 4(C)) exhibited the distinctive anomeric proton H-1 signal as a doublet (labeled ‘1’) consistently positioned near δ 5.00 ppm, confirming the characteristic α-(1 → 4) glycosidic linkage of the cyclodextrin core.
Furthermore, the 13C spectra (Figures 4(B) and 4(D)) displayed high structural similarity, particularly in the pyranose ring carbons (C1 through C6) clustered between δ 60 and δ 102 ppm (Table 3). Critically, the signals for the hydroxypropyl side chain - the methyl (3’) and methylene (2’ and 1’) carbons - were present at identical chemical shifts (δ ~ 18 and δ ~ 60 - 70 ppm), demonstrating that the required substitution occurred with the same structural outcome as the commercial product. This overall spectral congruence provided strong evidence for the structural identity of the synthesized material.
Table 3 Chemical shift data from 1H and 13C-NMR spectroscopy for synthesized and commercial HPβCD.
Position |
Synthesized HPβCD |
Commercial HPβCD |
||
13C-NMR |
1H-NMR |
13C-NMR |
1H-NMR |
|
1 |
101.76 |
5.16 |
101.81 |
5.00 |
2 |
72.13 |
3.72 |
72.08 |
3.56 |
3 |
73.15 |
4.03 |
73.10 |
3.88 |
4 |
80.96 |
3.67 |
81.10 |
3.52 |
5 |
71.88 |
3.94 |
71.83 |
3.74 |
6 |
60.41 |
3.96 |
60.32 |
3.79 |
1′1,2 (a) |
76.93 |
3.81 |
76.93 |
3.76 |
1′1,2 (b) |
76.27 |
3.61 |
76.22 |
3.46 |
2′1 |
66.78 |
4.10 |
66.70 |
3.40 |
2′2 |
66.34 |
4.09 |
66.40 |
3.90 |
3′1 |
18.42 |
1.11, singlet |
18.33 |
1.07, singlet |
3′2 |
18.08 |
18.07 |
||
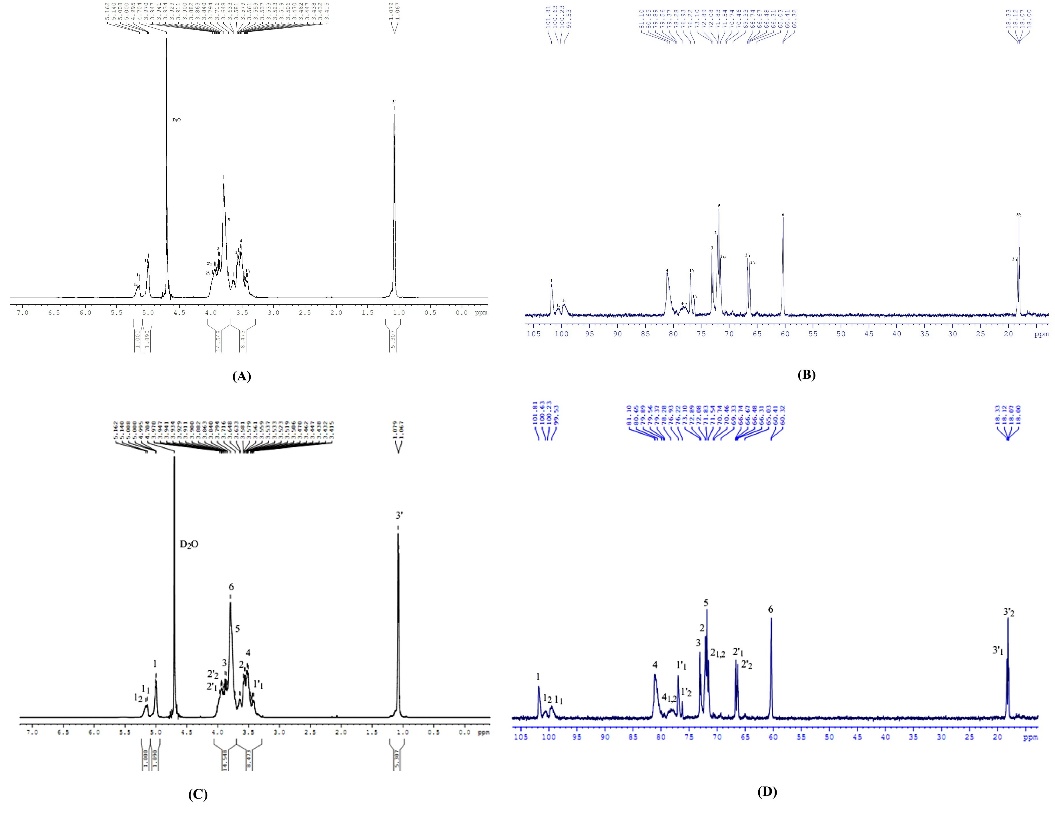
Figure 4 Nuclear magnetic resonance spectrum in D2O of synthesized HPβCD as (A)- 1H and (B)- 13C signals; and commercial HPβCD as (C)- 1H and (D)- 13C signals.
Based on the initial information obtained from βCD described in Phung et al. [13], the analysis of the synthesized HPβCD spectrum also commenced from its 13C NMR data. The general principle governing this substitution involved the C-1 atom at the reactive end of the 1,2-propylene oxide molecule interacting with either the OH-C-2 or OH-C-3 hydroxyl groups of βCD to form -C(2)-O-R or -C(3)-O-R linkages (where R was -CH2-CHOH-CH3) under low alkaline concentrations. Obviously, at high alkaline concentrations, the substitution preferentially occurred at the OH-C-6 group, forming a -C(6)-O-R linkage.
However, as investigated by Sun et al. [18], substitution at OH-C-6 (a primary alcohol) was considerably challenging and necessitated specific reaction conditions. Consequently, in the substitution process conducted under low alkaline conditions herein, the obtained product exclusively featured substitution at the OH groups at positions C-2 and C-3 of each of the seven entirely homogeneous glucopyranose units of βCD. As the substitution process occurred randomly across the glucose units, it was possible for some units to be singly substituted, others doubly substituted, and some to remain unsubstituted, unless all seven glucose units were doubly substituted (at 100% efficiency) [19].
Thus, the 1H or 13C NMR signals of HPβCD, such as 13C-1 or 1H-1, would split into 3 distinct peaks: one peak corresponding to the unsubstituted glucose unit (labelled as ‘1’, representing no substitution), one peak (labelled ‘11’) for the singly substituted unit, and one peak (labelled ‘12’) for the doubly substituted unit, principally, this 3-fold splitting occurs for every 1H or 13C signal. However, spectral broadening can lead to signal overlap due to peak expansion, particularly in 1H-NMR. For instance, the H-5 and H-6 signals of unsubstituted βCD already exhibit overlap.
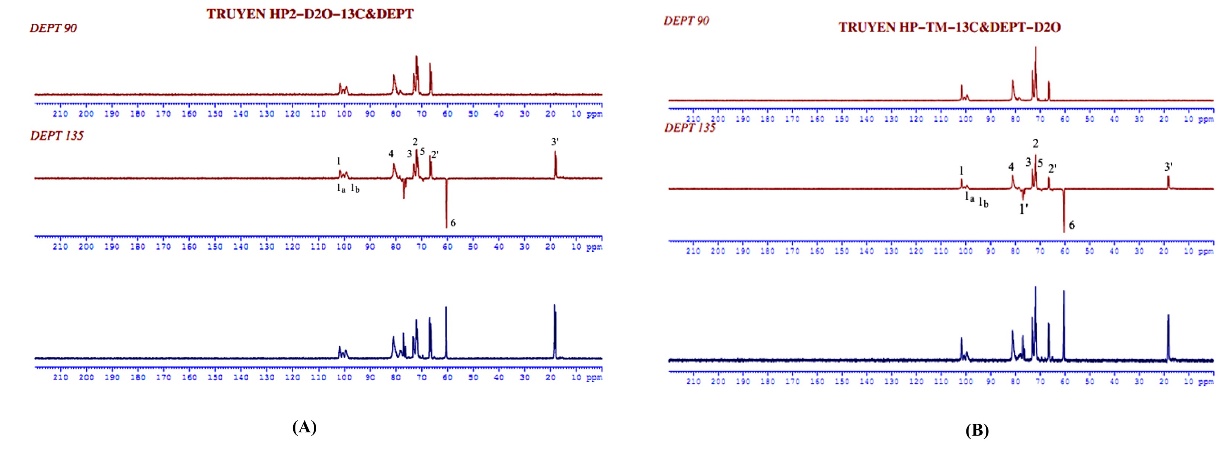
Figure 5 13C-NMR spectrum and DEPT of (A) synthesized and (B) commercial HPβCD in D2O.
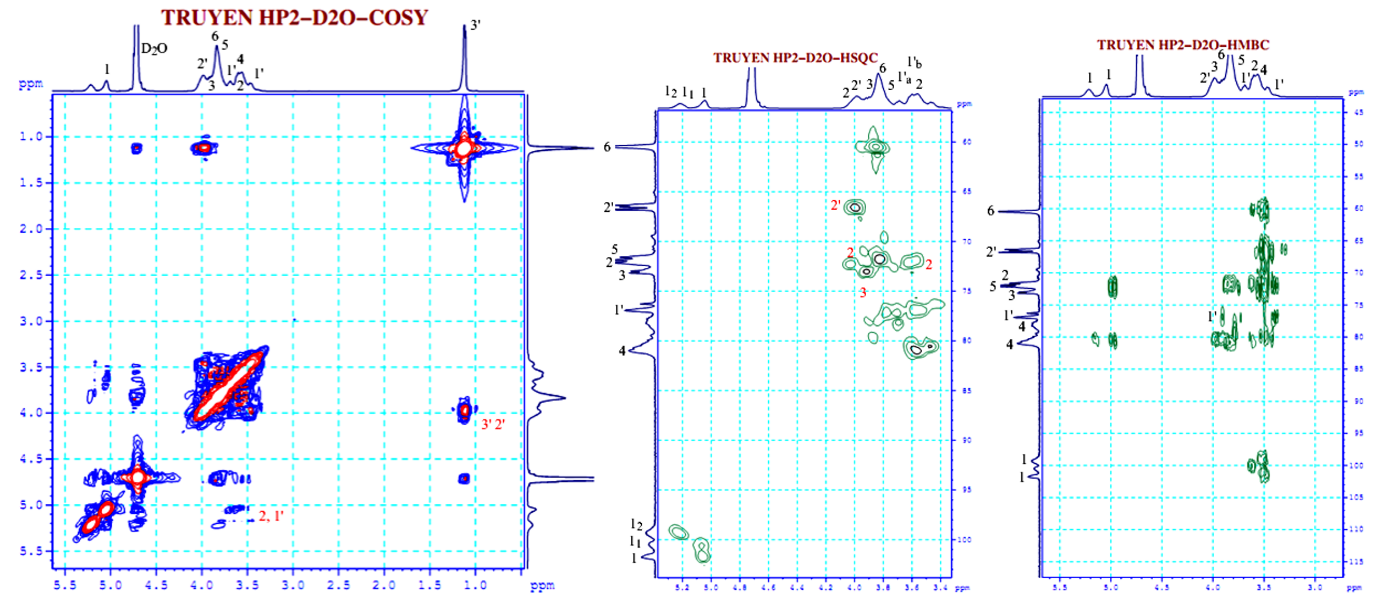
Figure 6 COSY, HMBC, and HSQC NMR spectra of the synthesized HPβCD measured in D2O.
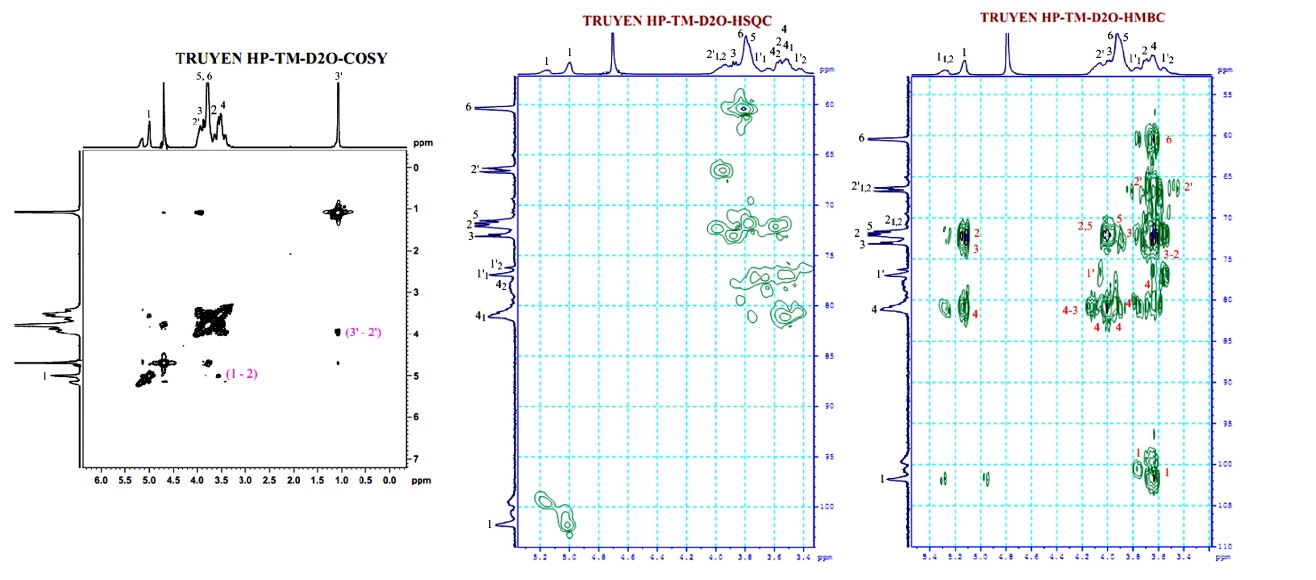
Figure 7 COSY, HMBC, and HSQC-NMR spectra of the commercial HPβCD measured in D2O.
Table 4 NMR spectrum of commercial HPβCD in D2O, including 1H and 13C. 13C spectrum DEPT (90, 135), at a frequency of 125 MHz. 1H, COSY, HSQC, HMBC spectra at a frequency of 500 MHz. (T = 297 K).
Position |
Functional group |
δC ppm |
δH ppm |
J(Hz) – signals (ppm) |
COSY HH |
HMBC HC |
1 |
|
101.81 |
5.00 * |
2 |
2,3,4 |
|
11 |
|
99.53 |
5,140 ** (12) |
|||
12 |
|
100.63 |
5,162 ** (11) |
|||
2 |
|
72.08 |
3.560 * |
Overlapped
|
2’,3,4,1 |
|
21,22 |
|
71.54 |
3.580 * |
|||
3 |
|
73.10 |
3.882 * |
2,5,4 |
||
31,32 |
|
72.89 |
3.863 * |
|||
4 |
|
81.10 |
3.520 * |
1,2,3,5,6 |
||
41,42 |
|
79.56 |
3.535 * |
|||
5,51,52 |
|
71.83 |
3.74 ** (6 and 1’2) |
3,4 |
||
6,61,62 |
|
60.32 |
3.794 ** (5 and 3) |
5,4 |
||
1’1,2 (a*) |
|
76.93 |
3.755 ** (2 and 5) |
2’,2,1 |
||
1’1,2 (b*) |
|
76.22 |
3.455 ** (4) |
|||
2’1 |
|
66.70 |
3.95 **( 2’2) |
3’ |
1’ |
|
2’2 |
|
66.40 |
3.90 ** (2’1) |
3’ |
||
3’1 |
|
18.33 |
1.073 * (3’1 and 3’2) |
2’ |
2,1 |
|
3’2 |
|
18.07 |
2’ |
|||
* Broadened singlet signals ** Overlapped signals |
||||||


Table 5 NMR spectrum of synthesized HPβCD in D2O, including 1H and 13C. 13C spectrum DEPT (90, 135), at a frequency of 125 MHz. 1H, COSY, HSQC, HMBC spectra at a frequency of 500 MHz. (T = 302 K).
Position |
Functional group |
δC ppm |
δH ppm |
J(Hz) – signals (ppm) |
COSY HH |
HMBC HC |
1 |
101.76 |
5.155 * |
2,1 |
2,3,4 |
||
11 |
|
99.32 |
5.296 * |
|||
12 |
|
100.53 |
5.317 * |
|||
2 |
|
72.13 |
3.723 * |
Overlapped |
2’,3,4,1 |
|
21,22 |
|
71.58 |
3.723 * |
|||
3 |
|
73.15 |
4.033 * |
2,5,4 |
||
31,32 |
|
72,96 |
4.014 * |
|||
4 |
|
80.96 |
3.665 * |
1,2,3,5,6 |
||
41,42 |
|
79.89 |
3.682 * |
|||
5,51,52 |
|
71.88 |
3.935 ** (6) |
3,4 |
||
6,61,62 |
|
60.41 |
3.957 ** 5 and 3 |
5,4 |
||
1’1,2 (a*) |
|
76.93 |
3.810 ** (2 and 5) |
1,2’ |
2’,2,1 |
|
1’1,2 (b*) |
|
76.27 |
3.607 ** (4) |
1,2’ |
||
2’1 |
|
66.78 |
4.100 ** (2’2) |
3’,1’ |
1’ |
|
2’2 |
|
66.34 |
4.087 ** (2’1) |
3’,1’ |
||
3’1 |
|
18.42 |
1.113 * |
2’ |
2,1 |
|
3’2 |
|
18.08 |
2’ |
|||
* Broadened singlet signals ** Overlapped signals |
||||||


In the data presented in Tables 4 and 5, the primary analytical challenge was the 1H NMR spectrum, where signals, apart from H-1 of βCD and CH3-(3’) of HPβCD, displayed significant broadening and overlap. This was exacerbated by the 2 non-equivalent protons of the -CH2-(1’) group, distinctly resolved in the HSQC spectrum. The clear separation of H-2/H-4 and H-5/H-6 clusters in the βCD spectrum, HPβCD’s H-1’(a) and H-1’(b) signals intruded, obscuring most proton signals except H-1 and H-3(3’). The NMR signals of both the synthesized and commercial HPβCD were assigned based on correlation spectra (1H, 13C, COSY, HSQC, and HMBC), and the atom notation in the structural formula (C1–C6 and H–H6 for the glucopyranose ring, and C1′–C3′/H1′–H3′ for the 2-hydroxypropyl substituent) is consistent with the spectra data.
In the ¹H-NMR spectra, the characteristic anomeric proton (H1) of β-cyclodextrin appeared at δ 4.83 - 5.07 ppm, confirming the retention of the glucopyranose framework. The multiplot signals at δ 3.2 - 4.0 ppm corresponded to H2–H6 of the glucose units and overlapped with the protons of the 2-hydroxypropyl groups (H1′, H2′, H3′). In the 13C-NMR spectra, the anomeric carbon (C-1) appeared around δ 102.5 - 104.0 ppm for both samples, while signals of the ring carbons C-2 to C-6 were observed in the range δ 60 - 82 ppm. The additional peaks at δ 72.3, 74.9, and 64.5 ppm were assigned to the carbons of the 2-hydroxypropyl substituents (C1′, C2′ and C3′), confirming successful etherification in the secondary hydroxyl groups (mainly C2 and C3 positions).
Despite these 1H NMR complexities, reliable data table construction was achieved through 13C NMR (including DEPT 90 and DEPT 135) (Figure 5) and 2D-HSQC correlation spectroscopy (Figures 6 and 7). This robust dataset formed the basis for confirming the accurate synthesis of HPβCD. A comprehensive comparative analysis of synthesized and commercial HPβCD confirmed their structural identity. Minor, acceptable variations in δ1H and 13C values were attributed to their differing DS.
Overall, the commercial HPβCD spectrum exhibited slightly better resolution than that of the synthesized HPβCD. This marginal difference was likely due to the measurement temperatures: the commercial sample was analyzed at 297 K, while the synthesized sample was measured at 302 K, meaning higher temperatures increase molecular motion, which can negatively impact spectral resolution. A 5 K difference in temperature is sufficient to account for the observed disparity in resolution, as mentioned in the previous study of Trainor et al. [20].
In 1H-NMR spectroscopy, the intensity of a signal was directly proportional to the concentration (and thus the number) of protons contributing to that signal. For instance, within a single functional group such as -CH2-CHOH-CH3, if the signal intensity of the -CH2- group was assigned a relative value of 2 units, then the signal intensity of the -CH3 group had to inherently be 3 units, reflecting the ratio of protons. In case a single glucopyranose unit was substituted at, for example, OH-C-2 by one 2-hydroxypropyl group, the intensity of the substituent’s -CH3 signal would be 3 times that of the anomeric H-1 signal from a single glucopyranose unit in βCD. Consequently, for complete substitution of one glucopyranose unit, the ratio of (1/3 the intensity of the 2-hydroxypropyl’s -CH3-(3’) signal) to the intensity of one glucopyranose unit’s H-1 signal should be unity.
Based on this, the Molar Substitution (MS) can be calculated using the formula:
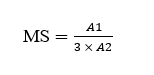
where, A1 is the intensity of the -CH3-(3’) signal; A2 is the intensity of the H-1 signal; The DS is defined as DS = 7× MS.
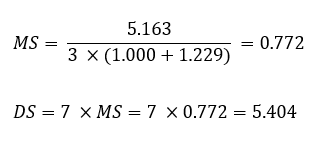
This convention was based on a product with exclusive single substitution (with 7 glucopyranose on each PβCD). However, our synthesized product exhibits substitution at both C-2 and C-3 positions, as detailed in Table 5. In the NMR spectra of HPβCD, particularly the 13C spectrum, the C-1 and H-1 signals both split into 3 distinct peaks. This tripartite splitting signified the coexistence of unsubstituted, singly, and doubly substituted βCD units; correspondingly, the 1H and 13C signals of the 2-hydroxypropyl substituent showed doublet splitting, indicating both 2-O-(2-hydroxypropyl) and 3-O-(2-hydroxypropyl) linkages. However, the -CH3-3’ signal of the 2-hydroxypropyl group occasionally lacked this doublet splitting due to its remote position (4 σ bonds) from the substitution site. For calculating the MS and DS, the total intensity of the H-1 signals (unsubstituted, H-11 for single substitution, and H-12 for double substitution) was recruited. Similarly, for the -CH3-3’ signal, the sum of intensities for -CH3-3’1 and -CH3-3’2 was utilized. In the synthesized HPβCD, while 13C signals show clear splitting, the δ1H signals for 3’-1 and 3’-2 overlap, precluding the use of 13C signals for quantitative analysis due to their non-proportional intensity to concentration.
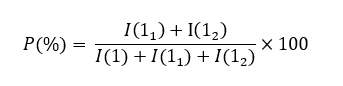
Substitution efficiency (expressed as a percentage) [13] is a commonly employed metric in chemistry, taking the H-1 signal as an example, it splits into 3 distinct peaks based on its substitution. H-1 corresponds to the unsubstituted portion, H-11 to the singly substituted portion, and H-12 to the doubly substituted portion. Thus, when I(1) represented the intensity of the unsubstituted H-1 signal, I(11) would represent the intensity of the H-11 signal, and I(12) would represent the intensity of the H-12 signal, the overall substitution efficiency (P) can be expressed as:
Ideally, when peak separation was complete, individual efficiencies for the first substitution (P1) and the second substitution (P2) could be calculated. However, in 1H-NMR spectra, the distinct resolution of H-11 and H-12 signals was typically absent. Thus, the total substitution efficiency (P) was calculated to be 44.86%, which was very high and described an effective design of the reaction. As shown in Table 6, the synthesized HPβCD consistently displayed superior indices across all evaluated parameters.
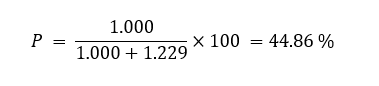
Table 6 Comparison of engineered parameters of synthesized and commercial HPβCD.
Parameters |
Synthesized HPβCD |
Commercial HPβCD |
Molar Substitution (MS) |
0.772 |
|
Degree of Substitution (DS) |
5.404
|
|
Efficiency (P) |
44.860% |
|


Mass spectrophotometry
The synthesized HPβCD exhibited isomers with molecular masses corresponding to 9 different degrees of substitution, continuously distributed from 1 to 9 through the calculation and listed in Table 7. The molecular formula for βCD is C6H10O5 with a molecular weight of 1,134.994 g/mol. The βCD molecule has the substituent group -CH2-CHOH-CH3, having a molecular weight of 59.08 g/mol. During the initial substitution, the C-2 hydroxyl group of βCD reacts with C-1’ of 1,2-propylene oxide, forming a -C-O-CH2-linkage. This reaction involves the loss of one hydrogen atom from the βCD molecule and the gain of one hydrogen atom by the 1,2-propylene oxide molecule. Thus, for the first substitution, the mass of the βCD portion in singly-substituted HPβCD is 1,133.994 Da (losing one H atom), and conversely, the mass of the 1,2−propylene oxide portion in singly-substituted HPβCD is 58.08 + 1 = 59.08 Da (adding one H atom). Consequently, the molecular mass of the molecule resulting to be: MHPβCD (1) = 1,133.994 + 59.08 = 1,193.074 Da. Then, in the second substitution reaction, the HPβCD framework (1) lost an additional hydrogen atom from a hydroxyl group at each substitution site, and the doubly substituted HPβCD became: MHPβCD (2) = MHPβCD (1) – 1 + 59.08 = MHPβCD (1) + 58.08 Therefore, for a molecule of HPβCD that had undergone substitution reactions (n ≥ 1), its molecular mass would be calculated in carbon units by the following Eq. (1):
MHPβCD (n) = MHPβCD (1) + (n − 1)×58.08 (1)
where, n is the degrees of substitution.
In mass spectroscopy, spectral peaks are always recorded in ionic form. In the ES+ technique, common ionizing agents include H+, Na+, and K+. The specific fragment observed depends on the characteristics of the carrier gas and the fragmentation procedure employed during spectrum acquisition. In the ES+ method, the Na+ ion is most commonly observed. These ions are generated by breaking a bond within the molecule under investigation, transforming the neutral molecule into an ion. In the context of HPβCD analysis by mass spectroscopy, the molecule with the highest degree of substitution (and thus the largest mass) will typically be ionized. This ionized molecule then undergoes fragmentation, where one of its bonds is cleaved. This scission results in 2 fragments: one fragment may combine with a proton (H+), while the other will combine with a sodium ion (Na+) to form a characteristic molecular ion. Thus, a neutral molecule with a molecular mass of M, after fragmentation and ionization, will form an ion with a mass corresponding to the fragment plus any adducted species, typically represented as:
M’+m/z = M + mNa = M + 23 (M’+ = M vì z = 1)
M’+m/z = M + mH + mNa = M + 1 + 23
As this process occurs only once, it is sufficient to calculate the mass for any single fragment observed in the mass spectrum. The other fragments will only differ in their mass by the degree of substitution, specifically by [(n − 1)×58.08] atomic mass units for HPβCD. Thus, given the inability to identify the molecular ion peak with the highest mass (corresponding to the most highly substituted species), likely due to its exceedingly low intensity (in the region with mass values > 1,681.05), we can use the mass of the singly-substituted ion, M+ (1), as a starting point for calculations:
M’+m/z(1) = M + mNa = MHPβCD(1) + 23 = 1193,074 + 23 = 1216,074 Da (see Table 7- Mass spectroscopy M1)
In the acquired mass spectrum, this fragment, as well as subsequent fragments, are observed. The spectrum also contains peaks corresponding to [mH + mNa]+ ions or isotopes of carbon or hydrogen produced during the ionization process. Remarkably, a distinguishing characteristic of HPβCD in its MS spectrum is the presence of a βCD fragment that does not contain a substituent group, corresponding to a peak with a mass of 1,158.27 Da. To form an ion, in addition to the attack mechanism by Na+, the βCD ring has gained an additional Na+. It is possible that the βCD molecule does not gain an additional H+ but rather undergoes a bond cleavage at -O-C(1)-O-C(4)- to form -O-C(1)-OH and -CH-. Thus, the mass of this ion will be M+βCD = MβCD + mNa+ = 1,134.994 + 23 = 1,157.994 Da.
Table 7 Mass spectrum of synthesized HPβCD in the 1,000 to 2,000 m/z range (calculated according to formula (a)).
Mn |
Prediction |
Mass spectrum |
|
[mNa]+ |
[mNa]+ |
[mH + mNa]+ and isotopes |
|
M1 |
1,216.074 |
1,216.26 |
- |
M2 |
1,274.154 |
1,274.32 |
1,274.91 |
M3 |
1,332.234 |
1,332.44
|
1,333.44 |
M4 |
1,390.314 |
1,390.56 |
1,391.23 |
M5 |
1,448.394 |
1,448.55 |
1,449.29 and 1,449.62 |
M6 |
1,506.474 |
1,506.74 |
1,507.48 |
M7 |
1,564.554 |
1,564.80 |
- |
M8 |
1,622.634 |
1,622.73 |
- |
M9 |
1,680.714 |
- |
1,681.05 |
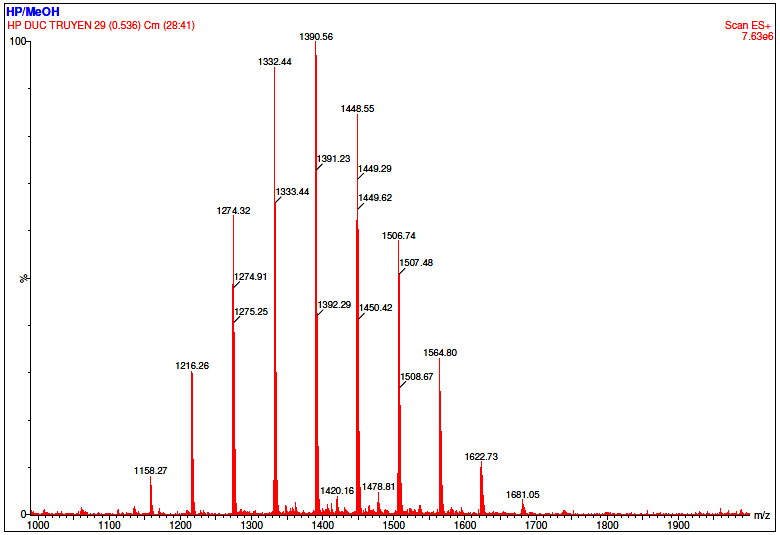
Figure 8 Mass spectrum of the synthesized HPβCD in methanol at m/z range of 100 - 2,000.
Figure 9 Mass spectrum of the commercial HPβCD measured in methanol at m/z range of 0 - 2,000.
The mass spectra of the synthesized (Figure 8) and the commercial HPβCD (Figure 9) display distinct ion distribution patterns, reflecting differences in the substitution profile of the hydroxypropyl groups resulting from different synthesis conditions. Commercial HPβCD is an industrial product consisting of a heterogeneous mixture of homologous molecules with a broad degree of substitution (DS ≈ 4 - 6), leading to a series of evenly spaced molecular ion peaks within the range of approximately 1,300 - 1,600 m/z, corresponding to species with varying numbers of hydroxypropyl substituents. The spectrum appeared as a symmetrical cluster of peaks with relatively consistent intensity, characteristic of a well-mixed product. In contrast, the synthesized HPβCD, prepared under laboratory-scale conditions, exhibited a narrower and slightly shifted distribution of ion clusters. The fewer and less evenly distributed peaks in its spectrum indicated a narrower DS distribution and a distinct substitution pattern, which depended on reaction parameters such as temperature, base concentration, and epoxide-to-βCD molar ratio. The absence of significant peaks below m/z 100 confirmed the exclusion of solvent-related background ions, as the scan range was optimized from 100 - 2,000 m/z for a higher signal-to-noise ratio.
Thus, when HPβCD was synthesized under varying conditions, the substitution patterns also differed. This was evident in the mass spectrum of commercial HPβCD, making direct comparison infeasible. These spectral characteristics demonstrated that the synthesized HPβCD differs from the commercial one mainly in the distribution and intensity of its molecular ion species. While a direct quantitative comparison is not meaningful due to the polydisperse nature of HPβCD, the differences in ion distribution qualitatively confirm successful derivatization and formation of HPβCD with a distinct substitution profile.
Conclusions
The previous method was proven to be applicable for producing HPβCD on an industrial scale (in kg). This large-scale synthesis of HPβCD formed 1.38 ± 0.05 kg product, yielding 86.77 ± 0.68%, and a degree of substitution of 5.91. The confirmation of the HPβCD structure was re-characterized and additionally compared with the available product in commercial (Roquette, France). As a comparative analysis, the spectroscopic data revealed no significant structural differences between the synthesized HPβCD and a commercially available counterpart. These findings validate the developed synthesis method, highlighting its potential for industrial application and future research into the uses of HPβCD in drug development.
Furthermore, this validation underscores the reproducibility and industrial viability of the developed method. The findings are particularly salient in the Vietnamese context, where the national supply of a critical excipient in drug formulation is now dependent on imports from foreign suppliers, primarily China, India, France, and Japan. Thus, the proven scalability and quality of this domestic synthesis method provide a strategic pathway for local researchers and chemical manufacturers to achieve critical autonomy in production. This self-sufficiency will enable them to mitigate constraints related to the high costs of commercial products, complex technology transfer procedures, and inherent supply chain instability associated with reliance on foreign sourcing.
Acknowledgements
The authors gratefully acknowledge Hong Bang University and International University for providing materials and laboratory facilities to support this study.
Declaration of generative AI in scientific writing
The authors acknowledge the use of generative AI tools (Google Gemini) in the preparation of this manuscript for language editing and grammar correction. No content generation or data interpretation was performed by AI. The authors take full responsibility for the content and conclusions of this work.
CRediT author statement
Truyen Duc Phung: Conceptualization, Methodology, Supervision, and Formal analysis. Son Le Hoang: Supervision, Formal analysis, Data curation, Validation, Visualization, and Writing –original draft. Thanh Nguyen-Kim Le: Data curation, Investigation, Visualization, Project administration, and Writing –original draft. Anh Thi-Phuong Phung: Data curation, Formal analysis, Investigation, Validation, and Visualization.
References
[1] V Saharan, V Kukkar, M Kataria, M Gera and PK Choudhury. Dissolution enhancement of drugs. Part I: Technologies and effect of carriers. International Journal of Health Research 2010; 2(2), 107-124.
[2] VA Saharan, V Kukkar, M Kataria, M Gera and PK Choudhury. Dissolution enhancement of drugs part II: Effect of carriers. International Journal of Health Research 2009; 2(2), 207-223.
[3] AS Deshmukh, KJ Tiwari and VR Mahajan. Solubility enhancement techniques for poorly water-soluble drugs. International Journal of Pharmaceutical Sciences and Nanotechnology 2017; 10(3), 3701-3708.
[4] ME Brewster, P Neeskens and J Peeters. Solubilization of itraconazole as a function of cyclodextrin structural space. Journal of Inclusion Phenomena and Macrocyclic Chemistry 2007; 57(1-4), 561-566.
[5] A Katdare and M Chaubal. Excipient development for pharmaceutical, biotechnology, and drug delivery systems. CRC Press, Boca Raton, United States, 2006.
[6] S Gould and RC Scott. 2-Hydroxypropyl-β-cyclodextrin (HP-β-CD): A toxicology review. Food and Chemical Toxicology 2005; 43(10), 1451-1459.
[7] H Jiang, R Sidhu, H Fujiwara, M De Meulder, R De Vries, Y Gong, M Kao, FD Porter, NM Yanjanin, N Carillo-Carasco, X Xu, E Ottinger, M Woolery, DS Ory and X Jiang. Development and validation of sensitive LC-MS/MS assays for quantification of HP-#x03B2;-CD in human plasma and CSF. Journal of Lipid Research 2014; 55(7), 1537-1548.
[8] ME Brewster and T Loftsson. Cyclodextrins as pharmaceutical solubilizers. Advanced Drug Delivery Reviews 2007; 59(7), 645-666.
[9] AA Sandilya, U Natarajan and MH Priya. Molecular view into the cyclodextrin cavity: Structure and hydration. ACS Omega 2020; 5(40), 25655-25667.
[10] T Ishiguro, F Hirayama, D Iohara, H Arima and K Uekama. Crystallization and polymorphic transitions of chlorpropamide in aqueous 2-hydroxybutyl-β-cyclodextrin solution. European Journal of Pharmaceutical Sciences 2010; 39(4), 248-255.
[11] T Tao, Y Zhao, J Wu and B Zhou. Preparation and evaluation of itraconazole dihydrochloride for the solubility and dissolution rate enhancement. International Journal of Pharmaceutics 2009; 367(1-2), 109-114.
[12] D Truyen, Phung, TV Dang and HV Huynh. Development and optimization of the synthesis of 2-hydroxybutyl-β-cyclodextrin. Vietnam Journals Online 2012; 52(10), 42-47.
[13] TD Phung, TNK Le and ATP Phung. Synthesis and structural characterization of hydroxy butyl-β-cyclodextrin. Asian Journal of Chemistry 2025; 37(6),1282-1288.
[14] M Malanga, M Bálint, I Puskás, T Sohajda, L Jicsinszky, L Szente and É Fenyvesi. Synthetic strategies for the fluorescent labeling of epichlorohydrin-branched cyclodextrin polymers. Beilstein Journal of Organic Chemistry 2014; 10, 3007-3018.
[15] Y Kondo, S Suzuki, M Watanabe, A Kaneta, P Albertini and K Nagamori. Temperature-dependent circularly polarized luminescence measurement using KBr pellet method. Frontiers in Chemistry 2020; 8, 527.
[16] FM Dayrit and ACD Dios. 1H and 13C NMR for the profiling of natural product extracts: Theory and applications. In: E Sharmin and F Zafar (Eds.). Spectroscopic analyses - developments and applications. IntechOpen, London, 2017.
[17] AA Andrianova, T DiProspero, C Geib, IP Smoliakova, EI Kozliak and A Kubátová. Electrospray ionization with high-resolution mass spectrometry as a tool for lignomics: Lignin mass spectrum deconvolution. Journal of the American Society for Mass Spectrometry 2018; 29(5), 1044-1059.
[18] HY Sun, Y Bai, MG Zhao, AY Hao, GY Xu, J Shen, JY Li, T Sun and HC Zhang. New cyclodextrin derivative 6-O-(2-hydroxybutyl)-β-cyclodextrin: Preparation and its application in molecular binding and recognition. Carbohydrate Research 2009; 344(15), 1999-2004.
[19] J Pitha, CT Rao, B Lindberg and P Seffers. Distribution of substituents in 2-hydroxypropyl ethers of cyclomaltoheptaose. Carbohydrate Research 1990; 200, 429-435.
[20] K Trainor, JA Palumbo, DWS MacKenzie and EM Meiering. Temperature dependence of NMR chemical shifts: Tracking and statistical analysis. Protein Science: A Publication of the Protein Society 2020; 29(1), 306-314.