Trends
Sci.
2026;
23(5):
12081
A Novel Hydrophilic Membrane based on PAA-coated Cellulose Acetate-chitosan for PAHs Pollutant Removal
Muhammad Syahrir1,*, Muhammad Danial1, Muhammad Nur Alam1,
Rizal Irfandi1, Suriati Eka Putri1 and Nururrahmah2
1Department of Chemistry, Faculty of Mathematics and Natural Sciences, Universitas Negeri Makassar,
Makassar 90223, South Sulawesi, Indonesia
2Department of Environmental Engineering, Universitas Syekh Yusuf Al Makassari, Gowa 92111,
South Sulawesi, Indonesia
(*Corresponding author’s e-mail: [email protected])
Received: 27 September 2025, Revised: 20 October 2025, Accepted: 5 November 2025, Published: 5 January 2026
Abstract
The separation of Polycyclic Aromatic Hydrocarbons (PAHs) from wastewater is essential due to its mutagenic and carcinogenic properties. Cellulose acetate-chitosan membranes (CA-CS) coated with polyelectrolyte complex poly(acrylic-acid) (PAA) at various concentrations (100, 200, 500 and 1,000 ppm) have been synthesized to improve the separation performance of PAHs. Fourier Transform Infrared (FTIR) characterization confirms the formation of polyelectrolyte complex PAA-CS through NH₃⁺/COO⁻ ion pairs (strengthening of the bands 1,560 - 1,600 and 1,410 cm−1 and attenuation of C=O at 1,730 cm−1), while Scanning Electron Microscopy (SEM) analysis and surface contours show changes from a nodular surface of CA-CS membrane to a more homogeneous layer during the coating process. X-Ray diffraction patterns indicate structural regularity in the composition. The water contact angle decreased from 65.56° in CA-CS to 36.34° after PAA coating at 500 ppm, and the swelling index increased from 48.24% to 73.95% confirming the membrane’s hydrophilic nature after coating. Mechanically, tensile strength increased with increasing PAA concentration, due to physical cross-linking via hydrogen bonds that solidified the network. Membrane performance test showed that permeate flux and PAHs rejection increased after CA-CS coating and achieved the best performance at 500 ppm PAA across all operating pressures (2 - 8 bar) with an optimum flux of 11.56 L·m−2·h−1 and optimum PAHs rejection of > 90%. In addition, the CA-CS/PAA 500 membrane also showed the best antifouling properties with the lowest Flux Decline Ratio (FDR) of 20% and the highest Flux Recovery Ratio (FRR) of 78%. Ultimately, poly(acrylic acid)-coated cellulose acetate-chitosan biopolymer-based membranes have great potential for continuously and sustainably separating PAH pollutants from wastewater.
Keywords: Poly aromatic hydrocarbons, Pollutant, Cellulose acetate, Chitosan, Membrane
Introduction
Water pollution remains a crucial global challenge, necessitating the management of a wide range of pollutants. Wastewater discharge from both residential and industrial areas is a major pathway for the distribution of pollutants, as it typically contains a variety of chemical reagents and reaction byproducts [1-3]. These components damage affected ecosystems and readily spread to receiving waters, including drinking water supplies. One type of pollutant of particular concern is polycyclic aromatic hydrocarbons (PAHs), which exhibit significant toxicity and established carcinogenicity, can induce genotoxic damage and promote malignant transformation of normal cells [4,5]. Recent studies have further emphasized the severity of PAHs pollution and its multifaceted toxicological impacts. Research by Takam et al. [6] demonstrated that exposure to PAHs such as phenanthrene, fluoranthene, and benzo[ghi]perylene significantly reduced cell viability and induced micronuclear formation in human alveolar and macrophage cell lines. The study also revealed that PAHs trigger pro-inflammatory responses by increasing IL-6 secretion while suppressing anti-inflammatory IL-10 production. Moreover, an epidemiological investigation reported that combined exposure to PAHs and heavy metals adversely affects human pulmonary function. These impairments were found to be mediated by immune dysregulation and oxidative stress pathways [7].
Polycyclic aromatic hydrocarbons (PAHs) are a group of aromatic compounds with 2 or more fused benzene rings, planar in structure and π-conjugated. In aquatic environments, PAHs generally originate from the incomplete combustion of organic matter and can enter water bodies through atmospheric deposition or waste disposal. Chemically, PAHs are highly hydrophobic, have low water solubility, are easily adsorbed on suspended particles and sediments, and tend to have high partition coefficients, making them potentially bioaccumulative [8,9].
Several approaches have been explored for removing polycyclic aromatic hydrocarbons (PAHs), including adsorption, photocatalysis, bioremediation, and membrane-based separation [5,8]. In membrane processes, PAHs removal efficiency is chiefly governed by 2 factors: The membrane’s pore architecture (size, distribution, and overall porosity) and its surface properties (chemistry, charge, hydrophilicity, and roughness) [10]. A review of recent literature indicates that membrane development for pollutant separation has focused primarily on controlling pore size and porosity [11]. In contrast, systematic engineering of surface characteristics has received comparatively little attention. The study by Lang et al. [12] demonstrated that although RO membranes grafted with ionic liquid monomers and sulfonic acid showed high flux, biofouling caused by organic compounds still led to a significant decline in performance. Similarly, a recent study by Gao et al. [13] reported that NF/RO membranes with petite pore sizes remained susceptible to fouling by low-molecular-weight organic compounds, resulting in a drastic reduction in separation efficiency. Meanwhile, another research by Utomo et al. [14] revealed that despite the high separation efficiency and largely reversible fouling observed in Fe/Co amorphous MOF-modified PVDF/PAA membranes, mechanical stability and surface durability remained major challenges. In practice, however, the principal cause of performance decline during prolonged operation is the membrane’s susceptibility to fouling [15], underscoring the need for targeted surface modifications to enhance fouling resistance and sustain separation efficiency.
Fouling remains a major obstacle because it can significantly reduce flux, increase energy consumption and cleaning frequency, and shorten membrane lifespan. Recent literature confirms that fouling mechanisms include organic/colloidal deposition, inorganic scaling, and biofouling, including self-fouling by PAHs [11,16]. While attempts have been made to adjust pore size to match foulant particle size, these strategies are difficult to control and ineffective for long-term membrane use. Therefore, the most established approach is membrane surface engineering to increase the foulant rejection. One effective strategy to mitigate fouling is to confer strong hydrophilicity by introducing polar or zwitterionic groups onto the membrane surface [17-19]. A previous study by Bilal et al. [20] demonstrated that membranes with strong hydrophilic properties, as evidenced by low water contact angles, exhibit higher flux recovery ratios, reflecting enhanced antifouling performance. These functionalities establish a robust, long-lived hydration layer that lowers interfacial adhesion energy and suppresses foulant–membrane interactions. In feeds containing PAHs, the hydration shell further promotes steric and hydration repulsion against highly hydrophobic PAHs, thereby reducing their deposition.
Recent studies have shown that PDA-MOF composites can enhance fouling resistance while maintaining selectivity [21], while graphene oxide (GO) on polyamide/RO surfaces enhances reverse-hydrophobicity (i.e., greater hydrophilicity), smooths roughness, and increases flux recovery ratio after BSA/humic exposure [22]. These findings reinforce the thesis that interfacial chemistry-based anti-adhesion design is crucial for maintaining long-term performance. In addition to passive anti-adhesion functions, recent research has integrated self-cleaning functions into membranes using TiO₂ and g-C₃N₄ photocatalysts and superhydrophilic groups. Under illumination, photocatalytic sites degrade organic foulants/biofilms near the surface. At the same time, the superhydrophilic interface minimizes oil/protein contact and facilitates rinsing with permeate flux recovery values reaching 75% and constant foulant rejection [23].
This study shows that combining these 2 approaches is effective at suppressing both reversible and irreversible fouling during the separation of oil-in-water and other complex feeds. As hydrophilic biopolymers, cellulose acetate (CA) and chitosan (CS) have been widely explored as membrane materials to suppress fouling by forming a stable hydration layer at the water-membrane interface. However, modification of both membrane combinations is necessary because the reduction in fouling is usually not accompanied by a stable flux. A recent study reported that surface modification of CA with dopamine (CA-2,3-DA) increased the pure water flux to 167 L·m⁻²·h⁻¹, while maintaining 92.5% BSA rejection and improving antifouling metrics (FRR/flux decline), indicating that increased hydrophilicity can shift the permeability-selectivity trade-off in a favorable direction. Furthermore, blending and nanofiller approaches to CA with the addition of PEG/PS/Pluronic and carbon nanoparticles were reported to boost water flux up to 394 L·m⁻²·h⁻¹ and FRR close to 98% under optimized conditions, while maintaining protein rejection, indicating that the more open pore architecture combined with a more hydrophilic interface effectively reduces foulant attachment and facilitates flux recovery.
In addition to modification by adding nanoparticle material to the membrane surface, either through coating or grafting processes, membrane modification with the potential to be developed and capable of overcoming fouling is increasing the membrane’s hydrophilic properties. The formation of membranes with hydrophilic properties is one promising solution, because PAHs compounds are very hydrophobic. The membrane’s hydrophilic properties can be achieved by modifying its surface with complex polyelectrolyte additives. A recent study reported the modification of nanofiltration membranes by depositing complex polyelectrolyte materials, poly(allylamine-hydrochloride) (PAH) and poly(acrylic-acid) (PAA), which showed excellent results with a water flux of 120 L·m−2·h−1 and solute rejection of 98%. In addition, the deposition of polyelectrolyte compounds with 20-30 repetitions can increase the resistance to impurities (fouling resistance) by up to 15% without reducing the initial permeation value [24]. Another study by Ounifi [25] demonstrated the effect of adding PAA complex polyelectrolytes to cellulose acetate-based membranes. Their research results showed that the 15% CA/PAA membrane had the highest antifouling properties, as indicated by a Flux Recovery Ratio (FRR) of 97.65% and a reversible fouling ratio that decreased with PAA addition.
In this study, a novel biopolymer-based composite membrane composed of cellulose acetate (CA) and chitosan (CS) was modified with PAA to create a CA-CS/PAA multilayer system. The CA-CS matrix provides a semi-biopolymeric backbone that combines the mechanical stability of CA with the reactive amino groups of CS, enabling tunable hydrogen bonding and ionic interactions with PAA. The incorporation of PAA promotes the formation of a polyelectrolyte complex via directional hydrogen bonding and ionic interactions between –COOH and –NH₂ groups, thereby enhancing hydrophilicity and improving surface uniformity. Therefore, this study aims to synthesize and improve the hydrophilic properties of cellulose acetate-chitosan membranes by coating them with poly(acrylic acid) complex polyelectrolyte. The membrane performance in separating PAHs pollutants was evaluated by testing permeate flux, PAHs rejection, and antifouling properties.
Materials and methods
Materials
The materials used in membrane fabrication include cellulose acetate (CA) (Merck, AC = 43%), chitosan (CS) (DA = 93%), acetone p.a (Merck), poly (acrylic acid) (PAA) (Sigma-Aldrich), distilled water, deionized water, 0.1 M NaCl solution, and 100 ppm pyrene PAHs solution.
Preparation of the CA-CS membrane
The membrane was fabricated using the NIPS (Non-Induced Phase Separation) phase inversion method [25]. Initially, 2 g of cellulose acetate powder was dissolved in 12 mL of DMAc solvent. Then, 0.5 g of chitosan was mixed into the cellulose acetate solution and stirred at 300 rpm for 6 h at room temperature to form a gel. The gel formed was cast onto a flat glass plate (20×10×0.5 cm3) and left for 2 min until air bubbles disappeared. Finally, the resulting mold was placed in a coagulation bath containing deionized water to form a membrane. The membrane was removed and dried in an oven at 50 °C for 14 h.
Modification of the CA-CS membrane
The CA-CS membrane was modified through surface coating using a dip-coating method [24]. Initially, the CA-CS membrane was immersed in a solvent mixture of ethanol: n-hexane (1:2) for 45 min. Next, the membrane was rinsed with deionized water and then dipped in a 100 ppm PAA solution for 2 h. The treatment was repeated by replacing the PAA solution at different concentrations (200, 500 and 1,000 ppm).
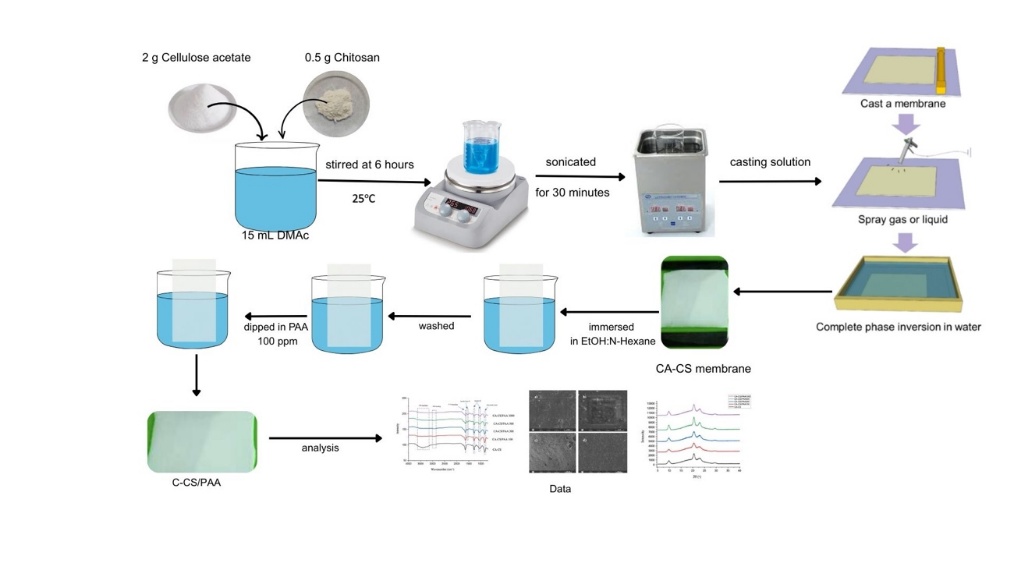
Figure 1 Schematic of CA-CS/PAA membrane fabrication.
FTIR analysis
The FTIR spectra of membranes were recorded using a PerkinElmer Spectrum Two ATR-FTIR spectrometer (USA) equipped with a diamond ATR crystal. Measurements were carried out at a resolution of 4 cm⁻¹ with 32 scans per sample. The membrane was placed on a sample holder for the ATR-FTIR, and its absorption spectrum was recorded between 4,000 and 500 cm−1. Next, the spectra were interpreted to determine the differences in functional groups of each membrane [26,27].
XRD analysis
The CA-CS and modified CA-CS membrane samples were characterized using an X-ray diffractometer Rigaku MiniFlex 600 diffractometer with Cu Kα radiation (λ = 1.5406 Å), operated at 40 kV and 30 mA. The diffractogram peaks were recorded at 2θ range of 5° - 40° with a step size of 0.02° and a scan rate of 2°/min.
SEM analysis
SEM was used to characterize the membranes and examine surface morphology. The membranes were cut into 2×1 cm2 pieces and characterized by SEM (TESCAN Vega) at 5 - 10 keV to examine the top surface. The membranes were first coated with gold for 60 seconds using a sputter coater to facilitate detection by the instrument. SEM then characterized the composite membranes at specific magnifications corresponding to the clearest morphological appearance.
Hydrophilicity analysis
The membrane hydrophilicity analysis was evaluated by measuring 3 parameters including water contact angle (WCA), swelling index, and permeability. The water contact angle analysis was conducted following the procedure described by Kayadoe et al. [28]. A dry, flat membrane sample was cut to 10×5 mm2 and placed on a clean, smooth glass plate. A droplet of deionized water was carefully deposited onto the membrane surface, and the droplet image was captured using a high-resolution camera. The contact angle was measured using ImageJ software. The procedure was repeated 3 times to ensure the accuracy and reproducibility of the measurements.
The swelling index analysis was performed according to the method described by Ahmad et al. [29]. The membrane samples were immersed in distilled water for 24 h. Subsequently, the surface water was gently removed using filter paper, and the wet membranes were weighed using an analytical balance. The swelling index was then calculated using Eq. (1).
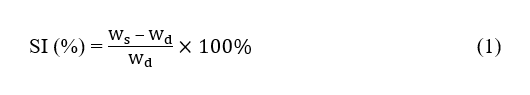
where, SI denotes swelling index (%), Ws denotes wet membrane weight (g), and Wd denotes dry membrane weight (g).
The pure water permeability of the membranes was determined following the method by Lee et al. [30]. Each membrane was pre-compacted with deionized water at 1.5 bar for 30 min to achieve a steady flux. The pure water flux (Jw) was then measured at transmembrane pressures of 1.5 - 3 bar using a dead-end filtration cell. The water flux and pure water permeability were calculated using Eqs. (2) and (3). All measurements were performed in triplicate, and the average values were reported to ensure reproducibility.
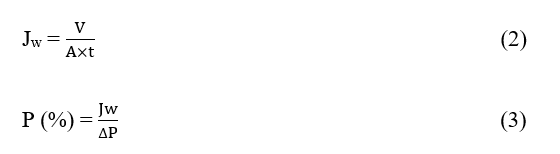
where, Jw denotes water flux (L·m−2·h−1), V is the permeate volume (L), A is the effective membrane area (m²), t is the permeation time (h), and P is water permeability (L·m−2·h−1·bar−1).
Antifouling test
Membrane antifouling was evaluated by measuring the Flux Decline Ratio (FDR) and the Flux Recovery Ratio (FRR). The feed solution mixed with foulant was passed through the membrane for 1 h at pH 7 and 25 °C and the initial flux (Jwo) was determined. Furthermore, the solution permeation process was continued for 2 h, maintaining the temperature conditions until steady-state flux (Jws) and final flux (Jwt) were obtained. After the process was completed, the membrane was washed with distilled water to remove foulants deposited on its surface, and was reused to measure the water flux after membrane washing (Jwc) [31]. The FRR and FDR values were calculated using Eqs. (4) and (5). The measurements were performed in triplicate.
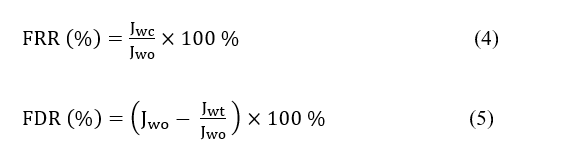
where FRR denotes Flux Recovery Ratio, FDR was Flux Decline Ratio, Jwo was initial flux, Jwt was the flux at the time, Jwc was flux after cleaning [32].
Membrane performance test
The membrane performance in removing PAHs pollutants was evaluated by measuring the permeate flux of the feed solution and PAH rejection using a dead-end vacuum filtration system. Measurements were conducted using an effective membrane area of 20×10−4 m² at 25 °C and various operating pressures (1, 3 and 5 bar). The feed solution used was a pyrene solution at 100 ppm in water. The permeate flux (F) and rejection (R) were then calculated using Eqs. (6) and (7). The measurements were performed in triplicate.
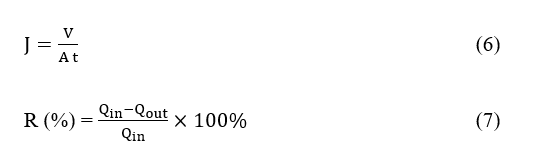
where J was permeate flux (L/m2h), A was membrane area (m2), V was volume of permeate (L), and t was filtration time (h), R was percentage of PAHs rejection, Qin was TDS feed (g/mL), and Qout was TDS permeate (g/mL).
Results and discussion
FTIR analysis
Figure 2 shows the FTIR spectra of the pure CA-CS membrane and after PAA coating. In CA-CS membrane, the spectrum shows a broad characteristic O–H band at around 3,350 cm⁻¹ [33], aliphatic C–H at 2,920 cm⁻¹, sharp C=O cellulose acetate ester at 1,740 - 1,745 cm⁻¹, and Amide I/II bands of chitosan at 1,655 and 1,550 - 1,560 cm⁻¹, respectively [34-36]. The broad absorption band at 3,400 - 3,500 cm⁻¹ corresponds to the O–H stretching vibration. The intensity of this band slightly increases and shows a minor broadening trend with increasing PAA coating cycles, indicating enhanced hydrogen bonding and surface hydrophilicity. The polysaccharide fingerprint region appears at 1,245 - 1,050 cm⁻¹ (C–O/C–O–C) and glycosidic bonds at 895 cm⁻¹ glycosidic [37]. After PAA coating, a new band appears at 1,550 - 1,655 cm⁻¹. This band originates from the overlap of the Amide I and II region of chitosan (N–H bending/C–N stretching) with the asymmetric carboxylate stretching of the –COO⁻ group [25]. At the same time, the C=O band of the free carboxylic acid in 1,710 - 1,730 cm⁻¹ decreases in intensity and can shift slightly to lower wavenumbers. This indicates that some of the –COOH groups change to –COO⁻ due to acid–base interactions with the –NH₃⁺ group of chitosan under acidic conditions [38]. The symmetric carboxylate band (amide III) at 1,410 - 1,200 cm⁻¹ also increases, and the broad O–H/N–H band (3,200 - 3,500 cm⁻¹) broadens, indicating a stronger hydrogen bonding network [24].
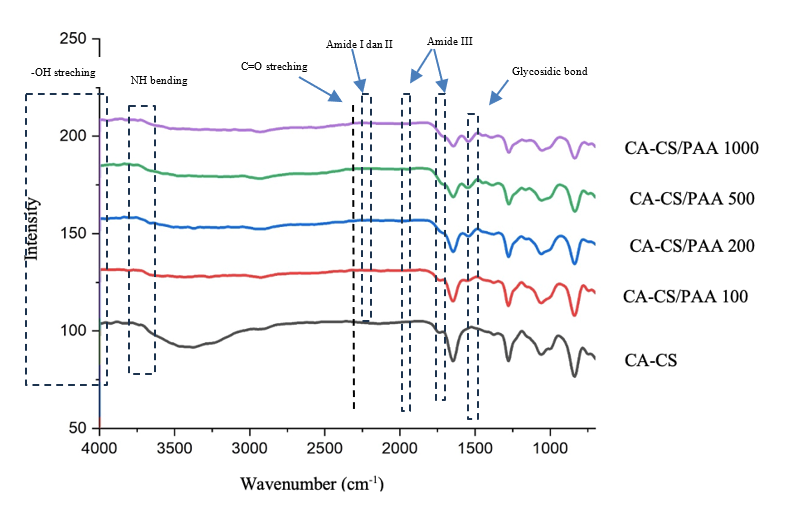
Figure 2 FTIR spectra of CA-CS and CA-CS/PAA membrane.
XRD analysis
Figure 3 shows the diffraction patterns of the CA-CS membrane before and after PAA coating. All XRD patterns are dominated by a broad amorphous halo centered around 2θ ≈ 20°, with several weak overlapping peaks at ≈ 9.8°, 20.5°, 23°, and 29.5°, typical of medium-range-order packages in the cellulose acetate/chitosan matrix [39]. As the number of PAA layers increases, this peak becomes sharper and more intense, indicating a marked decrease in the FWHM from 6.31° to 4.78°, as calculated. The reduction in FWHM indicates a higher degree of local structural order, which is attributed to the formation of pseudo-crystalline regions [40]. This increase in local order arises from hydrogen bonding between the hydroxyl and amino groups of chitosan and the carboxyl groups of PAA, along with directional ionic interactions (–NH₃⁺---⁻COO⁻) formed during the dip-coating process, as illustrated in Figure 4 [41]. These intermolecular interactions restrict chain mobility and promote denser packing, leading to the sharpening of the observed diffraction peaks [38]. The membrane with 100 ppm PAA is closest to CA-CS (broader peaks, lower intensity) because interfacial interactions are insufficient to induce more ordered packing. The membrane with 200 ppm PAA showed a limited increase in intensity, while 1,000 ppm did not exceed 500 ppm, possibly because the excess PAA disrupted the packing of the polymer phase (overplasticization) thereby reducing the coherence of the regular domains [42,43].
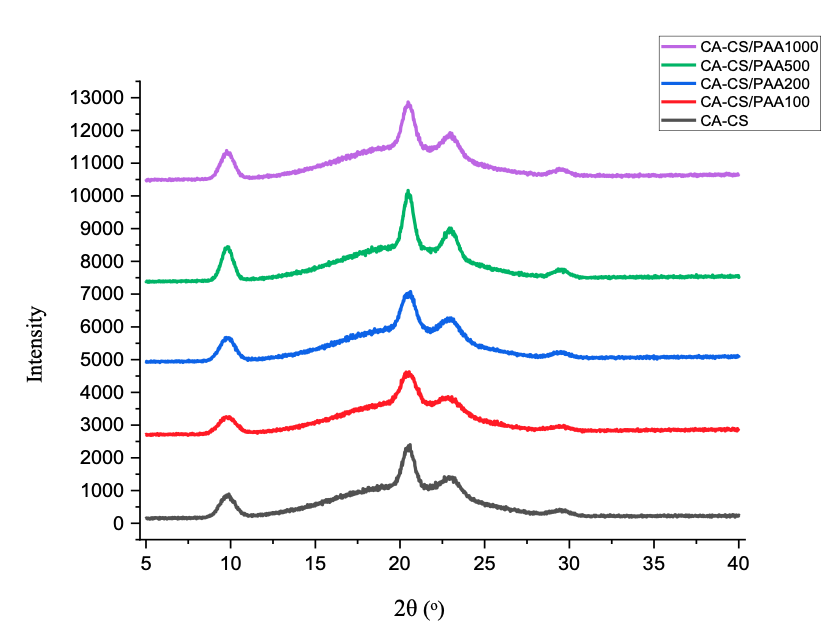
Figure 3 XRD pattern of CA-CS and CA-CS/PAA membrane.
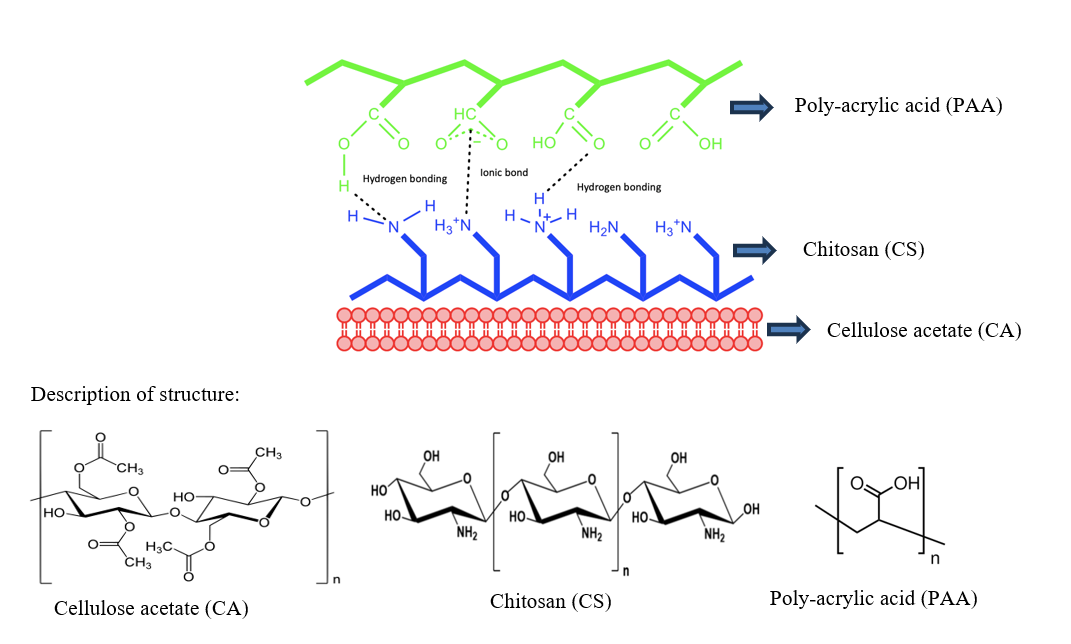
Figure 4 Illustration of the interaction between cellulose acetate, chitosan, and PAA in membrane formation.
SEM analysis
In general, the surface morphology and membrane substructure, as shown in Figure 5, indicate phase inversion dynamics in CA (forming a dense/nodular skin and a sponge/finger-like sublayer) [44]. In contrast, the addition of PAA forms a polyelectrolyte complex with chitosan (PAA-CS), altering the surface roughness, pore size, and homogeneity [24]. At the CA-CS membrane, the surface appears smooth, with nodules typical of the CA surface resulting from liquid-liquid demixing. The presence of CS in the mixture tends to increase the viscosity of the dope and delay demixing, resulting in a relatively more compact skin and reduced macrovoids [45]. This image is consistent with many SEM reports of CA/blend membranes that show a dense surface over the sponge substructure [44].
Even after coating with low PAA concentrations, morphological changes remained limited. The coating was not entirely continuous, so the CA-CS nodular pattern remained dominant. The report by [46] also showed that adding PAA at an initial level began to alter the topography but did not yet form a homogeneous film. At intermediate concentration (PAA 500 ppm), the surface appears more uniform/compact with a wavy texture, indicating a continuous layer over the sponge substructure. This is consistent with a more mature PEC (complex polyelectrolyte) scenario (NH₃⁺/COO⁻ ionic bonds and H-bond networks) that densifies the surface and stabilizes the substructure [42]. Similar effects have been widely reported for CS-PAA-based membranes, where the addition of PAA alters the morphology and improves the robustness/water resistance [33,47,48]. At the PAA concentration of 1,000 ppm, the surface appears very smooth and homogeneous at the 20 µm scale, with few topographic features. This indicates over-coating/over-plasticization (the PAA-rich layer covers the CA-CS micro-features) and the possible shift of surface pores to the nanoscale [49]. This observation is consistent with the study by Regenspurg et al. [50], which reported that excessive PAA content enhances PEC formation, leading to a smoother, denser surface morphology while suppressing macrovoid growth. Similarly, another study by Baig et al. [24] observed that high PAA concentrations strengthen interchain bonding, resulting in improved surface uniformity.
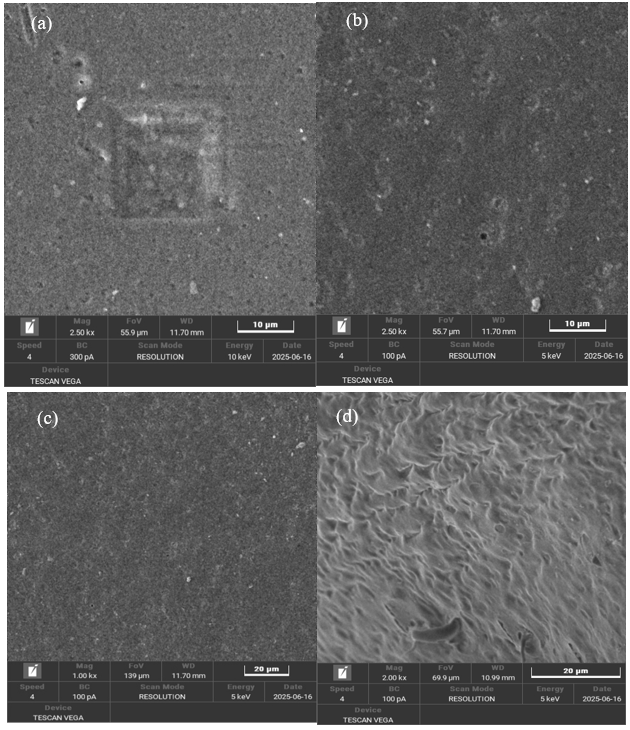
Figure 5 SEM micrographs of (a) CA-CS, (b) CA-CS/PAA 100, (c) CA-CS/PAA 500 and (d) CA-CS/PAA 1,000 membrane.
Figure 6 shows the surface contour as nodules with contrasting peaks and valleys, a characteristic of phase inversion in the uncoated CA-S membrane. At a 100 ppm PAA coating, some nodular relief remains visible because the polyelectrolyte complexation of NH₃⁺/COO⁻ is not homogeneous. However, the surface of CA-CS/PAA 500 becomes more homogeneous, and the roughness level decreases. A continuous PAA film forms a hydrogen-bond network, thereby increasing the polar components at the surface and hydration [44]. This is reflected in the minimum WCA and maximum SI. At 1,000 ppm PAA coating, the surface becomes very smooth due to overcoating, but this decreases SI and increases WCA because more –COO⁻ is bound as an NH₃⁺/COO⁻ ion pair and physical cross-linking that limits network expansion [51].
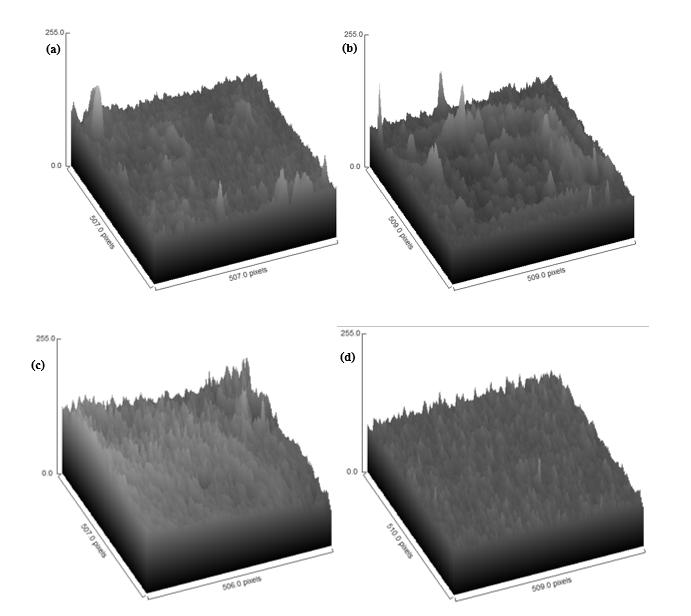
Figure 6 Surface contour of (a) CS-CS, (b) CA-CS/PAA 100, (c) CA-CS/PAA 500 and (d) CA-CS/PAA 1,000 membrane.
Table 1 Result of pore analysis at various membrane.
Type of membrane |
Average pore size (nm) ± SD |
Porosity (%) ± SD |
CA-CS |
3.09 ± 0.028 |
10.56 ± 0.049 |
CA-CS/PAA100 |
3.12 ± 0.042 |
11.23 ± 0.028 |
CA-CS/PAA500 |
5.16 ± 0.057 |
26.74 ± 0.085 |
CA-CS/PAA1000 |
4.57 ± 0.071 |
14.42 ± 0.056 |
Further analysis showed that membrane coating with PAA at various concentrations increased the membrane’s porosity and average pore size, as shown in Table 1. The optimum increase was observed in the CA-CS/PAA 500 membrane, with a porosity of 26.74% and an average pore size of 5.16 nm, but reversed when the PAA concentration was increased. Based on the average pore size data, all membranes are classified as nanofiltration membranes (1 - 10 nm).
Hydrophilicity analysis
Table 2 summarizes the results of the membrane hydrophilicity analysis, which comprises 3 main parameters: water contact angle, swelling index, and permeability. Water contact angles (WCA) and swelling index (SI) have been used to verify the hydrophilic properties of CA-CS membrane before and after coating. As shown in Figure 7, PAA coating decreases the membrane water contact angle (WCA) from 65.56° (CA-CS) to 53.67° (100 ppm) and 44.87° (200 ppm), reaching a minimum of 36.34° at 500 ppm. At 1,000 ppm, the WCA increases slightly to 38.21°, yet remains far below the baseline CA-CS value. The pronounced reduction up to 500 ppm indicates enhanced surface hydrophilicity due to the incorporation of PAA carboxyl/carboxylate (–COOH/–COO⁻) groups, which increase the polar component of the solid surface energy and reduce the solid–liquid interfacial energy [52-54]. This trend is consistent with independent reports on PAA coating/grafting of PES membranes, where the WCA decreased from 50° to 27°, supporting the interpretation that PAA improves water wettability via exposure of hydrated carboxylate groups [44].
Table 2 Results of hydrophilicity analysis at various membrane.
Type of membrane |
Average WCA (°) ± SD |
Average SI (%) ± SD |
Average P (L·m−2·h−1·bar−1) ± SD |
CA-CS |
65.56 ± 0.184 |
48.24 ± 0.155 |
1.36 ± 0.056 |
CA-CS/PAA100 |
53.67 ± 0.438 |
57.12 ± 0.325 |
1.40 ± 0.085 |
CA-CS/PAA200 |
44.87 ± 0.325 |
57.69 ± 0.339 |
1.52 ± 0.028 |
CA-CS/PAA500 |
36.34 ± 0.183 |
73.95 ± 0.240 |
1.81 ± 0.084 |
CA-CS/PAA1000 |
38.21 ± 0.057 |
73.62 ± 0.212 |
1.75 ± 0.042 |
Description: WCA denotes water contact angle; SI denotes swelling index; and P denotes permeability.
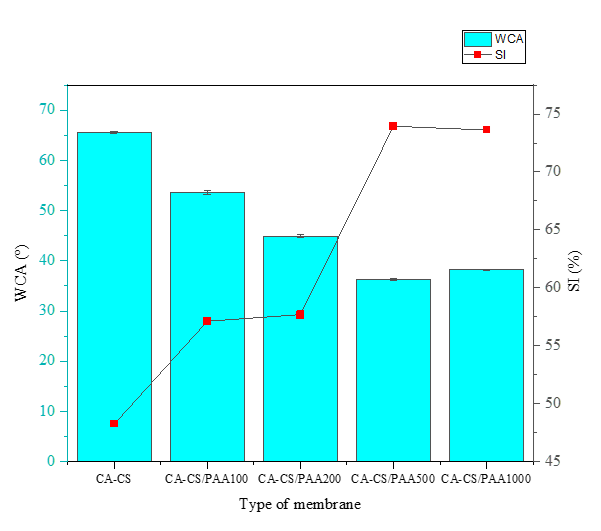
Figure 7 The relationship curve between PAA concentration vs water contact angle and swelling index.
Figure 7 also shows that the swelling index significantly increased with increasing PAA concentration on the CA-CS matrix, from 48.24% in the membrane without PAA to 57.12% with 100 ppm PAA, and then reached an optimum value of 73.95% at 500 ppm. The increase in SI up to a PAA concentration of 500 ppm reflects the increase in hydrophilicity and fixed charges on the membrane surface/bulk due to the addition of carboxyl groups (–COO⁻) from PAA [51]. Under neutral pH test conditions, some of the –COOH groups of PAA ionize to –COO⁻, resulting in strong hydration (solvation by water) and Donnan osmotic pressure from trapped counterions. These 2 factors increase water absorption and cause swelling of the polymer network [38]. Thermodynamically, the addition of polar/charged groups increases the surface energy and decreases the solid-liquid interfacial energy, allowing water to penetrate the polymer network more easily. This finding is consistent with the decrease in WCA values at the same composition [23].
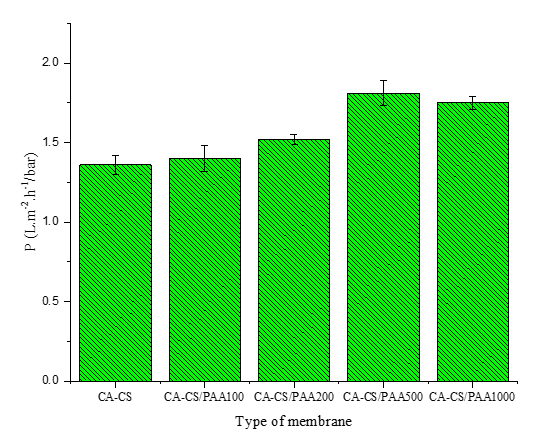
Figure 8 Pure water permeability of the membrane.
Figure 8 shows that the water permeability coefficient increases from CA-CS to CA-CS/PAA 500 ppm, then decreases slightly at 1,000 ppm. The increase up to 500 ppm is accompanied by a decrease in WCA (65.56° to 36.34°) and an increase in SI (48.24% to 73.95%). This correlation is also reflected in the more homogeneous membrane surface contour at CA-CS/PAA 500, leading to a more continuous water-transport pathway. This further confirms the membrane’s very high hydrophilicity after coating with the PAA polyelectrolyte [21]. These results are consistent with a recent study by [55], which reported that introducing PAA into polysulfone ultrafiltration membranes reduced the water contact angle from approximately 65° to 10° - 25°, thereby improving rejection and antifouling properties. However, the addition of excess PAA slightly reduced the flux due to pore compaction. Similarly, PES membranes modified with PAA-functionalized graphene oxide (GO-PAA) showed a significant decrease in contact angle from 79° to 36°, thereby improving water flux and dye rejection [56].
Tensile strength
Figure 9 shows a gradual increase in the tensile strength of the membrane before and after coating from CA-CS from 17 to 21 N/mm⁻²). This increasing trend is due to the formation of the PAA-CS polyelectrolyte complex on the membrane surface, as well as hydrogen bonds as physical cross-links [54]. These cross-links increase the network density and cohesion of the CA/CS interface, reducing chain mobility and, in turn, increasing the tensile strength. Surface smoothing at PAA concentrations of 500 to 1,000 ppm (more homogeneous 3D contours) reduces microdefects, thereby minimizing premature damage and increasing membrane strength. Although mechanistically, PAA increases hydration (which usually plasticizes and can reduce strength), this effect is offset by densification and a greater number of ionic bonds, so that the tensile strength remains increased [52].
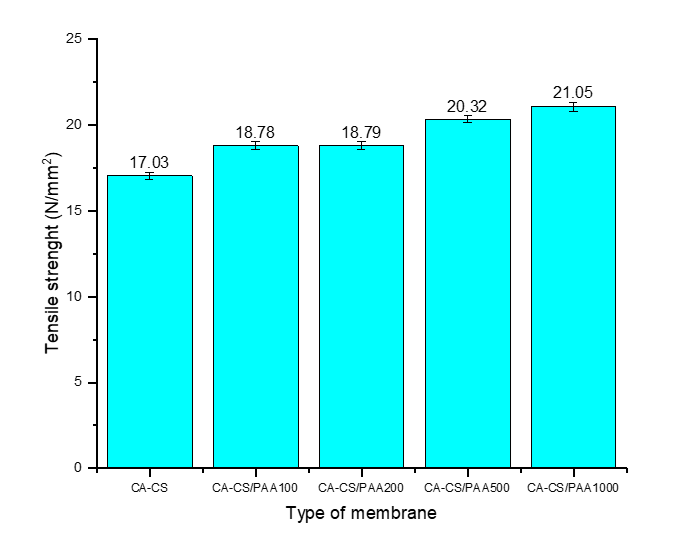
Figure 9 Tensile strength of the membrane.
Flux permeability and PAHs rejection
Table 3 summarizes the results of the membrane performance analysis which consists of 2 main parameters including permeate flux and PAHs rejection at various operation pressure. Figure 10 illustrates the permeate flux increased from the CA-CS membrane to the CA-CS/PAA 500 ppm membrane, then decreased slightly at 1,000 ppm. The increase up to 500 ppm is in line with the smaller water contact angle and the larger swelling index. The addition of the –COOH/–COO⁻ group from PAA makes the surface more hydrophilic, more easily hydrated, and forms more interconnected nanoscale water channels, thereby reducing flow resistance [38].
Table 3 Summary of membrane performance test results in PAHs removal.
Type of membrane |
Average flux (L·m−2·h−1) ± SD |
Average PAHs rejection (%) ± SD |
||||
2 bar |
4 bar |
8 bar |
2 bar |
4 bar |
8 bar |
|
CA-CS |
1.12 ± 0.014 |
5.52 ± 0.014 |
8.18 ± 0.190 |
55.23 ± 0.155 |
58.35 ± 0.035 |
62.08 ± 0.064 |
CA-CS/PAA100 |
1.54 ± 0.021 |
6.05 ± 0.184 |
8.35 ± 0.056 |
70.17 ± 0.057 |
63.59 ± 0.240 |
75.32 ± 0.127 |
CA-CS/PAA200 |
2.03 ± 0.028 |
6.36 ± 0.042 |
8.62 ± 0.014 |
72.48 ± 0.106 |
70.07 ± 0.084 |
74.06 ± 0.233 |
CA-CS/PAA500 |
2.56 ± 0.063 |
6.84 ± 0.134 |
11.56 ± 0.155 |
92.09 ± 0.106 |
90.71 ± 0.084 |
93.21 ± 0.127 |
CA-CS/PAA1000 |
2.32 ± 0.035 |
7.06 ± 0.191 |
9.84 ± 0.120 |
88.50 ± 0.099 |
89.22 ± 0.141 |
90.97 ± 0.261 |
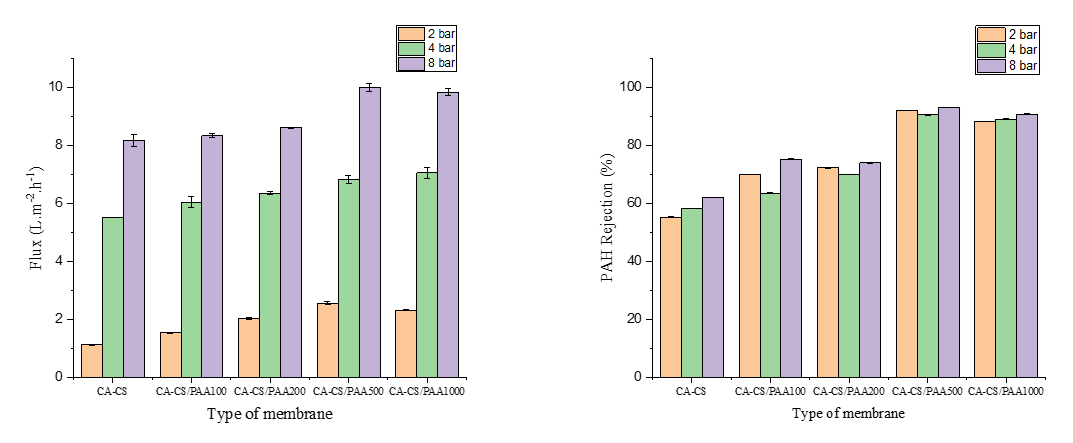
Figure 10 Flux and PAHs rejection of CA-CS and CA-CS/PAA membranes at various operation pressures.
In coating with PAA 1,000 ppm, over-coating or surface densification occurs, which causes the layer to become thicker. There are many physical cross-links, so that hydraulic resistance increases, and as a result, flux does not increase even though the surface remains wet. The increasing hydrophilicity properties with increasing coating concentration not only increase flux, but on the other hand, also have a positive effect on increasing rejection of PAHs pollutants. This is because the highly hydrophobic PAHs are repelled by the increasingly hydrophilic membrane surface, even though the pore size increases with increasing concentration of PAA coating material [27,57]. Based on the flux and PAHs rejection data, it can be assumed that the CA-CS/PAA 500 membrane has the best performance with a balanced trade-off between flux and PAHs rejection.
Table 4 Comparison of the performance of several types of membranes in removing pollutants.
Membrane |
Target solute |
Average flux (L·m−2·h−1) |
Rejection (%) |
Ref. |
CA–CS/PAA |
PAHs (mix) |
Reached 11.56 |
93 - 94 |
This work |
GO/TiO2 membrane |
organics/ions |
5.2 |
70.2 |
[58] |
PDA-MOF5 modified membrane |
oil/organics |
7.4 |
98 |
[14] |
GO-porphyrin |
organics/salts |
7.0 |
25 |
[59] |
PA-MOF |
polyfluoroalkyl |
21 |
84 |
[60] |
NT103 nanofiltration membrane |
PAHs (antrachene) |
- |
76.90 |
[61] |
Table 4 compares the performance of the developed CA-CS/PAA membrane with other reported membranes for pollutant removal. Although not all membranes were explicitly designed for polycyclic aromatic hydrocarbons (PAHs), the comparison provides a general benchmark for evaluating flux and rejection performance across various membrane systems. The CA-CS/PAA membrane demonstrated a superior balance between permeability and selectivity, achieving an average flux of 11.56 L·m⁻²·h⁻¹ and a rejection rate of 93% - 94% for mixed PAH compounds. This performance is notably higher than that of the GO/TiO₂ membrane, which exhibited a lower flux (5.2 L·m⁻²·h⁻¹) and moderate rejection (70.2%) for organic/ionic pollutants [58]. Similarly, while the PDA-MOF5 modified membrane achieved a high rejection rate (98%) for oil/organics, its flux (7.4 L·m⁻²·h⁻¹) remained below that of the CA–CS/PAA system [14]. This indicates that the CA-CS/PAA membrane provides more efficient water transport without sacrificing rejection capability.
Furthermore, GO-porphyrin and PA-MOF membranes showed limited rejection efficiencies or moderate performance of 25% and 84%, respectively, reflecting the permeability-selectivity trade-off common to many hybrid or MOF-based systems [59,60]. In contrast, the nanofiltration membrane, with a rejection rate of 76.9% for anthracene removal, was lower than that of the CA-CS/PAA membrane [61]. In addition, the CA-CS/PAA membrane showed additional advantages of higher flux and simpler fabrication process.
Antifouling study
The high performance of the CA-CS/PAA 500 membrane is greatly influenced by its strong antifouling properties. This can be seen in the flux values for each membrane across the 3 filtration phases (before washing, during washing, and after washing), as shown in Figure 11. The flux of the CA-CS/PAA 500 and 1,000 membranes did not decrease significantly after the washing phase, unlike the CA-CS and CA-CS/PAA 100 and 200 membranes, which did. The low flux decrease after the washing phase for both membranes indicates that the fouling on the membrane surface is reversible, or that the likelihood of fouling is very low.
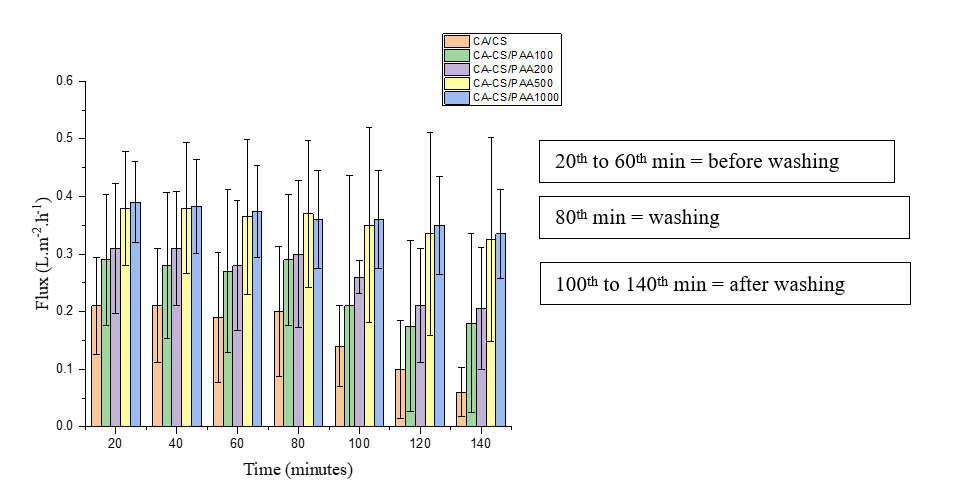
Figure 11 Flux of the membrane at various times.
This fact is confirmed by measurements of the percentage of the Flux Decline Ratio (FDR) and the Flux Recovery Ratio (FRR) for all membrane types. Based on the measurement results shown in Figure 12, the FDR percentage of the CA-CS/PAA 500 membrane is the lowest among the membranes at 20%. This is followed by the highest FRR percentage of the CA-CS/PAA 500 membrane at 78%, indicating that the membrane can recover the best flux because it has the highest anti-fouling properties [21,31]. This performance surpasses several previously reported polymeric membranes. For instance, a study by Ounifi [25] reported a cellulose acetate-poly(acrylic acid) (CA-PAA) blend membrane with an FRR of approximately 65%, which was primarily attributed to the hydrophilic character of PAA but still limited by the absence of strong interfacial hydrogen bonding. Similarly, another study by Guo [62] observed that surface-coated polyamide membranes modified with dopamine–MOF structures achieved FRR values of 70% - 75%, indicating partial, but not complete, flux recovery after fouling. In comparison, the higher FRR in the CA-CS/PAA 500 membrane indicates more efficient mitigation of irreversible fouling, likely due to synergistic hydrogen bonding and ionic interactions between PAA and chitosan, which enhance its hydrophilicity.
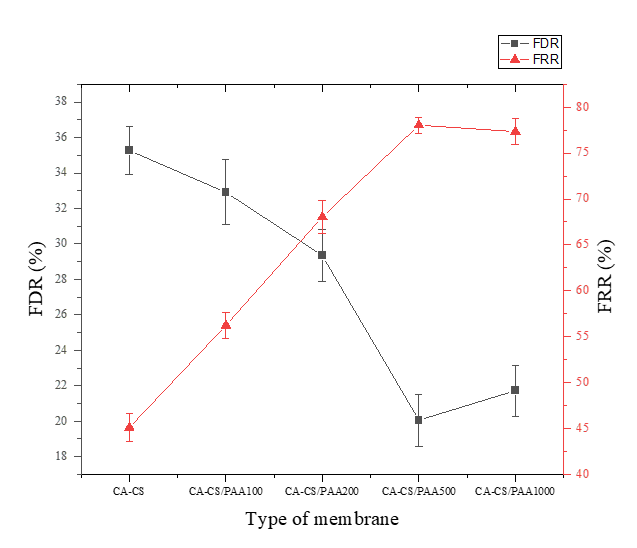
Figure 12 FDR and FRR values of the various membranes.
Furthermore, recent studies by Kadadou et al. [21]; Jasim et al. [45] reported advanced nanocomposite or conductive membranes with FRR values of 85% - 90% under idealized laboratory conditions. However, these membranes often involve complex fabrication steps or costly precursors. In contrast, the CA-CS/PAA system achieves comparable antifouling performance with a more straightforward dip-coating process and low-cost biopolymer materials, demonstrating not only strong antifouling performance but also high practical feasibility for large-scale water purification. The combination of reduced FDR and enhanced FRR confirms that the membrane’s surface chemistry and structural design play a crucial role in minimizing foulant adsorption and maintaining consistent flux recovery.
Conclusions
CA-CS membranes coated with PAA complex polyelectrolyte at various concentrations (100, 200, 500 and 1,000 ppm) have been successfully synthesized to improve the separation performance of PAHs. FTIR characterization results showed the formation of bonds between PAA-CS polyelectrolytes through NH₃⁺/COO⁻ ion pairs, as evidenced by the strengthening of the absorption bands in the 1,560 - 1,600 and 1,410 cm⁻¹ regions and the attenuation of C=O at 1,730 cm−1. The results of SEM analysis and surface contours showed changes from a nodular surface on the CA-CS membrane to a more homogeneous layer after the coating process. The 500 ppm CA-CS/PAA membrane exhibits hydrophilic properties, as evidenced by a low water contact angle of 36.34° and a high swelling index of 73.95%. The membrane performance test results showed that water flux and PAHs rejection increased after CA-CS coating and achieved the best performance at PAA 500 ppm across all operating pressures (2 - 8 bar) with an optimum flux of 11.56 L·m−2·h−1 and an optimum PAHs rejection of 93%. In addition, the CA-CS/PAA 500 membrane showed the best antifouling properties, with the lowest FDR of 20% and the highest FRR of 78%. Furthermore, the membrane coating by dip-coating method using complex polyelectrolyte materials offers good reproducibility, controllable layer thickness, and compatibility with continuous coating systems, making it a promising approach for future industrial-scale membrane fabrication. Overall, the CA-CS/PAA membrane has enormous potential in separating PAHs pollutants from contaminated wastewater and seawater.
Acknowledgements
This research was funded by the DRTPM of Indonesia’s Ministry of Higher Education, Science, and Technology through the Regular Fundamental Research Scheme (contract No: 2937/UN36.11/TU/2025). It also received support from the Institute for Research and Community Service (LP2M) at Universitas Negeri Makassar, Indonesia.
Declaration of generative AI in scientific writing
This manuscript preparation did not use any generative AI tools. No content or data interpretation was executed by generative AI. All authors are responsible for the content and conclusion of this work
CRediT author statement
Muhammad Syahrir: Conceptualization; Methodology; Formal Analysis; Writing-original draft; Resources; Data curation. Muhammad Danial: Data curation; Validation. Muhammad Nur Alam: Visualization; Investigation; Writing; Data Curation. Nururrahmah: Reviewing and Editing. Suriati Eka Putri: Investigation; Data Curation. Rizal Irfandi: Reviewing and Editing; Software.
References
[1] IN Anyanwu, FD Sikoki and KT Semple. Risk assessment of PAHs and N-PAH analogues in sediment cores from the Niger Delta. Marine Pollution Bulletin 2020; 161, 111684.
[2] J Conder, M Jalalizadeh, H Luo, A Bess, S Sande, M Healey and MA Unger. Evaluation of a rapid biosensor tool for measuring PAH availability in petroleum-impacted sediment. Environmental Advances 2021; 3, 100032.
[3] V Soursou, J Campo and Y Picó. Revisiting the analytical determination of PAHs in environmental samples: An update on recent advances. Trends in Environmental Analytical Chemistry 2023; 37, e00195.
[4] RE Jordan, MJ Cejas, HJ Costa, TC Sauer and LS McWilliams. PAH source differentiation between historical MGP and significant urban influences for sediments in San Francisco Bay. Marine Pollution Bulletin 2021; 166, 112248.
[5] MA El-Alfy. Modeling environmental sensitivity and risk assessment of PAHs in sediments along two marine coastal areas in Egypt. Petroleum Research 2024; 9(1), 125-142.
[6] P Takam, A Schäffer, S Laovitthayanggoon, W Charerntantanakul and P Sillapawattana. Toxic effect of polycyclic aromatic hydrocarbons (PAHs) on co-culture model of human alveolar epithelial cells (A549) and macrophages (THP-1). Environmental Sciences Europe 2024; 36(1), 176.
[7] L Wu. Co-exposure effects of urinary polycyclic aromatic hydrocarbons and metals on lung function: Mediating role of systematic inflammation. BMC Pulmonary Medicine 2024; 24(1), 386.
[8] J Potapowicz, M Szopińska, D Szumińska, RJ Bialik and Ż Polkowska. Sources and composition of chemical pollution in Maritime Antarctica (King George Island), part 1: Sediment and water analysis for PAH sources evaluation in the vicinity of Arctowski station. Chemosphere 2022; 288, 132637.
[9] S He and Z Tang. Fabrication and control of porous structures via layer- by-layer assembly on PAH/PAA polyelectrolyte coatings. Biomedical Journal of Scientific and Technical Research 2023; 51(5), 43118-43121.
[10] DW Kim, J Choi, D Kim and HT Jung. Enhanced water permeation based on nanoporous multilayer graphene membranes: The role of pore size and density. Journal of Materials Chemistry A 2016; 4(45), 17773-17781.
[11] F Saffarimiandoab, BY Gul, RS Tasdemir, SE Ilter, S Unal, B Tunaboylu, YZ Menceloglu and İ Koyuncu. A review on membrane fouling: Membrane modification. Desalination and Water Treatment 2021; 216, 47-70.
[12] M Lang, J Luo, Y Wan, X Wang, X Chen and G Zeng. Dual-functional reverse osmosis membranes: A novel Approach to Combat biofouling with enhanced antibacterial and Antiadhesion properties. Journal of Membrane Science 2025; 718, 123699.
[13] Z Gao, L Xu, H Wang, X Wei, K Chen, W Wang, S Zhang and T Lin. Thermal lamination of electrospun nanofiber membrane with woven fabric and yarn embedding effect. Membranes 2025; 15(3), 95.
[14] DP Utomo, TD Kusworo, AC Kumoro, Budiyono and TA Kurniawan. Current trend of MOFs incorporated membranes for advanced wastewater treatment. ASEAN Journal of Chemical Engineering 2023; 23(3), 370-399.
[15] N Nasrollahi, L Ghalamchi, V Vatanpour and A Khataee. Photocatalytic-membrane technology: A critical review for membrane fouling mitigation. Journal of Industrial and Engineering Chemistry 2021; 93, 101-116.
[16] IS Mir, A Riaz, J Fréchette, JS Roy, J Mcelhinney, S Pu, HK Balakrishnan, J Greener, LF Dumée and Y Messaddeq. Bacterial cellulose-graphene oxide composite membranes with enhanced fouling resistance for bio-effluents management. npj Clean Water 2024; 7, 111.
[17] Z Bashir, SSM Lock, N e Hira, SU Ilyas, LG Lim, ISM Lock, CL Yiin and MA Darban. A review on recent advances of cellulose acetate membranes for gas separation. RSC Advances 2024; 14(27), 19560-19580.
[18] A Mojiri, JL Zhou, A Ohashi, N Ozaki and T Kindaichi. Comprehensive review of polycyclic aromatic hydrocarbons in water sources, their effects and treatments. Science of The Total Environment 2019; 696, 133971.
[19] Z Dai, L Ansaloni and L Deng. Recent advances in multi-layer composite polymeric membranes for CO2 separation: A review. Green Energy & Environment 2016; 1(2), 102-128.
[20] A Bilal. Enhancing water purification by integrating titanium dioxide nanotubes into polyethersulfone membranes for improved hydrophilicity and anti-fouling performance. Membranes 2024; 14(5), 116.
[21] D Kadadou, T Arumugham, L Tizani and SW Hasan. Enhanced antifouling and separation capabilities of polydopamine@Ce-MOF functionalized PES ultrafiltration membrane. npj Clean Water 2024; 7(1), 7.
[22] L Zhu. Graphene oxide composite membranes for water purification. ACS Applied Nano Materials 2022; 5(3), 3643-3653.
[23] H Xiao, Z Zhang, S Feng, X Wang and L Wu. Application and prospects of metal-organic frameworks in photocatalytic self-cleaning membranes for wastewater treatment. Journal of Materials Chemistry A 2024; 12(45), 31059-31073.
[24] U Baig, A Waheed, HA Salih, A Matin, A Alshami and IH Aljundi. Facile modification of NF membrane by multi-layer deposition of polyelectrolytes for enhanced fouling resistance. Polymers 2021; 13(21), 3728.
[25] I Ounifi. Antifouling membranes based on Cellulose Acetate (CA) blended with poly(acrylic acid) for heavy metal remediation. Polymers 2021; 11(10), 4354.
[26] C Bai, Z Gu, P Li, R Ning and S Yu. A novel salt-swelling nanofiltration membranes for drinking water purification: High mineral ions passage and efficient organic removal. Journal of the Taiwan Institute of Chemical Engineers 2024; 159, 105473.
[27] OK Turk, M Cakmakci, IH Zengin, D Karadag and E Yuksel. Improving PFAS rejection by ultrafiltration membranes via polyelectrolyte multilayer coating. Membranes 2025; 15(6), 172.
[28] V Kayadoe, N Widiastuti, T Gunawan, WNW Salleh, H Fansuri, TQ Romadiansyah and AW Pratama. Fabrication of PSf/P84-blended membranes with low P84 content: Characteristics and gas separation performance. Case Studies in Chemical and Environmental Engineering 2024; 10, 100835.
[29] M Ahmad, M Ahmed, A Ali, TA Wani, K Khalid and I Ali. Effect of the polyelectrolyte multilayers’ charge on water splitting, fluxes of ions, selectivities and current efficiencies in ion transport through membranes. Desalination 2024; 587, 117925.
[30] C Lee, S Lee and SW Kang. Enhanced porous membrane fabrication using cellulose acetate and citric acid: Improved structural integrity, thermal stability, and gas permeability. Carbohydrate Polymers 2024; 324, 121571.
[31] MS Shalaby. Development of highly flux antifouling RO polyethersulfone membranusing compacted woven support. Desalination and Water Treatment 2018; 127, 83-89.
[32] S Hasima and N Kamila. Cellulose acetate from palm oil bunch waste for forward osmosis membrane in desalination of brackish water. Results in Engineering 2022; 15, 100611.
[33] MA Junker, E te Brinke, CM Vall Compte, RGH Lammertink, J de Grooth and WM de Vos. Asymmetric polyelectrolyte multilayer nanofiltration membranes: Structural characterisation via transport phenomena. Journal of Membrane Science 2023; 681, 121718.
[34] J Rana, G Goindi, N Kaur, S Krishna and A Kakati. Synthesis and application of cellulose acetate-acrylic acid-acrylamide composite for removal of toxic methylene blue dye from aqueous solution. Journal of Water Process Engineering 2022; 49, 103102.
[35] AS Figueiredo, MG Sánchez-Loredo, MN de Pinho and M Minhalma. Surface-charge characterization of nanocomposite cellulose acetate/silver membranes and BSA permeation performance. Membranes 2025; 15(2), 61.
[36] M Fathy, HR Ali, YM Moustafa and A El Shahawy. Removal of suspended matter and salts on ultrafiltration cellulose acetate/expanded polystyrene waste grafted PEG composite membrane. Desalination and Water Treatment 2020; 197, 30-40.
[37] J Wolfs, FCM Scheelje, O Matveyeva and MAR Meier. Determination of the degree of substitution of cellulose esters via ATR-FTIR spectroscopy. Journal of Polymer Science 2023; 61(21), 2697-2707.
[38] KLM Taaca, H Nakajima, K Thumanu, EI Prieto and MR Vasquez. Network formation and differentiation of chitosan–acrylic acid hydrogels using X-ray absorption spectroscopy and multivariate analysis of Fourier transform infrared spectra. Journal of Electron Spectroscopy and Related Phenomena 2023; 267, 14732.
[39] J Rana, G Goindi, N Kaur, S Krishna and A Kakati. Synthesis and application of cellulose acetate-acrylic acid-acrylamide composite for removal of toxic methylene blue dye from aqueous solution. Journal of Water Process Engineering 2022; 49, 103102.
[40] Z Sun. Enhancement of antifouling and separation properties of poly(m-phenylene isophthalamide) hybrid ultrafiltration membrane using highly crystalline poly(heptazine imide) nanosheets. Journal of Membrane Science 2025; 713, 123340.
[41] C Li, T Rui, F He, M Liao, J Dai and T Mo. Improving the desalination performance through conical nanochannels of multilayer oxidized graphene membranes by making a trade-off between the water permeability and salt rejection. Desalination 2026; 617, 119432.
[42] M Ahmad, M Ahmed, A Ali, TA Wani, K Khalid and I Ali. Effect of the polyelectrolyte multilayers’ charge on water splitting, fluxes of ions, selectivities and current efficiencies in ion transport through membranes. Desalination 2024; 617, 119432.
[43] BH Vilsinski, AC de Oliveira, PR Souza and AF Martins. Polysaccharide-based polyelectrolyte multilayers fabricated via layer-by-layer approach: From preparation to applications. Progress in Organic Coatings 2024; 196, 108720.
[44] TA Nguyen, TH Do and TD Ha. Multifunctional biocomposite membrane of bacterial cellulose/chitosan incorporated with green tea leaf extract as a smart colorimetric sensor for sustainable packaging. Trends in Sciences 2025; 22(10), 10667
[45] SA Jasim, NML Al Maimuri, A Hashim, MH Abbas, A Hadi and H Ibrahim. Fabrication and enhancing the features of chitosan/SnO2-ZnO nanocomposites films for optoelectronics and biological applications. Trends in Sciences 2025; 22(10), 10534.
[46] S Javed, IH Aljundi and M Khaled. High fouling-resistance of polyamide desalination-membrane modified with PEI/PAH polyelectrolyte multilayers. Journal of Environmental Chemical Engineering 2017; 5(5), 4594-4604.
[47] MR Moradi. Polyelectrolyte multilayers modification of nanofiltration membranes to improve selective separation of mono- and multivalent cations in seawater brine. Journal of Membrane Science 2024; 691, 122224.
[48] WA Jonkers, WM de Vos and E te Brinke. Asymmetric polyelectrolyte multilayer membranes: Influence of bottom section polycation on layer growth and retention mechanisms. Journal of Membrane Science 2024; 698, 122577.
[49] C Wang, GK Such, A Widjaya, H Lomas, G Stevens, F Caruso and SE Kentish. Click poly(ethylene glycol) multilayers on RO membranes: Fouling reduction and membrane characterization. Journal of Membrane Science 2012; 409, 9-15.
[50] JA Regenspurg, WA Jonkers, MA Junker, I Achterhuis, E te Brinke and WM de Vos. Polyelectrolyte multilayer membranes: An experimental review. Desalination 2024; 583, 117693.
[51] S Ruangdit. Enhanced surface hydrophilicity of polysulfone membrane via atmospheric pressure plasma jet: a comparative evaluation with low-pressure plasma. Trends in Sciences 2025; 22(10), 10629.
[52] MA Abbas. Surface modification of TFC-PA RO membrane by grafting hydrophilic pH switchable poly(acrylic acid) brushes. Advances in Polymer Technology 2020; 2020(1), 8281058.
[53] V Yadav, AV Harkin, ML Robertson and JC Conrad. Hysteretic memory in pH-response of water contact angle on poly(acrylic acid) brushes. Soft Matter 2016; 12(15), 3589-3599.
[54] MD Rossary, JKP Djunaedi, TP Riyantoro and A Setiawati. Tailoring strategy of chitosan-based hydrogel for improving wound healing: A systematic review. Trends in Sciences 2025; 22(11), 11023.
[55] M Kang, Y Zhang, X Ding, J Xu and X Pang. Binding and activating of analgesic crotalphine with human TRPA1. Membranes 2025; 15(6), 187.
[56] IA Khan, AU Khan, MS Butt, HA Janjua, E Uddin, KM Deen, R Sadiq and NM Ahmad. Dye removal from contaminated water through PES membranes enhanced with the incorporation of switchable polyacrylic acid grafted on graphene oxide. ACS Omega 2025; 10(26), 28178-28190.
[57] RS Azam. MXene (Ti3C2Tx)/cellulose acetate mixed-matrix membrane enhances fouling resistance and rejection in the crossflow filtration process. Membranes 2022; 12(4), 406.
[58] X Chen, Z Feng, J Gohil, CM Stafford, N Dai, L Huang and H Lin. Reduced holey graphene oxide membranes for desalination with improved water permeance. ACS Applied Materials & Interfaces 2020; 12(1), 1387-1394.
[59] XL Xu, FW Lin, Y Du, X Zhang, J Wu and ZK Xu. Graphene oxide nanofiltration membranes stabilized by cationic porphyrin for high salt rejection. ACS Applied Materials & Interfaces 2016; 8(20), 12588-12593.
[60] K Zhang, P Cheng, Y Liu and S Xia. Efficient removal of per- and polyfluoroalkyl substances by a metal-organic framework membrane with high selectivity and stability. Water Research 2024; 265, 122276.
[61] J Wang, B Mou and S Wu. Reduction of polycyclic aromatic hydrocarbon (PAH) toxicity risks in crude rice bran oil during storage using membrane filtration. Food Control 2025; 172, 111186.
[62] H Guo, Y Peng, Y Liu, Z Wang, J Hu, J Liu, Q Ding and J Gu. Development and investigation of novel antifouling cellulose acetate ultrafiltration membrane based on dopamine modification. International Journal of Biological Macromolecules 2020; 160, 652-659.