Trends
Sci.
2026;
23(5):
12201
Exploring the Potential of Biochar as Desiccant: Comparison of Sodium Hydroxide and Sulfuric Acid Impregnation Effect on Moisture Uptake
Hadiantono
Hadiantono1,
Moh Djaeni1,*,
![]() ,
Aji Prasetyaningrum1,
,
Aji Prasetyaningrum1,
![]() ,
,
Setia
Budi Sasongko1,
![]() and Ching Lik Hii2,
and Ching Lik Hii2,
![]()
1Department of Chemical Engineering, Faculty of Engineering, Diponegoro University,
Semarang, Central Java 50275, Indonesia
2Department of Chemical and Environment Engineering, Nottingham University, Malaysia Campus,
Semenyih, Selangor Darul Ehsan 43500, Malaysia
(*Corresponding author’s e-mail: [email protected])
Received: 7 October 2025, Revised: 10 November 2025, Accepted: 20 November 2025, Published: 10 January 2026
Abstract
The development of sustainable and low-cost desiccants is imperative for advancing moisture control technologies. The present study investigated the effect of NaOH and H2SO4 impregnation at various concentrations and impregnation times on rice husk char (RHC) and coconut shell char (CSC). The samples were characterized using SEM-EDX, BET-BJH, and FTIR analyses, and their water vapor uptake was evaluated through adsorption–desorption experiments. NaOH impregnation, particularly at 6.0 N for 8 h, markedly enhanced adsorption by promoting pore development and introducing polar oxygenated groups. RHC exhibited the highest capacity of 0.515 g/g, while CSC demonstrated moderate improvement primarily through surface functionalization. In contrast, H2SO4 treatment generated oxygenated and sulfur-containing groups but suppressed pore formation, thereby lowering performance, particularly in CSC. Both adsorption and desorption kinetics followed the pseudo-second-order (PSO) model, while the sorption isotherms were best described by the Henderson model. Desorption analysis revealed activation energies for NaOH-impregnated RHC and CSC (123.8 and 94.9 kJ/mol). Overall, NaOH-treated RHC demonstrated superior adsorption and structural properties, indicating its potential as a renewable desiccant material requiring optimized regeneration efficiency.
Keywords: Biochar, Desiccant, NaOH, H2SO4, Water vapor adsorption, Moisture, Desorption
Introduction
Humidity regulation is a critical requirement across multiple sectors, including agriculture [1], healthcare [2], pharmaceuticals [3], food processing [4], and electronics manufacturing [5]. This is particularly pronounced in regions characterized by consistently high moisture levels such as Indonesia. The country’s average relative humidity is typically situated within the range of 70% to 90% [6]. Elevated levels of humidity can pose significant challenges, which, if unaddressed, may result in a reduction in productivity and pose health risks. This phenomenon, which can lead to corrosion, microbial growth, and material degradation, necessitates
the implementation of active moisture removal strategies known as dehumidification [7].
A common dehumidification method is based on cooling. The operation of this system is predicated on the principle of lowering the air temperature to a level that is below the dew point, thereby inducing the process of condensation of water vapor into liquid form. This process has been shown to release latent heat and effectively remove vapor from the airflow, with evaporator coils functioning as thermal vapor traps [8]. In contrast, desiccant dehumidification, a well-established method and a developing technology, removes moisture primarily through sorption, whereby water vapor is either adsorbed onto the surface of solid porous materials or absorbed into hygroscopic liquids, without requiring condensation [9]. While cooling-based dehumidification systems are effective in warm and humid conditions, this method is energy-intensive. This is in view of the requirement of achieving low dew-point temperatures and additional reheating processes. The system also requires low-temperature cooling sources, typically ranging from 5 - 10 °C, which places a significant demand on the chiller. The utilization of components such as chillers, refrigerants, and evaporators has been demonstrated to result in increased operational costs and system complexity [8]. Desiccant-based systems have been demonstrated to be effective at low humidity levels. However, these systems are subject to significant limitations regarding regeneration, a process which is energy-intensive and often requires very high temperatures [10]. These drawbacks highlight the necessity for alternative desiccant materials that exhibit high moisture-holding capacity and more energy-efficient regeneration.
In the context of food processing, desiccant-based dehumidification has been shown to address the shortcomings of conventional drying methods, which frequently result in thermal damage to nutrients and organoleptic properties [7,11]. Consequently, the capacity of desiccant materials to hold moisture is a pivotal factor in their selection [12]. Desiccants are typically classified into solid and liquid types. Solid desiccants can remove moisture primarily through adsorption, whereas liquid desiccants function through the mechanism of absorption. Several types of liquid desiccants are employed in a variety of contexts including, but not limited to, LiCl, LiBr, CaCl2, MgCl2, and HCOOK [13]. Liquid desiccants typically exhibit a higher moisture-holding capacity in comparison to solid desiccants. Moreover, and the manufacturing cost of liquid desiccant systems is often found to be more economical than that of solid desiccant systems. Nevertheless, liquid desiccants present several limitations, including their corrosive properties that may damage equipment, the potential risk of leakage, and the requirement for complex auxiliary systems such as pumps and storage tanks [14]. In comparison to liquid desiccants, solid desiccants offer several advantages, including higher dehumidification efficiency, simpler system configuration with fewer components, reduced space requirements, easier operation and control, lower regeneration energy demand, and reduced operational and maintenance costs. However, their moisture holding capacity remains relatively limited [10]. Consequently, technologies integrating solid desiccant systems have garnered mounting interest in recent years.
Various types of solid desiccants have been the subject of academic scrutiny, including silica gel [15], silica gel composite [16], zeolite [17], metal-organic framework (MOF) [18], polymer [19,20], activated carbon (AC) [21], and activated carbon composite [22]. Silica gel is distinguished by its high regeneration rate, low regeneration temperature requirement, superior adsorption capacity, and energy efficiency. Mesoporous silica has been the preferred material over conventional silica due to its higher porosity, cost-effectiveness, and structural stability [23]. However, its application in dehumidification is constrained by its limited water uptake capacity even in the newer desiccant [23,24]. The incorporation of hygroscopic salts into silica-based composites has been demonstrated to enhance moisture adsorption, however, such materials have been shown to pose a risk of system corrosion [25]. Zeolite demonstrated optimal functionality in conditions characterized by low-humidity levels. However, the necessity for a high regeneration temperature (150 °C) restricts its applicability owing to the low dehumidification efficiency per unit of energy input (energy efficiency ratio) [19]. Metal-organic frameworks (MOFs) and polymer-based materials exhibit strong hydrophilicity and high dehumidification capacity, rendering them suitable for moisture control applications. However, their practical utilization is constrained by the complex synthesis routes and high production costs associated with their preparation [22]. AC possesses several advantageous characteristics, as its specific surface area (SSA) and pore volume define the upper limit of its water vapor adsorption capacity [26]. However, it is important to note that AC is inherently hydrophobic, as evidenced by its type V adsorption isotherm, which indicates suboptimal performance at low relative humidity [27]. Consequently, a significant number of studies have focused on hydrophilic modification to enhance its adsorption ability under low-pressure conditions. Consequently, the overall performance of AC in water vapor adsorption is significantly determined by both its physical and chemical properties [26]. The incorporation of activated carbon with hygroscopic salts such as LiCl and CaCl2 has been demonstrated to enhance water vapor adsorption capacity [22]. However, this approach carries the risk of salt deliquescence, which can lead to particle aggregation, hinder absorption kinetics, and consequently limit long-term performance [19].
AC can be synthesized from precursors that are rich in carbon and low in inorganic content, such as coal [28] and biomass (biochar) such as rice husk and coconut shell [29]. Biochar has been widely used in CO2 capture applications [30]. Moreover, its application in wastewater treatment has been demonstrated with the removal of organic contaminants and nutrients, resulting in a reduction in chemical demand and water pollution [31]. AC derived from biochar exhibits distinctive water adsorption behavior, with high uptake under high relative humidity and easy regeneration at temperatures below 60 °C [32]. However, studies on AC for dehumidification remain limited, with a predominant focus on water vapor adsorption [21]. In view of the substantial and low cost of agricultural biomass residues, biochar is regarded as a promising candidate for desiccant development.
The process of biochar modification can be achieved through the application of chemical agents including acids (H3PO4, H2SO4, HNO3), base (KOH, NaOH, Na2SiO3), or salt solutions (NaCl, LiCl, CaCl2) [33]. NaOH has been identified as a highly effective impregnating agent due to its ability to significantly modify the pore structure and surface chemistry of char through etching, thereby enhancing SSA, pore volume, and adsorption performance [34]. It has been established that NaOH facilitates more effective chemical modification than KOH, as the smaller size of Na+ compared to K+ enables easier intercalation into the carbon framework of biochar [35]. This treatment has been shown to facilitate pore enlargement and expansion as well as remove residual surface impurities, thereby improving adsorption efficiency [36]. In this study, H2SO4 was utilized as a comparison, thereby facilitating an evaluation of the relative efficacy of alkaline and acidic treatments in modulating water vapor adsorption capacity. [12] demonstrated that both the concentration of the impregnating agent and the impregnation time had a significant effect on the water vapor adsorption capacity of biochar. Building on this finding, the present study examines the effects of impregnation agent concentration and impregnation time of NaOH and H2SO4 on the structural characteristics and water vapor adsorption capacity of biochar.
Materials and methods
Rice husk char (RHC, carbonized at 400 °C for 2 h) and coconut shell char (CSC, carbonized at 450 °C for 3 h) were obtained from a local market in Sleman Regency, Special Region of Yogyakarta, Indonesia. Sodium hydroxide (NaOH, 99% purity, PT. Makro Chemindo, North Jakarta, Indonesia) and sulfuric acid (H2SO4, 98% purity, PT. Petrokimia Gresik, Gresik, Indonesia) were used as reagents without further purification. Distilled water was used throughout the experiments.
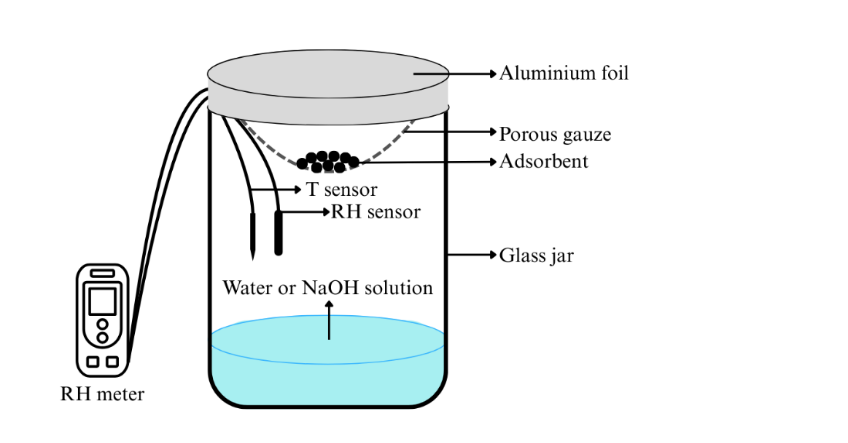
Figure 1 Experimental setup of moisture sorption isotherm.
Preparation of biochar with NaOH or H2SO4 impregnation
Biochar was subjected to a sieving process resulting in a particle size range of 20 - 25 mesh. Subsequently, the biochar underwent a drying procedure in an oven set at a temperature of 383.15 K, which was sustained for a duration of one night. Subsequently, 10 g of dried biochar were then impregnated with 100 mL of NaOH or H2SO4 solutions. For the investigation of concentration variation, the impregnation process was conducted using solutions of 1.2, 2.4, 3.6, 4.8, and 6.0 N for a duration of 8 h. In the context of impregnation time variation, biochar was subjected to impregnation for 4, 6, 8, 10, 12, and 14 h employing 6.0 N NaOH or H2SO4. Subsequent to impregnation process, the sample underwent filtration and was then washed to a state of neutrality: NaOH-treated biochar was subjected to a washing process involving 0.1 N H2SO4 solution and distilled water, whereas H2SO4-treated biochar underwent a washing procedure with a 0.1 N NaOH solution and distilled water. The neutralized sample was then filtered again and dried at 383.15 K overnight. The prepared samples were labelled as A-BC-Dh, where A represents the type of biochar (RHC or CSC), B represents the type of impregnation agent (N for NaOH, S for H2SO4), C represents the concentration of impregnation agent (1.2 - 6.0 N), and D represents the impregnation time (2 - 14 h).
Materials characterization
Among all prepared samples, only selected materials impregnated under specific conditions that yielded the optimum water vapor adsorption performance were further characterized as representative materials. The morphological changes of the biochar were examined using scanning electron microscopy and the elemental composition analysis was determined by means of energy dispersive X-ray analysis (SEM-EDX, JEOL JSM-6510LA). The Fourier Transform Infrared (FTIR) analysis was employed to examine the functional groups of biochar samples. This analysis was conducted using Perkin-Elmer UATR Spectrum Two spectrometer, with a resolution of 1 cm−1 in a range of 400 to 4,000 cm−1. The specific surface area (SBET) and pore size distribution (PSD) were characterized through N2 adsorption-desorption isotherms at 77 K using a Quantachrome Novatouch Lx4. The adsorbed gas amount (Va (cm3/g)) on biochars was utilized to obtain the BET parameters including Vm (volume of monolayer adsorbed gas) and C (BET constant), from the slope and intercept of the linear regression of the BET equation as presented in Eq. (1). In this equation, P0 is the saturation pressure of the adsorbate and P is the equilibrium pressure of the adsorbate. The specific surface area (SBET (m2/g)) of biochars was calculated using Eq. (2). In this equation, NA is Avogadro’s Number (6.02×10²³ molecules/mol), σ is the molecular cross-sectional area of N2 (0.162 nm2), and V is the molar volume of N2 at STP (22,414 cm3/mol) [37].
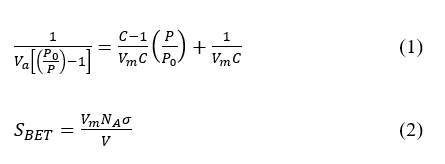
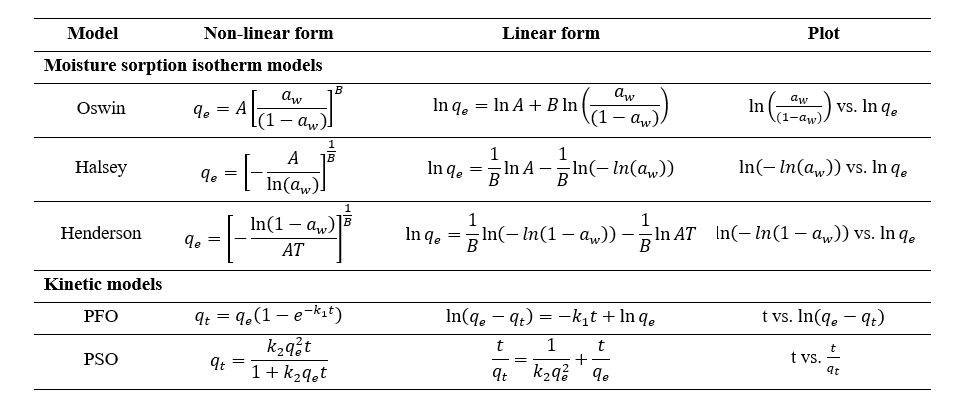
Table 1 Kinetic models and moisture sorption isotherm models used in present study.
Water vapor adsorption analysis
The water vapor adsorption capacity of the prepared sample was evaluated by placing 5 g of sample into an insulated glass jar containing distilled water with a volume equal to approximately one-tenth of the vessel (Figure 1). The sample was suspended above the water surface by means of a porous mesh. The temperature and relative humidity (RH) of the system were monitored with a Humidity & Temperature Data Logger (Elitech Technology, Inc.). In this condition, the average system humidity was found to be 99%. The analysis was conducted at room temperature, with an average value of 299.98 K. The water vapor adsorption capacity data were measured by the gravimetric method with 24-hour intervals until a constant weight was achieved. The adsorption data over time was fitted using pseudo-first-order (PFO) and pseudo-second-order (PSO) kinetic models (Table 1) [12].
For the moisture sorption isotherm analysis, biochar impregnated with 6 N NaOH for 8 h was placed in vessels containing NaOH solutions of varying concentrations (0, 1.5, 4, 6, 9, 12, 16, and 20 M), which were used as humidity regulators. The equilibrium weight data were fitted using several moisture sorption isotherm models, including those of Halsey, Henderson, and Oswin (Table 1) [38]. The performance of each model in representing the experimental data was determined through the coefficient of determination (R2).
Water vapor desorption analysis
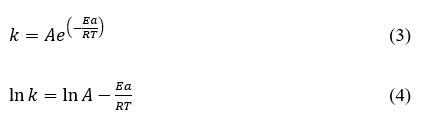
Desorption analysis was conducted utilizing the gravimetric method, employing saturated biochar impregnated with 6 N NaOH for a duration of 8 hours. The experiments were executed at temperatures of 313.15, 323.15, 333.15, and 343.15 K, with weight fluctuations documented at 10-minute interval until a state of constant weight was achieved. The quantity of desorbed water vapor (g/g) as a function of time was modelled using pseudo-first-order (PFO) and pseudo-second-order (PSO) models (Table 1) to obtain the rate constant (k). The k values were subsequently applied to the Arrhenius equation (Eq. (3)), where the regression of ln k versus 1/T from the linearized Arrhenius equation (Eq. (4)) was used to determine the equation parameters [39].
As demonstrated in Eq. (2), The slope of the resulting plot was equivalent to −Ea/R, where R denotes the universal gas constant (8.3145 J·mol−1·K−1). Consequently, the desorption activation energy (Ea) can be determined.
Results and discussion
Surface morphology analysis
As illustrated in Figure 2, the morphology of the outer epidermis RHC surface was evident. The SEM micrograph of untreated RHC (Figure 2(a)) revealed a wavy surface with globular protrusions, consistent with earlier reports [40,41] that describe the epidermal layer of raw rice husk as corrugated or retaining globular domains after pyrolysis owing to the high thermal stability of SiO2. Despite these structural features, the surface of RHC appeared to be relatively non-porous. These morphological features are typically associated with silica particles embedded within the organic matrix of cellulose, hemicellulose, and lignin [42]. Figure 2(b) further accentuates the presence of fine particles attached to the carbon matrix, also attributable to silica-rich residues. This interpretation was corroborated by EDX analysis of RHC (Figure 3(a)), which showed a composition dominated by carbon (31.41 wt%) and oxygen (53.87 wt%) along with a considerable fraction of silicon (14.59 wt%) from SiO2 and a trace of potassium (0.14 wt%) as inorganic impurity.
Figure 2(c) illustrates the morphology of RHC-N6.0-8h, where the surface appears to be disrupted, with cavities and irregular openings replacing the compact structure observed in RHC. Figure 2(d) reveals more pronounced etching effects, where cell walls appear fractured and exfoliated into thin lamellar fragments, suggesting that NaOH treatment not only eroded organic constituents but may also have partially interacted with amorphous silica phases, thereby generating new pores [43]. These morphological observations are consistent with the EDX analysis results of RHC-N6.0-8h (see Figure 3(b)), which demonstrated an increased carbon fraction (46.86 wt%) and decreased oxygen content (38.64 wt%), alongside the amount of silicon (12.40 wt%), and the incorporation of sodium (0.80 wt%) from the impregnating agent. Furthermore, trace levels of sulfur, copper, and zinc were also detected, suggesting their presence as residual impurities.
The SEM micrographs of RHC-S6.0-8h (Figures 2(e) and 2(f)) demonstrate certain similarities to the morphology of untreated RHC (Figures 2(a) and 2(b)) which also exhibits a relatively compact surface characterized by fractured domains, irregular flakes, and cracks, without the clear pore structures compared to RHC-N6.0-8h. Recent studies have indicated that the application of acid treatment tended to result in the enrichment of oxygen functionalities and the modification of surface chemistry while preserving a significant proportion of the carbon framework. This phenomenon stands in contrast to the behavior of alkaline agents such as NaOH, which have been observed to cause a pronounced etching of the carbon matrix and the generation of well-developed porosity [43,44]. The EDX analysis of RHC-S6.0-8h (Figure 3(c)) further supports this interpretation, demonstrating elevated levels of oxygen (48.11 wt%) relative to carbon (38.19 wt%) and the presence of silicon (13.70 wt%), which is consistent with the inherent silica in rice husk char [45].
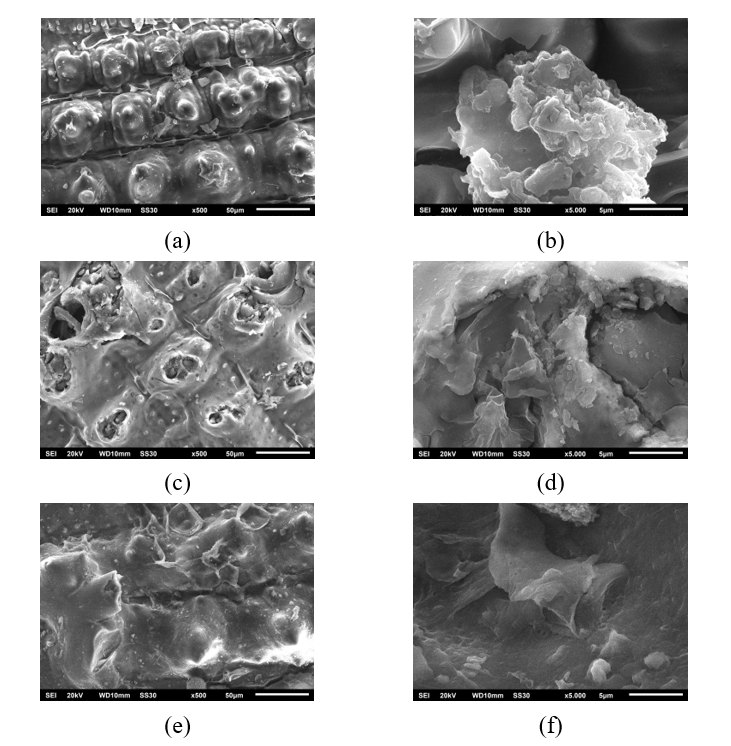
Figure 2 SEM images of RHC at 500 (a) and 5,000 (b) magnification, RHC-N6.0-8h at 500 (c) and 5,000 (d) magnification, RHC-S6.0-8h at 500 (e) and 5,000 (f) magnification.
Nitrogen adsorption analysis
As demonstrated in Figures 4(a) and (b), the N2 adsorption-desorption isotherms obtained for the biochar samples revealed atypical behavior. Several materials, including, RHC, RHC-S6.0-8h, CSC, CSC-N6.0-8h, and CSC-S6.0-8h demonstrate apparent negative adsorption volumes across almost the entire relative pressure range. This anomaly is directly reflected in the BET equation (Eq. (1)), which yields negative Va values and highly scattered 1/[Va(P/P0−1)] plots and prevent any valid linear regression. As a result, the BET fitting produces nonphysical parameters such as unrealistic C constants (either extremely large or negative) and meaningless Vm values, indicating that the adsorption data do not satisfy the assumptions of the BET model. This behavior is at variance with the conventional adsorption isotherm types recognized by the IUPAC classification, which typically exhibit an increase in N2 uptake as P/P0 increases, particularly in Type I to VI isotherms [46]. Consequently, the surface area reported by the instrument is 0 m2/g for these samples (Table 2). This finding aligns with previous reports highlighting that N2 physisorption can produce invalid BET results when its assumptions are not met, particularly for carbonaceous materials with limited porosity or surface chemistry that impedes N2 adsorption at 77 K [46,47].
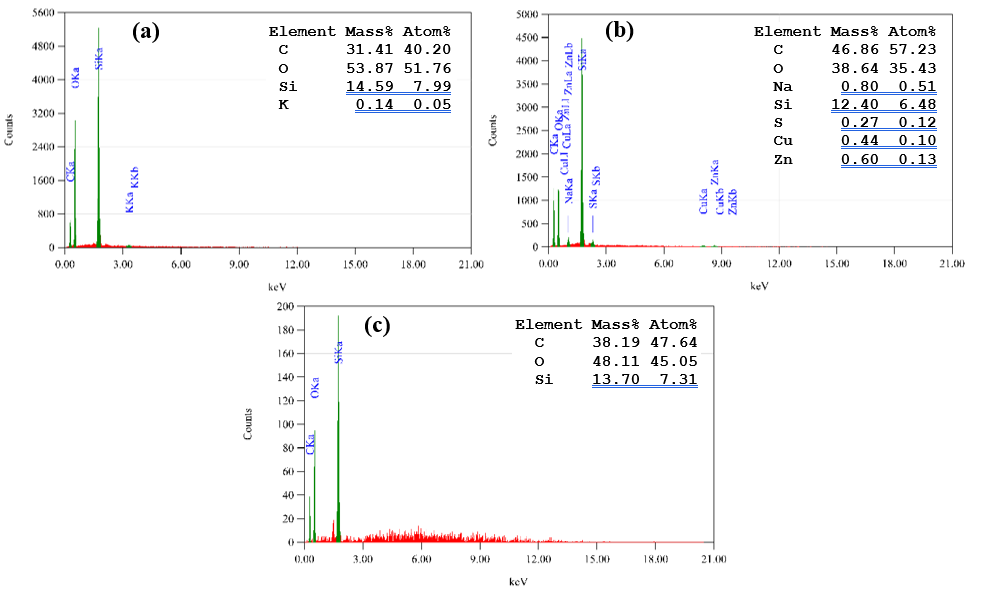
Figure 3 EDX analysis results of (a) RHC, (b) RHC-N6.0-8h, and (c) RHC-S6.0-8h.
A thorough examination of the isotherm branches revealed that, while the adsorption profiles appeared to be nonphysical, desorption-derived BJH data for specific samples, such as CSC-S6.0-8h, which exhibited a minor pore volume contribution (dV/dr ≈ 0.0035 cm3/g.nm at 3.68 nm) (Figure 4(d)), suggests the potential existence of narrow mesopores or the influence of cavitation during desorption. In sharp contrast, RHC-N6.0-8h exhibits a distinct adsorption-desorption loop characteristic of mesoporosity (Figure 4(a)), yielding a measurable BET surface area and a total pore volume. This finding demonstrates that alkaline impregnation can introduce accessible porosity detectable by N2 adsorption, whereas acid-treated or unmodified chars may possess pore structures or surface functionalities that restrict the diffusion of N2 molecules under cryogenic conditions [48,49].
As demonstrated in Table 2, the majority of samples in this study exhibited average pore diameters of approximately ~3.6 - 3.7 nm. However, RHC samples showed a larger average pore size of ~15.7 nm, which, according to the IUPAC classification, are designated as mesoporous (2 nm < Davg < 50 nm) [46]. After NaOH and H2SO4 impregnation, the average pore diameters did not vary significantly, suggesting that both treatments mainly modified the surface chemistry and micropore walls rather than expanding the pores. In RHC, NaOH impregnation promoted mineral dissolution and mesopore formation [43], resulting in a drastic reduction in pore diameter occurred owing to its high silica content, where NaOH reacted with SiO2 to form soluble silicates followed by silica redeposition inside the pores [50]. This densification produced narrower pores, yet the RHC-N6.0-8h showed higher SBET and Vt, indicating the generation of new micropores from silica dissolution [43,50]. In contrast, H2SO4 tended to cause partial pore blockage due to sulfur residues [51,52]. Consequently, the structure became finer and more developed, as evidenced by the BJH pore-size distribution in Figure 4(c), which reveals the emergence of narrow mesopores and micropores after treatment. However, the absence of N2 uptake in samples with mesopore-sized averages suggests the intrinsic limitations of the BET method in characterizing materials with highly heterogeneous and complex pore structures such as biochar [47]. BET analysis becomes unreliable when the assumption of monolayer adsorption is not fulfilled, particularly in the presence of narrow micropores or when the C constant exhibits high values, indicating adsorption on high-energy sites or micropore filling. Moreover, the non-specificity of the BET method toward particular pore types and its sensitivity to measurement conditions can result in a near-zero surface area, even when the pore distribution is clearly detected by BJH analysis, which is more focused on pore-size distribution rather than monolayer coverage [47].
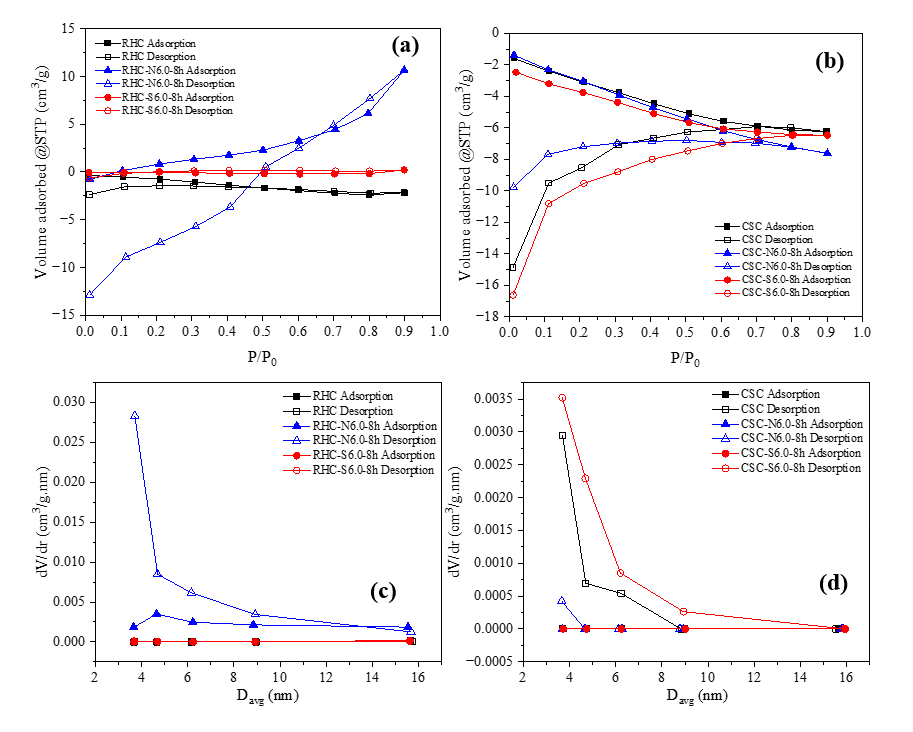
Figure 4 (a,b) N2 adsorption-desorption isotherms and (c,d) pore size distribution plots for RHC-based adsorbent and CSC-based adsorbent.
Table 2 Surface area and pore parameters of different adsorbent.
Sample |
SBET (m2/g) |
Vt (cm3/g) |
davg (nm) |
RHC |
0.00 |
−3.36×10⁻³ |
15.7 |
RHC-N6.0-8h |
3.47 |
1.66×10⁻² |
3.71 |
RHC-S6.0-8h |
0.00 |
3.46×10⁻⁴ |
3.69 |
CSC |
0.00 |
−9.69×10⁻³ |
3.69 |
CSC-N6.0-8h |
0.00 |
−1.18×10⁻² |
3.66 |
CSC-S6.0-8h |
0.00 |
−1.00×10⁻² |
3.68 |
The divergence between the anomalous negative isotherms exhibited by the majority of samples and the positive, valid behavior of RHC-N6.0-8h underscores the notion that these results cannot be attributed solely to instrumentation error. Instead, they highlight the existence of genuine differences in pore accessibility. It has been demonstrated by previous investigations that N2 physisorption frequently underestimates or even fails to detect porosity in biochars in cases where ultramicropores predominate or where surface chemistry is highly polar, resulting in inadequate interaction with N2 at 77 K [46,48]. In this context, the contrasting behavior observed here is consistent with the hypothesis that chemical modification alters not only pore development but also adsorbate-surface interactions.
FTIR analysis
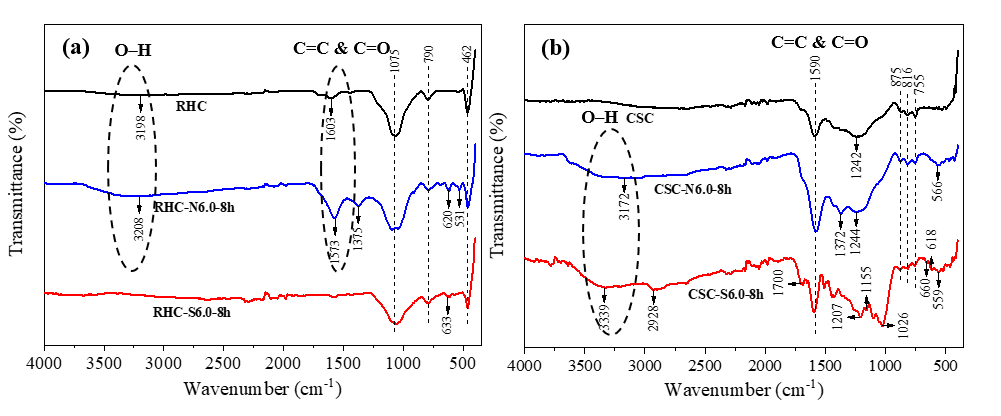
Figure 5(a) presents the result of the FTIR analysis conducted on RHC-based adsorbents. The presence of OH hydroxyl groups was indicated by the small intensity absorption band of RHC and the higher intensity absorption band of RHC-N6.0-8h in the range of 3,000 - 3,500 cm−1 [53]. The peak observed at approximately 1,573 - 1,603 cm−1 in RHC and RHC-N6.0-8h indicated the presence of C=C due to the aromatic ring carbon and C=O bending of oxygen functional groups in carboxylic groups [53,54]. The O–H and C–O stretching bands for phenol were observed at 1,375 cm−1 in RHC-N6.0-8h [53]. The peaks located at 1,075 and 462 cm−1 in all RHC-based samples correspond to Si–O–Si and Si–O–C [55]. The peaks observed at 790 cm−1 in all RHC-based sample suggest C–H stretching for the aromatic [54]. The peaks observed at 620 cm−1 in RHC-N6.0-8h and 633 cm−1 at RHC-S6.0-8h are indicative of S–S stretching, corresponding to disulfide component. The peak at 566 cm−1 in the RHC-N6.0-8h spectrum was indicative of C–S stretching vibrations [53,54].
The FTIR analysis results of the CSC-based biochar adsorbents are presented in Figure 5(b). The broad absorption band of CSC-N6.0-8h and CSC-S6.0-8h in the range of 3,000 - 3,500 cm−1 indicates the presence of OH hydroxyl groups [53]. The absorption band observed at approximately 2,928 cm−1 and peak at 1,700 cm−1 in the CSC-S6.0-8h sample’s spectrum are indicative of the asymmetric C-H stretching vibration and the C=O bond, respectively [53]. The spectra of all CSC-based samples show a peak at approximately 1,590 cm−1, indicating the presence of C=C due to the aromatic ring carbon and C=O bending of oxygen functional groups in carboxylic groups [53,54]. The peaks that appeared exclusively in the CSC-S6.0-8h sample’s spectrum: at 1,155 and 1,207 cm−1 are associated with sulfur-containing groups and can be attributed to the C=S stretching of thiocarbonyl functionalities. The peak at 1,026 cm−1 corresponds to the S=O bending vibration of sulfoxide groups, the peak at 660 cm−1 represents the C–S stretch of thioethers, and the peak at 618 cm−1 refers to the S–S stretching of the disulfide component [53,54]. The presence of the absorption bands at approximately 1,244 cm−1 in all sample is indicative of the C–O stretch of phenol [53]. The O–H and C–O stretching bands for phenol were observed at 1,372 cm−1 in CSC-N6.0-8h. The 875 cm−1 peaks observed in the all CSC-based sample are indicative of C=C bending alkene vinylidene. The 816 and the 755 cm−1 peaks observed in all CSC-based samples are consistent with C–H stretching [54]. The peaks at 566 cm−1 in the CSC-N6.0-8h spectrum and 559 cm−1 in the CSC-S6.0-8h spectrum are attributed to C–S stretching vibrations, indicating the presence of disulfide-related sulfur components [53,54].
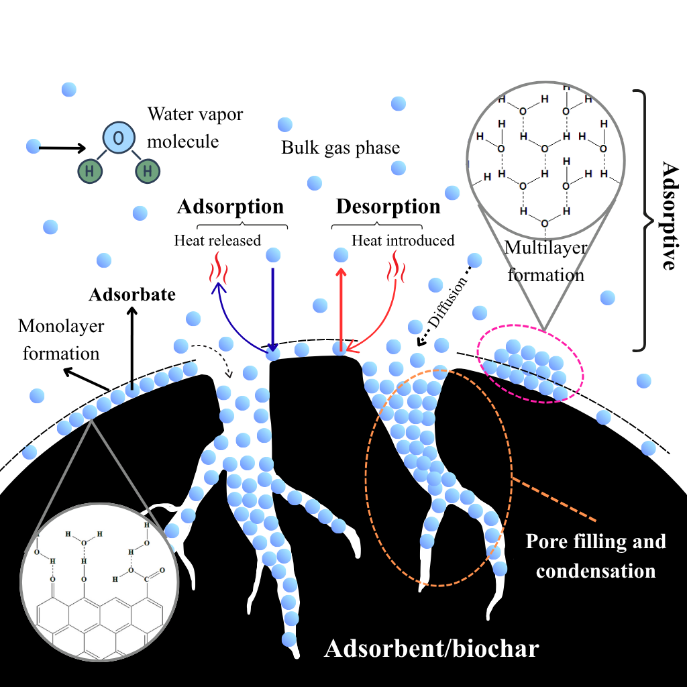
Figure 6 Proposed mechanism of adsorption/desorption on biochar.
Effect of NaOH and H2SO4 concentration and impregnation time on moisture uptake
As illustrated in the proposed adsorption mechanism (Figure 6), water vapor molecules diffuse into the porous structure of biochar and are subsequently captured through hydrogen bonding and capillary condensation on hydrophilic functional sites [20]. The water vapor adsorption capacity of CSC- and RHC-based adsorbents, as demonstrated in Figure 7, manifests distinct trends depending on the impregnating agent and concentration. As demonstrated in Figure 7(a), the control sample exhibited a significantly lower capacity of 0.060 g/g. However, the incorporation of NaOH resulted in a substantial enhancement of water vapor uptake, which increased from 0.306 g/g at 1.2 N to 0.515 g/g at 6.0 N. The observed increase in water vapor adsorption capacity of RHC with increasing NaOH concentration can be attributed to concentration-dependent physicochemical transformations. At lower concentrations, NaOH etched the silica-rich domains embedded in the carbon matrix, as evidenced by the slight reduction in Si signals in EDX (14.59 to 12.40 wt%) (Figure 3(b)). This observation is consistent with previous findings that demonstrated the efficacy of alkali treatment in significantly reducing silicon content. This reduction is attributed to the leaching and dissolution of silica into soluble silicates that are subsequently removed during post-treatment washing, thereby opening additional adsorption sites [43]. This hypothesis was further corroborated by FTIR, which revealed decreased Si–O–Si and Si–O–C intensities alongside the emergence of stronger O–H and C–O vibrations. These findings indicate surface functionalization with polar hydroxyl and phenolic groups. As the NaOH concentration increased, the reactions intensified, leading to progressive etching of the RHC surface, and the generation of new pores as evidenced by SEM images (Figure 2(c)) showing disrupted morphology and by the increase in surface area (from 0 to 3.47 m2/g) and pore volume (from –3.36×10⁻³ to 1.65×10⁻² cm3/g). This dual behavior underscores the pivotal role of NaOH concentration in regulating the physicochemical properties of biochar, thereby facilitating the water vapor adsorption [12,36,43]. Acid treatment of RHC with H2SO4 resulted in a gradual increase in water vapor uptake from 0.060 g/g in the control to 0.206 g/g at 6.0 N, yet the improvement remained moderate compared with NaOH-impregnated RHC. The morphology of RHC-S6.0-8h (Figure 2(e)) revealed a compact surface with fractured domains and irregular flakes, in contrast to the cavities observed in NaOH-impregnated RHC. BET analysis confirmed negligible porosity (SBET ≈ 0 m2/g; Vt = 3.46×10⁻⁴ cm3/g), indicating that pore development did not occur to enhance the water vapor adsorption sites [51,52]. Instead, the enhanced uptake can be attributed to chemical modification, as evidenced by FTIR spectra of C=O and aromatic C=C (1,573 - 1,603 cm−1) and the appearance of S–S stretching at 633 cm−1, in conjunction with high oxygen content detected by EDX (48.11 wt%). The results suggest that H2SO4 predominantly functionalized the carbon surface with oxygenated and sulfur-containing groups, thereby improving hydrophilicity. However, the absence of significant textural evolution limited the adsorption capacity compared with the strongly etched and porous structure generated by NaOH treatment [12,51,52].
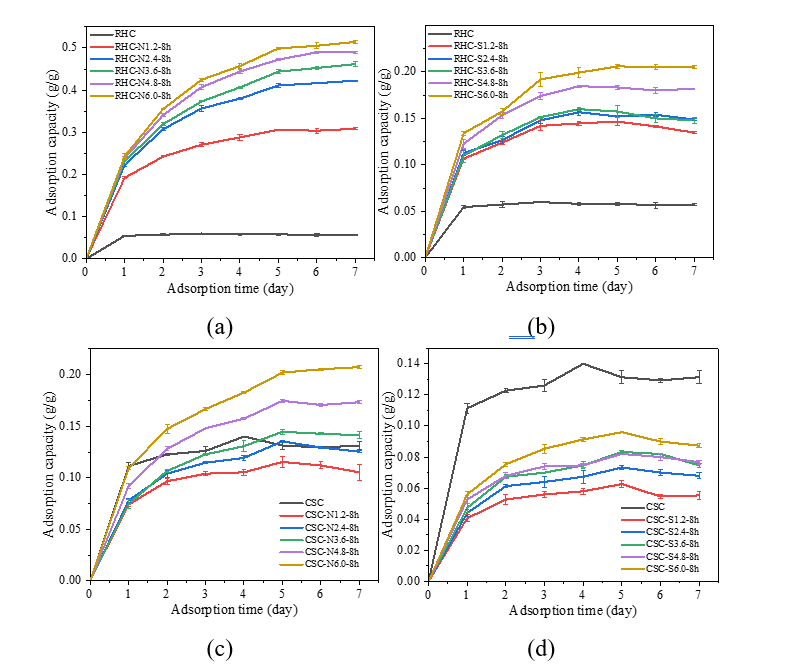
Figure 7 Adsorption kinetics curves at 299.98 K and 99% RH of (a) RHC impregnated with NaOH, (b) RHC impregnated with H2SO4, (c) CSC impregnated with NaOH, and (d) CSC impregnated with H2SO4 with different concentrations.
A divergent pattern is evident in Figures 7(c) and 7(d) for CSC-based adsorbent. As illustrated in Figure 7(c), the CSC sample that had been impregnated with NaOH exhibited both lower and higher capacities in comparison to the control sample (0.140 g/g). Initially, there was a decrease to 0.115 g/g at 1.2 N, which approached the control at 2.4 - 3.6 N (0.135 - 0.145 g/g). Subsequently, it surpassed the control at higher concentrations, reaching 0.207 g/g at 6.0 N. This phenomenon can be attributed to the surface chemistry rather than to textural development, as indicated by the BET analysis that showed essentially negligible surface area and non-porous character (SBET ≈ 0 m2/g, Vt < 0).
Treatment with NaOH has been shown to induce hydrolysis and ion-exchange reactions on the biochar surface, which can alter pre-existing acidic functionalities (such as –COOH and –OH) and promote the formation of new aliphatic domains. It is evident from the FTIR spectra (Figure 5(b)) that the pristine CSC exhibited C=O of carboxylic and C–O of phenol groups that serve as polar sites for water interaction. The lower adsorption capacities observed at 1.2 - 3.6 N suggest partial modification of these groups, likely through the neutralization of carboxylic parts into carboxylate salts (–COONa) [56], which reduces their ability to donate hydrogen bonds for water adsorption and may be partly removed during the washing process. At higher NaOH concentration of 6 N, the spectra revealed the emergence and intensification of O–H and C–O phenolic vibrations, consistent with the cleavage of ester or ether linkages and the formation of additional phenolic and alcoholic hydroxyl groups. These transformations have been shown to increase the abundance of oxygenated functionalities, thereby enhancing surface hydrophilicity and improving water adsorption performance [12,57].
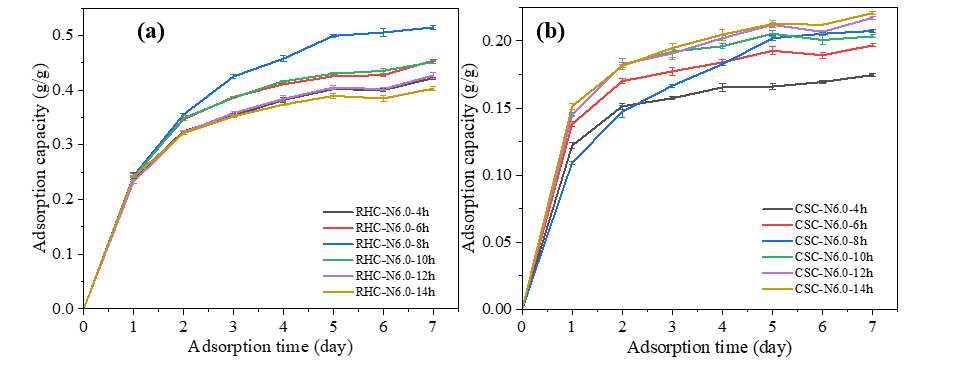
Figure 8 Adsorption kinetics curves at 299.98 K and 99% RH of (a) RHC impregnated with NaOH, (b) CSC impregnated with NaOH with different impregnation times.
Conversely, Figure 7(d) demonstrated that H2SO4 impregnation of CSC consistently suppressed adsorption, yielding only 0.063 - 0.096 g/g across all concentrations. This reduction can be attributed to the action of H2SO4, which, while capable of introducing oxygenated and sulfur-containing functional groups onto the biochar surface, simultaneously induce destructive reactions that collapse or block the pore framework, thereby reducing the effective surface area and limiting the adsorption sites [51,52]. In addition, Hadiantono et al. [52] reviewed that the lower water vapor adsorption capacity of H2SO4-impregnated CSC compared to pristine CSC can be attributed to a reduction in surface polarity following sulfur modification. The FTIR spectra of pristine CSC demonstrated the presence of polar oxygenated groups, including C=O (carboxylic) and C–O (phenolic), which provide strong hydrogen-bonding sites for water molecules. In contrast, the CSC-S6.0-8h sample exhibited sulfur-containing functionalities including C=S, C–S, and S–S, which possess reduced polarity and diminished hydrogen-bonding potential. These functionalities were accompanied by a modest enhancement in S=O vibrations, which while polar, are less adept at water interactions, and are typically regarded as less efficacious hydrogen-bonding sites in comparison to C=O or C–O groups. The net decrease in polar oxygenated functionalities provides a rationale for the consistently lower adsorption observed after H2SO4 treatment. Although higher acid concentrations slightly increased uptake through the incorporation of new polar S=O and enhanced C=O groups, this effect appears to be counterbalanced by the concurrent reduction of more effective oxygenated sites and indications of deterioration in the pore structure. Taken together, these changes suggest that the combined loss of polarity and potential pore damage prevented full recovery of adsorption capacity, resulting in values that remained below those of untreated CSC [51,52].
Figure 8 illustrates the influence of impregnation time on water vapor uptake of biochars impregnated with 6.0 N NaOH. NaOH-impregnated RHC demonstrated optimal performance at intermediate times (Figure 8(a)), exhibiting an increase in capacity from 0.402 g/g at 4 h to a maximum of 0.515 g/g at 8 h, followed by a progressive decline to 0.403 g/g at 14 h. In contrast, the adsorption capacity of NaOH-impregnated CSC (Figure 8(b)) exhibited a steady increase with prolonged treatment, rising from 0.169 g/g at 4 h to 0.213 g/g at 14 h, with only minor variations beyond 8 hours of impregnation, indicating gradual pore development and stabilization at extended durations. This divergent behavior suggests that while prolonged NaOH exposure continues to enhance porosity in CSC, excessive treatment in RHC may induce partial pore collapse or surface restructuring, thereby diminishing adsorption capacity after the optimum point [12,36].
Table 3 Parameters of linear PFO and PSO model of adsorption at 299.98 K.
Sample |
PFO |
PSO |
||||
k1 (day-1) |
qe |
R2 |
k2 (g/g/day) |
qe |
R2 |
|
RHC |
1.557 |
0.045 |
0.907 |
414 |
0.059 |
0.999 |
RHC-N1.2-8h |
0.684 |
0.265 |
0.989 |
3.52 |
0.347 |
0.999 |
RHC-N2.4-8h |
0.696 |
0.458 |
0.979 |
1.60 |
0.502 |
0.999 |
RHC-N3.6-8h |
0.634 |
0.498 |
0.981 |
1.20 |
0.563 |
0.999 |
RHC-N4.8-8h |
0.640 |
0.511 |
0.990 |
1.10 |
0.605 |
0.998 |
RHC-N6.0-8h |
0.671 |
0.579 |
0.979 |
1.01 |
0.638 |
0.998 |
RHC-S1.2-8h |
1.074 |
0.142 |
0.985 |
35.6 |
0.145 |
0.990 |
RHC-S2.4-8h |
0.907 |
0.143 |
0.964 |
17.0 |
0.161 |
0.994 |
RHC-S3.6-8h |
0.933 |
0.151 |
0.984 |
23.4 |
0.159 |
0.991 |
RHC-S4.8-8h |
0.924 |
0.177 |
0.993 |
10.1 |
0.198 |
0.996 |
RHC-S6.0-8h |
0.850 |
0.201 |
0.983 |
6.02 |
0.230 |
0.996 |
RHC-N6.0-4h |
0.721 |
0.675 |
0.990 |
10.6 |
0.185 |
0.999 |
RHC-N6.0-6h |
0.478 |
0.340 |
0.956 |
1.89 |
0.514 |
0.998 |
RHC-N6.0-10h |
0.560 |
0.714 |
0.985 |
1.84 |
0.518 |
0.999 |
RHC-N6.0-12h |
0.493 |
0.330 |
0.958 |
1.96 |
0.485 |
0.998 |
RHC-N6.0-14h |
0.547 |
0.293 |
0.940 |
2.80 |
0.446 |
0.999 |
CSC |
0.741 |
0.096 |
0.845 |
47.8 |
0.135 |
0.996 |
CSC-N1.2-8h |
0.618 |
0.087 |
0.924 |
20.2 |
0.117 |
0.989 |
CSC-N2.4-8h |
0.529 |
0.110 |
0.953 |
9.17 |
0.144 |
0.990 |
CSC-N3.6-8h |
0.583 |
0.132 |
0.992 |
5.05 |
0.170 |
0.994 |
CSC-N4.8-8h |
0.575 |
0.158 |
0.991 |
4.09 |
0.206 |
0.996 |
CSC-N6.0-8h |
0.737 |
0.254 |
0.949 |
2.91 |
0.250 |
0.997 |
CSC-S1.2-8h |
0.639 |
0.048 |
0.947 |
78.8 |
0.059 |
0.984 |
CSC-S2.4-8h |
0.615 |
0.058 |
0.946 |
24.1 |
0.076 |
0.991 |
CSC-S3.6-8h |
0.552 |
0.067 |
0.942 |
17.7 |
0.087 |
0.980 |
CSC-S4.8-8h |
0.613 |
0.062 |
0.924 |
23.4 |
0.085 |
0.993 |
CSC-S6.0-8h |
0.737 |
0.091 |
0.997 |
18.9 |
0.099 |
0.986 |
CSC-N6.0-4h |
0.535 |
0.103 |
0.923 |
10.6 |
0.185 |
0.999 |
CSC-N6.0-6h |
0.747 |
0.141 |
0.951 |
9.43 |
0.209 |
0.999 |
CSC-N6.0-10h |
0.769 |
0.151 |
0.948 |
11.1 |
0.217 |
0.999 |
CSC-N6.0-12h |
0.726 |
0.166 |
0.964 |
7.01 |
0.234 |
0.998 |
CSC-N6.0-14h |
0.779 |
0.170 |
0.978 |
6.85 |
0.237 |
0.999 |
As presented in Table 3, the results of the kinetic fitting process generally support the PSO model, although there are some exceptions that indicate the presence of mixed adsorption behavior. The majority of NaOH-impregnated RHC samples demonstrated excellent PSO fits (R2 ≈ 0.998 - 0.999, with calculated qe values closely matching experimental uptake), indicative of chemisorption-driven adsorption facilitated by increased porosity and surface oxygenated groups [12]. By contrast, specific CSC samples exhibited closer or comparable fits to the PFO model, suggesting a more pronounced contribution from physisorption where pore development was constrained. In certain instances, only slight disparities were observed between the models, indicating coexisting physisorption and chemisorption processes. These findings are consistent with those reported by Faggiano et al. [57], who observed that while PSO frequently provides the most accurate description of functionalized biochar adsorption kinetics, conditions characterized by restricted porosity or altered surface chemistry can result in competitive fits with PFO.
Figure 9 Equilibrium moisture uptake at 299.98 K.
Table 4 Parameters of linear moisture sorption isotherm models at 299.98 K.
Sample |
Model |
A |
B |
R2 |
RHC-N6.0-8h |
Oswin |
0.048 |
0.659 |
0.907 |
|
Halsey |
0.085 |
1.354 |
0.861 |
|
Henderson |
0.021 |
0.745 |
0.975 |
CSC-N6.0-8h |
Oswin |
0.032 |
0.529 |
0.854 |
|
Halsey |
0.118 |
1.707 |
0.791 |
|
Henderson |
0.049 |
0.904 |
Taken together, these observations suggest that NaOH impregnation is more favorable for enhancing water vapor adsorption, as it promotes pore development and introduces polar oxygenated groups. By contrast, H2SO4 treatment, although contributing sulfur- and oxygen-containing functionalities, maintains a compact structure and may reduce surface polarity in CSC. The pronounced enhancement observed in RHC contrast with the more moderate or even suppressed capacities in CSC, thus highlighting the role of the precursor, as previously highlighted by Hadiantono et al. [52]. The physicochemical properties of prepared biochar are critically influenced by the feedstock type, as previously indicated by Taheri et al. [54]. This finding suggests that NaOH-modified biochars, particularly those derived from RHC, exhibit enhanced potential for moisture adsorption applications [12], while H2SO4-modified biochars may be more suitable for alternative applications such as contaminant remediation [58]. As summarized in Table 7, the NaOH-modified rice husk char (RHC-N6.0-8h) exhibited a higher water vapor uptake than commercial silica gel, zeolite Na-X, and several physically activated carbons such as coconut shell and activated carbon fiber cloth. This result indicates that simple chemical activation using NaOH can achieve better performance than some conventional adsorbents that require high activation temperature and energy. However, the uptake of RHC-N6.0-8h remains lower than that of MOF- and LiCl-based composites. It is worth noting that although these materials exhibit higher capacities, their synthesis processes are more complex and costly, and the use of hygroscopic salts such as LiCl may lead to deliquescence, corrosion, and stability issues during operation.
Moisture sorption isotherm modelling
The impregnation condition of 6 N NaOH and 8 h of impregnation were selected for the purpose of examining the biochar’s performance under various water activity levels, resulting in moisture sorption isotherm curve as presented in Figure 9. The results of the fitting process for the moisture sorption isotherms of RHC-N6.0-8h and CSC-N6.0-8h (see Table 4) highlight distinct trends across the Oswin, Halsey, and Henderson models. The results of the moisture sorption isotherm analysis demonstrated that the Henderson model provided the most accurate fit for both the RHC-N6.0-8h and CSC-N6.0-8h, with R2 values of 0.975 and 0.968, respectively. This finding is notable as it contrasts with some previous studies on similar materials. For instance, research conducted on broiler litter amended with biochar revealed that the Oswin and Halsey models exhibited superior accuracy in comparison to the Henderson model [38]. A similar study on tiger nuts reported the Peleg, Smith, and GAB models as the most suitable [59]. The superior performance of the Henderson model in this study suggests that its strong theoretical basis may be particularly well-suited for characterizing the moisture sorption behavior of these specific materials.
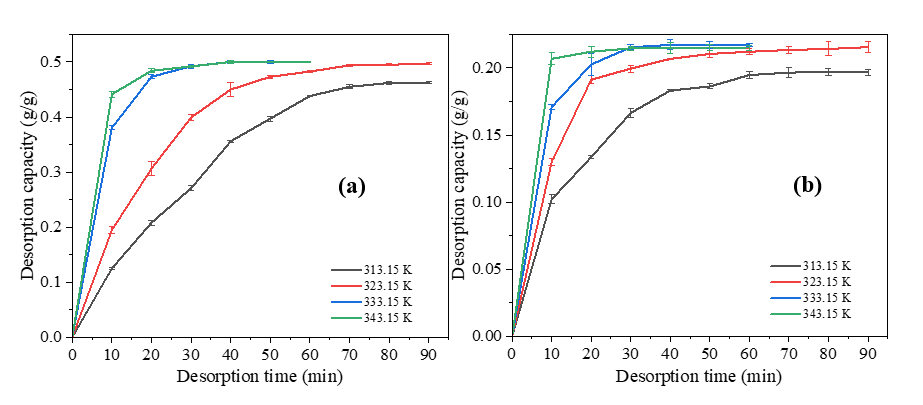
Figure 10 Desorption kinetics curves of (a) RHC-N6.0-8h and (b) CSC-N6.0-8h at different temperature.
Table 5 Parameters of linear PFO and PSO model of desorption.
Sample |
T (K) |
PFO |
PSO |
||||
k1 (min−1) |
qe (g/g) |
R2 |
k2 (g/g/min) |
qe (g/g) |
R2 |
||
RHC-N6.0-8h |
313.15 |
0.071 |
0.997 |
0.872 |
0.028 |
0.750 |
0.973 |
|
323.15 |
0.065 |
0.578 |
0.993 |
0.091 |
0.615 |
0.991 |
|
333.15 |
0.140 |
0.485 |
0.999 |
0.648 |
0.530 |
0.999 |
|
343.15 |
0.137 |
0.344 |
0.947 |
1.435 |
0.513 |
0.999 |
|
|
|
avg. |
0.953 |
|
avg. |
0.990 |
CSC-N6.0-8h |
313.15 |
0.071 |
0.224 |
0.960 |
0.385 |
0.226 |
0.997 |
|
323.15 |
0.083 |
0.174 |
0.988 |
0.835 |
0.230 |
0.998 |
|
333.15 |
0.154 |
0.232 |
0.987 |
1.640 |
0.229 |
0.999 |
|
343.15 |
0.222 |
0.149 |
0.924 |
10.89 |
0.217 |
1.000 |
|
|
|
avg. |
0.965 |
|
avg. |
0.999 |
While the Oswin and Halsey models also provided a reasonably good fit, their lower R2 values indicate that they are less reliable for predicting moisture content across the full range of water activity compared to the Henderson model. The parameters of these models, while devoid of direct physical meaning [38], are consistent with a Type II sigmoidal isotherm curve according to Brunauer classification, which is characteristic of biological and food products [59]. The Henderson model’s exceptional fit underscores the unique relationship between aw and moisture content in of RHC-N6.0-8h and CSC-N6.0-8h. The relationship between these factors is influenced by the chemical composition and physical structure of the material in question. The findings of this study indicate that, for these particular samples, the structure and composition are adequately represented by the parameters of the Henderson model. It is recommended that future research should aim to explore the influence of varying temperatures on these models. The Henderson model is distinguished by its unique incorporation of a temperature term, a feature that has potential to offer further insights into the material's thermodynamic properties [38].
Figure 11 The plot of ln k against 1/T.
Table 6 Summary of Arrhenius equation parameter obtained from desorption kinetic modelling.
Sample |
Slope (−Ea/R) |
Intercept (ln A) |
R2 |
Ea (kJ/mol) |
A (min-1) |
RHC-N6.0-8h |
−14,885 |
43.9 |
0.979 |
123.8 |
1.16×10¹⁹ |
CSC-N6.0-8h |
−11,419 |
35.3 |
0.922 |
94.9 |
Water vapor desorption analysis
The desorption analysis of RHC-N6.0-8h and CSC-N6.0-8h at different temperatures yielded the desorption kinetic curves in Figure 10. During desorption, the adsorbed water molecules diffuse out from the pores as hydrogen bonds weaken and vapor pressure increases due to heating (Figure 6) [20]. The kinetic analysis of desorption data (Table 5) demonstrates that the PSO model generally provides a superior description of water release from both RHC-N6.0-8h and CSC-N6.0-8h, with average coefficients of determination of 0.990 and 0.999, respectively, in comparison to 0.953 and 0.965 for the PFO model. This predominance of PSO fitting suggests that desorption is largely governed by chemisorption-like interactions and the availability of surface functional groups, rather than by physisorption-controlled processes alone [12,57]. However, the desorption of RHC-N6.0-8h at 323.15 K, as modelled by the PFO model, yielded an R2 that was marginally higher (0.993 vs. 0.991). This finding suggests that, under specific thermal conditions, physical desorption and diffusion contributions may partially influence the mechanism. It is important to note that, while PSO provided reliable qe values consistent with the experimental plateaus, several qe estimates from PFO clearly exceeded the measured capacity. This highlights the limitations of PFO fitting for this system. The rate constants derived from PSO (k2) exhibited a systematic increase with temperature for both materials, thereby aligning with thermally activated desorption mechanism. Arrhenius analysis of k2 (Figure 11) yielded activation energies of 123.8 kJ/mol for RHC-N6.0-8h and 94.9 kJ/mol for CSC-N6.0-8h (Table 6).
For context, Kosasih et al. [39] reported substantially lower activation energies for water desorption from silica gel, ranging from 22.9 to 35.2 kJ/mol depending on the humidity ratio and airflow. In addition, Djaeni et al. [60] found an Ea of 40.3 kJ/mol for a silica-impregnated mangrove wood char composite. The comparatively low values for silica gel are consistent with its well-developed mesoporous network, where water molecules are predominantly physisorbed and can be released with minimal energy input. Silica-modified biochar has been shown to exhibit slightly higher Ea due to the presence of additional hydrogen-bonding interactions at the carbon-silica interface. However, desorption remains relatively facile owing to the preserved pore architecture. In contrast, the considerably elevated Ea values of RHC- and CSC-based adsorbents in this study suggest the presence of more pronounced water-surface interactions and confinement effects. This interpretation is consistent with the findings of Wang et al. [22], who highlighted that in activated carbon with a high concentration of oxygenated functionalities, water molecules interact through multiple hydrogen-bonding modes, resulting in elevated energetic barriers for release. The hypothesis was corroborated by SEM and BET analysis. RHC-N6.0-8h exhibited disrupted morphology and newly formed pores, while FTIR analysis confirmed an enrichment in polar O–H and C–O groups, thereby providing strong adsorption sites that increase binding energy. CSC-N6.0-8h, despite its reduced porosity, exhibited the capacity to retain functional oxygenated groups thereby facilitating the stabilization of water binding. The structural and chemical properties of biochars are the key factors that determine their desorption energy requirements. In this study, the biochars exhibited a significantly higher energy demand for desorption in comparison to conventional silica-based desiccants.
Table 7 Comparison of the equilibrium water vapor adsorption capacity on various adsorbents.
Adsorbents |
qe (g/g) |
RHads (%) |
Tads (K) |
Reference |
KOH-modified rice husk char |
0.420 |
99 |
300.15 |
[12] |
Heartnut walnuts shell activated carbon |
0.41 |
90 |
303.15 |
[21] |
Coconut shell activated carbon |
0.278 |
90 |
298.15 |
[61] |
Activated carbon fiber cloth |
0.396 |
90 |
298.15 |
[61] |
Commercial silica gel |
0.192 |
99 |
300.15 |
[12] |
Rice husk ash-derived silica gel |
0.75 |
84 |
303.15 |
[62] |
Mangrove wood char/silica gel composite |
0.337 |
99 |
302.96 |
[50] |
Zeolite Na-X |
0.219 |
99 |
298.15 |
[63] |
Activated carbon/silica gel/LiCl composite |
1.49 |
60 |
303.15 |
[22] |
MOF MIL-100(Fe)/LiCl composite |
1.77 |
65 |
298.15 |
[64] |
NaOH-modified rice husk char |
0.515 |
99 |
299.98 |
This work |
Conclusions
The present study demonstrated that chemical impregnation exerts a significant influence on the structural and adsorption properties of RHC and CSC as potential desiccants. NaOH impregnation, particularly at a concentration of 6.0 N for a duration of 8 h, was found to be the most effective method of enhancing water vapor uptake. This enhancement was primarily attributable to the development of pores and the introduction of polar oxygenated functional groups. RHC demonstrated a maximum capacity of 0.515 g/g, surpassing the moderate improvement observed in CSC, which was primarily driven by surface functionalization. In contrast, H2SO4 treatment introduced oxygenated and sulfur-containing groups but generally suppressed pore formation, resulting in lower adsorption performance, especially for CSC. Kinetic analysis confirmed that the PSO model best described both adsorption and desorption processes, indicating chemisorption-dominated mechanisms. Furthermore, the moisture sorption isotherms of NaOH-treated biochars were found to be most accurately represented by the Henderson model. Desorption analysis further revealed higher activation energies for both RHC- and CSC-based adsorbents (123.8 and 94.9 kJ/mol, respectively) compared to silica gel, implying stronger water-surface interactions and higher energy demand for regeneration. In conclusion, NaOH-modified RHC was identified as the most promising biochar-based desiccant, demonstrating enhanced adsorption capacity and structural development. These findings underscore the potential of alkaline-treated biochar as a sustainable alternative for moisture control applications, although further research is required to optimize regeneration energy.
Acknowledgements
This research was funded by DIKTI Ministry of High Education, Research and Technology, Indonesia 2025.
Declaration of Generative AI in Scientific Writing
The authors state that generative AI tools (e.g., Grammarly and ChatGPT by OpenAI) were employed exclusively for linguistic assistance during manuscript preparation, limited to editing and grammar correction. No aspect of content generation or data interpretation involved the use of AI. The authors retain complete responsibility for all content and conclusions presented in this article.
CRediT Author Statement
Hadiantono Hadiantono: Conceptualization, Methodology, Formal Analysis, Investigation, Software, and Writing - Original Draft. Moh Djaeni: Conceptualization, Methodology, Resources, Validation, Data Curation, Project Administration, Writing - Review & Editing, Supervision. Aji Prasetyaningrum: Conceptualization and Validation. SB Sasongko: Conceptualization and Validation. CL Hii: Conceptualization and Validation.
References
[1] M Ikram, S Ameer, F Kulsoom, M Sher, A Ahmad, A Zhid and Y Chang. Flexible temperature and humidity sensors of plants for precision agriculture: Current challenges and future roadmap. Computer and Electronic in Agriculture 2024; 226, 109449.
[2] K Jiang, N Mahyuddin, H Yu, Y Ran and Z Zhao. Predictive modelling and multi-scenario validation of indoor micro-climate thermal-humidity conditions. Journal of Building Engineering 2025; 111, 113474.
[3] N Veronica, PWS Heng and CV Liew. Relative Humidity Cycling: Implications on the Stability of Moisture-Sensitive Drugs in Solid Pharmaceutical Products. Molecular Pharmaceutics 2023; 20(2), 1072-1085.
[4] SB Sasongko, H Hadiyanto, M Djaeni, AM Perdanianti and FD Utari. Effects of drying temperature and relative humidity on the quality of dried onion slice. Heliyon 2020; 6(7), e04338.
[5] Z Yang, C Ma, Y Zhang, Z Du, P Zhou, Y Zhao, T Zhang and F Wang. Corrosion-life prediction model for 316L stainless steel under electronic special gases containing trace moisture employed in semiconductor manufacturing industry. Corrosion Science 2024; 241, 112510.
[6] SA Asmarasari, N Azizah, S Sutikno, W Puastuti, A Amir, L Praharani, S Rusdiana, C Hidayat, A Hafid, DA Kusumaningrum, F Saputra, C Talib, A Herliatika, MI Shiddieqy and SY Hayanti. A review of dairy cattle heat stress mitigation in Indonesia. Veterinary World 2023; 16(5), 1098-1108.
[7] M Djaeni, DQ A’yuni, M Alhanif, CL Hii and AC Kumoro, Air dehumidification with advance adsorptive materials for food drying: A critical assessment for future prospective. Drying Technology 2021; 39(11), 1648-1666.
[8] C Shen, X Wei and Q Cheng. Theoretical and experimental research on the performance of new building environment control systems based on cooling dehumidification under positive pressure. Applied Thermal Engineering 2024; 247, 123009.
[9] J Sonowal, BK Naik, DVN Lakshmi, P Muthukumar and R Anandalakshmi. Evolution of solar driven desiccant systems for energy-efficient air conditioning: A review. Solar Compass 2025; 14, 100115.
[10] Y Zhang, F He, Y Wang, C Li, G Zhang and D Zhou. Recent advances, challenges and future prospects on frost-free air source heat pump technology with integrated solid desiccant dehumidification. Renewable and Sustainable Energy Reviews 2025; 219, 115877.
[11] LKA Bharathi and S Kalaiselvam. Performance evaluation of low-temperature operated desiccant wheel integrated heat pump drying system for ponyfish (Leiognathus equula) drying. International Journal of Refrigeration 2025; 173, 55-67.
[12] DQ A’yuni, H Hadiantono, V Velny, A Subagio, M Djaeni and N Mufti. Effect of potassium hydroxide concentration and activation time on rice husk-activated carbon for water vapor adsorption. Iranian Journal of Materials Science and Engineering 2024; 21(3), 82-91.
[13] J Luo and H Yang. A state-of-the-art review on the liquid properties regarding energy and environmental performance in liquid desiccant air-conditioning systems. Applied Energy 2022; 325, 119853.
[14] PD Ajay, HS Arunkumar, N Madhwesh and S Kumar. MgCl2-silica gel mixture as a sustainable liquid desiccant for humidity control. Energy Reports 2025; 14, 998-1007.
[15] DQ A’yuni, A Subagio, H Hadiyanto, AC Kumoro and M Djaeni. Microstructure silica leached by NaOH from semi-burned rice husk ash for moisture adsorbent. Archives of Materials Science and Engineering 2021; 108(1), 5-15.
[16] M Schoukens, M Gholami, R Joris, TV Assche, MJ Van Bael and JFM Denayer. Air drying using Fe3O4-silica gel composite laminates and hollow tubes with magnetic induction heating based adsorbent regeneration. Chemical Engineering Journal 2024; 502, 158095.
[17] FDS Feudjio, CG Fotsop, DR Tchuifon, JN Ndi, RA Ntieche, HM Ngomo and M Yılmaz. Tunable water vapor adsorption properties on ion exchange microporous zeolite Na-X derived from natural kaolin. Inorganic Chemistry Communications 2025; 177, 114379.
[18] R Ghasemzadeh, F Raouf and A Naghavi. Water vapor adsorption in microporous and mesoporous frameworks for atmospheric water harvesting: Isotherms, kinetics, and thermodynamics insights. Journal of Water Process Engineering 2025; 76, 108096.
[19] P Liu, L Zhao, X Liu, C Yang, J Li, P Liu, W Wang, H Guo, G Huang, X Jin and Z Lei. Metal-organic framework-based polymer materials achieve efficient adsorption of water vapor and liquid water. Materials Today Communications 2025; 42, 111565.
[20] M Islam, H Mittal, AA Alili, S Alhassan, V Kumar and M Islam. Activated carbon/superporous hydrogel composite-based polymer desiccants for capturing water vapor from humid air. Powder Technology 2025; 458, 121001.
[21] Chairunnisa, F Miksik, T Miyazaki, K Thu, J Miyawaki, K Nakabayashi, AT Wijayanta and F Rahmawati. Development of biomass based-activated carbon for adsorption dehumidification. Energy Reports 2021; 7, 5871-5884.
[22] C Wang, B Yang, X Ji, R Zhang and H Wu. Study on activated carbon/silica gel/lithium chloride composite desiccant for solid dehumidification. Energy 2022; 251, 123874.
[23] J Srimuk, S Chirarattananon, P Chaiwiwatworakul, A Nathakaranakule, P Rakkwamsuk and S Chiarakorn. An experiment and simulation on a solar-regenerated dehumidifier fabricated from composite desiccant coated fin-tube heat exchanger. Applied Thermal Engineering 2024; 245, 122780.
[24] H Bai, MGV Wee, A Chinnappan, J Li, R Shang and S Ramakrishna. Effect of polyvinylpyrrolidone and lithium chloride composite desiccant-coated heat exchangers on dehumidification studies. Applied Thermal Engineering 2024; 248, 123318.
[25] JY Chung, MH Park, SH Hong, J Baek, C Han, S Lee, YT Kang and Y Kim. Comparative performance evaluation of multi-objective optimized desiccant wheels coated with MIL-100 (Fe) and silica gel composite. Energy 2023; 283, 128567.
[26] Z Mo, M Li, S Sun, R Zhu, D Zhan, A Li, Y Li, Y Zhang and Q Yu. Modeling of activated carbon and multi-scale molecular simulation of its water vapor adsorption: A review. Journal of Environmental Chemical Engineering 2024; 12(5), 113732.
[27] Y Huang, Q Yu, M Li, S Jin, J Fan, L Zhao and Z Yao. Surface modification of activated carbon fiber by low-temperature oxygen plasma: Textural property, surface chemistry, and the effect of water vapor adsorption. Chemical Engineering Journal 2021; 418, 129474.
[28] M Bora, SM Benoy, J Tamuly and BK Saikia. Ultrasonic-assisted chemical synthesis of activated carbon from low-quality subbituminous coal and its preliminary evaluation towards supercapacitor applications. Journal Environmental Chemical Engineering 2021; 9(1), 104986.
[29] F Yousefian, MA Babatabar, M Eshaghi, SM Poor and A Tavasoli. Pyrolysis of Rice husk, Coconut shell, and Cladophora glomerata algae and application of the produced biochars as support for cobalt catalyst in Fischer–Tropsch synthesis. Fuel Processing Technology 2023; 247, 107818.
[30] S Neogi, V Sharma, N Khan, D Chaurasia, A Ahmad, S Chauhan, A Singh, S You, A Pandey and PC Bhargava. Sustainable biochar: A facile strategy for soil and environmental restoration, energy generation, mitigation of global climate change and circular bioeconomy. Chemosphere 2022; 293, 133474.
[31] EC Emenike, S Ogunniyi, JO Ighalo, KO Iwuozor, HK Okoro and AG Adeniyi. Delonix regia biochar potential in removing phenol from industrial wastewater. Bioresource Technology Reports 2022; 19, 101195.
[32] Chairunnisa, F Mikšík, T Miyazaki, K Thu, J Miyawaki, K Nakabayashi, AT Wijayanta and F Rahmawati. Enhancing water adsorption capacity of acorn nutshell based activated carbon for adsorption thermal energy storage application. Energy Reports 2020; 6, 255-263.
[33] Y Gao, Q Yue, B Gao and A Li. Insight into activated carbon from different kinds of chemical activating agents: A review. Science of the Total Environment 2020; 746, 141094.
[34] M Mirzaie, AR Talebizadeh and H Hashemipour. Mathematical modeling and experimental study of VOC adsorption by Pistachio shell-based activated carbon. Environmental Science and Pollution Research 2021; 28(3), 3737-3747.
[35] H Tan, CT Lee, KY Wong, PY Ong, MHD Othman, KS Woon and GR Mong. Comparison between chemical modification of biochar for different environmental applications. Chemical Engineering Transactions 2024; 114, 535-540.
[36] Y Chen, H Tian, T Lin, Y Liang, E Wang, W Li, J Huang, X Fang and W Zhang. Study on the properties of activated carbon based on activation process and NaOH modification. Advances in Bamboo Science 2025; 12, 100186.
[37] KR Mamaghani and N Parvin. The measurement and improvement of tensile strength in cold-sintered zinc oxide. Materials Chemistry and Physics 2025; 339, 130753.
[38] JE Linhoss, MK Mohammadi-Aragh and JD Evans. Influence of pine and miscanthus biochar on the water activity and moisture sorption isotherms of used broiler litter. Heliyon 2023; 9(12), e22618.
[39] EA Kosasih, A Zikri and MI Dzaky. Water vapor desorption from silica gel in a combined drying and double-condenser compression refrigeration system. Heliyon 2022; 8(6), e09757.
[40] G Kailas, AR Akash, S Dutta and V Madav. Novel adsorption-based upgradation of end-of-life polypropylene pyrolysis oil using carbonised rice husk. Energy Conversion and Management: X 2024; 25, 100824.
[41] J Lugo-Arias, J González-Álvarez, A Maturana, J Villa-Parejo and C Barraza-Heras. Removal of nitrate and phosphate from aqueous solutions using bioadsorbents derived from agro-industrial wastes of rice husk and corn stalk. Biomass Conversion and Biorefinery 2025; 15, 19453-19475.
[42] PU Nzereogu, AD Omah, FI Ezema, EI Iwuoha and AC Nwanya. Silica extraction from rice husk: Comprehensive review and applications. Hybrid Advances 2023; 4, 100111.
[43] P Premchand, F Demichelis, C Galletti, D Chiaramonti, S Bensaid, E Antunes and D Fino. Enhancing biochar production: A technical analysis of the combined influence of chemical activation (KOH and NaOH) and pyrolysis atmospheres (N2/CO2) on yields and properties of rice husk-derived biochar. Journal of Environmental Management 2024; 370, 123034.
[44] NAM Barakat, MS Mahmoud and HM Moustafa. Comparing specific capacitance in rice husk-derived activated carbon through phosphoric acid and potassium hydroxide activation order variations. Scientific Reports 2024; 14(1), 1460.
[45] L Longo, D Baldassin, AD Michele, C Bittencourt, F Menegazzo and M Signoretto. Activation strategies for rice husk biochar: enhancing porosity and performance as a support for Pd catalysts in hydrogenation reactions. Catalysis Science & Technology 2025; 15(17), 5101-5115.
[46] T Zelenka, T Horikawa and DD Do. Artifacts and misinterpretations in gas physisorption measurements and characterization of porous solids. Advances in Colloid and Interface Science 2023; 311, 102831.
[47] P Maziarka, C Wurzer, PJ Arauzo, A Dieguez-Alonso, O Mašek and F Ronsse. Do you BET on routine? The reliability of N2 physisorption for the quantitative assessment of biochar’s surface area. Chemical Engineering Journal 2021; 418, 129234.
[48] K Kaneko. Adsorption-biased characterization of porous solids. Adsorption 2024; 31(1), 27.
[49] LS Blankenship, J Jagiello and R Mokaya. Confirmation of pore formation mechanisms in biochars and activated carbons by dual isotherm analysis. Materials Advances 2022; 3, 3961-3971.
[50] J Xu, H Zhang, X Ji, Q Lan and Q Fan. Activated carbon modified by ester hydrolysis of ethyl acetate for water vapor adsorption enhancement. Processes 2022; 10(8), 1527.
[51] HU Rahim, E Allevato and SR Stazi. Sulfur-functionalized biochar: Synthesis, characterization, and utilization for contaminated soil and water remediation - a review. Journal of Environmental Management 2024; 370, 122670.
[52] H Hadiantono, M Djaeni, I Sumantri, S Suherman, H Hadiyanto and N Mufti. The influence of sodium silicate concentration and impregnation time on biochar activation for water adsorption. Chemical Engineering Transactions 2025; 118, 397-402.
[53] A Nandiyanto, R Ragadhita, M Fiandini and I Ijost. Interpretation of Fourier Transform Infrared Spectra (FTIR): A practical approach in the polymer/plastic thermal decomposition. Indonesian Journal of Science and Technology 2023; 8, 113-126.
[54] MAR Taheri, A Astaraei, A Lakzian and H Emami. The role of biochar and sulfur-modified biochar on soil water content, biochemical properties and millet crop under saline-sodic and calcareous soil. Plant and Soil 2023; 499, 221-236.
[55] Y Guo and Q Wang. Exploring the adsorption potential of Na2SiO3-activated porous carbon materials from waste bamboo biomass for ciprofloxacin rapid removal in wastewater. Environmental Technology & Innovation 2023; 32, 103318.
[56] V Frišták, D Bošanská, M Pipíška, L Ďuriška, SM Bell and G Soja. Physicochemical characterization of cherry pits-derived biochar. Materials 2022; 15(2), 408.
[57] A Faggiano, A Cicatelli, F Guarino, S Castiglione, A Proto, A Fiorentino and O Motta. Optimizing CO2 capture: Effects of chemical functionalization on woodchip biochar adsorption performance. Journal of Environmental Management 2025; 380, 125059.
[58] MMM Ahmed, C Liao, S Venkatesan, Y Liu, Y Tzou, S Jien, M Lin, Y Hsieh and AI Osman. Sulfur-functionalized sawdust biochar for enhanced cadmium adsorption and environmental remediation: A multidisciplinary approach and density functional theory insights. Journal of Environmental Management 2025; 373, 123586.
[59] Z Zhang, X Li, H Jia and Y Liu. Moisture sorption isotherms and thermodynamic properties of tiger nuts: An oil-rich tuber. LWT 2022; 167, 113866.
[60] M Djaeni, H Hadiantono and SB Sasongko. Comparison of moisture sorption isotherm models and desorption kinetics of silica-impregnated biochar composite desiccant. Journal of Physical Chemistry and Functional Materials 2025; 8(1), 72-81.