Trends
Sci.
2026;
23(5):
12212
The Effect of Roasting Method on the Physico-Chemical and Functional Properties of H. itama Bee Pollen Coffee from East Kalimantan
Netty
Maria Naibaho1,2*,
Anis Syauqi2,
Bernatal Saragih3,
![]() ,
Theresia Adi Susanti1,
,
Theresia Adi Susanti1,
Yuliana Sabarina Lewar1, Supriono1, Andi Lisnawati2 and Enos Tangke Arung4
1Department Food Engineering Technology, State Agricultural of Polytechnic Samarinda,
Samarinda, East Kalimantan 75131, Indonesia
2Department Plantation Processing Technology, State Agricultural of Polytechnic Samarinda,
Samarinda 75131, Indonesia
3Department of Agricultural Product and Technology, Faculty of Agriculture, Mulawarman of University,
Samarinda, East Kalimantan 75123, Indonesia
4Faculty of Forestry, Mulawarman of University, Samarinda, East Kalimantan 75123, Indonesia
(*Corresponding author’s e-mail: [email protected])
Received: 8 October 2025, Revised: 22 October 2025, Accepted: 29 October 2025, Published: 20 January 2026
Abstract
This study aimed to evaluate the effect of roasting methods and levels on the physicochemical and bioactive compound profiles of Heterotrigona itama bee pollen-enriched coffee from East Kalimantan. Coffee beans were roasted manually (wok) and semi-industrially (controlled machine) at 3 levels: Light, medium, and dark roast. Parameters analyzed included proximate composition, density, particle size, color (L*, a*, b*), water activity (Aw), solubility, and bioactive compounds (alkaloids, flavonoids, phenolics, tannins, saponins) along with caffeine content. Phytochemical screening revealed that increasing roasting temperature significantly reduced bioactive compound intensity. The manual light roast (80 - 100 °C) exhibited the strongest reactions (+++) for alkaloids, flavonoids, and phenolics, while dark semi-industrial roasting (200 - 220 °C) caused marked degradation, with several compounds undetected. FTIR spectra (4,000 - 500 cm⁻¹) confirmed the presence of O–H, C=O, and C=C aromatic groups (phenolics, C₆H₆O) and C–H, C–N, C–O bands from lipids and proteins. The decreasing intensity of –OH and C=C peaks indicated phenolic degradation and lipid oxidation linked to Maillard and caramelization reactions. Manual light roasting produced the best profile with the highest alkaloid (1.20 ± 0.55 µg/mL), phenolic (45.00 ± 0.80 mg GAE/g), flavonoid (12.50 ± 0.40 mg QE/g), and caffeine (1.85 ± 0.49 µg/mL) contents, maintaining optimal solubility and color. These findings demonstrate that roasting parameters critically influence the stability and functional quality of bee pollen coffee.
Keywords: Bee pollen coffee, Bioactive compounds, East Kalimantan, Heterotrigona itama, Physicochemical and functional properties, Roasting method
Introduction
Coffee is one of the most important plantation commodities in Indonesia, both economically and socially. Beyond being a popular beverage, coffee has become an integral part of the nation’s culture and lifestyle across various social groups. Recent innovations in the coffee industry have not only focused on enhancing flavor and aroma but have also begun to explore the development of functional coffee products that offer additional health benefits to consumers. Along
with the growing trend of a healthy lifestyle, consumers increasingly prefer food and beverages that not only provide sensory pleasure but also support overall health through their bioactive compound content. One of the key components contributing to the health benefits of coffee and other food products is the presence of secondary metabolites. Secondary metabolites are bioactive compounds naturally produced by plants, microbes, and certain animals. Although they are not directly involved in the growth or development of the organism, these compounds play crucial roles in protection, ecological interactions, and environmental adaptation [1,2]. These metabolites include groups such as alkaloids, flavonoids, phenolics, terpenoids, saponins, and others, which are known to exhibit a wide range of biological activities, including antioxidant, antimicrobial, antidiabetic, anticancer, and immunomodulatory effects [3-5]. In the context of coffee, the presence of secondary metabolites such as chlorogenic acids, caffeine, and flavonoids contributes not only to its distinctive flavor but also to its health-promoting properties [6]. Therefore, innovation in enriching coffee with additional sources of secondary metabolites from natural materials, such as bee pollen, has become increasingly relevant and promising for further development.
East Kalimantan is one of the regions rich in biodiversity, possesses abundant natural resources that remain underutilized, including local beekeeping products such as bee pollen from Heterotrigona itama. Bee pollen is known to contain various bioactive compounds and secondary metabolites, including flavonoids, phenolics, vitamins, minerals, and essential amino acids, which play important roles in supporting antioxidant and antidiabetic activities as well as enhancing the immune system [7]. The combination of coffee and bee pollen represents a novel innovation that can enhance the functional value of coffee beverages while simultaneously utilizing the rich biodiversity of East Kalimantan. However, the coffee processing method particularly roasting greatly influences the physicochemical quality and bioactive compound content of coffee [6,8-10]. The roasting process, which involves high-temperature heating, triggers complex chemical reactions such as the Maillard reaction, thermal degradation, and caramelization, all of which contribute to the formation of coffee’s characteristic flavor, aroma, and color [11-14]. Moreover, roasting can alter the levels of bioactive compounds, either through degradation or enhancement, depending on the method and temperature applied [6]. Therefore, it is essential to explore how different roasting methods affect the stability of bioactive compounds, especially when coffee is enriched with natural additives such as bee pollen. Previous studies have shown that roasting methods can significantly influence the total phenolic and flavonoid content, as well as the antioxidant capacity of coffee [15-17]. However, research on bee pollen-enriched coffee, particularly from the H. itama species native to East Kalimantan, remains very limited. Since bee pollen is highly sensitive to heat [18,19], it is necessary to investigate how various roasting methods affect the stability of its functional components when incorporated into coffee. In addition to the bioactive aspects, the evaluation of physicochemical properties is also crucial, as parameters such as moisture content, ash content, pH, water activity (Aw), solubility, powder color [20], and density greatly influence the final product quality, storage stability, and consumer perception [21].
The changes in physicochemical properties are closely related to the roasting process applied, whether traditional or semi-industrial. This study focuses on comparing several roasting methods to identify the most optimal approach for maintaining physicochemical quality [6] while simultaneously enhancing the functional benefits of bee pollen coffee. The findings of this research are expected to contribute scientifically to the development of innovative functional coffee beverages based on the rich biodiversity of East Kalimantan. Moreover, the results of this study could serve as a foundation for the downstream development of value-added commercial products, benefiting both coffee farmers and local beekeepers, thereby supporting regional economic growth driven by renewable natural resources. Furthermore, the successful development of functional coffee enriched with bee pollen will expand Indonesia’s portfolio of health-oriented beverage products, in line with the global trend toward the consumption of natural, health-promoting foods [22,23]. From a scientific perspective, this study is expected to provide deeper insights into the relationship between roasting methods and changes in the physicochemical and functional properties of bee pollen coffee. These findings can serve as a reference for future research, product development, and the establishment of processing standards for innovative coffee products utilizing local bioactive resources.
Materials and methods
Materials
The materials used in this study included Arabica coffee beans (Coffea arabica L.) obtained from highland coffee plantations in Mahakam, Kutai Kartanegara, and Robusta coffee beans (Coffea canephora L.) sourced from farmer groups in Samarinda Seberang, East Kalimantan. The bee pollen fresh was derived from stingless bees (Heterotrigona itama) cultivated through local meliponiculture in Kutai Kartanegara, and it was dried to a moisture content below 14%. The chemicals used were of pro-analysis grade, including Folin–Ciocalteu reagent, aluminum chloride (AlCl₃), gallic acid, quercetin, and DPPH all obtained from Sigma-Aldrich (USA) and Merck (Germany). The solvents used consisted of methanol, ethanol, and distilled water.
Sample preparation
The coffee beans were cleaned to remove impurities, then roasted using different methods: Manual roasting (using a pan), semi-industrial roasting (using a temperature-controlled machine), and at 3 roasting levels (light, medium, and dark). The roasted coffee beans were then cooled, finely ground (60 mesh), and stored in sealed containers. The dried bee pollen was finely ground using a mortar and pestle, then mixed into the coffee powder at a proportion of 5% (w/w) until homogeneous. The mixture was stored in airtight containers at room temperature until further analysis.
Physicochemical analysis
Proximate analysis
Proximate analysis of the samples was carried out to determine the contents of moisture, ash, fat, protein, and total carbohydrates. Moisture content was analyzed using the oven-drying method at 105 °C, ash content by incineration at 600 °C, fat content by the Soxhlet extraction method using n-hexane, and protein content by the Kjeldahl method (conversion factor 6.25). Total carbohydrate content was calculated by difference, subtracting the sum of moisture, ash, fat, and protein from 100%. All analyses were conducted according to AOAC [24] methods.
pH, solubility, water activity (Aw), density, particle size distribution and color analysis
The pH was determined using a digital pH meter after dissolving 1 g of sample in 10 mL of distilled water. Solubility was tested by dispersing 1 g of sample in 100 mL of hot distilled water (60 °C), filtering, and drying the filtrate at 105 °C to constant weight. Water activity was measured using a water activity meter at room temperature (±25 °C). Density was obtained by weighing 10 g of sample in a 50 mL graduated cylinder to determine both bulk and tapped density. Particle size distribution was analyzed using sieves (20 - 100 mesh) and expressed as the percentage retained on each sieve after 10 min of mechanical shaking. Color parameters were determined using a colorimeter to obtain L* (lightness), a* (red-green tendency), and b* (yellow-blue tendency) values. Bee pollen coffee powder samples were placed in a flat container, and the instrument probe was positioned on a smooth surface of the sample. The color values were read directly from the digital display [25].
Functional properties
Phytochemical screening
Qualitative phytochemical screening was conducted to identify the presence of secondary metabolites in the bee pollen coffee powder samples, including alkaloids, flavonoids, saponins, tannins, steroids, and terpenoids. The alkaloid test was performed using Dragendorff’s or Mayer’s reagent, indicated by the formation of an orange or brown precipitate [26]. The flavonoid test employed magnesium powder and concentrated HCl, with the appearance of a red coloration indicating a positive result [26]. The saponin test involved vigorous shaking of the sample in water, where the formation of stable foam indicated a positive result. The tannin test was carried out using a 1% FeCl₃ solution, with a blue-black coloration confirming the presence of tannins [26]. The steroid and terpenoid tests used the Liebermann-Burchard reagent (acetic anhydride and concentrated H₂SO₄); a bluish-green color indicated the presence of steroids, while a red coloration signified terpenoids [26].
Total alkaloid content
Alkaloid content was analyzed spectrophotometrically using the bromocresol green (BCG) complexation method by Kurniawan et al. [27]. One gram of bee pollen coffee extract was acidified with 2 N HCl, purified with chloroform, adjusted to pH 8, and reacted with BCG reagent. The formed complex was extracted with chloroform, and its absorbance was measured at 470 nm using a UV-Vis spectrophotometer. Quinine sulfate served as the standard, and the results were expressed as mg quinine equivalent per gram of sample (mg QE/g).
Total Phenolic Content (TPC)
Total phenolic content (TPC) was determined using the Folin-Ciocalteu method described by Rahman et al. [28] with modifications. One mL of the sample extract was mixed with 5 mL of 10% Folin-Ciocalteu reagent and incubated for 5 min. Then, 4 mL of 7% Na₂CO₃ solution was added, and the mixture was incubated for 30 min at room temperature. The absorbance was measured at 750 nm using a UV-Vis spectrophotometer. The results were expressed as milligrams of gallic acid equivalent per gram of sample (mg GAE/g).
Total Flavonoid Content (TFC)
Total flavonoid content (TFC) was analyzed using the the aluminum chloride (AlCl₃) method described by Rahman et al. [28] with modifications. 1 ml of the extract was mixed with 4 mL of ethanol, 0.3 mL of 5% NaNO₂, 0.3 mL of 10% AlCl₃, and 2 mL of 1 M NaOH, then diluted to a final volume of 10 mL with distilled water. After 15 min of incubation, the absorbance was measured at 515 nm using a UV-Vis spectrophotometer. The results were expressed as milligrams of quercetin equivalent per gram of sample (mg QE/g).
Caffeine Analysis
Caffeine content was determined using High-Performance Liquid Chromatography (HPLC). The sample extract was filtered through a 0.45 µm membrane filter before injection. Analysis was performed using an HPLC system equipped with a C18 reverse-phase column (250×4.6 mm2, 5 µm). The mobile phase consisted of a mixture of methanol and distilled water (40:60, v/v), adjusted to pH 3.0 with phosphoric acid. The flow rate was set at 1.0 mL/min, and the detection wavelength was 272 nm. The injection volume was 20 µL. Caffeine concentration was quantified by comparing the sample peak area with that of a caffeine standard calibration curve and expressed as mg/g of sample.
Statistical analysis
All experiments were conducted in triplicate, and the results were expressed as mean ± standard deviation (SD). Data were statistically analyzed using one-way analysis of variance (ANOVA) to determine significant differences among treatments, followed by Duncan’s Multiple Range Test (DMRT) for mean comparison at a 95% confidence level (p < 0.05). Statistical analyses were performed using IBM SPSS Statistics version 25.0.
Results and discussion
Proximate analysis
Table 1 show that the moisture content decreased significantly with increasing roasting levels, from 5.8% in the Light Roast to 5.40% - 5.50% in the Dark Roast. This reduction occurs because roasting involves intense evaporation of water and volatile compounds, which may damage the microstructure of bee pollen coffee [7,29-32]. In addition, the sample humidity decreased drastically during roasting, reaching below 5% at dark roasting levels [14]. The ash content remained relatively stable in Light and Medium Roasts but showed a noticeable decline in the Dark Roast, ranging from 3.9% to 3.95%. This finding is consistent with reports that light inorganic compounds may undergo degradation and volatilization at elevated temperatures [6-8]. Intensive roasting can influence the mineral content, which is recorded as ash in bee pollen coffee beans [8].
Table 1 Proximate composition of bee pollen coffee powder based on roasting methods (% dry weight basis).
Roasting treatment |
Proximate analysis |
Energy (kkal) |
||||
Water content (%) |
Ash content (%) |
Fat content (%) |
Protein content (%) |
Carbohydrates (%) |
||
LR-MW 80 - 100 °C |
5.85 ± 0.13b |
4.05 ± 0,14a |
11.75 ± 0.22ab |
17.10 ± 0.25a |
64.25 ± 0.40c |
456.65 ± 0.50b |
MR-MW 100 - 140 °C |
5.60 ± 0.13c |
4.00 ± 0,13a |
11.90 ± 0.18a |
16.90 ± 0.22ab |
64.60 ± 0.38bc |
457.90 ± 0.48ab |
DR-MW 140 - 160 C |
5.40 ± 0.15d |
3.90 ± 0.26b |
12.10 ± 0.25a |
16.40 ± 0.30c |
65.20 ± 0.45a |
460.10 ± 0.55a |
LR-SM 160 - 170 °C |
5.90 ± 0.12b |
4.12 ± 0.09a |
11.70 ± 0.18ab |
17.00 ± 0.24a |
64.55 ± 0.40bc |
456.50 ± 0.52b |
MR-SM 190 - 200 °C |
5.65 ± 0.09c |
4.05 ± 0.23a |
11.85 ± 0.20a |
16.85 ± 0.25ab |
64.65 ± 0.38bc |
457.65 ± 0.50ab |
DR-SM 200 - 220 °C |
5.50 ± 0.14c |
3.95 ± 0.22b |
12.00 ± 0.22a |
16.45 ± 0.28c |
65.10 ± 0.42a |
459.40 ± 0.53a |
Description: LR-MW (Light Roast Manual Wok), MR-MW (Medium Roast Manual Wok), DR-MW (Dark Roast Manual Wok), LR-SM (Light Roast Machinery), MR-MW (Medium Roast Machinery), DR-MW (Dark Roast Machinery).
Note: Different letters indicate statistically significant differences (DMRT test, p < 0.05). The same letters indicate no significant difference.
The fat content increased from 11.7% in the Light Roast to 12.1% in the Dark Roast. This increase is attributed to the relative concentration effect caused by the loss of water and protein, making the lipid fraction more dominant, as well as the partial release of lipids from cellular membranes under intense heating [7]. A similar pattern of increased lipid extract after medium roasting compared to light roasting has also been reported [10]. The highest protein content, ranging from 17.0% to 17.1%, was observed in the Light Roast and decreased to 16.4% - 16.45% in the Dark Roast. This decline results from thermal degradation and Maillard reactions, which consume amino acids and protein compounds to form melanoidins and other flavor-related products [11-14]. Tarigan et al. [9] also noted that proteins undergo denaturation and degradation with increasing roast levels. Although the increase in carbohydrate content from 64.3% - 65.2% appears small, it is relatively significant, especially in the Dark Roast. This rise is due to water and protein loss, which proportionally elevates the carbohydrate fraction [15,16]. Moreover, caramelization reactions and the transformation of simple sugars into non-starch compounds contribute to higher measured total carbohydrate levels [17,19]. The breakdown of sucrose and initial polyphenols during light roasting, followed by further degradation in dark roasting, coincides with an apparent increase in total carbohydrates [20,21].
The total energy of bee pollen coffee ranged from 456.50 to 460.10 kcal/100 g, with the highest value observed in Manual Dark Roast (460.10 kcal) and the lowest in Machine Light Roast (456.50 kcal). This variation is closely related to changes in macronutrient composition specifically, increases in fat and carbohydrate contents coupled with the reduction of moisture at higher roasting levels [12]. The roasting method also affected energy retention; manual roasting tended to produce slightly higher energy values than machine roasting at the same level, possibly due to uneven heat distribution that accelerates water evaporation without significantly damaging lipid and carbohydrate structures [7,9] Statistical analysis revealed a significant difference (p < 0.05) between Dark Roast and Light Roast treatments, indicating that the roasting process had a significant effect on the total energy of bee pollen coffee. The trend of physicochemical changes was consistent between manual and semi-industrial roasting methods, although slight differences in absolute values were observed. This suggests that the roasting degree plays a more dominant role in determining composition than the technical roasting method itself. These findings are supported by comprehensive reviews emphasizing that roasting is a key stage in chemical composition transformation through Maillard reactions, polyphenol degradation, protein denaturation, and compound volatilization [6,30].
Physicochemical properties
Tabel 2 show that the roasting degree showed a significant effect on the physicochemical properties of bee pollen coffee powder under both manual and semi-industrial roasting methods. The pH value of the coffee powder decreased with increasing roasting degree. The dark roast exhibited the lowest pH values, ranging from 4.90 to 5.15, indicating an increase in acidic compounds formed through the thermal degradation of organic constituents, such as chlorogenic acid [33,34]. The machine roasting method produced a lower pH compared to wok roasting, suggesting more intense Maillard and caramelization reactions.
Solubility significantly increased with darker roasting levels, with the highest value observed in machine dark roast (86.10%). This trend is associated with protein denaturation, cell wall degradation, and the formation of soluble compounds during intensive heating [35-37]. Water activity (aw) gradually decreased from light to dark roast, ranging from 0.45 to 0.41 in both roasting methods. The lower aw in dark roast samples indicates better microbiological stability and extended shelf life [38-40].
Table 2 Physicochemical properties of bee pollen coffee powder as affected by roasting method and degree.
Roasting treatment |
pH |
Solubility (%) |
Water Activity (aw) |
Density (g/mL) |
Particle size (µm) |
LR-MW 80 - 100 °C |
5.35 ± 0.12a |
82.50 ± 1.20d |
0.45 ± 0.221a |
0.45 ± 0.32d |
185.00 ± 0.05a |
MR-MW 100 - 140 °C |
5.30 ± 0.23a |
83.20 ± 1.15c |
0.44 ± 0.31ab |
0.46 ± 0.42c |
180.00 ± 0.04b |
DR-MW 140 - 160 °C |
5.15 ± 0.33b |
84.00 ± 1.10b |
0.43 ± 0.32bc |
0.47 ± 0.11b |
172.00 ± 0.04c |
LR-SM 160 - 170 °C |
5.20 ± 0.44b |
84.80 ± 1.10b |
0.43 ± 0.22bc |
0.47 ± 0.11 |
175.00 ± 0.05c |
MR-SM 190 - 200 °C |
5.10 ± 0.65c |
85.50 ± 1.05ab |
0.42 ± 0.19cd |
0.48 ± 0.21a |
170.00 ± 0.03d |
DR-SM 200 - 220 °C |
4.90 ± 0.33d |
86.10 ± 1.00a |
0.41 ± 0.21d |
0.49 ± 0.31a |
165.00 ± 0.04e |
Description: LR-MW (Light Roast Manual Wok), MR-MW (Medium Roast Manual Wok), DR-MW (Dark Roast Manual Wok), LR-SM (Light Roast Machinery), MR-MW (Medium Roast Machinery), DR-MW (Dark Roast Machinery). Note: Different letters indicate statistically significant differences (DMRT test, p < 0.05). The same letters indicate no significant difference.
The powder density increased with roasting intensity, with the highest density (0.49 g/mL) recorded in machine dark roast. High-temperature exposure led to moisture evaporation and pore shrinkage, resulting in denser particles [41]. Particle size decreased as roasting progressed; dark roast powders showed the smallest size (165 - 172 µm) due to the brittleness of cell structures, which facilitated grinding and enhanced extraction efficiency of bioactive compounds during brewing [42]. Overall, the semi-industrial roasting method produced more consistent and controlled physicochemical and functional profiles, making it suitable for large-scale production, while manual roasting resulted in greater variability but retained a more neutral pH characteristic.
Color characteristics of bee pollen coffee
Table 3 shows the color parameters (L*, a*, b*, and hue angle) of bee pollen coffee powder subjected to different roasting methods. The results indicate a significant effect (p < 0.05) of roasting level and method on all color attributes. In general, the L value (brightness)* decreased progressively with increasing roasting intensity, both in manual and semi-industrial methods. Light roast samples exhibited the highest brightness (L*) with range 36.50 for LR-MW and 33.00 for LR-SM, while dark roast samples showed the lowest at 28.00 and 26.00, respectively. This darkening effect is closely related to Maillard reactions, caramelization, and pigment degradation occurring during roasting, which produce brown melanoidin compounds that reduce lightness [43,44]. The a (redness)* and b (yellowness)* values also showed a gradual decline with higher roasting degrees. This indicates a reduction in red and yellow pigments due to the breakdown of phenolic compounds and sugars, leading to the formation of darker color complexes. The decrease in hue angle (H°) further confirms this color shift from yellowish to brownish tones, characteristic of intensified roasting [45]. Comparatively, coffee roasted using the semi-industrial (temperature-controlled) method exhibited slightly lower L*, a*, and b* values than manually roasted samples at similar roasting levels. This suggests that the controlled heating process allowed more uniform heat transfer, enhancing non-enzymatic browning reactions and producing a darker, more homogeneous color.
Table 3 Color characteristics of bee pollen coffee powder as affected by roasting method and degree.
Roasting treatment |
L* (Brightness) |
a* (Red) |
b* (Yellow) |
Hue (H°) |
LR-MW 80 - 100 °C |
36.50 ± 0.51a |
5.20 ± 0.22a |
12.80 ± 0.35a |
67.62a |
MR-MW 100 - 140 °C |
32.00 ± 0.43b |
4.90 ± 0.24b |
10.50 ± 0.38b |
65.32b |
DR-MW 140 - 160 °C |
28.00 ± 0.33c |
4.40 ± 0.17c |
8.50 ± 0.24c |
62.41c |
LR-SM 160 - 170 °C |
33.00 ± 0.32c |
4.80 ± 0.26b |
11.00 ± 0.27b |
66.92a |
MR-SM 190 - 200 °C |
29.50 ± 0.35d |
4.50 ± 0.17c |
9.50 ± 0.29c |
64.25b |
DR-SM 200 - 220 °C |
26.00 ± 0.34e |
4.20 ± 0.27d |
7.80 ± 0.23d |
61.43c |
Description: LR-MW (Light Roast Manual Wok), MR-MW (Medium Roast Manual Wok), DR-MW (Dark Roast Manual Wok), LR-SM (Light Roast Machinery), MR-MW (Medium Roast Machinery), DR-MW (Dark Roast Machinery).
Note: Superscript letters (a-e) indicate significant differences in each color parameter based on the DMRT test (p < 0.05). The L* (brightness), a* (redness), and b* (yellowness) values decreased with increasing roasting level, consistent with the characteristics of the Maillard reaction and caramelization that darken the color of bee pollen coffee grounds.
Phytochemical compound profile
Table 4 shows that the phytochemical analysis revealed that the roasting treatment significantly affected the presence of bioactive compounds in bee pollen coffee. Several classes of compounds were identified, including alkaloids, flavonoids, phenolic compounds, tannins, saponins, triterpenoids, and steroids. The detection intensity of each compound was categorized as very strong (+++), moderate (++), weak (+), or not detected (–). In the light roast treatment, both under manual (wok) and semi-industrial (machine) methods, most phytochemical constituents exhibited strong to very strong reactions, indicating that the bioactive compounds remained largely intact and had not undergone significant thermal degradation. This observation aligns with previous reports stating that phenolic and flavonoid compounds are more stable at low to moderate heating temperatures [46]. Conversely, in the medium to dark roast treatments, a decrease in detection intensity was observed for most phytochemical compounds, particularly saponins, tannins, and flavonoids. This phenomenon is attributed to the thermal degradation of these thermolabile compounds. The decline in phenolic and flavonoid contents at higher temperatures has been consistently reported in various studies, showing a negative correlation between roasting temperature and the stability of natural antioxidants [47]. Alkaloids, particularly caffeine, were still detected across all treatments, although with lower intensity in dark roast samples. This is consistent with the characteristic of caffeine as a relatively heat-stable alkaloid, which may nevertheless experience partial volatilization or degradation at temperatures exceeding 200 °C [48]. Triterpenoids and steroids were detected only in light and medium roast samples. The absence of these compounds in dark roast samples may result from their high volatility or structural transformation under elevated temperatures. Maswal et al. [49] reported that triterpenoid and steroid compounds could degrade at temperatures above 180 °C, indicating the importance of optimizing roasting temperature in the development of functional coffee beverages. Overall, medium roasting under the semi-industrial method appeared to yield the best results in preserving bioactive compounds while minimizing losses due to thermal reactions. The medium roasting can produce a balanced bioactive profile between compound stability and desirable flavor development [50].
Table 4 Phytochemical compound profile of bee pollen coffee powder as affected by roasting method and degree.
Roasting Treatment |
Alkaloids |
Flavonoids |
Phenolic |
Tannin |
Saponin |
Triterpenoids |
Steroids |
LR-MW 80 - 100 °C |
+++ |
+++ |
+++ |
++ |
++ |
++ |
– |
MR-MW 100 - 140 °C |
++ |
++ |
++ |
++ |
+ |
+ |
– |
DR-MW 140 - 160 °C |
+ |
+ |
+ |
+ |
+ |
– |
– |
LR-SM 160 - 170 °C |
++ |
++ |
++ |
++ |
+ |
+ |
– |
MR-SM 190 - 200 °C |
++ |
++ |
+ |
+ |
+ |
+ |
– |
DR-SM 200 - 220 °C |
+ |
+ |
+ |
– |
– |
– |
– |
Description: LR-MW (Light Roast Manual Wok), MR-MW (Medium Roast Manual Wok), DR-MW (Dark Roast Manual Wok), LR-SM (Light Roast Machinery), MR-MW (Medium Roast Machinery), DR-MW (Dark Roast Machinery).
Note: (+++): Very strong reaction (strong positive), (++): Moderate reaction (moderate positive), (+): Weak reaction (weak positive), (–): Not detected.
Bioactive compound content
The roasting process is known to influence the content of bioactive compounds such as alkaloids, phenolics, flavonoids, and caffeine in bee pollen coffee. The results showed that both manual and semi-industrial roasting methods, with varying roasting levels (light, medium, and dark), significantly affected the bioactive composition of bee pollen coffee. Figure 1 show that the highest alkaloid content was observed in the LR-MW with range 1.20 ± 0.05 µg/mL, while the lowest value occurred in the DR-SM with range 0.85 ± 0.22 µg/mL. Alkaloids, including caffeine as one of their components [51], are thermolabile and can undergo degradation at high temperatures over prolonged exposure [52]. Consequently, the darker the roast level, the greater the reduction in alkaloid content. This decline can also be attributed to Maillard reactions and thermal decomposition that occur during the final stages of roasting [13,17].
Figure 2 show that phenolic compounds play a crucial role in the antioxidant activity of bee pollen coffee. The highest total phenolic content (TPC) was observed in the LR-MW with range 45.00 ± 0.80 mg GAE/g, while the semi-industrial dark roast (DR-SM) showed a marked decline with range 32.50 ± 0.60 mg GAE/g. This reduction is likely due to the degradation of free phenolics during heating or their conversion into polymerized forms that are not detectable by the Folin-Ciocalteu method [53]. However, light roasting may promote the release of bound phenolic compounds from the cellular matrix [39], resulting in higher phenolic content in the light roast samples.
Figure 3 show that the flavonoid levels also decreased with increasing roasting intensity. The highest flavonoid concentration was found in the manual light roast (LR-MW) with range 12.50 ± 0.40 mg QE/g, whereas the lowest was recorded in the semi-industrial dark roast (DR-SM) with range 8.50 ± 0.20 mg QE/g. Heating can cause structural degradation of flavonoids such as quercetin and kaempferol, which are unstable at elevated temperatures [54]. Ghani et al. [55] reported that intensive heat treatment reduces flavonoid bioactivity through oxidation and aromatic ring fragmentation.
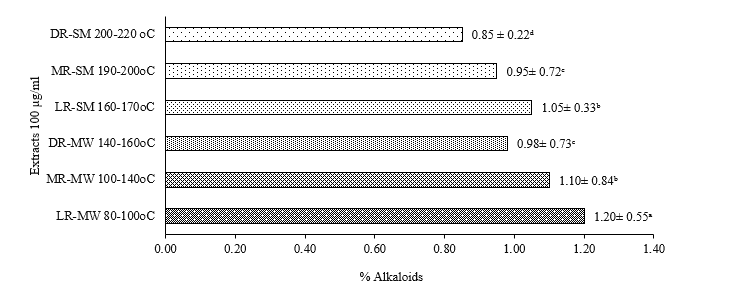
Figure 1 Effect of roasting on alkaloids.
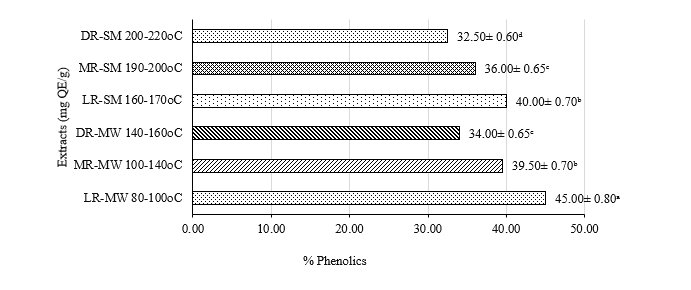
Figure 2 Effect of roasting on phenolics.
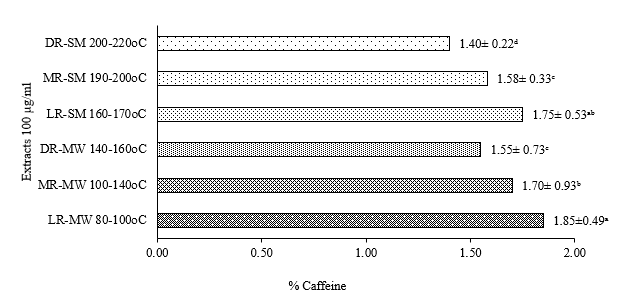
Figure 3 Effect of Roasting on flavonoid.
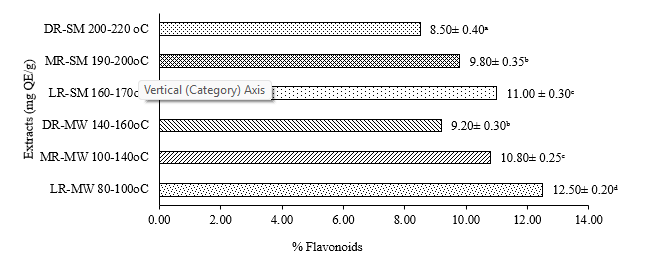
Figure 4 Effect of roasting on caffeine.
Figure 4 show that the highest caffeine content was observed in the manual light roast treatment (LR-MW) with range 1.85 ± 0.49 µg/mL, while the lowest level was found in the semi-industrial dark roast (DR-SM) with range 1.40 ± 0.22 µg/mL. Although caffeine is relatively more thermally stable than other compounds, studies have shown that partial degradation can still occur during prolonged and intensive roasting processes [51-54]. Moreover, the manual roasting method tends to be slower and less intense than mechanical roasting, allowing better retention of volatile and semi-volatile compounds, including caffeine. Overall, manual roasting at light levels proved to be more effective in preserving the bioactive constituents of bee pollen coffee, implying higher antioxidant potential and functional value. These findings are consistent with recent literature trends regarding the impact of roasting on the nutraceutical compounds of coffee [12,39,56,57].
FTIR spectral profile of bee pollen coffee at different roasting levels
The FTIR spectra in Figure 5 shows the characteristic absorption patterns of bee pollen coffee subjected to manual (M) and semi-industrial (SM) roasting at light, medium, and dark levels. The spectral range of 4,000 - 500 cm⁻¹ displays various functional groups associated with key bioactive compounds such as phenolics, flavonoids, lipids, and proteins [48,58]. The broad absorption bands observed at 3,300 - 3,640 cm⁻¹ correspond to the stretching vibrations of hydroxyl (–OH) and amine (–NH) groups derived from phenolics, carbohydrates, and proteins [59]. The gradual reduction in peak intensity with increasing roasting level indicates thermal degradation of phenolic structures and the loss of hydrogen bonding due to dehydration. The absorption bands at 2,900 - 2,840 cm⁻¹ correspond to aliphatic C–H stretching of methyl and methylene groups, representing lipid and fatty acid components [60,61]. The slight increase in intensity at higher roasting temperatures suggests the formation of Maillard-derived volatile compounds or lipid oxidation products. The peaks between 1,700 and 1,640 cm⁻¹ are attributed to carbonyl (C=O) and aromatic (C=C) stretching vibrations, indicating the presence of carboxylic acids, esters, and amides [59]. The higher intensity of these bands in medium and dark roasts suggests oxidative degradation and structural rearrangement during the Maillard reaction. The fingerprint region at 1,500 - 1,000 cm⁻¹ exhibits strong C–N, C–O, and C–O–C stretching bands from proteins, alcohols, and polysaccharides, indicating molecular rearrangement and biomolecule breakdown [62-63], which may contribute to melanoidin-like compounds responsible for the brown color and antioxidant activity of roasted bee pollen coffee. Peaks at 820 - 580 cm⁻¹ represent aromatic C–H bending, suggesting the persistence of stable phenolic rings under high-temperature roasting. Overall, the FTIR analysis supports quantitative data showing that increasing roasting temperature decreases alkaloid, flavonoid, and phenolic contents due to oxidation and polymerization. Light roasting, particularly under manual conditions, better preserves phenolic hydroxyl groups and conjugated aromatic systems, maintaining antioxidant potential and functional quality of bee pollen coffee.
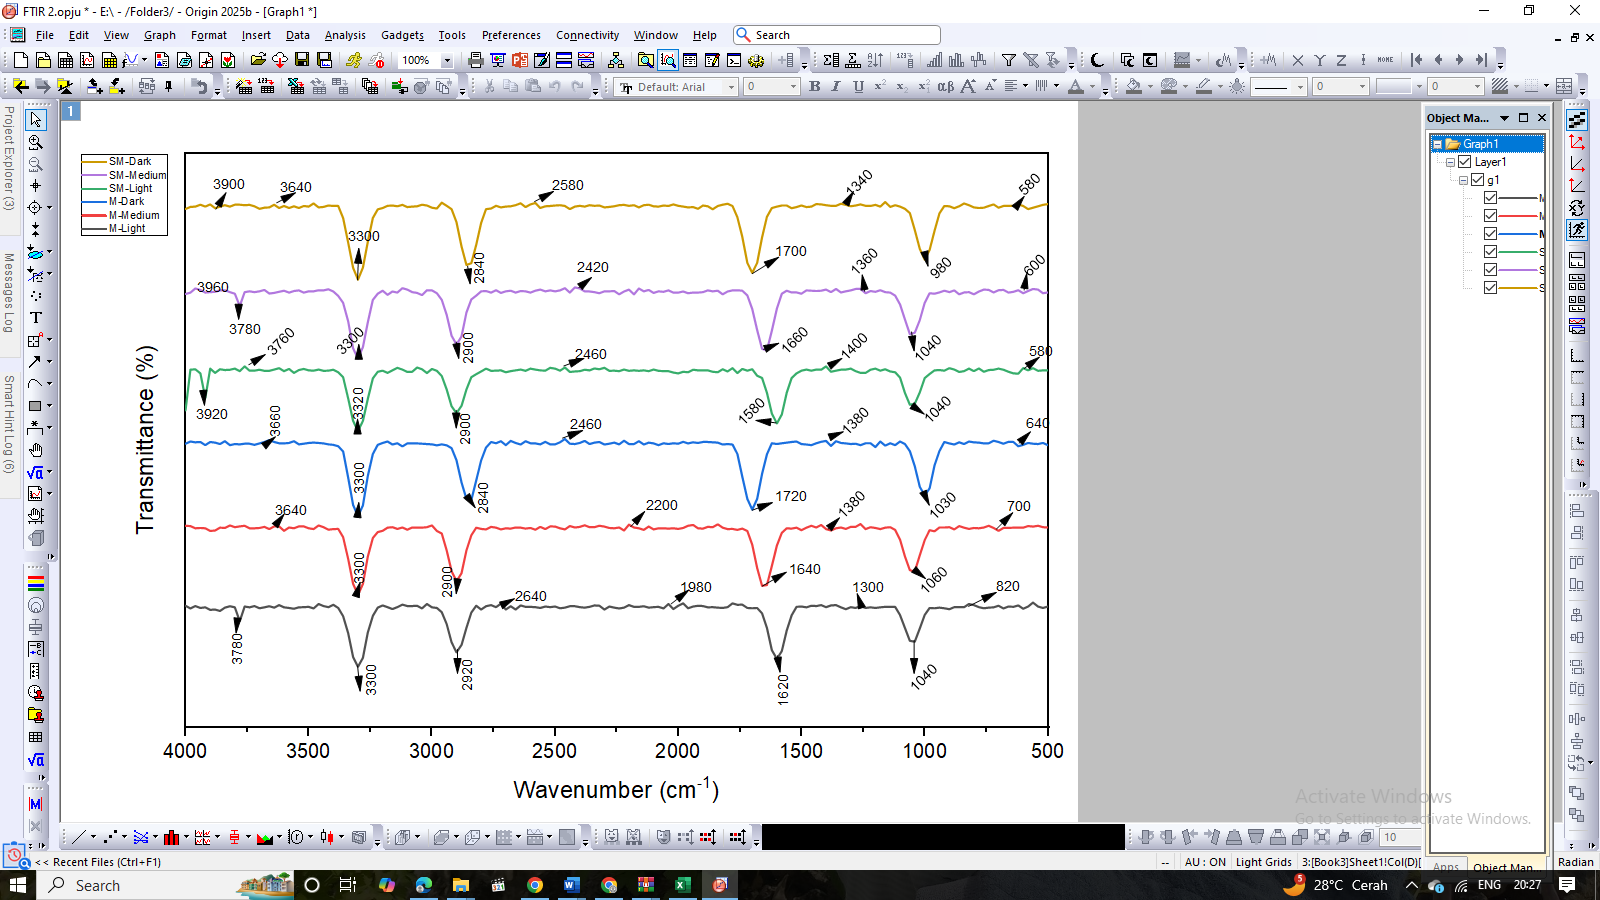
Figure 5 FTIR spectral profile of bee pollen coffee at different roasting levels.
Conclusions
The results revealed that roasting level significantly affected the physicochemical properties and bioactive compound composition of Heterotrigona itama bee pollen coffee. Light roasting, particularly under the manual method, produced balanced moisture content and water activity, high solubility, and stable color and aroma characteristics. Proximate analysis showed an increase in fat and ash content at higher roasting levels, while protein and carbohydrate contents decreased due to thermal degradation. Phytochemical tests and FTIR spectroscopy confirmed that increasing roasting intensity led to a reduction in hydroxyl (–OH) and amine (–NH) groups, along with an increase in carbonyl (C=O) and aliphatic (C–H) bands, indicating oxidation and dehydration of phenolic, flavonoid, and alkaloid compounds. Furthermore, the highest levels of total phenols, flavonoids, and alkaloids were obtained in the light roast, whereas caffeine content increased with moderate to dark roasting. These findings suggest that light roasting is the most effective condition for preserving bioactive compounds, resulting in a functionally superior bee pollen coffee with lower caffeine content. Overall, this study highlights the potential of light-roasted bee pollen coffee as a high-value functional beverage and a promising healthy coffee alternative originating from East Kalimantan.
Acknowledgements
The authors acknowledge the financial support from the Ministry of Higher Education, Science, and Technology of Indonesia (Grant No.10/PL21.G/PG/2025) and the administrative assistance of LP2M, Samarinda State Agricultural Polytechnic. Appreciation is also extended to the research team and Mr. Danu Fuliana who has collaborators for their contributions to the collection and analysis of Heterotrigona itama bee pollen from East Kalimantan.
Declaration of Generative AI in Scientific Writing
The authors admit that generative AI methods are used for grammar correction and language editing such as QuillBot and ChatGPT. AI did not create any content or evaluate any data. The content of this work is entirely the responsibility of the writers.
CRediT Author Statement
Netty Maria Naibaho: Conceptualization, Data curation, Formal analysis, Investigation, Methodology, Resources, Software, Validation, Visualization, Writing-original draft. Anis Syauqi: Formal analysis, Investigation, Methodology, Resources, Validation, Writing-review & editing. Bernatal Saragih: Formal analysis, Investigation, Methodology, Validation, Writing-review & editing. Theresia Adi Susanti: Project administration, Resources, Software. Yuliana Sabarina Lewar: Formal analysis, Methodology, Writing-review & editing. Supriono: Formal analysis, Data curation, Resources, & Software. Andi Lisnawati: Formal analysis, Data curation, Writing-review & editing. Enos Tangke Arung: Formal analysis, Validation, Writing-review & editing.
A Bano, T A Qadri, M and N Khan. Bioactive metabolites of plants and microbes and their role in agricultural sustainability and mitigation of plant stress. South African Journal of Botany 2023; 159, 98-109.
N Selwal, F Rahayu, A Herwati, E Latifah, SC Suhara, IBK Suastika, WM Mahayu and AK Wani. Enhancing secondary metabolite production in plants: Exploring traditional and modern strategies. Journal of Agriculture and Food Research 2023; 14, 100702.
CP Mungwari, CK King’ondu, P Sigauke and BA Obadele. Conventional and modern techniques for bioactive compounds recovery from plants: Review. Scientific African 2025; 27, e02509.
NM Naibaho, W Fatriasari, IW Kusuma and ET Arung. Phytochemical screening, antioxidant and anti-inflammatory properties of several stingless bee pollens processed using different drying methods. Uludağ Arıcılık Dergisi 2023; 23(2), 153-166.
P Ganguly, S Chatterjee, S Kumari, PP Pati and K Julekha. Pharmacognostical, phytochemical and phytopharmacological activitiesof Solanum torvum utilized as a traditional medicinal herb: A review. Journal of Applied and Natural Science 2024; 16(3), 1317-1334.
T Lu, Y Sun, Y Huang and X Chen. Effects of roasting on the chemical compositions, color, aroma, microstructure, and the kinetics of changes in coffee pulp. Journal Food Science 2023; 88(4), 1430-1444.
GHH Oliveira and APLR de Oliveira. Coffee roasting, blending, and grinding: Nutritional, sensorial and sustainable aspects. Agriculture 2023; 13(11), 2116.
M Borucka, M Celiński, K Salasinska and A Gajek. Identification of volatile and semi-volatile organic compounds emitted during thermal degradation and combustion of triadimenol. Journal of Thermal Analysis and Calorimetry 2019; 139(2), 1493-1506.
EB Tarigan, E Wardiana, YS Hilmi and NA Komarudin. The changes in chemical properties of coffee during roasting: A review. IOP Conference Series: Earth and Environmental Science 2022; 974(1), 012115.
V Gottstein, K Krumbügel, T Kuballa, S Schwarz, P Walch and D W Lachenmeier. Monitoring of chemical changes in coffee beans during the roasting process using different roasting technologies with nuclear magnetic resonance spectroscopy. Beverages 2023; 9(4), 87.
А Lohinova and О Petrusha. Maillard reaction in food technologies. Ukrainian Journal of Food Science 2023; 11(2), 81-109.
EC Aytar and B Aydın. Investigation of chemical composition, antioxidant properties, and molecular docking in different roasting stages of coffee beans. Food and Bioprocess Technology 2023; 18, 1464-1482.
LE Hosry, V Elias, V Chamoun, M Halawi, P Cayot, A Nehme and E Bou-Maroun. Maillard reaction: Mechanism, influencing parameters, advantages, disadvantages, and food industrial applications: A review. Foods 2025; 14(11), 1881.
L Sun, D Wang, Z Huang, W Elfalleh, L Qin and D Yu. Structure and flavor characteristics of Maillard reaction products derived from soybean meal hydrolysates-reducing sugars. LWT 2023; 185, 115097.
CA Araújo, RS Lima, GF Oliveira, DB Nascimento, FS Campos, GC Gois, TGF Silva, ALR Magalhães and GGL Araújo. Carbohydrate fractionation and nitrogen compounds, mineral status, and gas production in arboreal cotton and cactus silages. Arquivo Brasileiro de Medicina Veterinária e Zootecnia 2025. https://doi.org/10.1590/1678-4162-13274
A Karim, L Mohammadi, EF Osse, M Aider, M Saqui-Salces and S Khalloufi. Effect of polysaccharide-induced viscosity on the digestion of proteins, fats, and carbohydrates in food: A comprehensive review and future perspectives. Trends in Food Science & Technology 2024; 153, 104757.
JLR Stéphanie, ELRSKB Rega and C Bonazzi. Unravelling caramelization and Maillard reactions in glucose and glucose + leucine model cakes: Formation and degradation kinetics of precursors, α-dicarbonyl intermediates and furanic compounds during baking. Food Chemistry 2021; 376(3), 131917.
M Kurzyna-Szklarek, J Cybulska and A Zdunek. Analysis of the chemical composition of natural carbohydrates - An overview of methods. Food Chemistry 2022; 394, 133466.
P Alonso-Riaño, A Illera, O Benito-Román, R Melgosa, A Bermejo-López, S Beltrán and M Sanz. Degradation kinetics of sugars (glucose and xylose), amino acids (proline and aspartic acid) and their binary mixtures in subcritical water: Effect of Maillard reaction. Food Chemistry 2024; 442, 138421.
S He, L Niu, C Sun, Z Zeng and J Xiao. Effects of different roasting conditions on sugars profile, volatile compounds, carotenoids and antioxidant activities of orange-fleshed sweet potato. Food Chemistry: X 2025; 25, 102201.
R Rusinek, B Dobrzański, M Gawrysiak-Witulska, A Siger, A Żytek, H Karami, A Umar, T Lipa and M Gancarz. Effect of the roasting level on the content of bioactive and aromatic compounds in Arabica coffee beans. International Agrophysics 2024; 38, 31-42.
M Fikry, YA Yusof, AM Al-Awaadh, RA Rahman, NL Chin, E Mousa and LS Chang. Effect of the roasting conditions on the physicochemical, quality and sensory attributes of coffee-like powder and brew from defatted palm date seeds. Foods 2019; 8(2), 61.
H Xue, J Zhao, Y Wang, Z Shi, K Xie, X Liao and J Tan. Factors affecting the stability of anthocyanins and strategies for improving their stability: A review. Food Chemistry: X 2024; 24, 101883.
Association of Official Analytical Chemist. Official methods of analysis of the Association of Official Analytical Chemists. Association of Official Analytical Chemist, Marlyand, 2006.
NM Naibaho, HD Salusu, RB Saragih, IW Kusuma, W Fatriasari and ET Arung. Sensory evaluation and antibacterial activity of bee pollen extracts isolated from several stingless bees in two drying methods. Biodiversitas Journal of Biological Diversity 2023; 24(5), 2682-2688.
J Harbone. Metode Fitokimia (Terjemahan). ITB Bandung, Bandung, Indonesia, 1987.
H Kurniawan, S Nurbaeti, F Nugraha and I Fajriaty. Penetapan kadar metabolit sekunder:Steroid, alkaloid, dan tanin ekstrak daun bintangur (Calophyllum soulattri) (in Indonesian). Sasambo Journal of Pharmacy 2024; 5(2), 83-90.
MHA Rahman, YM Jusoh and Z Hashim. Total phenolic, total flavonoid and antioxidant activity of capsicum annuum seed and pericarp extracts. Bioprocessing and Biomass Technology 2024; 3(2), 107-111.
RR Sihombing, S Priyono and L Hartanti. The effect of exselsa coffee roasting temperature and time on the physicochemical and sensory properties of coffee powder. FoodTech 2022; 1(1), 1-12.
EH Muhari, RP Sihombing, YT Sarungu, A Marlina, U Leoanggraini and T Hariyadi. Effect of fruit ripening level and roasting temperature on robusta coffee bean quality. International Journal of Applied Technology Research 2023; 4(1), 41-52.
T Dippong, M Dan, KM Haydee, ED Kovacs, EA Levei and O Cadar. Analysis of volatile compounds, composition, and thermal behavior of coffee beans according to variety and roasting intensity. Foods 2022; 11(19), 3146.
K Arwizet, D Leni, L H Peng, R Sumiati and Y P Kusuma. The effect of temperature and roasting time on changes in the characteristics and physical properties of solok arabika coffee beans. International Journal of MultidisCiplinary Rsearch and Literature 2024; 7(2), 100-108.
YK Kim, JM Lim, YJ Kim and W Kim. Alterations in pH of coffee bean extract and properties of chlorogenic acid based on the roasting degree. Foods 2024; 13(11), 1757.
NP Lestari, M Misto and E Purwandar. Chlorogenic acid content of local robusta coffee at variations of roasting temperature. Jurnal Pendidikan Fisika Indonesia 2022; 18(1), 25-32.
GV Gautério, RM Silva, FC Karraz, MAZ Coelho, BD Ribeiro and AC Lemes. Cell disruption and permeabilization methods for obtaining yeast bioproducts. Cleaner Chemical Engineering 2023; 6, 100112.
S Septiana, T Mahatmanto, A Salsabila and W Sunarharum. The effect of roasting degrees and brewing techniques on the physicochemicaland sensory characteristics of anaerobically fermented liberica coffee (coffea liberica). Trends in Sciences 2025; 22(6), 9819.
F Zhao, Z Wang and H Huang. Physical cell disruption technologies for intracellular compound extraction from microorganisms. Processes 2024; 12(10), 2059.
CR Balcázar-Zumaeta, K Reyna-Gonzales, DI Diaz, AJ Pajuelo-Muñoz, AF Iliquin-Chavez, I Yoplac, M Medina-Mendoza, D Mori-Mestanza, ISC Colca and E Castro-Alayo. Optimizing roasting time and temperature to enhance the physicochemical properties, and retention of bioactive compounds of three coffee arabica subvarieties. Applied Food Research 2025; 1, 100987.
DJM Abreu, MS Lorenço, GL Machado, J M Silva, EC Azevedo and EN Carvalho. Influence of drying methods on the post-harvest quality of coffee: Effects on physicochemical, sensory, and microbiological composition. Foods 2025; 14(9), 1463.
S Aghajanzadeh, A Sultana, AM Ziaiifar and S Khalloufi. Formation of pores and bubbles and their impacts on the quality attributes of processed foods: A review. Food Research International 2024; 188, 114494.
S Olivares-Galván, M Marina and M García. Extraction of valuable compounds from brewing residues: Malt rootlets, spent hops, and spent yeast. Trends in Food Science & Technology 2022; 127, 181-197.
J Oracz and E Nebesny. Effect of roasting parameters on the physicochemical characteristics of high-molecular-weight Maillard reaction products isolated from cocoa beans of different Theobroma cacao L. groups. European Food Research and Technology 2019; 245(1), 111-128.
B Kitchen and G Williamson. Melanoidins and (poly)phenols: An analytical paradox. Current Opinion in Food Science 2024; 60, 101217.
VS Sharanagat, R Suhag, P Anand, G Deswal, R Kumar, A Chaudhary, L Singh, OS Kushwah, S Mani, Y Kumar and PK Nema. Physico-functional, thermo-pasting and antioxidant properties of microwave roasted sorghum [Sorghum bicolor (L.) Moench]. Journal of Cereal Science 2019; 85, 111-119.
S Lin and J Xiao. Chapter One - Impact of thermal processing on dietary flavonoids. Advances in Food and Nutrition Research 2024; 108, 1-34.
M Li, X Chen, J Deng, D Ouyang, D Wang, Y Liang, Y Chen and Y Sun. Effect of thermal processing on free and bound phenolic compounds and antioxidant activities of hawthorn. Food Chemistry 2020; 332, 127429.
C Bitwell, S Indra, C Luke and MK Kakoma. A review of modern and conventional extraction techniques and their applications for extracting phytochemicals from plants. Scientific African 2023; 19, e01585.
M O Agunloye, D U Owu, O Onaadepo, F N Ugwu and O M Ogunyemi. Phytochemical characterization of ethanolic and ethyl acetate extracts of avocado Persea americana leaves by FT-IR and GC-MS reveals potential bioactive compounds. Science Reports 2025; 15(1), 27035.
M Maswal, M Pandita and S Bashir. Terpenes, terpenoids and steroids: Properties, biosynthesis and functions. In: AH Banday (Ed.). Steroids and their medicinal potential. Bentham Science Publisher, Singapore, 2023.
N Maiyah, S Kerdpiboon, S Supapvanich, WL Kerr, P Sriprom, N Chotigavin, W Klaypradit and T Puttongsiri. Recovering bioactive compounds and antioxidant capacity of medium roasted spent coffee grounds through varied hydrothermal brewing cycles. Journal of Agriculture and Food Research 2025; 20, 101789.
V S Reddy, S Shiva, S Manikantan and S Ramakrishna. Pharmacology of caffeine and its effects on the human body. European Journal of Medicinal Chemistry Reports 2024; 10, 100138.
JE Cherewyk, TJ Grusie-Ogilvie, S Parker, BR Blakley and AN Al-Dissi. The impact of storage temperature and time on ergot alkaloid concentrations. Toxins 2023; 15(8), 497.
D Franco-Ulloa, MD Luaces-Alberto, AC Valdés-Gonzalez, L Agüero-Luztonó and AN Baeza-Fonte. Determination of total phenolic compounds in Cuban monofloral honeys by reverse flow injection analysis Folin-Ciocalteau method. Microchemical Journal 2024; 204, 111008.
Y Gao, W Xia, P Shao, W Wu, H Chen, X Fang, H Mu, J Xiao and H Gao. Impact of thermal processing on dietary flavonoids. Current Opinion in Food Science 2022; 48, 100915.
A Ghani, NYA Rashid, DLA Razak, MA Manan and M Mansor. The effect of heat treatments on the bioactive compounds, antioxidant activity, and cosmeceutical properties (anti-pigmentation and anti-ageing) of fermented broken rice. Food Research 2023; 6(2), 155-162.
K Rzyska-Szczupak, A Przybylska-Balcerek, M Buśko, L Szwajkowska-Michałek, T Szablewski and K Stuper-Szablewska. Roasting temperature as a factor modifying the caffeine and phenolic content of ethiopian coffee. Processes 2025; 13(7), 2037.
AM Obando and JG Figueroa. Effect of roasting level on the development of key aroma-active compounds in coffee. Molecules 2024; 29(19), 4723.
A Abdelazez, G Abady, M Basiony, A Abd El-Rahman, SMA El-Shafei, ES Shaker, G Alshehry, E Algarni, H Aljumayi and AM Hassan. Carob Pod Nanoparticles: Enhancing physicochemical, antioxidant, and antibacterial properties of innovative functional frozen yogurt. Science of Food 2025; 9, 162.
KY Hsiao, RJ Chung, P Chang and TH Tsai. Identification of hydroxyl and polysiloxane compounds via infrared absorption spectroscopy with targeted noise analysis. Polymers 2025; 17(11), 1533.
A Kassem, L Abbas, O Coutinho, S Opara, H Najaf, D Kasperek, K Pokhrel, X Li, X Li and S Tiquia-Arashiro. Applications of Fourier Transform-Infrared spectroscopy in microbial cell biology and environmental microbiology: Advances, challenges, and future perspectives. Frontiers in Microbiology 2023; 14, 1304081.
GM Alcantara, LC Martins, WP Gomes, D Dresch, FR Rocha and WR Melchert. Effect of roasting on chemical composition of coffee. Food Chemistry 2025; 477, 143169.
M Dev and M Mukadam. Functional group profiling of medicinal plants using FTIR spectroscopy. World Journal of Biology Pharmacy and Health Sciences 2025; 21(1), 243-249.
S Pasieczna-Patkowska, M Cichy and J Flieger. Application of Fourier Transform Infrared (FTIR) spectroscopy in characterization of green synthesized nanoparticles. Molecules 2025; 30(3), 683.