Trends
Sci.
2026; 23(5): 11806
Thermal Oxidation-Driven Phase Control of CuO-Cu2O Hybrids on Copper Substrates for Tunable Optical Functionalities
Chaiyuth Nontakoat1, Suriyong Prachakiew1, Samor Boonphan1,
Sarayut Boonchuay1 and Arrak Klinbumrung2,*
1Faculty of Science and Agricultural Technology, Rajamangala University of Technology Lanna,
Chiang Rai 50300, Thailand
2School of Science, University of Phayao, Phayao 56000, Thailand
(*Corresponding author’s e-mail: Arrak.kl@up.ac.th)
Received: 6 September 2025, Revised: 13 September 2025, Accepted: 20 September 2025, Published: 1 January 2026
Abstract
CuO-Cu2O hybrid materials were developed through a simple single-step thermal oxidation process of copper plates. Copper substrates were annealed at a temperature range of 300 to 700 °C. To investigate the temperature-driven transitions in oxide composition, crystallography, and photonic response, various analytical techniques were employed. X-ray diffraction (XRD) confirmed the progressive transformation, accompanied by changes in phase fraction and structural modification. Fourier-transform infrared spectroscopy (FT-IR) and photoluminescence (PL) identified vibrational and emission features associated with bonding and oxide defect states, respectively. UV-Vis spectroscopy revealed a tunable bandgap between 2.60 and 2.55 eV, influenced by phase composition. Improved optical functions were observed at different heating temperatures. In this study, the thermal oxidation of a copper plate is proposed as a scalable strategy for phase-controlled oxide synthesis, suggesting that the synthesized CuO-Cu2O hybrids are considered for application in opto-related technology.
Keywords: Phase transition, CuO-Cu2O heterostructures, Phase-controlled synthesis, Thermal oxidation, Tunable optical functionalities
Introduction
Copper oxides, especially cuprous oxide (Cu2O) and cupric oxide (CuO), are promising semiconductors due to their distinctive physicochemical properties, eco-friendliness, and wide-ranging uses in photovoltaics, photocatalysis, optoelectronics, and sensors. Cu2O has a direct bandgap ranging from 2.0 to 2.6 eV, while CuO features an indirect and narrower bandgap between 1.2 and 1.9 eV, both of which support strong visible-light absorption and electronic functionality [1,2]. Importantly, combining Cu2O and CuO into a single structure creates a p-p heterojunction, which promotes improved charge separation and enhances the movement of photogenerated carriers over a broader spectral range [3]. Various synthesis techniques, including precipitation [4], electrodeposition [5], and sputtering
[6], have been employed. These methods involve multi-step procedures, toxic reagents, or limitations in scalability. On the other hand, thermal oxidation of copper substrates offers a facile, scalable, and cost-effective route to directly produce Cu-based oxide films. This method eliminates the need for precursor chemicals and can be precisely controlled through annealing parameters to yield desired oxide phases [7].
Following the previous reports, Cu/CuO/Cu2O heterostructures have been recognized for their potential in photocatalytic and optoelectronic applications, owing to improved charge carrier dynamics resulting from bandgap alignment at the oxide-metal interface [8]. This solution-based hydrothermal route involves organic reducing agents and produces Cu-dominated nanoparticles with partial oxidation, resulting in limited phase control. Considering oxidation preparation, the prior studies have demonstrated that oxidation temperature plays a crucial role in determining the phase composition, microstructure, and functional features of copper oxide films. As observed in the reports, oxidation at around 200 °C can generate Cu2O, while temperatures above 300 °C tend to produce CuO. Nonetheless, intermediate or mixed-phase states are influenced by substrate type, oxygen diffusion, and heating conditions [9,10]. High-crystallinity pure CuO is produced at temperatures of 1,000 °C, especially when oxidized in an oxygen-rich environment [11]. Therefore, the CuO-Cu2O hybrid with a tunable phase ratio can be produced by adjusting the heating temperature below 1,000 °C. The thermal oxidation strategy introduces a single step that enables direct phase control on bulk copper substrates without the chemical precursors. This method offers tunable phase ratios of CuO-Cu2O and crystalline improvements. These factors correlate with optical properties for light-matter interaction. To the best of our knowledge, few studies have examined diffusion-limited oxidation pathways and their impact on the optical properties of CuO-Cu2O hybrid.
Due to the advantages, this work lies in its scalable and integrative approach, which employs simple thermal oxidation of copper plates. The study aims to address that knowledge gap by examining the thermal oxidation of copper plates at different annealing temperatures. Also, the phase transition from metallic Cu to Cu2O and CuO was investigated, showing that the various oxidation conditions affect crystallographic properties, optical constants, defect formation, and interfacial features. The attention is given to identifying the conditions that lead to the formation of CuO-Cu2O composites and their implications for light-matter interactions. The optical properties, including bandgap energies, photoluminescence, extinction coefficients, skin depth, and optical density, were correlated with XRD-derived crystallite sizes, lattice parameters, and microstrain to understand structure-property relationships. Notably, the continued presence of Cu2O at high oxidation temperatures, contrary to traditional expectations, was attributed to diffusion-limited oxidation. These mechanisms are rarely studied in detail on bulk copper substrates. The microstructural changes introduce the tailoring of the opto-electronic properties of copper oxide. This understanding involves materials characterization and aids in designing copper-based oxide systems for practical technological applications.
Materials and methods
Materials synthesis
To synthesize CuO-Cu2O materials, thermal oxidation was performed by heating at 300, 500, and 700 °C with a 5 °C/min heating rate for 2 h and ground to the ambient temperature with a natural cooling rate. The oxidation duration of 2 h and ambient pressure are maintained constant to emphasize the impact of temperature on phase transformation. The decided conditions were considered based on complete CuO-Cu2O formation. Previous reports indicate that at temperatures approximately 750 °C, Cu-based oxides undergo grain coarsening and oxygen loss [12]. Thus, this study limits the heating temperature to 700 °C.
Before the oxidation process, copper plates with dimensions of 10×45×0.5 mm3 were prepared and then immersed in a 2% v/v nitric acid solution for 30 min. The treated Cu plates were rinsed in absolute ethanol and DI water several times. Surface morphology and EDX spectra with 100 at% Cu are shown in Figures 1(a) and 1(b), respectively. The samples prepared at heating temperatures of 300, 500, and 700 °C were designated as 300Cu, 500Cu, and 700Cu, respectively.
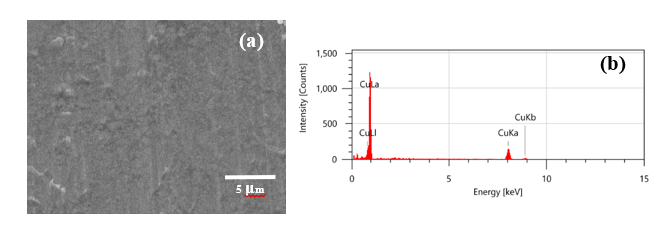
Figure 1 The prepared Cu plate: (a) SEM image and (b) EDX spectra.
Characterization
Phase analysis was performed using X-ray diffraction (XRD) with Cu Kα radiation (λ = 1.54178 Å), measuring a 2θ range from 20° to 80°, and fitted with the database of the Joint Committee on Powder Diffraction Standards (JCPDS). The morphology of the synthesized powders was examined using scanning electron microscopy (SEM) (JEOL, JCM-7000 NeoScopeTM) with the energy-dispersive X-ray spectroscopy (EDX) analysis. Fourier transform infrared spectroscopy (FTIR) (Thermo Scientific, Nicolet 6700) was used to analyze structural bonding vibrations within the 400 - 4,000 cm–1 spectral range. Optical properties were examined using a UV-Vis spectrophotometer (Jasco, V-503), measuring wavelengths from 400 to 800 nm. The intrinsic defects were identified using a photoluminescence spectrometer (PL) (Jasco, FP-8500) with an excitation wavelength of 369 nm at room temperature.
Results and discussion
The thermal oxidation of copper plates occurs through a clearly defined sequence of phase transitions, affected by the annealing temperature and oxygen diffusion dynamics. The oxidation pathway follows this progression: Cu (metal) → Cu2O → CuO. Prior literature observations confirm that at low temperatures (~150 - 250 °C), the surface of the copper plate experiences partial oxidation, resulting in the formation of cuprous oxide (Cu2O), which exhibits characteristic peaks associated with its cubic crystal structure. As the temperature rises to approximately 250 - 350 °C, a second oxidation step takes place, during which Cu+ in Cu2O is further oxidized to Cu2+, resulting in the formation of monoclinic cupric oxide (CuO) via an oxygen-enriched, diffusion-controlled process mechanism. The oxidation process was elucidated through Eqs. (1) - (2) [9,13,14].
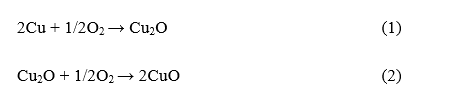
This sequential transformation was reported to be the calcination-induced phase transition of Cu2O into CuO. A Cu2O-CuO composite was observed when the oxidation temperature was carefully controlled [13]. The migration of Cu+ ions and O2− ions was determined by transient X-ray absorption studies, showing the Cu(I):O2 to Cu(II):O2− transition during dioxygen binding in oxidation pathways [9]. These changes in oxidation state indicate electron transfer from copper to oxygen and are essential for phase evolution. Additionally, thermal stress and structural deformation cause deformation and cracking in copper-based composites, leading to oxidation during annealing driven by differential expansion and stresses associated with oxide growth [10].
As shown in Figure 2, the XRD diffractogram of copper substrates oxidized at annealing temperatures of 300, 500 and 700 °C. The diffraction peaks were identified according to the standard JCPDS files, indicating the presence of Cu (No. 01-1242), Cu2O (No. 05-0667), and CuO (No. 05-0661). The phase evolution illustrates the thermally induced transformation from metallic copper to a mixture of Cu2O and CuO. For 300Cu, the XRD pattern reveals dominant peaks at 2θ ≈ 43.3° and 50.4°, indicating the presence of residual unoxidized copper, corresponding to the (111) and (200) planes. Emerging Cu2O peaks at 36.5° and 42.3°, interpreted as (111) and (200) planes. The minority phase of CuO was observed at 35.5° and 38.7°, indicating partial oxidation forming from Cu2O to CuO growth. The observed phases confirm the presence of a phase transition at low temperatures. At a higher annealing temperature of 500 °C (500Cu), the Cu peaks disappear, indicating complete oxidation of the metallic substrate. Cu2O is found with the most significant increase. The CuO phase with a minor phase appears at 2θ values of 32.5°, 35.5°, 38.7°, and 48.7°, corresponding to the (110), (−111), (111), and (–202) planes of monoclinic CuO. This indicates that heterojunction formation occurred in the CuO-Cu2O system, consistent with the report by Chang et al. [13]. As observed in the 700Cu, the sharpness and increased intensity of CuO-Cu2O peaks indicate improved crystallinity with temperature. Due to Cu2O as a prominent phase, the finding does not agree with the previous study of Cu plate oxidation, which reveals CuO formation at 350 °C. Nevertheless, the formation of Cu2O at heating temperatures exceeding 700 °C has been reported. Diffusion-limited oxidation kinetics lead to the formation of a bilayer structure of outer CuO and inner Cu2O phases [13]. Additionally, CuO can be transformed into Cu2O at higher temperatures [9]. Moreover, the presence of Cu2O in thick oxide layers formed at high temperatures is significant, as gas exchange is restricted due to phase equilibrium [10]. As mentioned above, the oxidation process is affected by the diffusion of oxygen and copper, which is crucial for the growth of oxide layers and the conversion of CuO into Cu2O. The presence of oxygen vacancies and their migration play a role in the phase transformation, as observed in the decomposition of CuO into Cu2O [15].
The phase composition of the synthesized materials was determined using the Rietveld method [16] with the MAUD software package [17]. Crystallographic Information Files (CIFs) corresponding to their space groups were sourced from the Crystallography Open Database (COD): NO.9005769 for cubic Cu with the space group Fm3m, NO.9005716 for Cu2O with a cubic structure (space group Pn-3m), and NO.1011148 for monoclinic CuO with the space group C2/c. Table 1 presents the phase composition and lattice constants of samples annealed at 300, 500 and 700 °C. The data reveal a temperature-driven oxidation trend, characterized by distinct transitions in the content of Cu, Cu2O, and CuO. The phase composition of 300Cu reveals that copper dominates (98.88 wt%), with traces of Cu2O and CuO, indicating initial surface oxidation. The phase fraction of the 500Cu shows 71.05 wt% for Cu2O and 28.95 wt% for CuO. The CuO lattice exhibits a slight contraction, particularly along the b-axis, indicating enhanced crystallinity and phase maturity under thermal activation, similar to that observed in reconstructed CuO in solvothermal systems [18]. As observed in 700Cu, Cu2O remains the dominant phase (68.22 wt%). Despite the decreasing phase fraction, this finding confirms that phase persistence results from diffusion-limited oxidation and kinetic trapping. These findings support an oxidation pathway that is influenced by thermal dynamics, oxygen availability, and lattice relaxation processes.
As a result of thermal-induced oxidation, the temperature-dependent changes in lattice parameters for Cu2O and CuO exhibit a 2-step trend. An initial decrease occurs as the heating temperature increases to 500 °C. On the contrary, the lattice quantity exhibits an increasing trend up to a temperature of 700 °C. This behavior reflects the complex interaction between oxidation-induced strain, defect dynamics, and thermal relaxation processes. Increasing thermal activation from 300 to 500 °C, the observed reduction in lattice parameters is ascribed to oxidation-induced compressive stress and structural densification. As oxide layers form on copper, interfacial strain increases, limiting atomic spacing. Additionally, crystallization and defect reduction at 500 °C promote denser atomic packing, resulting in a smaller unit cell size [19]. At an annealing temperature of 700 °C, the lattice parameters are close to the database values. This expansion arises from thermal relaxation of accumulated stress, increased oxygen content, and thermally induced lattice vibrations, which facilitate structural re-equilibration and lattice expansion at elevated temperatures [11]. This 2-phase trend emphasizes the role of temperature not only in phase transformation but also in modulating oxide crystallography and defect accommodation.
The statistical parameters, including the reliability factor of the expected weight profile (Rexp), and the goodness of fit (Sig), were assessed after the refinement cycle. The value around 1 indicates a satisfactory fit [20]. Nevertheless, a higher parameter value was frequently reported due to the high-precision system [21]. The peak fitting results from the Rietveld refinement are depicted in Figure 3.
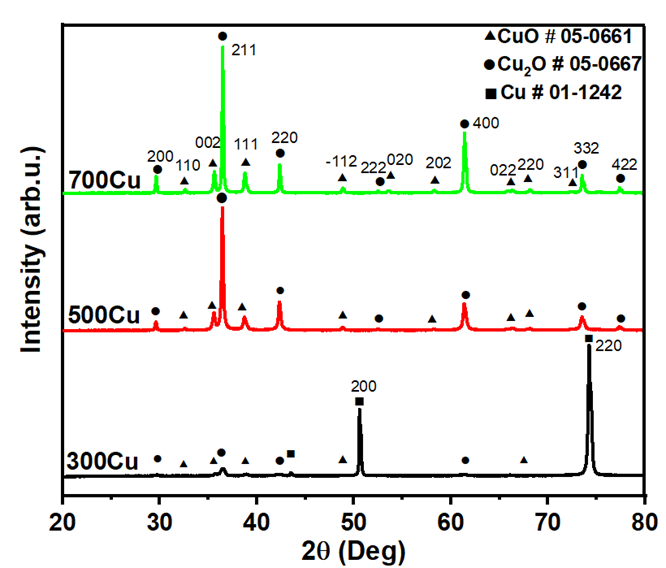
Figure 2 XRD patterns of as-synthesized powders.
To further understand the thermal-induced phase transition and crystallography, the crystallite size and residual strain were calculated using XRD data. The Williamson-Hall (W-H) method, which enhances the analysis by incorporating the micro-strain factor into the equation, was employed to determine these quantities, as follows [22]:
![]()
Given that ε represents the micro-strain within the crystal lattice. The relationship can be approximated to determine crystallite size and micro-strain by utilizing the slope of the linear equation and the y-intercept. The W-H plot is elucidated in Figure 4, separating phase approximation, and the calculated values are presented in Table 1.
The crystallite size and microstrain of Cu2O and CuO phases demonstrate an inverse relationship. The crystallite sizes of the 300Cu, 500Cu, and 700Cu samples are 188.36, 138.76, and 133.42 nm for Cu2O, and 4.43, 31.11, and 52.56 nm for CuO. The microstrain values are 0.0408, 0.0115, and 0.0073 for the Cu2O phase, and 0.1239, 0.0135, and 0.0112 for the CuO phase. Larger crystallite sizes are consistently correlated with diminished microstrain. This phenomenon is typical of metal oxide systems, wherein grain growth diminishes lattice imperfections and internal stress. This relationship illustrates the fundamental balance between grain boundary density and lattice distortion during thermal oxidation, where lattice distortion obstructs crystal growth. As found in 300Cu, oxide phases exhibit small crystallites and high microstrain, indicating early-stage nucleation under stress. At a higher heat treatment temperature of 500 °C, grains fuse and expand, resulting in reduced strain through partial relaxation. This is evidenced by decreased lattice parameters, which suggest a denser and less defective structure [23].
The most significant change occurs at the 700 Cu, both Cu2O and CuO crystallites reach their largest size, and microstrain reaches the minimum. This sample demonstrates a highly ordered, stress-relieved structure indicative of phase stabilization. The increase in lattice constants reflects thermal re-equilibration rather than defect-induced expansion, supporting the notion that high-temperature annealing influences oxide quality [24]. This trend confirms that increasing crystallite size and strain relaxation directly accompany the thermally induced phase transition, consistent with XRD results and oxidation pathway studies.
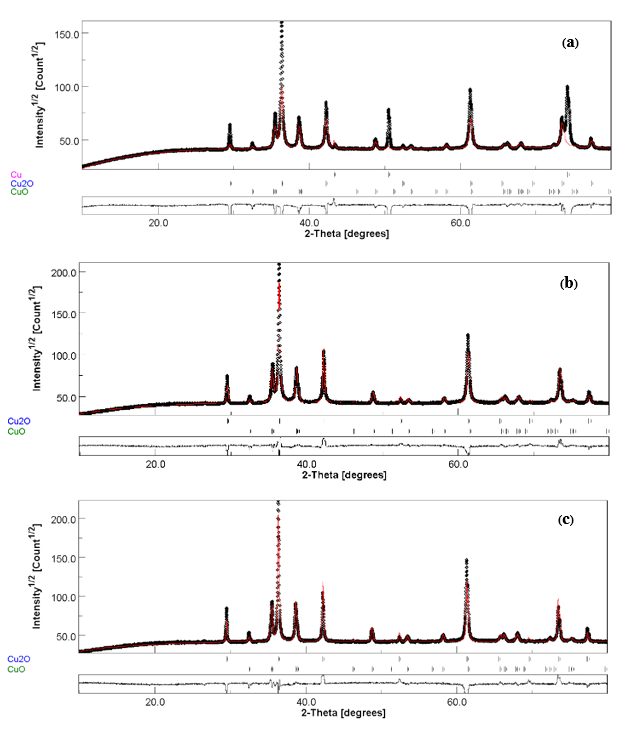
Figure 3 The peak fitting results from the Rietveld refinement of (a) 300Cu, (b) 500Cu, and (c) 700Cu.
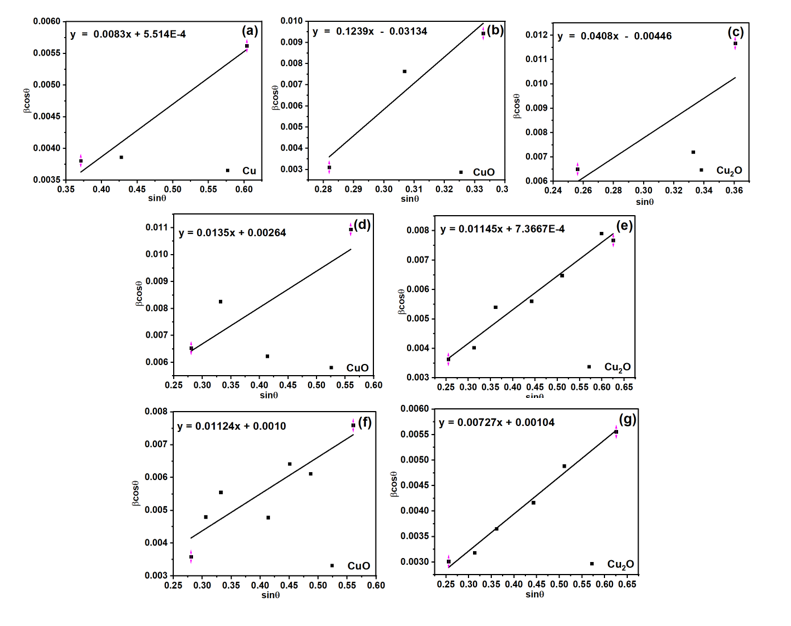
Figure 4 Williamson-Hall plot to approximate the crystallite size and microstrain of the emerging phase of Cu, CuO, and Cu2O: (a) - (c) 300Cu, (d), (e) 500Cu, and (f), (g) 700Cu.
Table 1 The phase composition, lattice constants, crystallite size, and microstrain of as-synthesized materials.
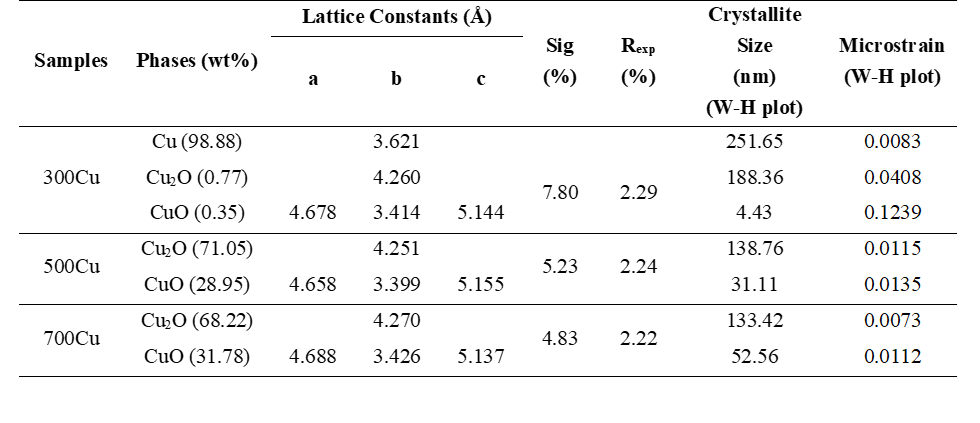
*Lattice constants from JCPDS database, No. 05-0667 for Cu2O showing 4.2696 Å and No. 05-0661 for CuO with a = 4.6840 Å, b = 3.4250 Å, and c = 5.1290 Å.
The FT-IR spectra of thermally oxidized Cu substrates at 300, 500 and 700 °C are shown in Figure 5. All spectra exhibit characteristic vibrations related to copper oxides, confirming phase formation and structural bonding. The broad absorption at 3,647 cm−1 observed in all samples corresponds to the O-H stretching mode, attributed to adsorbed surface hydroxyls or residual moisture [25]. The peak at around 2,369 cm−1 results from O-C-O stretching, probably caused by atmospheric CO2 adsorbing onto the oxide surface [26]. The dominant bands appear in the low-wavenumber region. The absorption near 600 cm−1 is attributed to Cu-O stretching in CuO [4], while the band around 560 cm−1 corresponds to Cu(I)-O vibrations from Cu2O [27]. These peaks become more pronounced as the annealing temperature increases, indicating improved crystalline and phase development, which is consistent with the XRD results. Especially, the 700Cu sample exhibits intense and well-resolved Cu-O peaks, indicating enhanced crystallization and reduced strain. The finding is consistent with an increased crystallite size and improved lattice stability. In accordance with XRD analysis, the Cu(I)-O vibrations imply incomplete oxidation or the presence of stable Cu2O regions [28].
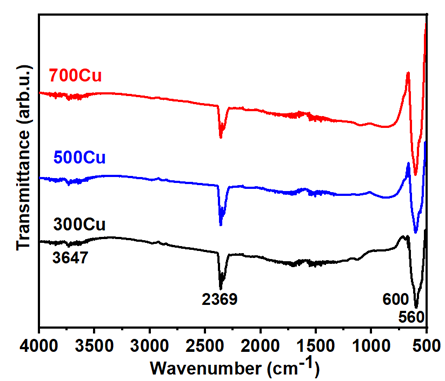
Figure 5 The FT-IR spectra of the as-annealed samples.
Figure 6 shows SEM micrographs of oxidized copper substrates. A relationship between oxidation temperature and particle size is found, indicating temperature-driven grain growth. The 300Cu exhibits fine particles with uniform size distribution (below 100 nm), as depicted in Figure 6(a). As an XRD result, these small grains are indicative of initial nucleation stages dominated by Cu2O formation on the Cu substrate. Due to limited diffusion and insufficient thermal energy, a significant fraction of CuO was observed. At 500 °C, the Cu substrate breaks, and particles grow, forming irregularly shaped particles with a size of around 200 - 300 nm (Figure 6(b)). This coarsening indicates crystallite growth and lattice strain relaxation, which can be described by a decrease in microstrain and an increase in crystallite size. Owing to CuO-Cu2O heterostructures forming, morphology represents a transitional stage with mixed oxidation states and improved diffusion kinetics. Figure 6(c) shows the morphology of the 700Cu sample with well-faceted polyhedral grains with over 400 nm in size, indicating advanced thermal recrystallization. These larger, dense structures correspond to the lowest microstrain and the largest crystallite sizes, indicating phase equilibrium and minimal lattice distortion. According to FT-IR analysis, the prominent Cu-O bonds indicate a high structural order and phase stabilization. This trend of rising particle size with temperature aligns with Ostwald ripening behavior, where higher temperatures promote atom migration and crystal merging, lowering surface energy [23].
Figure 7 presents the energy-dispersive X-ray spectroscopy (EDX) results for the 300 Cu, 500 Cu, and 700 Cu samples, accompanied by their corresponding elemental mapping images. Quantitative data in Table 2 indicate a steady increase in oxygen atomic percentage with higher annealing temperatures, reaching 29.44% for 300 Cu, 32.02% for 500 Cu, and 40.48% for 700 Cu. This trend confirms that oxidation levels rise with higher thermal treatments. For the 300Cu, the elemental distribution is very uniform, with copper of 70.56 at% and surface oxygen 29.44 at%. This is associated with the XRD findings, which identify metallic Cu as the primary phase, with small amounts of Cu2O and CuO. The EDX map verifies a uniform distribution of Cu and O signals, suggesting that oxidation is limited to the surface (Figure 7(a)). By annealing at 500 °C, the copper signal slightly diminishes, while the oxygen intensity increases. The oxygen-enriched regions depicted in the EDX maps (Figure 7(b)) correspond to the formation of copper oxide (CuO) clusters, aligning with X-ray diffraction (XRD) results that identify mixed phases of Cu2O and CuO. The appearance of oxygen-dense zones indicates the nucleation of CuO. Exceeding 700 °C annealing temperature, similar to that of the 500Cu, the EDX mapping (Figure 7(c)) shows even more distinct oxygen concentration zones, indicating deeper oxidation. By increasing O at%, this finding can be attributed to the increasing CuO phase, corresponding to the phase composition estimation in Rietveld analysis. Notably, despite the high temperature, the O distribution may result from diffusion-limited oxidation and the formation of CuO-Cu2O layered structures. This heterogeneity is typical in thermally grown copper oxides, where oxygen inserts incompletely, particularly in bulk material substrates [29].
Table 2 The elemental composition analyzed by the EDX technique and energy bandgap of the as-synthesized samples.

Figure 6 SEM images of (a) 300Cu, (b) 500Cu, and (c) 700Cu.
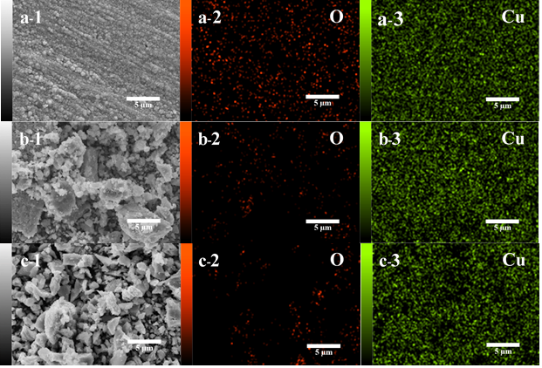
Figure 7 EDX analysis to determine the surface elemental distribution of Cu and O: (a) 300Cu, (b) 500Cu, and (c) 700Cu.
The UV-Vis absorbance spectra demonstrate a declining trend in optical absorbance as the annealing temperature increases (Figure 8(a)). The 300Cu sample exhibits the highest absorbance in the UV region, attributed to the dominant metallic copper content. The absorbance decreases in the 500Cu and further in the 700Cu, indicating improved phase purity and crystallinity of Cu2O and CuO. This finding reflects a decrease in defect-related localized states, improving optical transparency. Furthermore, larger crystallites formed at higher temperatures, which decreases strain and supports the stabilization of the bandgap. These results align with temperature-dependent optical studies of copper oxide [30], indicating a direct relation between improved structure and enhanced optical transparency.
The absorption spectrum reveals the fundamental band structure. An analytical method approximates the energy bandgap (Eg) by examining the absorption coefficient (α) and photon energy (hv), using the Wood and Tauc equation (Eq. (4)) [31].
![]()
The variable Eg represents the energy bandgap of the synthesized materials, where h is Planck’s constant, v indicates photon frequency, and n is an integer that reflects the transition process. An n value of 1/2 indicates a direct energy bandgap, consistent with a previous report that mentions the direct energy bandgap [32]. Figures 8(b) - 8(d) presents a graph of (αhv)2 versus photon energy (hv), demonstrating that the direct bandgap energy (Eg) was determined by extrapolating the linear segment where (αhv)2 reaches zero. Employing Tauc’s equation, the bandgap values for 300Cu, 500Cu, and 700Cu were 2.60, 2.69, and 2.55 eV, respectively. The slight increase in Eg in the 500Cu is attributed to the formation of CuO-Cu2O heterojunction. With a higher Cu2O composition, the Cu-rich component in the sample, compared with that of the composite sample, introduces Cu+/Cu2+ interconversion. This results from the structural distortions and alterations in Cu-Cu interactions that occur when the oxidation state changes [33]. The optical transition change causes the widening of Eg. Interestingly, the bandgap narrowing in the 700Cu indicates the emergence of sub-bandgap states and an increased contribution of the lower bandgap CuO [1,2]. This behavior is associated with the formation of intrinsic defects [34]. Thermal oxidation at temperatures of 700°C increases oxygen diffusion, introducing localized states within the bandgap. The states serve as acceptor levels, reducing the optical bandgap.
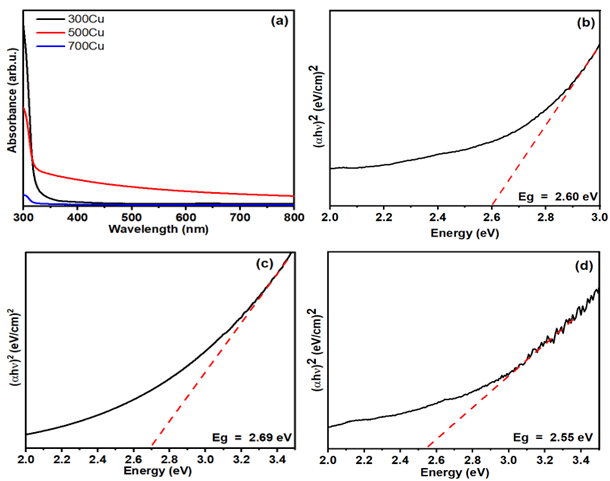
Figure 8 (a) The UV-Vis absorbance spectra of as-synthesized powders and the plot of (αhυ)2 against photon energy of (b) 300Cu, (c) 500Cu, and (d) 700Cu.
To understand the light-material interactions of thermally oxidized Cu samples, optical characteristics were calculated from UV-Vis data, as presented in Table 3. The energy absorbed by a substance depends on various factors such as the extinction coefficient, material composition, conductivity, and thickness within the absorption zone. The absorption coefficient (α) was derived from the skin depth (δ), calculated using Eq. (5) [35].
As depicted in Figure 9(a), the skin depth indicates the extent of light penetration at a low energy of 2 eV before diminishing to 1/e. The highest value observed for the 700Cu sample was 5.65. Conversely, the 300Cu and 500Cu samples exhibited lower skin depths, showing 1.51 over 300Cu and 0.09 over 500Cu. The 300Cu and 500Cu samples exhibit low photon absorption, indicating greater electromagnetic wave attenuation and a lower penetration depth compared to the other samples. Despite the 500Cu and 700Cu samples having similar Cu:O atomic ratios, their optical skin depths differ significantly. This difference is not only due to composition but also results from microstructural and phase-related factors. The 700Cu exhibits larger crystallite sizes and reduced microstrain, indicating that the improved structural order features diminish defect-related absorption pathways. This results in a lower absorption coefficient and increased optical penetration. In contrast, the 500Cu displays smaller crystallites with higher strain, introducing localized states that enhance light absorption and reduce skin depth.
Optical density (Dopt) quantifies the reduction in light as it passes through a material. Higher Dopt means greater absorption, and lower Dopt indicates more light passes through. Dopt is calculated by Eq. (6) [36], where α is the absorption coefficient and t is the thickness (1 cm).
![]()
Optical density (Dopt), as shown in Figure 9(b), shows significantly higher Dopt values for 300Cu and 500Cu, exceeding 5.0 at the energy of 4.0 eV. The Dopt value increased the absorbance and decreased the light transmittance. Whereas the 700Cu reveals the most insignificant value of 0.20. The expected inverse relationship between Dopt and skin depth is observed, as higher absorbance indicates shallower penetration, consistent with previous findings in CuO-Cu2O [24].
Figures 9(c) and 9(d) show the extinction coefficient (k) and refractive index (n) as functions of wavelength for the 300Cu, 500Cu, and 700Cu samples. These optical constants provide more detailed insight into the thermal oxidation, influencing light–matter interactions. The extinction coefficient (k) is crucial in optical studies, indicating that a medium absorbs electromagnetic waves. The relationship between photon wavelength (λ) and absorbance coefficient (α) affects the extinction coefficient change. As λ increases, the value of parameter “k” rises, leading to higher scattering and light absorption loss. The related equation is presented, as shown in Eq. (7) [37].
![]()
The extinction coefficient shows a similar tendency to the absorbance study and clearly exhibits a variable quantity at wavelengths below 325 nm. The 300 Cu shows the highest k value of 0.00012, indicating strong absorption, caused by residual metallic Cu and abundant defect states. The 500Cu significantly reduces the k value (0.00007), reflecting partial crystallization and CuO-Cu2O phases. The 700Cu sample, exhibiting the lowest k among the specimens’ spectra, with a value of 0.00001, is consistent with a decreased defect density. The linear portion was drawn to approximate edges to indicate the activation energy. The 300Cu with the most significant energy was observed. The study demonstrates that increased energy excitation impacts various phase combinations and morphology.
The refractive index (n) is a vital optical parameter that significantly influences the development of optical tools used to analyze polarization phenomena and the phase velocity of light in materials. Its value is determined using Eq. (8) [38].
The refractive index (n) decreases as heating temperature rises, showing more than 0.50 at 300 nm for 300Cu, 0.38 for 500Cu, and 0.13 for 700Cu. This declining trend indicates a decrease in dielectric response and light confinement as the structure transitions from a metal-oxide composite with higher defects to a more crystalline composite, which presents an ordered oxide framework. These patterns agree with the oxidation temperature, which influences optical constants through improvements in phase purity and crystallinity. In agreement with the report, thin-film CuO shows that well-crystallized oxide layers have lower k and n values, resulting in improved transparency [39]. This is consistent with the 700 Cu sample. The intermediate values at 500 °C thermal treatment support the heterojunction-induced optical enhancement [40]. This optical behavior aligns that elevated thermal treatment enhances transparency and reduces dielectric response. The relationship supports the observed phase and morphological transitions, emphasizing the controllability of optical constants through regulated thermal oxidation.
Figure 9 The optical characteristics of the as-prepared powders, exhibiting in terms of (a) skin depth, (b) optical density, (c) extinction coefficient, and (d) refractive index.
Table 3 The skin depth, optical density, extinction coefficient, and refractive index of the as-synthesized samples.

Figure 10 presents the room-temperature photoluminescence (PL) spectra of copper-based oxide samples annealed at 300, 500 and 700 °C, under a 325 nm excitation wavelength. All samples exhibit a primary emission band centered at approximately 658 - 660 nm (1.88 - 1.90 eV), attributed to the radiative recombination of charge carriers through defect-related states. The emission peak is attributed to defect states within the Cu2O lattice, which are introduced during the phase transition. These defects may include oxygen vacancies and copper interstitials, creating localized states within the bandgap that facilitate radiative recombination [41].
The 300Cu sample exhibits a significantly broader emission with satellite peaks at 650 and 657 nm. These are less prominent or absent in the higher-temperature samples. This indicates the recombination pathways of unoxidized metallic Cu, as confirmed by XRD analysis. Residual copper may induce localized surface plasmon resonance (LSPR)-like effects at the oxide-metal interface. These effects enhance adjacent emission bands by trapping charge carriers and increasing radiative transitions. Moreover, LSPR enhances the strength and number of PL peaks by coupling with transitions related to defects [42]. The primary emission at 655 - 660 nm represents typical Cu1+-O transitions in cuprous oxide. The additional satellite peaks could originate from Cu0-enhanced recombination pathways or from complex centers associated with Cu2+, which form together with oxygen vacancy states [43].
Due to oxidation at 500 °C, enhanced crystallinity and diminished disorders suppress non-radiative recombination sites, eliminating certain radiative defects [44]. Thus, the satellite spectra were not observed in the 500Cu and 700Cu samples. Furthermore, the formation of CuO-Cu2O junctions may promote charge separation over recombination, thereby contributing to a further reduction in PL intensity. As a PL study, the 700Cu exhibits the most significant intensity. This can be described as an improved crystalline structure, which supports electron-hole recombination. A slight redshift in peak emission is observed in the 500Cu and 700Cu spectra, resulting in a narrowing bandgap attributed to the incorporation of CuO and the formation of interface states between Cu2O and CuO.
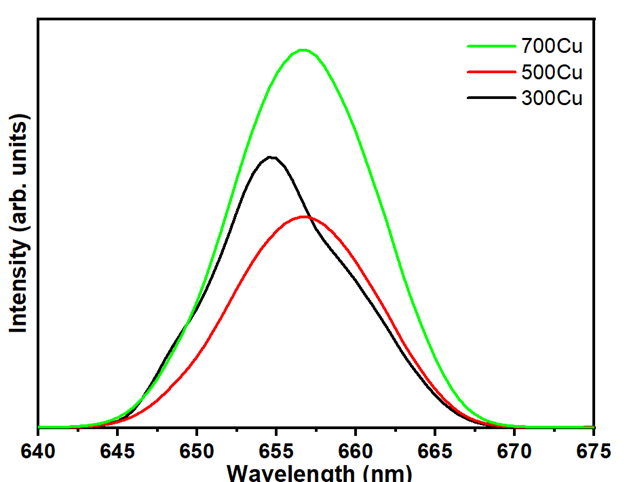
Figure 10 Photoluminescence spectra of as-annealed powders.
Conclusions
This study presents an investigation into the phase evolution, microstructural behavior, and optical properties of CuO-Cu2O hybrid materials produced through the thermal oxidation of copper plates, with annealing temperatures ranging from 300 to 700 °C. The formation of Cu2O as the primary phase and CuO as a minor phase was observed. Notably, at 700°C heating, the existence of Cu2O indicates the occurrence of diffusion-limited oxidation. As discussed in a prior study [11], the varying heating temperature below 1,000 °C can oxidize the Cu plate to form CuO-Cu2O. Compared to solution-based synthesis, which often yields Cu/CuO/Cu2O mixtures with limited phase uniformity [8], the thermally oxidized hybrids show distinct phase separation and enhanced crystallinity. XRD confirmed the changes in the crystallites and lattice parameters with increasing oxidation temperature. The 700 Cu sample shows the lowest microstrain, the largest crystallite size, and the closest lattice parameters to the database values. FT-IR analysis of the 700Cu sample reveals the most intense Cu-O vibration peaks, confirming enhanced crystallization. UV–Vis absorption analysis revealed the variation of Eg with values of 2.60 eV (300Cu), 2.69 eV (500Cu), and 2.55 eV (700Cu), attributed to phase hybridization and defect-state effects. The 700Cu sample exhibited the narrowest bandgap, the lowest optical density, and the most significant skin depth. These findings indicate superior light penetration and low photon scattering. PL analysis further revealed oxygen vacancies and copper interstitials -assisted visible emission features. These results demonstrate that thermal conditions affect the structure and optical properties of Cu-based oxides, which inform the future materials development for optoelectronic uses.
Acknowledgements
The authors gratefully acknowledge the Faculty of Science and Agricultural Technology, Rajamangala University of Technology Lanna and the School of Science, University of Phayao, Thailand, for meaningful support of this work. The Thailand Science Research and Innovation Fund and the University of Phayao, Thailand funded this research.
Declaration of Generative AI in Scientific Writing
The AI tools were employed to enhance clarity and elevate language quality. The authors confirm that all intellectual content was conceived and verified by the authors, without the use of AI tools for data generation, image creation, and execution of experimental procedures and interpretation.
CRediT Author Statement
Chaiyuth Nontakoat: Data curation; Investigation; Writing - Original draft preparation. Suriyong Prachakiew: Formal analysis. Samor Boonphan: Data curation; Writing - Original draft preparation; Validation. Sarayut Boonchuay: Formal analysis. Arrak Klinbumrung: Conceptualization; Methodology; Supervision; Validation; Writing - Reviewing and Editing; Funding acquisition.
References
[1] Q Su, C Zuo, M Liu and X Tai. A review on Cu2O-based composites in photocatalysis: Synthesis, modification, and applications. Molecules 2023; 28(14), 5576.
[2] V Molahalli, A Sharma, K Bijapur, G Soman, A Shetty, B Sirichandana, BGM Patel, N Chattham and G Hegde. Properties, synthesis, and characterization of Cu-based nanomaterials, copper-based nanomaterials in organic transformations. American Chemical Society 2024; 1466, 1-33.
[3] Y Yang, D Xu, Q Wu and P Diao. Cu2O/CuO bilayered composite as a high-efficiency photocathode for photoelectrochemical hydrogen evolution reaction. Scientific Reports 2016; 6(1), 35158.
[4] R Sirirak, P Chaopanich, A Prasatkhetragarn, C Chailuecha, S Kuimalee and A Klinbumrung. Doping effect of Zn on structural and optical properties of CuO nanostructures prepared by wet chemical precipitation process. Radiation Physics and Chemistry 2022; 190, 109788.
[5] CV Niveditha, MJ Jabeenfatima and S Sindhu. Electrochemical synthesis of p-type copper oxides. Наносистемы: физика, химия, математика 2016; 7(4), 747-751.
[6] KF Genaro-Saldivar, GR Negrete-Reyes, E Ramirez-Meneses, C Juarez-Balderas, F Avendano-Sanjuan, DA Garcia-Najera and JG Ibanez. Simultaneous anodic and cathodic electrodeposition of cu2o for solar energy conversion. Kimya Problemleri 2024; 22(4), 447-457.
[7] S Jurečka, PP Sahoo and P Čendula. Optical and microstructural properties of electrodeposited cuprous oxide. Applied Physics A 2024; 130(3), 179.
[8] M Abd Elkodous, G Kawamura, WK Tan and A Matsuda. Facile 1-pot preparation of Cu/CuO/Cu2O heterojunction for photocatalytic applications. Materials Letters 2022; 323, 132606.
[9] SY Wang, JR Zhang, G Ge and W Hua. Deciphering the Cu(I):O2 to Cu(II):O2− transition along the binding pathway through computational transient x-ray absorption spectra. ChemRxiv 2025. https://doi:10.26434/chemrxiv-2025-8v846
[10] ZL Croft, O Valenzuela, C Thompson, B Whitfield, G Betzko and G Liu. Copper oxidation-induced nanoscale deformation of electromechanical, laminate polymer/graphene thin films during thermal annealing: Implications for flexible, transparent, and conductive electrodes. ACS Applied Nano Materials 2024; 7(24), 28829-28840.
[11] VH Castrejón-Sánchez, AC Solis, R López, C Encarnación-Gomez, F Morales Morales, OS Vargas, JE Mastache-Mastache and GV Sánchez. Thermal oxidation of copper over a broad temperature range: Towards the formation of cupric oxide (CuO). Materials Research Express 2019; 6(7), 075909.
[12] B Maack and N Nilius. Morphological and kinetic insights into Cu2O-CuO oxidation. Physica Status Solidi (b) 2019; 257(1), 1900365.
[13] CJ Chang, CW Kang and A Pundi. Effect of calcination-induced oxidation on the photocatalytic H2 production performance of cubic Cu2O/CuO composite photocatalysts. Catalysts 2024; 14(12), 926.
[14] FC Akkari, M Kanzari and B Rezig. Preparation and characterization of obliquely deposited copper oxide thin films. The European Physical Journal-Applied Physics 2007; 40(1), 49-54.
[15] H Jabraoui, MD Rouhani, C Rossi and A Estève. First-principles investigation of CuO decomposition and its transformation into Cu2O. Physical Review Materials 2022; 6(9), 096001.
[16] HM Rietveld. Line profiles of neutron powder-diffraction peaks for structure refinement. Acta Crystallographica 1967. https://doi.org/10.1107/S0365110X67000234
[17] L Lutterotti. Maud: A rietveld analysis program designed for the internet and experiment integration. Acta Crystallographica Section A - Acta Crystallogr A 2000; 56, s54.
[18] D Chen, Z Ye, J Xu, S Ma and J Zhang. In situ reconstructed prism-like CuO on copper foam assisted by fumaric acid for an enhanced electrochemical nitrate reduction reaction. Dalton Transactions 2025; 54(8), 3500-3508.
[19] M Rafei, V Miranda la Hera, H Reza-Barzegar, E Gracia-Espino and T Wågberg. Study on the electronic and structural properties of oxidized copper films. AIP Advances 2022; 12, 10.
[20] BH Toby. R factors in rietveld analysis: How good is good enough. Powder Diffraction 2006; 21(1), 67-70.
[21] P Katekaew, A Prasatkhetragarn, R Sirirak, C Boonruang and A Klinbumrung. Role of the thermal regime in the defect formation of zinc oxide nanostructures prepared by the thermal decomposition process. Zeitschrift für Physikalische Chemie 2023; 237(8), 1077-1104.
[22] Y Keereeta, W Panthuwat, T Suriwong, R Sirirak, A Prasatkhetragarn, C Boonruang and A Klinbumrung. Phase transition and optical characteristics of Mg doped CuAlO2 synthesized by facile thermal decomposition process. Optik 2022; 268, 169840.
[23] S Krobthong, K Umma, T Rungsawang, T Mirian, S Wongrerkdee, S Nilphai, K Hongsith, C Raktham and P Pimpang. Synthesis and characterization of Cu2O and CuO nanoparticles in distilled water using electrochemical process. Digest Journal of Nanomaterials and Biostructures 2025; 20(1), 13-21.
[24] VHA Tran, T Duc, H Tran, A Duc, A Alshehri, VT Tran, T Nguyen, C Pham and VH Nguyen. Atmospheric pressure spatial atomic layer deposition of p-type CuO thin films from copper (II) acetylacetonate and ozone for UV detection. Dalton Transactions 2025; 54(8), 3266-3276.
[25] KS Finnie, DJ Cassidy, JR Bartlett and JL Woolfrey. IR spectroscopy of surface water and hydroxyl species on nanocrystalline TiO2 films. Langmuir 2001; 17(3), 816-820.
[26] X Zhao, P Wang, Z Yan and N Ren. Room temperature photoluminescence properties of CuO nanowire arrays. Optical Materials 2015; 42, 544-547.
[27] A Agarwal, S Ramachandran, S Kumar, S Swaminathan and R Raghavendra. A comparative study on Centella Asiatica‐mediated green synthesis of silver and copper oxide nanoparticles: Implications for wound healing. Particle & Particle Systems Characterization 2025; 4(6), 2400215.
[28] J Lu, Y Ren, LWang, L Zou, J Liang, X Liang, Y Gao, F Li, J Gao, A Terfort and J Liu. Adjusting the ratio of oxidation states in a CuO@Cu2O for the optimization of electrocatalytic CO2 conversion to ethylene. ChemSusChem 2025; 18(10), e202401963.
[29] LE Román, C Uribe, F Paraguay-Delgado, JG Sutjianto, AM Navarrete-López, ED Gomez, JL Solís and MM Gómez. Physical and surface chemical analysis of high-quality antimicrobial cotton fabrics functionalized with CuOx grown in situ from different copper salts: Experimental and theoretical approach. ACS Applied Materials & Interfaces 2024; 17(1), 1869-1882.
[30] S Dhungana, A Gauli, L Tiwari, D Khadka, S K Gautam, M Pokhrel, J Baral and B Poudel. Synthesis and characterization of copper oxide nanoparticles isolated from Acmella oleracea and study of antimicrobial and phytochemical properties. Amrit Research Journal 2025; 5(1), 18-29.
[31] G Burns. Solid state physics. Academic Press, California, United States, 1990, p. 447-527.
[32] Y Keereeta, R Sirirak and A Klinbumrung. Revealing effect of cobalt dopant on crystallography and optical characteristics of nanostructured cupric oxide. Micro and Nanostructures 2024; 186, 207757.
[33] N Abraham, C Unni and D Philip. Studies on bandgap tuning of visible light active heterojunction CuO/ZnO nanocomposites for DSSC application. Journal of Materials Science: Materials in Electronics 2018; 29(24), 21002-21013.
[34] M Mattsson, M Kham, J Parker, D Meeth, J Wager, A Flewitt and M Graham. Defect density of states of tin oxide and copper oxide p-type thin-film transistors. Advanced Electronic Materials 2024; 11(11), 2400929.
[35] S Boonphan, S Prachakiew, C Nontakoat, Y Keereeta, C Boonruang and A Klinbumrung. Crystallographic defects induced F-Center and optical enhancements in CeO2-TiO2 nanocomposites. South African Journal of Chemical Engineering 2025; 52, 68-79.
[36] AS Hassanien and AA Akl. Effect of Se addition on optical and electrical properties of chalcogenide CdSSe thin films. Superlattices and Microstructures 2016; 89, 153-169.
[37] M Ditta, MA Farrukh, S Ali and N Younas. X-ray peak profiling, optical parameters and catalytic properties of pure and CdS doped ZnO-NiO nanocomposites. Russian Journal of Applied Chemistry 2017; 90(1), 151-159.
[38] KN Manjunatha and S Paul. Investigation of optical properties of nickel oxide thin films deposited on different substrates. Applied Surface Science 2015; 352, 10-15.
[39] BM Ouarda, A Ouahab, R saâd, S Hettal, K Aicha, M Sayad, H Attouche and N Gherraf. Optoelectronic and dielectric properties of tenorite CuO thin films sprayed at various molar concentrations. Periodica Polytechnica Chemical Engineering 2024; 68(1), 93-105.
[40] I Stambouli, M Zerouali, R Daïra, D Bouras, GA El-Hiti, S Grigorian and M Fellah. Enhancement of tin-doping on the structural, electrical, and optical properties of copper oxide thin films for optoelectronic applications. Ceramics International 2025; 51(13), 17689-17703.
[41] A Gloystein, M Soltanmohammadi and N Nilius. Light emission from single oxygen vacancies in Cu2O films probed with scanning tunneling microscopy. The Journal of Physical Chemistry Letters 2023; 14(17), 3980-3985.
[42] GK Inwati, Y Rao and M Singh. Thermodynamically induced in situ and tunable Cu plasmonic behaviour. Scientific Reports 2018; 8(1), 3006.
[43] L Trinkler, D Dai, L Chang, M Chou, TY Wu, J Gabrusenoks, D Nilova, R Ruska, B Berzina and R Nedzinskas. Luminescence properties of epitaxial Cu2O thin films electrodeposited on metallic substrates and Cu2O single crystals. Materials 2023; 16(12), 4349.
[44] M Zervos, I Paschos, P Savvidis, N Florini, K Koutsokostas, P Komninou, NN Lathiotakis, PM Levendis and S Marinakis. High crystal quality and purity Cu2O by consecutive in situ annealing and thermal oxidation of Cu under H2 and O2 at elevated temperatures. CrystEngComm 2025; 27(13), 1977-1985.