Trends
Sci.
2026; 23(5): 11776
Synthesis and Characterization of Polyaniline Thin Films by Electrodeposition as Functional Materials for Eucalyptus Oil Aroma Sensors from Various Commercial Brands
Alifatul Azkia Bakhrin and Nugrahani Primary Putri*
Department of Physics, Faculty of Mathematics and Natural Science, Universitas Negeri Surabaya,
Surabaya 60231, Indonesia
(*Corresponding author’s e-mail: [email protected])
Received: 4 September 2025, Revised: 6 October 2025, Accepted: 13 October 2025, Published: 5 January 2026
Abstract
Eucalyptus oil has varying qualities due to differences in chemical compound content, requiring a simple and sensitive analysis method to distinguish its aroma. Polyaniline (PANI) is a stable conductive polymer that is easy to synthesize and has electrical properties that can be controlled through doping, making it a potential sensor material. In this study, a thin layer of PANI was synthesized on an ITO substrate through electrolysis using cyclic voltammetry. Its conductivity was then tested using a four-point probe method based on voltage changes and further characterized using Fourier Transform Infrared Spectroscopy (FTIR) and Scanning Electron Microscopy (SEM). The results showed a nanofiber morphology that supports high conductivity and contributes to sensor sensitivity. Testing showed significant voltage changes in response to variations in eucalyptus oil volume, with the highest sensitivity of 6% at a volume of 1.5 mL. In addition, this sensor was able to distinguish between three brands of eucalyptus oil based on differences in voltage response, demonstrating its selectivity. This study proves the potential of PANI as a flexible and effective sensor for analyzing the quality of eucalyptus oil.
Keywords: Eucalyptus Oil, Polyaniline, Sensitivity
Introduction
Polyaniline (PANI) is a conductive polymer widely known for its stability in air, ease of synthesis, and conductivity that can be adjusted through doping processes [1]. The structure of PANI consists of benzene like (reduced) and quinone like (oxidized) units that can reversibly transition under redox conditions, resulting in significant changes in electronic properties [2]. This makes PANI a promising material for application as a functional sensor, as it can respond to changes in the chemical environment through changes in electrical resistance [3]. PANI applications have expanded into various fields such as supercapacitors, batteries, gas sensors and aroma sensors, including electronic nose systems for detecting commercial and natural volatiles [1]. Previous research has shown that PANI is highly responsive to complex aromas in various aroma sensor applications for example in PANI/HCl film based electronic nose systems capable of identifying fruit
aromas such as grapes, apples, and strawberries with high sensitivity and fast response times [4]. Additionally, the molecularly imprinted PANI chemi resistive sensor demonstrates the detection of strawberry aroma furaneol with fast response and high sensitivity [5].
Eucalyptus oil (Melaleuca cajuputi) is a complex essential oil predominantly containing volatile compounds such as 1,8-cineole, α-terpineol and other terpenes that have the potential to reduce the resistance of polyaniline sensors through conductive electrochemical interactions [6]. The main components, such as 1,8-cineole, have polarity and molecular size that facilitate adsorption on the PANI film surface, which clearly affects the sensor's resistive signal [7]. Along with the complexity of the composition, commercial eucalyptus oil is currently available in various brands that can show variations in active compound content of up to ± 0% depending on the raw material source and extraction method [8]. These variations make the detection and discrimination of aromas between brands an interesting sensory challenge because differences in VOC concentrations can produce different PANI response patterns [9]. To improve sensitivity and selectivity to these compositional variations, various methods have been used in PANI synthesis, including chemical oxidative polymerization, interfacial polymerization, nano structuring (electrospinning, seeding) and electrosynthesis (electro polymerization) [10]. Each method produces different PANI morphologies such as nanofibers, thin films, or composites that directly affect the active surface area and sensor characteristics [10]. Among these methods, electrodeposition stands out for its ability to precisely control film thickness, doping degree and nanostructure morphology [11]. Electrolytically deposited PANI was chosen because this method is capable of producing uniform layers with strong adhesion to the substrate and controllable thickness. These characteristics support the stability and reproducibility of the sensor response. A number of studies have also proven the potential of PANI and its composites in detecting complex aromas thanks to their high sensitivity, fast response and good aroma discrimination capabilities.
Previous studies have demonstrated the performance of PANI as a sensor material for detecting aromas and essential oils. PANI sensors have been proven capable of distinguishing variations in VOC composition, even from a single type of essential oil, such as in the detection of clove oil with a limit of detection below 1 ppb and a response time of approximately 13 seconds [7]. Sierra-Padilla et al., [12] reported a PANI based sensor system capable of precisely recognizing multicomponent aroma patterns [12]. Galvagni et al., [13] found that a TSA doped PANI layer could detect the aroma of orange oil in chocolate with a sensitivity of 3 mV/ppm in the range of 0 - 10 ppm [13]. Graboski et al., developed a PANI nanocomposite for d-limonene detection with high sensitivity, fast response time (<60 s) and stable recovery [14]. Therefore, this study aims to synthesize PANI thin films through the electrodeposition method and evaluate their performance in distinguishing various commercial eucalyptus oil samples using a four-point probe sensor measurement. Additionally, this study highlights the unique potential of electrodeposited PANI thin film sensors in detecting variations in eucalyptus oil aroma across different sample volumes, while introducing a novel approach to distinguish aroma characteristics between brands based on differences in active compound composition. This approach contributes to the development of polyaniline-based aroma sensors for the quality analysis and authentication of commercial essential oils.
Materials and methods
The materials used in the synthesis process include an ITO layer with a resistance of 46.19 kΩ, which functions as the working electrode. The aniline (C₆H₅NH₂) used is from Sigma-Aldrich with a purity (assay) of 99%. The acid solution used is 0.5 M HCl with a concentration of more than 37% from the CIMS brand, which acts as the electrolyte medium in the PANI electrodeposition process. The polyaniline electrolyte solution is prepared by mixing 1.25 mL of HCl into 28.75 mL of distilled water with a pH of 8.6 to create optimal acidic conditions for aniline polymerization. Next, 0.69 mL of aniline was added to the HCl solution and stirred until homogeneous [15]. The ITO substrate, which functions as the working electrode, was first cleaned with distilled water to remove surface contaminants and improve electrode electrolyte contact quality [16]. The PANI film synthesis process was carried out via electrodeposition using Cyclic Voltammetry (CV) technique with the Metrohm 797 VA Computrace instrument, as shown in Figure 1, with a three-electrode configuration consisting of an ITO working electrode, a platinum auxiliary electrode and an Ag/AgCl reference electrode [17]. CV measurements were performed over a potential range of –0.04 V to +0.7 V at a scan rate of 100 mV/s for 10 cycles, enabling the controlled formation of emeraldine salt PANI films on the ITO surface.
After synthesizing the PANI thin film on the ITO substrate through electropolymerization, voltage changes were characterized using the four points probe (FPP) method, which provides more accurate voltage measurements by separating the current path and voltage measurement [18]. The test was conducted by connecting the PANI coated ITO to the FPP device and placing it inside the test chamber as shown in Figure 1. for the sensor measurement phase. This process was carried out at room temperature with a fan to circulate eucalyptus oil aroma toward the PANI layer surface. The eucalyptus oil injected into the room immediately evaporates and mixes with the air. Before exposure to the aroma, the PANI layer was applied with an input voltage (V in) of 7 V and a current (I in) of 0.61 A. Once the eucalyptus oil reached the layer, an interaction occurred that triggered changes in the output voltage (V out) until it reached a constant state, indicating saturation. At this stage, gas out is flowed into the chamber for 27 s, causing Vout to return to its initial value. This process is repeated three times, and the Vout data is plotted against time. The graph analysis in Figure 1 shows that when gas in, the initial voltage V₀ decreases to V₁. This phase is the sensor response time. The value V₁ remains constant for 30 s, then when gas out is introduced, the voltage increases back to V₀, which is called the recovery time.
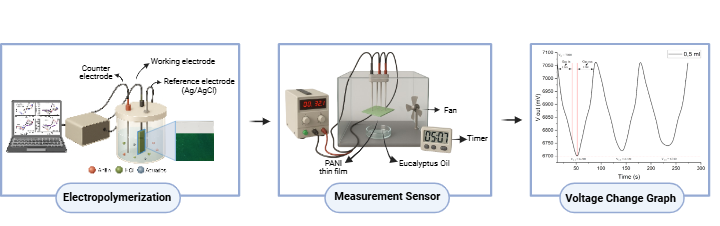
Figure 1 Production of PANI coating to measurement of sensitivity to eucalyptus oil aroma.
Results and discussion
Electrochemical properties
Cyclic voltammetry (CV) is used to observe changes in the oxidation reduction phase, where there are three phase changes, leucoemaraldine, emeraldine, which is a conductive condition and pernigraniline [19]. During the electrodeposition process, there is a shift from the positive peak (oxidation) to the negative peak (reduction). This shift indicates an increase in the intensity of the oxidation and reduction peaks. This indicates that the PANI coating is forming on the ITO electrode surface. The coating is conductive and chemically active [19]. After the coating process is complete, a green layer forms and covers the ITO surface [20].
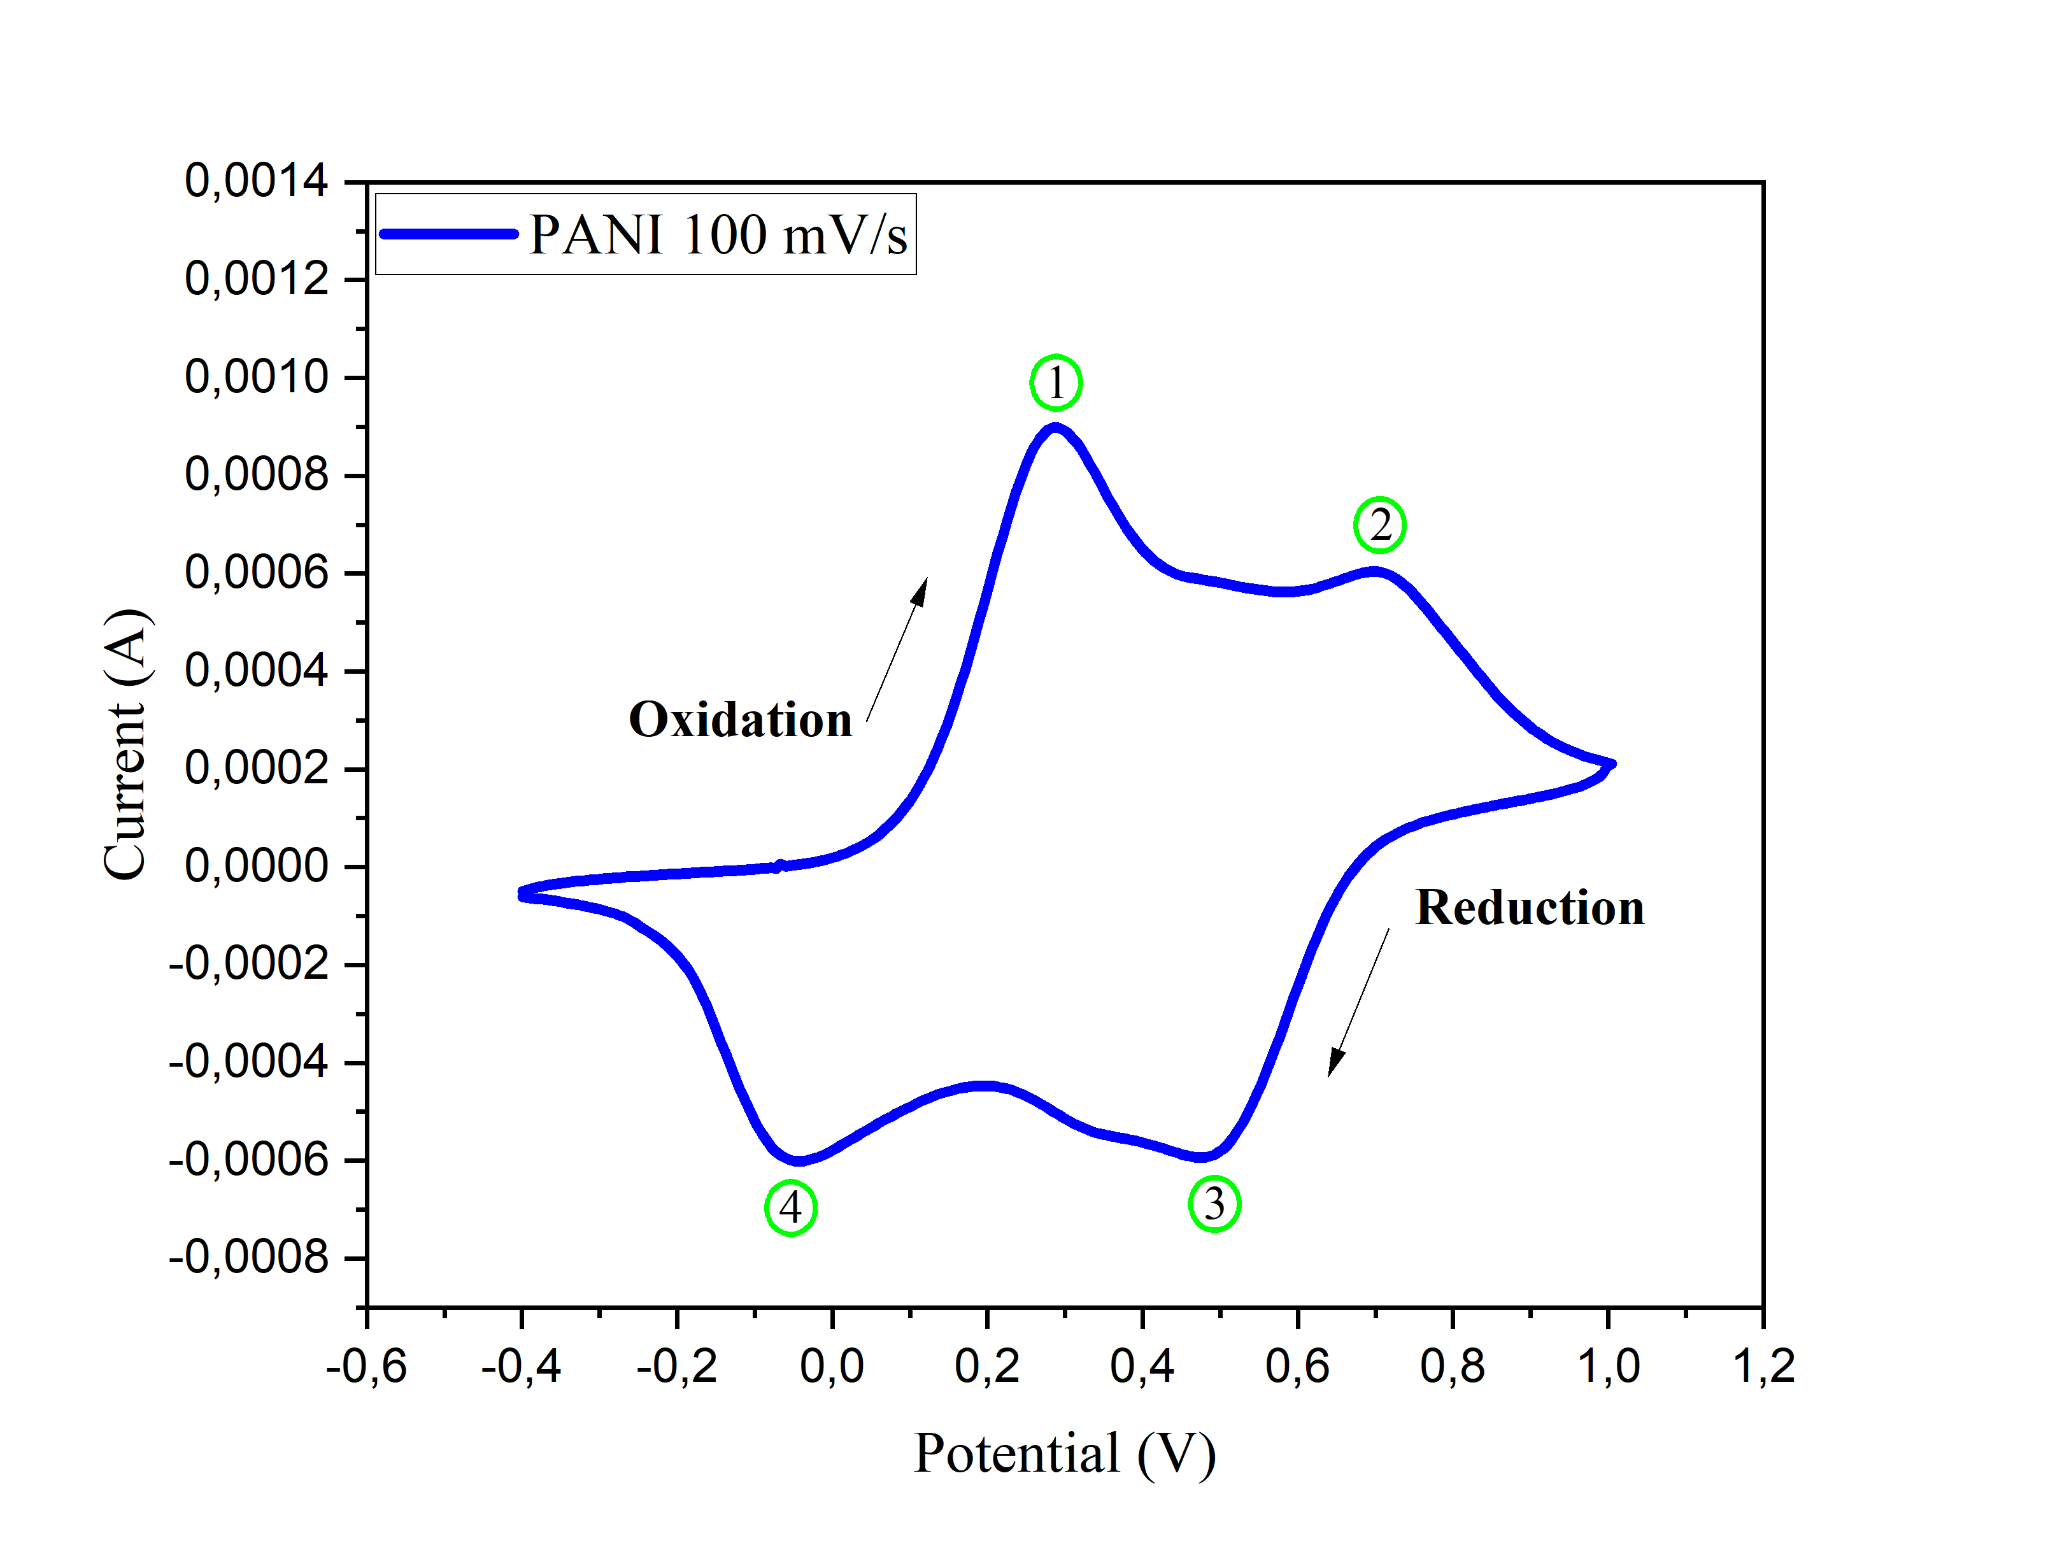
Figure 2 Cyclic voltammogram curve of PANI on ITO substrate with a scan rate of 100 mV/s.
Based on Figure 2, the cyclic voltammetry (CV) curve shows two oxidation peaks at +0.2 V and + 0.7V, as well as two reduction peaks at +0.4 V and –0.04 V. The first oxidation peak at +0.2 V indicates the transition from leucoemeraldine (LB) to emeraldine salt (ES), which occurs due to ion insertion and protonation of the polyaniline chain. The second oxidation peak at +0.7 V reflects the transformation from emeraldine salt (ES) to pernigraniline (PB), which is the fully oxidized phase of PANI [21]. During the reduction process, the peak at +0.4 V indicates the regression of pernigraniline (PB) back to emeraldine salt (ES) through electron acceptance and deprotonation of the molecule [22]. Meanwhile, the reduction peak at –0.04 V indicates the further reduction of emeraldine salt (ES) to leucoemeraldine (LB), signifying a fully reversible redox cycle [21].
Analysis of PANI functional groups
The FTIR characterization spectrum shows the relationship between wave numbers and transmittance percentages, where each peak appearing at a specific wave number represents the presence of functional groups or types of chemical bonds in the tested material. FTIR spectroscopy is specifically used to identify functional groups and chemical bond structures in polymer materials such as polyaniline (PANI) [2], showing characteristic peaks that reflect bonds such as C=C (benzenoid/quinoid), C–N and C–H. From the position and intensity of these peaks, the oxidation or reduction phase of PANI and its doping level can be determined.
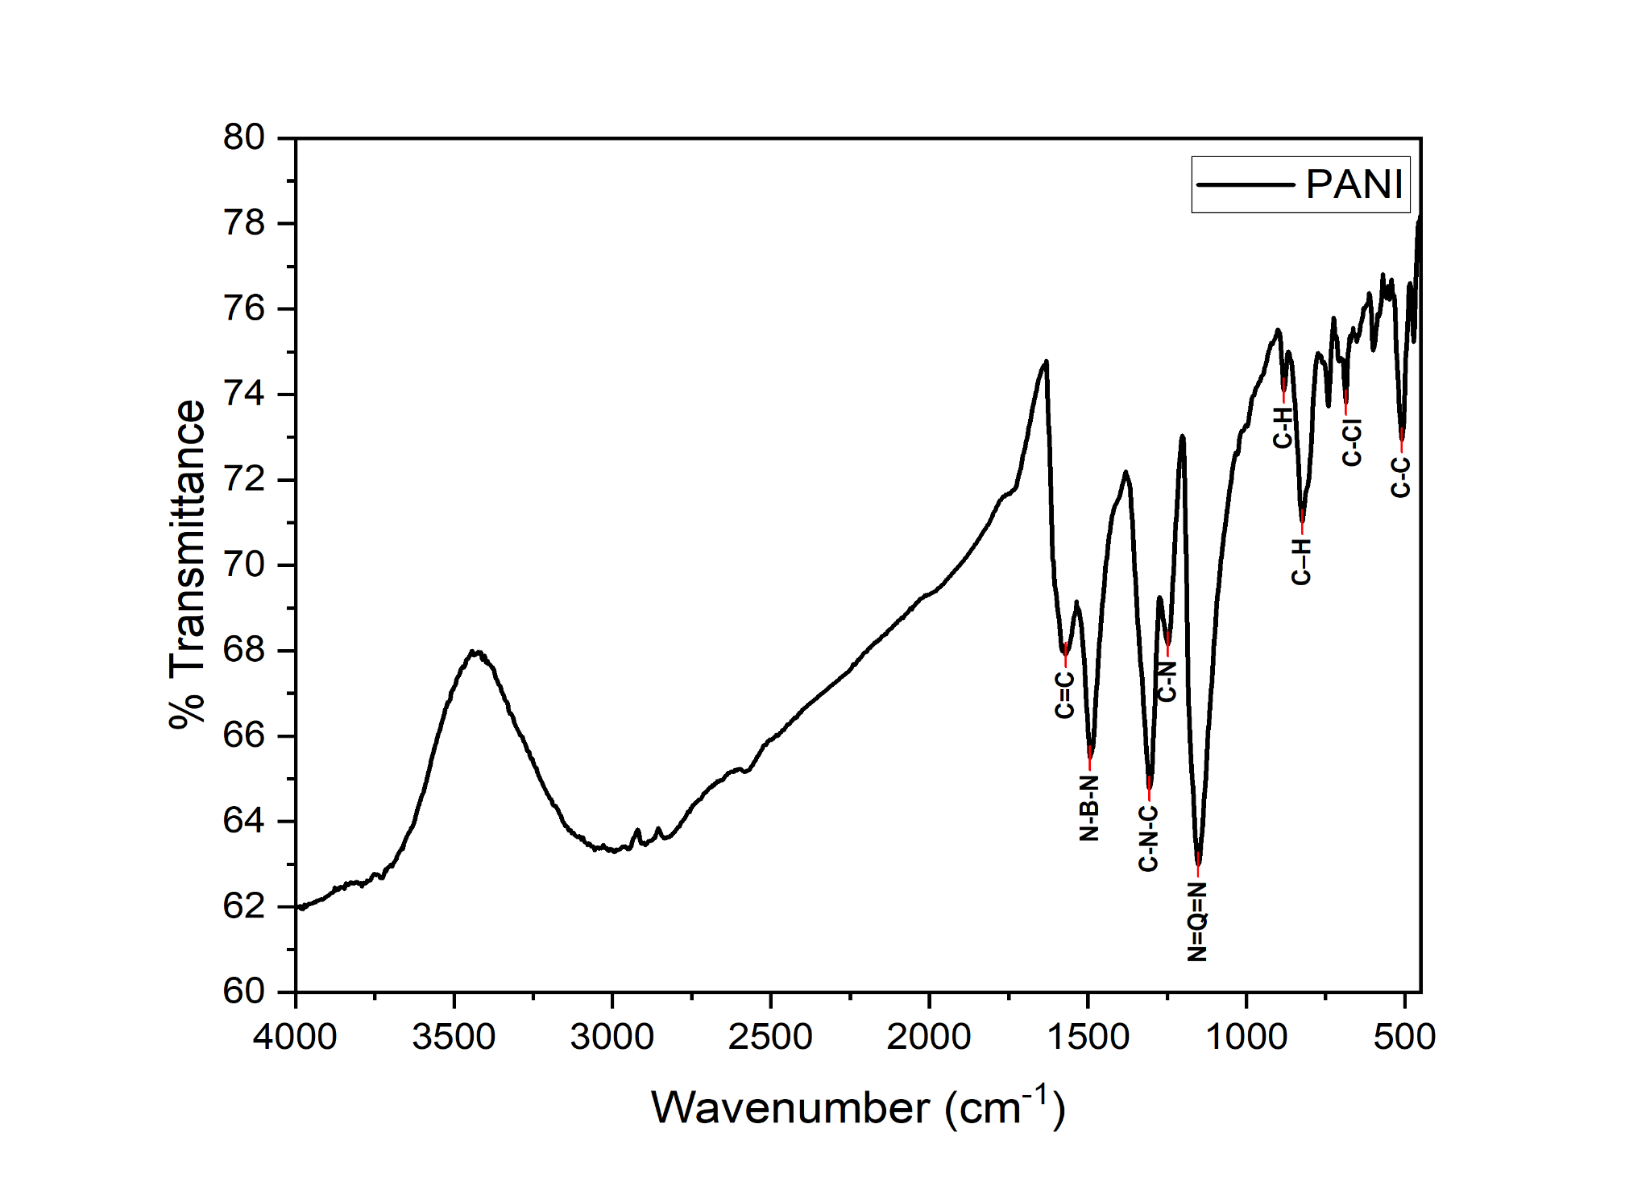
Figure 3 FTIR Spectrum of PANI.
The FTIR spectrum in Figure 3 shows the strongest absorption peaks (lowest transmittance) at wavenumbers 1,151, 1,305 and 1,429 cm⁻¹, indicating that these four wavenumbers play a dominant role in the chemical structure of PANI. The wavenumber 1,151 cm⁻¹ is associated with the N=Q=N stretching of the quinoid unit, reflecting the emeraldine salt (ES) phase with high protonation and good conductivity. The wavenumbers 1,305 and 1,429 cm⁻¹ indicate C–N–C and benzenoid stretching, suggesting the involvement of aromatic structures and secondary amines in partially protonated conditions. Additional supporting spectra are shown in Table 1, such as the wavenumbers 1,492.9 cm⁻¹ (N–B–N), 1,247.94 cm⁻¹ (C–N) and 881.47 and 823.60 cm⁻¹ (C–H out-of-plane), which are characteristic of conjugated aromatic structures. The 686.66 and 509.21 cm⁻¹ wavenumbers indicate the presence of halogen substitution and aromatic C–C strain. Overall, this spectrum indicates that PANI is in the ES phase with a benzene quinone equilibrium.
Morphology and porosity observations
Scanning Electron Microscopy (SEM) was used to observe the surface morphology and microstructure of a material, including particle or fiber size, shape and distribution at the micron to nanometer scale. Observations were conducted at 20.000x magnification and processed using ImageJ software to obtain the average particle diameter. The processing results showed an average diameter of 105.38 nm, indicating that the material structure was successfully synthesized within the nanometer range, thereby qualifying it as a nanoparticle or nanofiber. This size indicates that the synthesis or particle formation process was efficient and suitable for sensory or functional applications requiring a large surface area and responsiveness to external stimuli.
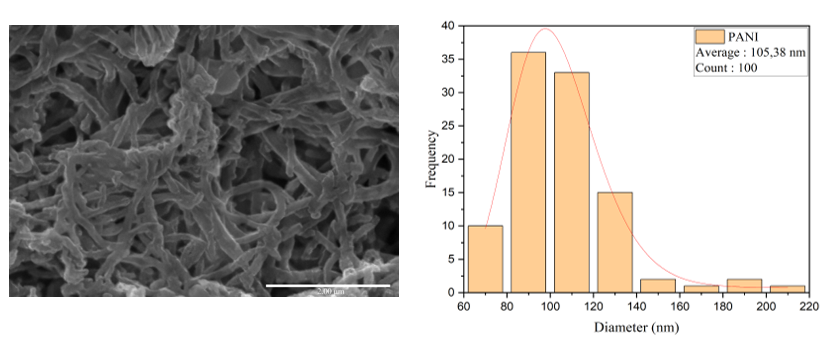
Figure 4 Results of morphological observations using SEM magnification of 20.000x and diameter measurements using Image-J software.
Figure 5 Pore Distribution of PANI thin film.
The porosity calculation results show a value of 66.9%, indicating that more than half of the total volume of the material consists of voids or empty spaces. This high porosity value indicates that the material has a highly open and porous structure, which is highly advantageous for applications such as sensors, filtration, or molecular absorption. High porosity can increase the active surface area, accelerate the diffusion of target molecules and enhance the sensor’s sensitivity to environmental changes such as humidity or gas. The pore distribution shown in Figure 5 is interconnected, indicating that the formation of layers or fibers occurred optimally, with fiber bundles that are not too densely packed but still form a continuous network capable of maintaining the material’s mechanical stability.
Sensing analysis
Based on the molecular interaction mechanism shown in Figure 6, the performance of the PANI sensor against eucalyptus oil aroma is influenced by three types of bonds, namely hydrogen bonds, van der Waals forces and π–π interactions. Hydrogen bonds are the most dominant interaction, given the presence of amino groups (-NH-) in PANI, which can act as both hydrogen bond donors and acceptors, as well as oxygen atoms in eucalyptus molecules, which act as electron acceptors. The hydrogen bonds formed enhance the adsorption strength of eucalyptus oil aroma molecules on the PANI surface, resulting in greater changes in the sensor’s electrical properties. This directly impacts sensitivity, as more molecules are captured and contribute to the output voltage.
The dominance of hydrogen bonds also affects sensor parameters such as response time and recovery time. Sufficiently strong bonds allow the molecule capture process to occur relatively quickly, enabling t response to remain short. However, due to their higher strength compared to van der Waals forces, the molecule release process (desorption) requires slightly more time. Despite this, in optimal configurations such as sample A with a volume of 1.5 mL, the recovery time remains within an efficient operational range. The combination of high sensitivity, short t response and still fast recovery time makes this configuration ideal for repeated aroma sensing applications with good accuracy and stability.
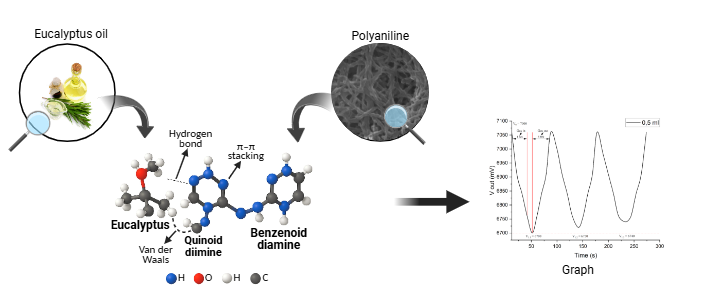
Figure 6 Interaction of PANI with Eucalyptus Oil.
The FTIR spectrum of eucalyptus oil shows the presence of several main functional groups that reflect the characteristic components of essential oils, particularly terpenoid derivatives. The wavenumber 2,922 cm⁻¹ indicates strong absorption from the asymmetric stretching of the methyl (CH₃) and methylene (CH₂) groups, which are common characteristics of aliphatic hydrocarbon compounds in essential oils such as α-pinene, limonene and 1,8-cineole. Furthermore, the wavenumbers 1,465.90 and 1,375.24 cm⁻¹ indicate the presence of scissoring vibrations of the CH₂ and CH₃ groups, reinforcing the presence of saturated carbon chains in the structure of the compounds that make up eucalyptus oil. The wavenumber 1,215.15 cm⁻¹ is an important peak associated with the stretching of the C–O group of ethers or oxides, strongly indicating the presence of 1,8-cineole (eucalyptus), the main compound in eucalyptus oil responsible for its characteristic aroma and biological activity.
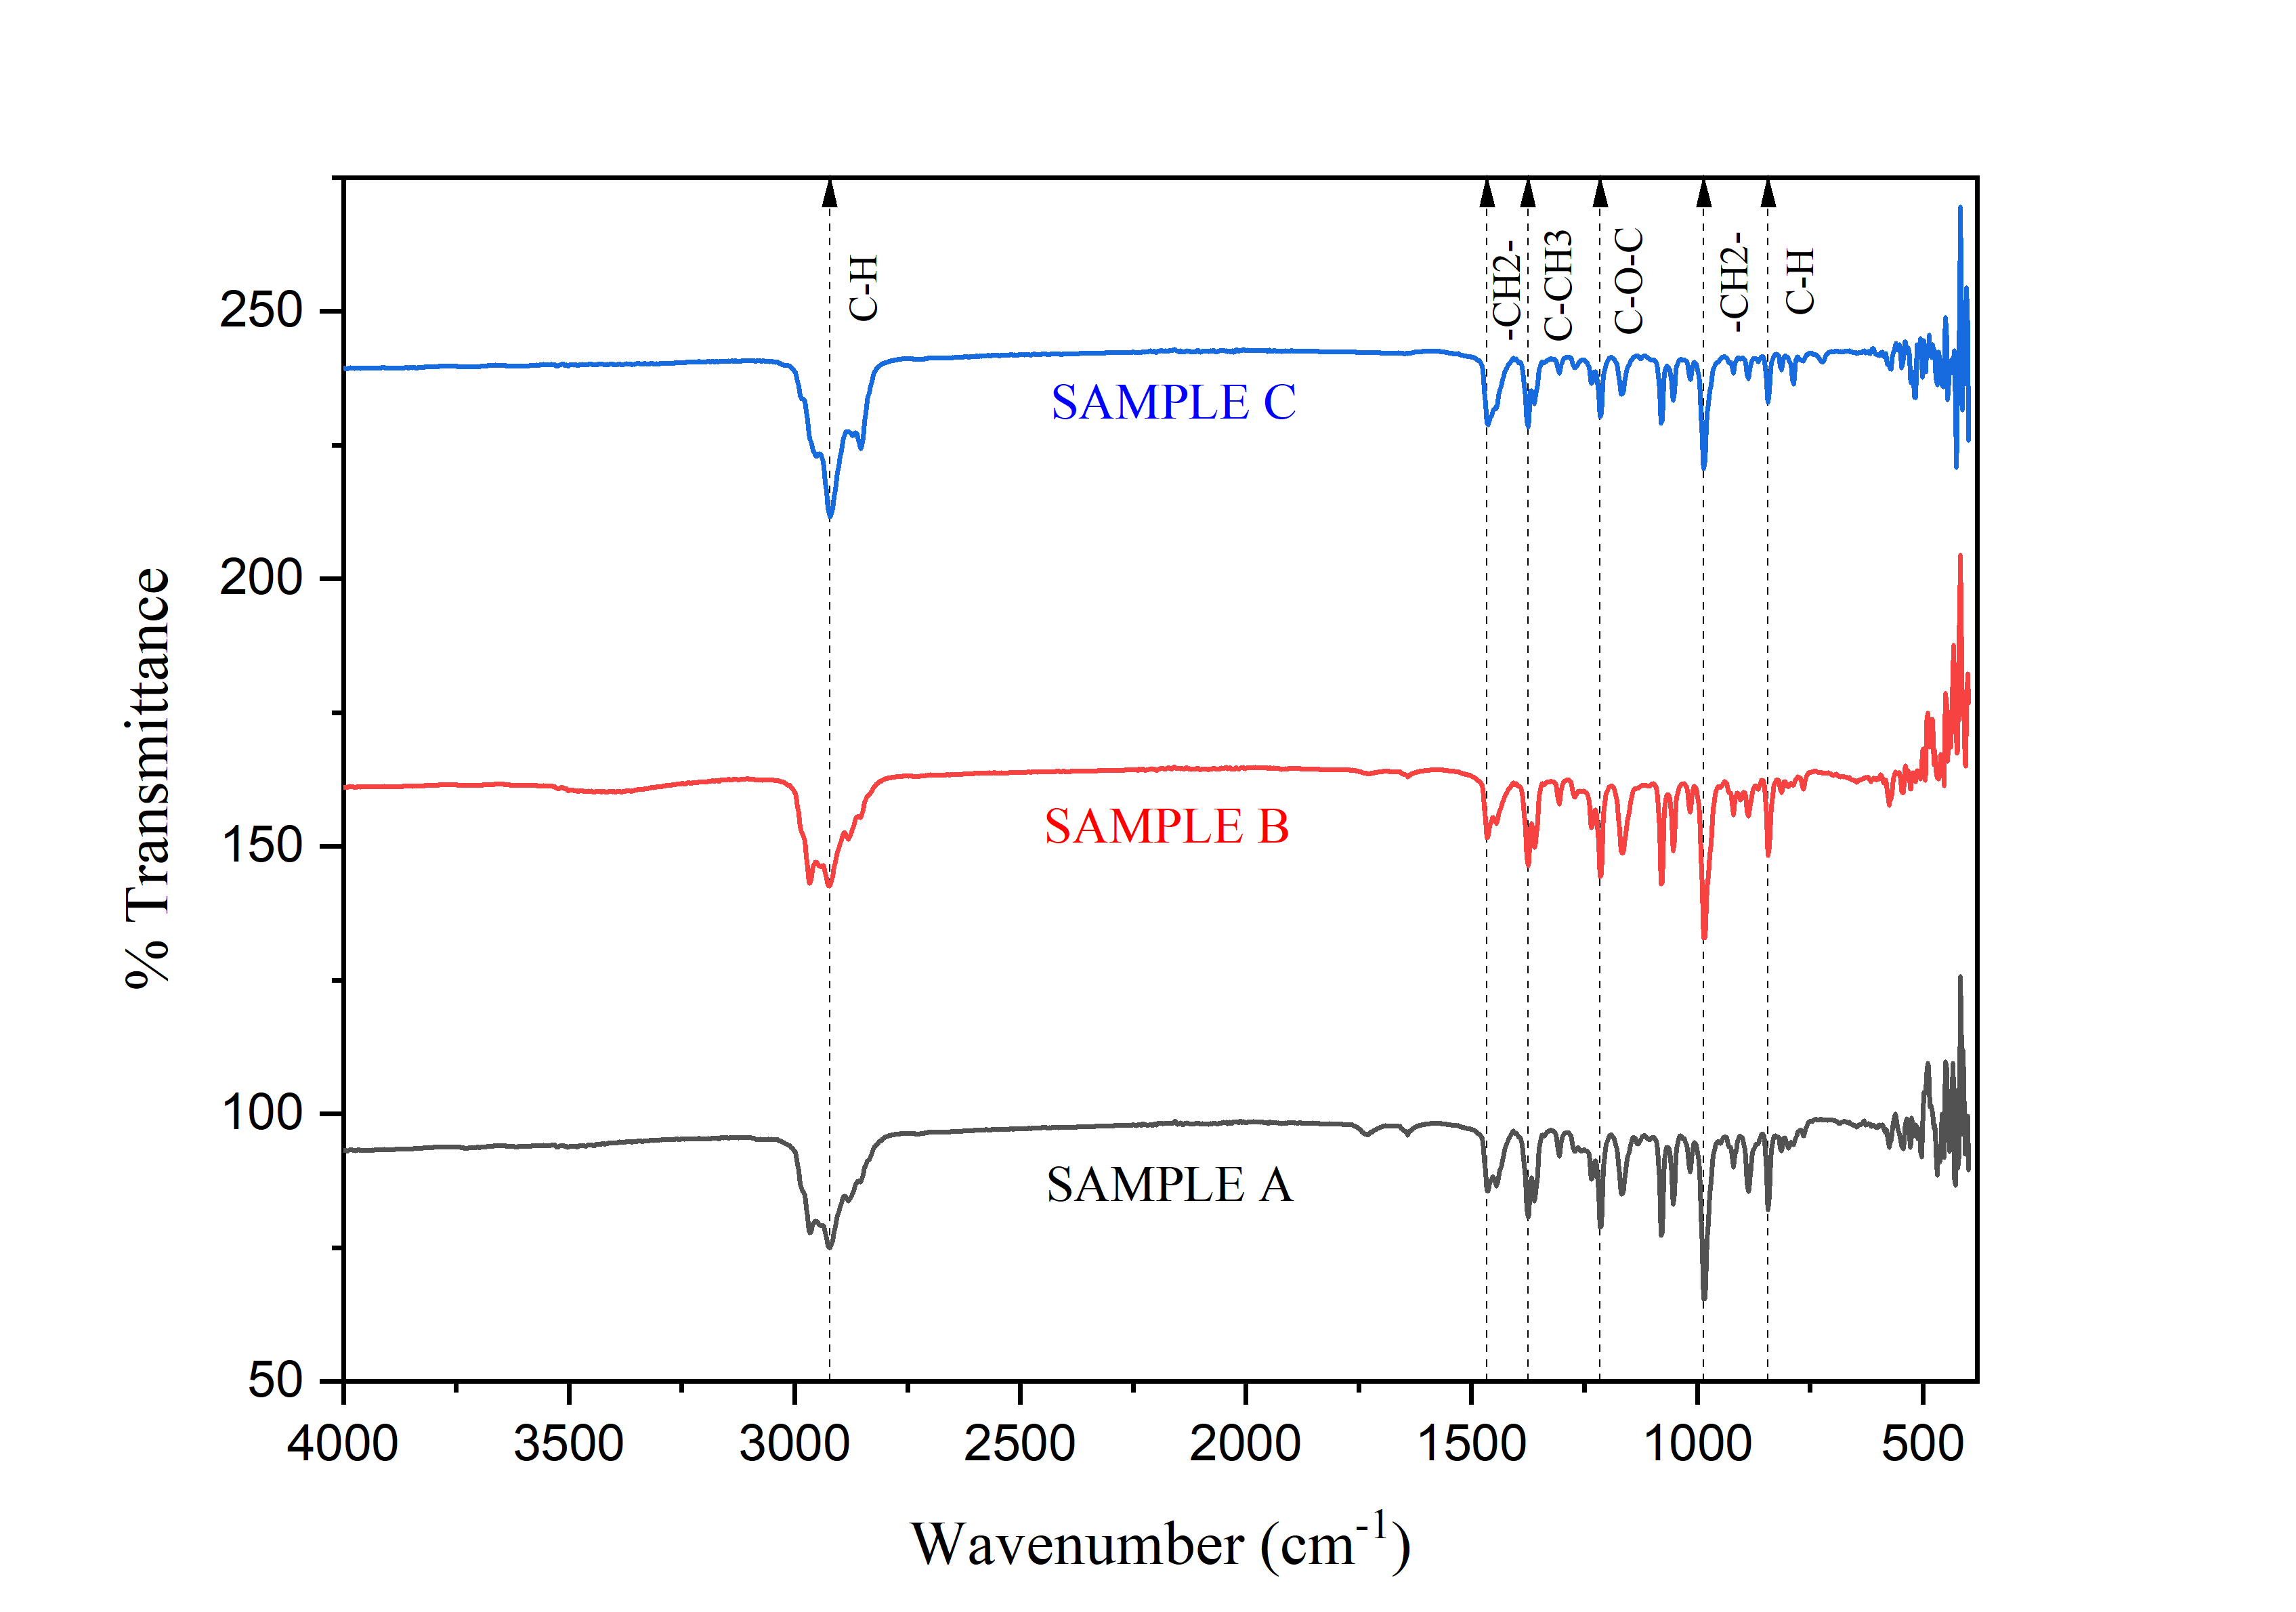
Figure 7 FTIR Spectrum of Eucalyptus Oil in Samples (a) - (c).
The wavenumber 985.62 cm⁻¹ indicates the presence of CH₂ bonds from substituted methylene structures commonly found in monoterpenes such as sabinene and myrcene. Meanwhile, 842.89 cm⁻¹ indicates out of plane C–H bending vibrations, which are commonly found in substituted aromatic structures or alkenes present in volatile essential oil compounds. Overall, the combination of these wavenumbers indicates that the eucalyptus oil samples a, b and c contain main components of monoterpenes and terpene oxides, primarily 1,8-cineole, with the possibility of α-terpineol, limonene, or sabinene as minor compounds. These components not only provide aromatic effects but also play a role in antimicrobial activity, anti-inflammatory properties, and volatile characteristics, which are important in pharmaceutical and aromatherapy applications.
Table 1 Identify the functional groups of eucalyptus oil.
Number of peak |
Datasheet (Range) |
Reference |
Wavenumber (cm−1) |
Bond type |
||
Sample A |
Sample B |
Sample C |
||||
6 |
2,000 - 3,000 |
2,922.15 [24] |
2,922.15 |
2,922.15 |
2,922.15 |
C-H |
5 |
1,200 - 1,500 |
1,465.90 [24] |
1,465.90 |
1,465.90 |
1,465.90 |
-CH2- |
4 |
1,200 - 1,500 |
1,375.24 [24] |
1,375.24 |
1,375.24 |
1,375.24 |
C-CH3 |
3 |
1,200 - 1,500 |
1,214 [23] |
1,215.15 |
1,215.15 |
1,215.15 |
C-O-C |
2 |
1,000 - 650 |
985 [23] |
985.62 |
985.62 |
985.62 |
-CH2- |
1 |
1,000 - 650 |
800 [15] |
842.89 |
842.89 |
842.89 |
C-H out-of-plane bending vibrations in benzenoid units |
Based
on Figure
8,
the results of eucalyptus oil sensing at a volume of 1.5 mL for
Samples A - C with three repetitions show that all samples exhibit a
consistent periodic response pattern to the exposure and recovery
cycle. After the eucalyptus oil was injected, the output voltage ( )
decreased from the initial voltage value (
)
decreased from the initial voltage value ( )
to the saturation point (
)
to the saturation point ( ),
which is referred to as the response time. The response times for
Samples A - C in Cycle 1 were 52, 56 and 53 s, respectively. During
the recovery phase, the Vout value increases again from
toward
,
known as the recovery time. The recovery times for samples A - C in
cycle 1 were 48, 52 and 40 s, respectively. Among the three samples,
Sample A showed the largest voltage change amplitude (ΔV), followed
by Sample B, while Sample C had the smallest ΔV and higher
fluctuations.
),
which is referred to as the response time. The response times for
Samples A - C in Cycle 1 were 52, 56 and 53 s, respectively. During
the recovery phase, the Vout value increases again from
toward
,
known as the recovery time. The recovery times for samples A - C in
cycle 1 were 48, 52 and 40 s, respectively. Among the three samples,
Sample A showed the largest voltage change amplitude (ΔV), followed
by Sample B, while Sample C had the smallest ΔV and higher
fluctuations.
At a eucalyptus oil volume of 1.5 mL, sensitivity was superior compared to volume variations of 0.5 and 1.0 mL in all three samples. This indicates that increasing the test volume has the potential to increase the concentration of eucalyptus oil aroma interacting with the sensitive material surface, thereby maximizing sensor response. These characteristics indicate that the response time (t) for all three samples is relatively short, while the recovery time (t recovery) tends to be longer, suggesting that the adsorption process occurs more quickly than desorption. These results suggest that the PANI thin film is most optimal on sample A at a volume of 1.5 mL for eucalyptus oil sensing applications, as it exhibits high sensitivity, good signal stability, and consistent reversibility between cycles.
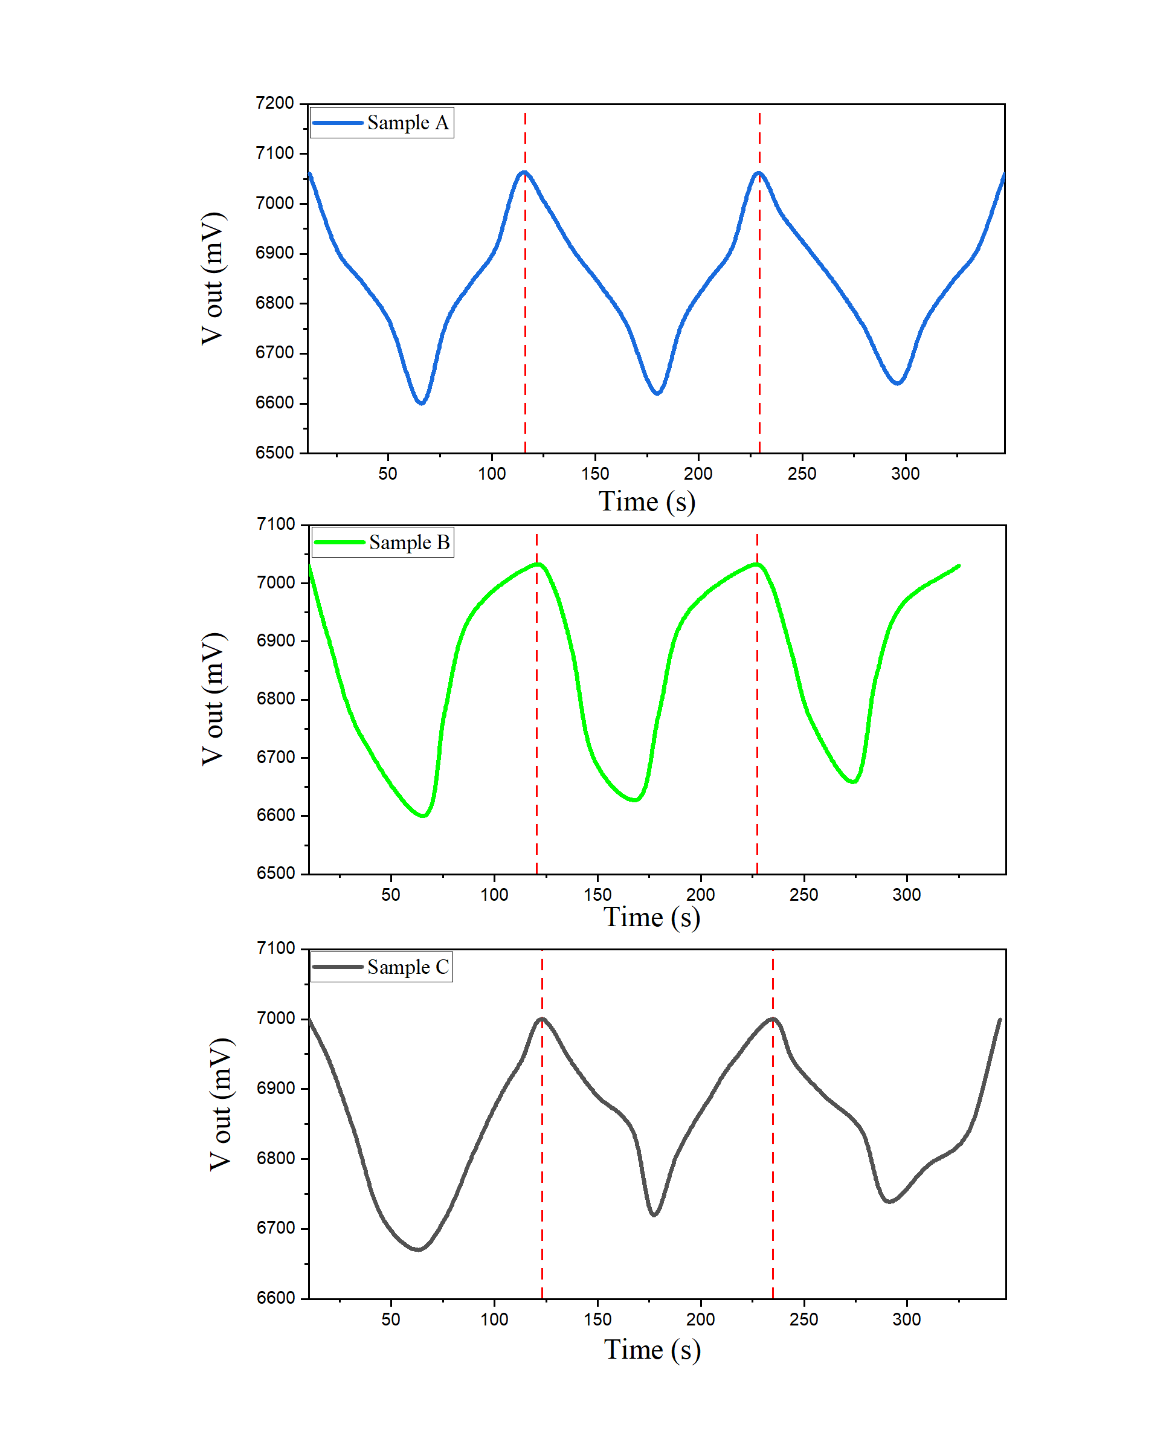
Figure 8 Detection of eucalyptus oil samples A - C at a volume of 1.5 mL with three repetitions.
In
the first cycle with a volume of 1.5 mL shown in Figure
9,
the PANI thin film sensor showed the clearest response to eucalyptus
oil aroma. When gas is first introduced into the chamber (gas in),
the output voltage (Vout) decreases from the initial condition (
)
to reach a minimum value (
).
This decrease indicates intense interaction between eucalyptus oil
aroma molecules and the PANI layer, resulting in a significant
change in conductivity. After the saturation phase is reached, clean
air is flowed back in (gas out) and Vout gradually increases toward
the initial value, indicating the sensor’s reversible nature.
Compared to other volume variations, the shift in Vout at 1.5 mL is
sharper, indicating that the larger the volume of vapor provided,
the higher the sensitivity achieved. Therefore, it can be concluded
that in the first cycle at 1.5 mL, the sensor achieves the best
performance in terms of both response and recovery
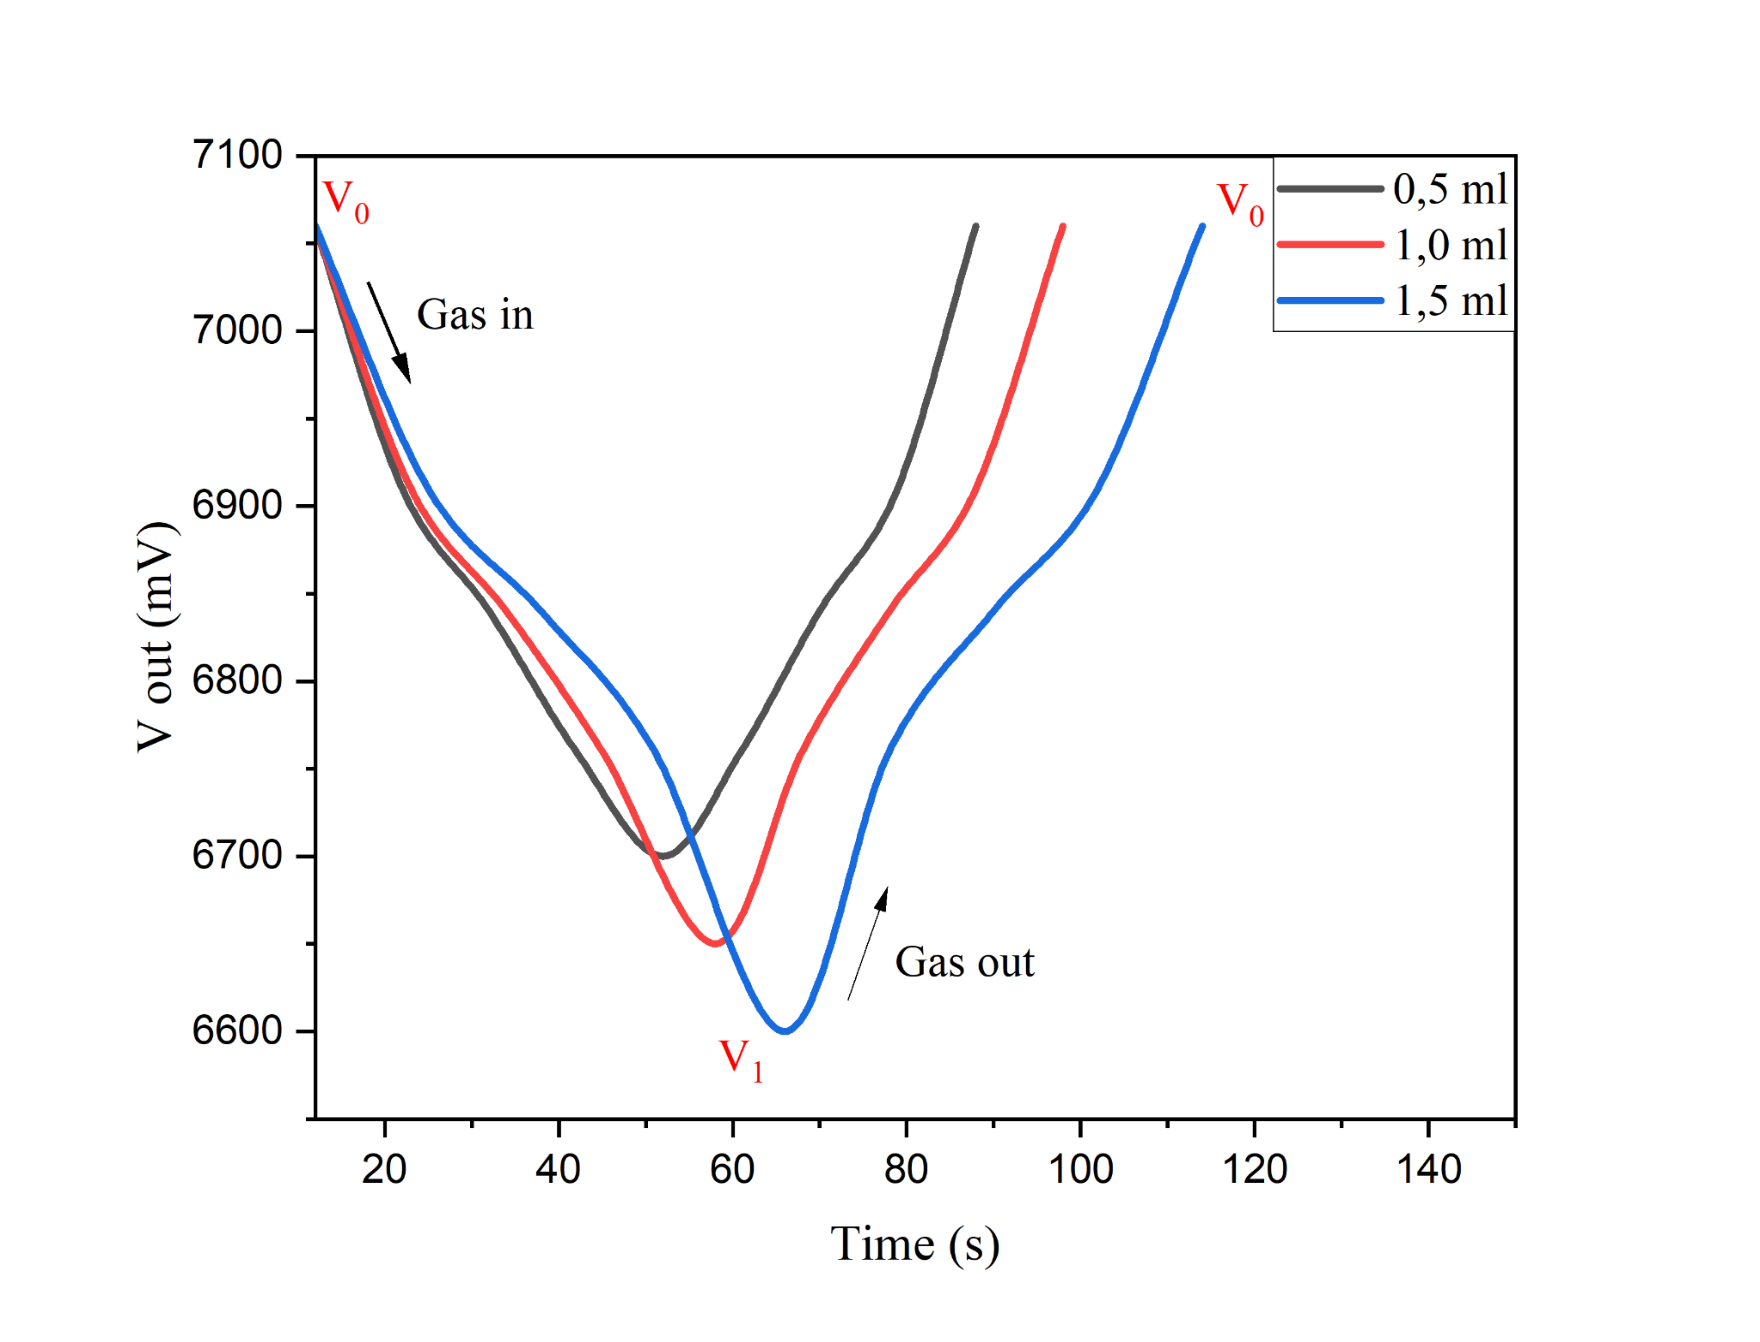
Figure 9 Detection of eucalyptus oil in sample A in first cycle.
Figure 10 shows the sensitivity values to the volume of eucalyptus oil in samples A, B and C. It can be seen that the sensitivity value of the PANI sensor increases with the increase in the volume of eucalyptus oil. From Figure 8, it can be seen that the lowest sensitivity values for eucalyptus oil aroma detection are found in sample C, at 2.33%, 3.57% and 4.38%. The highest sensitivity values are found in sample A, at 4.81%, 5.52% and 6.23%. This indicates that increasing the volume of eucalyptus oil directly increases the concentration of vapor interacting with the active surface of the PANI thin layer. An increase in the number of aroma molecules adsorbed on the PANI thin layer will amplify changes in surface charge and modify the material’s conductivity properties, resulting in more significant and measurable changes in output voltage, which are reflected as increased sensor sensitivity. Under these conditions, the response time is relatively short because aroma molecules can quickly reach and fill the PANI thin layer, while the recovery time remains within a proportional range, indicating efficient desorption and material stability of the sensor. Therefore, the PANI thin layer on Sample A with a volume of 1.5 mL can be recommended as the most optimal configuration due to its high sensitivity, signal stability, ideal response and recovery times and consistent reversibility, making it the most effective configuration for detecting the aroma of eucalyptus oil.
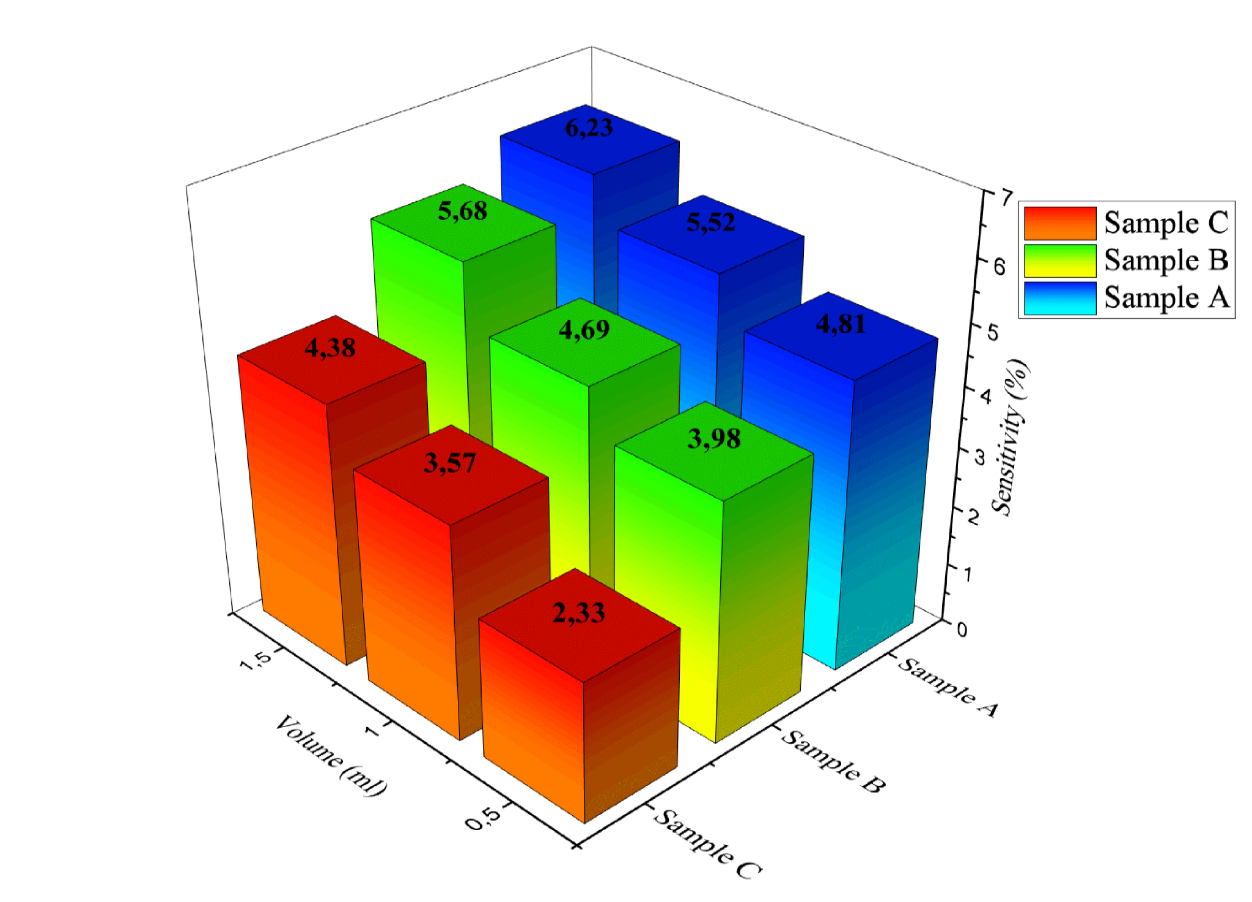
Figure 10 Sensitivity Results of PANI Thin Layer Coating to the Aroma of Eucalyptus Oil in Samples A - C at volumes of 0.5, 1.0 and 1.5 mL in cycles 1.
Based on the data in Table 2 the sensitivity, standard deviation (SD) and relative standard deviation (RSD) values of the three samples (A, B and C) show good consistency with variations in eucalyptus oil volume of 0.5, 1.0, and 1.5 mL. The sensitivity values obtained were in the range of 6.60% - 6.83%, with a slight downward trend as the volume increased, indicating that changes in eucalyptus oil vapor concentration did not significantly affect the sensor response. Sample A showed the highest sensitivity of 6.71%, while sample C showed the highest stability with a narrow sensitivity range (6.69% - 6.83%). The low SD values (0.00471 - 0.01886) and very small RSD (0.069% - 0.286%) indicate that the measurement results have a high level of precision and minimal data variation. These sensitivity values were obtained from the relationship between the voltage change due to exposure to eucalyptus oil (ΔV) and the initial sensor voltage (V0).
Table 2 Sensitivity with Statistical Precision Parameters.
Sample |
Volume (mL) |
Sensitivity (%) |
Standard deviation |
Relative standard deviation (%) |
A |
0.5 |
6.71 |
0.00471 |
0.070 |
1.0 |
6.66 |
0.00471 |
0.070 |
|
1.5 |
6.60 |
0.01886 |
0.286 |
|
B |
0.5 |
6.74 |
0.00471 |
0.069 |
1.0 |
6.68 |
0.01886 |
0.282 |
|
1.5 |
6.61 |
0.01886 |
0.286 |
|
C |
0.5 |
6.83 |
0.00471 |
0.068 |
1.0 |
6.74 |
0.01886 |
0.069 |
|
1.5 |
6.69 |
0.01886 |
0.070 |
Based on the data in Table 3 the response time and recovery time of the sensor at a eucalyptus oil volume of 1.0 mL showed consistent performance in all three samples. In general, the three samples showed stable response and recovery patterns with small variations between repetitions. Low standard deviation (SD) and relative standard deviation (RSD) values indicate a good level of precision, signifying that the measurements are consistent and reliable. These results indicate that the sensor has responsive performance and high stability in both the detection and recovery phases.
Table 3 Response and recovery time of sensors at a volume of 1.0 mL with statistical precision parameters.
Sample |
Response time (s) |
Recovery time (s) |
Standard deviation response time |
Standard deviation recovery time |
Relative standard deviation (%) response time |
Relative standard deviation (%) recovery time |
A |
40 |
34 |
0.471 |
0.471 |
1.168 |
1.373 |
41 |
34 |
|||||
40 |
35 |
|||||
B |
45 |
42 |
1.039 |
1.131 |
||
45 |
41 |
|||||
46 |
42 |
|||||
C |
46 |
42 |
1.032 |
1.113 |
||
46 |
43 |
|||||
45 |
42 |
Table 4 shows a comparison of various PANI sensor materials used to detect aromas with different methods and aroma types. PANI/HCl film sensors using an electronic nose system are capable of detecting fruit aromas such as grapes, apples, and strawberries. PANI film and PANI nanocomposites use a chemiresistive method to detect clove aromas and citrus aroma compounds (d-Limonene). Additionally, the TSA-doped PANI layer in the conductive sensor can detect the aroma of orange oil in chocolate. The reported results include parameters such as response time, recovery time and sensitivity, which are indicators of each sensor’s performance in detecting specific aromas.
Table 4 Comparison Table of PANI sensor performance for aroma detection.
Material |
Method |
Aroma type |
Result |
References |
|||
LOD |
Response time |
Recovery time |
Sensitivity |
||||
PANI/HCl film |
Electronic nose system |
Fruit (grapes, apples, strawberries) |
900 ppb |
- |
- |
grapes: 112% |
[4] |
PANI film |
Chemiresistive sensor |
Clove oil |
1.045 ppb |
13.26 |
106.29 |
70 |
[7] |
TSA-doped PANI layer |
Conductive sensor film |
Orange oil in chocolate |
7.108 ppm |
119.27 |
- |
0.0026 mΩ/ppm |
[13] |
PANI nanocomposites |
Chemiresistive sensor |
d-Limonene (citrus aroma compound) |
0.12 - 0.52 ppm |
- |
- |
2.24 mV/ppm |
[14] |
Conclusions
Based on the observation results, the electrodeposition method successfully produced a thin film of PANI that is conductive, flexible, and has potential as a sensor material. FTIR analysis showed an average fiber diameter of 105.38 nm with a porosity of 66.9%, which supports increased sensitivity. The aroma detection test using the FPP method showed an effective response with the highest sensitivity of 6% in sample A (1.5 mL), where the increase in volume was directly proportional to the increase in sensitivity. Although the sensitivity value is still relatively low, these results confirm the potential of PANI as an aroma sensor that can be improved through optimization of the electrodeposition process or composite formation and directed towards integration in portable devices for real-time aroma detection applications.
Acknowledgements
The author thank the Material Physics Laboratory and Chemistry Laboratory of Surabaya State University for their assistance in obtaining data.
Declaration of Generative AI in Scientific Writing
The authors acknowledge that generative AI tools (Grammarly.com and Gemini.ai) were utilized solely for language refinement and grammatical correction during the preparation of this manuscript. No content creation or data interpretation was carried out by AI. The authors retain full responsibility for all content and conclusions presented in this work.
CRediT Author Statement
Alifatul Azkia: Data curation, Formal analysis, Investigation, Validation, Visualization, and Writing –original draft. Nugrahani Primary Putri: Conceptualization, Methodology, Supervision, Validation, Funding acquisition, Writing–original draft, and Writing–review.
References
[1] J Wen, S Wang, J Feng, J Ma, H Zhang, P Wu, G Li, Z Wu, F Meng, L Li and Y Tian. Recent progress in polyaniline-based chemiresistive flexible gas sensors: Design, nanostructures and composite materials. Journal of Materials Chemistry A 2024; 12(11), 6190-6210.
[2] M Saoudi, B Zaidi, AA Alotaibi, MG Althobaiti, EM Alosime and R Ajjel. Polyaniline: Doping and functionalization with single walled carbon nanotubes for photovoltaic and photocatalytic application. Polymers 2021; 13(16), 2595.
[3] Y Yuan, H Wu, X Bu, Q Wu, X Wang, C Han, X Li, X Wang and W Liu. Improving ammonia detecting performance of polyaniline decorated rGO composite membrane with GO doping. Materials 2021; 14(11), 2829.
[4] MR Chia, SW Phang and I Ahmad. Emerging applications of versatile polyaniline-based polymers in the food industry. Polymers 2022; 14(23), 5168.
[5] W Kim, D Lee, G Wu, YL Cha, MS Moazzem, S Cho and DJ Kim. Molecularly imprinted chemiresistive sensor for specific recognition of furaneol as a biomarker of strawberry flavor conditions. ACS Sensors 2023; 8(4), 1542-1549.
[6] T Itoh, Y Masuda, I Matsubara, J Arai and W Shin. Examination of VOC concentration of aroma essential oils and their major VOCs diffused in room air. International Journal of Environmental Research and Public Health 2022; 19(5), 2904.
[7] AM Graboski, CA Zakrzevski, FM Shimizu, RT Paschoalin, AC Soares, J Steffens, N Paroul and C Steffens. Electronic nose based on carbon nanocomposite sensors for clove essential oil detection. ACS Sens 2020; 5(6), 1814-1821.
[8] TQ Toan, LPP Thao, NQ Chien, NTH Van, DL Phuong, TT Huong, PM Quan, CT Inh, PTH Minh, HT Bich, TTK Ngan, VT Thai, NT Viet, LG Bach and PQ Long. Determination of chemical composition and antimicrobial activity of Melaleuca cajuputi essential oil from Quang Tri Province, Vietnam. Asian Journal of Chemistry 2020; 32(9), 2203-2207.
[9] LPT Quoc. Physicochemical properties, chemical components and antibacterial activity of Melaleuca cajuputi powell essential oil leaves from Quang Tri province, Vietnam. Bulletin of the Chemical Society of Ethiopia 2021; 35(3), 677-683.
[10] QN Al-Haidary, AM Al-Mokaram, FM Hussein and AH Ismail. Development of polyaniline for sensor applications: A review. Journal of Physics: Conference Series 2021; 1853(1), 012062.
[11] A Korent, KZ Soderžnik, S Šturm, KZ Rožman, N Redon, JL Wojkiewicz and C Duc. Facile fabrication of an ammonia-gas sensor using electrochemically synthesised polyaniline on commercial screen-printed three-electrode systems. Sensors 2020; 21(1), 169.
[12] A Sierra-Padilla, JJ García-Guzmán, D López-Iglesias, JM Palacios-Santander and L Cubillana-Aguilera. E-Tongues/noses based on conducting polymers and composite materials: Expanding the possibilities in complex analytical sensing. Sensors 2021; 21(15), 4976.
[13] E Galvagni, AA Fritzen, AM Graboski, SC Ballen, J Steffens and C Steffens. Detection of volatiles in dark chocolate flavored with orange essential oil by electronic nose. Food Analytical Methods 2020; 13, 1421-1432.
[14] AM Graboski, G Feltes, RT Paschoalin, J Steffens, N Paroul and C Steffens. Gas-sensing properties of polyaniline-based nanocomposites for d-limonene detection. Journal of Applied Polymer Science 2024; 141(35), e55878.
[15] A Korent, KŽ Soderžnik, S Šturm and KŽ Rožman. A correlative study of polyaniline electropolymerization and its electrochromic behavior. Journal of The Electrochemical Society 2020; 167(10), 106504.
[16] A Kayishaer, C Magnenet, IA Pavel, HB Halima, V Moutarlier, B Lakard, N Redon, C Duc and S Lakard. Influence of surfactant on conductivity, capacitance and doping of electrodeposited polyaniline films. Front Mater 2024; 11, 1358534.
[17] DL Vu, TF Lin, TH Lin and MC Wu. Highly-sensitive detection of volatile organic compound vapors by electrospun PANI/P3TI/PMMA fibers. Polymers 2020; 12(2), 455.
[18] SVJ Sury, A Ulianas and S Aini. Synthesis of conducting polyaniline with photopolymerization method and characterization. Journal of Physics: Conference Series 2021; 1788, 012004.
[19] A Korent, KŽ Soderžnik and KŽ Rožman. In-situ spectroelectrochemical study of conductive polyaniline forms for sensor applications. Proceedings 2020; 56(1), 32.
[20] R Farina, S Scalese, D Corso, GE Capuano, GA Screpis, MA Coniglio, GC Condorelli and S Libertino. Chronoamperometric ammonium ion detection in water via conductive polymers and gold nanoparticles. Molecules 2024; 29(13), 3028.
[21] R Ismail, I Šeděnková, Z Černochová, I Romanenko, O Pop-Georgievski, M Hrubý and E Tomšík. Potentiometric performance of ion-selective electrodes based on polyaniline and chelating agents: detection of Fe2+ or Fe3+ ions. Biosensors 2022; 12(7), 446.
[22] F Huerta, C Quijada, F Montilla and E Morallón. Revisiting the redox transitions of polyaniline. Semiquantitative interpretation of electrochemically induced IR bands. Journal of Electroanalytical Chemistry 2021; 897, 115593.
[23] RM Silverstein, FX Webster, DJ Kiemle and DL Bryce. Spectrometric identification of organic compounds. Wiley, Hoboken, 2014.
[24] C Rahayu. Identifikasi kandungan senyawa alfa-pinene pada minyak kayu putih menggunakan FTIR. Jurnal Multidisipliner Bharasumba 2023; 2(3), 165-168.