Trends
Sci.
2026;
23(6):
12406
The Influence of the Simultaneous Addition of Fe2+ and Fe3+ on Changes in the Structural, Optical, and Electronic Properties of TiO2 Powder
Candra Purnawan1,2, Endang Tri Wahyuni1,*, Indriana Kartini1 and Suherman1
1Department of Chemistry, Faculty of Mathematics and Natural Sciences, Gadjah Mada University,
Yogyakarta 55281, Indonesia
2Department of Chemistry, Faculty of Mathematics and Natural Sciences, Sebelas Maret University,
Jawa Tengah 57126, Indonesia
(*Corresponding author’s e-mail: [email protected])
Received: 24 October 2025, Revised: 3 November 2025, Accepted: 10 November 2025, Published: 30 January 2026
Abstract
Modification of TiO₂ powder to form TiO₂-Fe/Fe₂O₃ composites with simultaneous incorporation of Fe²⁺ and Fe³⁺ ions via a simple approach has been conducted. The characterization of photocatalyst composites has been carried out using FTIR, Raman, XRD, SAA, TEM, DRS, XPS, and VSM. The simultaneous incorporation of Fe²⁺ and Fe³⁺ ions has modified the structural, optical, and magnetic properties of TiO2 powder. Systematic variation of Fe²⁺: Fe³⁺ compositions (mole/mole) revealed that Fe³⁺ had a stronger impact than Fe²⁺. At low Fe³⁺ and Fe₂O₃ composition, interfacial interaction and heterojunction formation dominated, whereas higher levels promoted substitutional doping. At low Fe³⁺ composition (Fe2+: Fe3+ = 1:0.3 - 1:1), crystallite size increased (29.95 - 34.65 nm) but crystallinity decreased (62.34% - 57.99%), surface area increased (25.90 - 29.71 m2/g) but pore size decreased (0.097 - 0.085 cc/g), the bandgap narrowed (3.14 - 2.98 eV), and maghemite formation and magnetic moment decreased (36.83 - 17.66 emu/g). Whereas at Fe³⁺ higher ratio (Fe2+: Fe3+ = 1:1 - 1:3), the bandgap significantly narrowed (2.98 - 2.80 eV), crystallite size (34.65 - 27.30 nm) and crystallinity (57.99% - 49.27%) decreased, surface area (29.09 - 43.49 m2/g) and pore size (0.085 - 0.139 cc/g) increased, and hematite formation increased and magnetic moment decreased (17.66 - 14.86 emu/g). Furthermore, increasing the proportion of Fe₂O₃ in TiO₂ powder (TiO₂: Fe₂O₃) has enlarged the surface area and pore size, narrowed the bandgap, decreased the crystallite sizes and crystallinity, and improved magnetic properties. Photocatalytic evaluation under visible light showed that increasing Fe³⁺ and Fe₂O₃ enhanced both Methyl Violet (MV) degradation up to 84.54% and Cr(VI) reduction up to 36.55%, with stronger MV degradation indicating that Fe³⁺ mainly serves as an electron trap.
Keywords: TiO₂ powder, Fe2+: Fe3+ ratio, TiO₂: Fe₂O₃ ratio, Simultaneous, Structural, Optical, Electronic, Properties
Introduction
Titanium dioxide (TiO₂) is a widely used semiconductor photocatalyst due to its high photocatalytic efficiency, chemical stability, non-toxicity, and low cost. However, its wide bandgap (3.2 eV) limits visible-light activity, and its recovery after use remains inefficient [1,2]. To overcome the limitations, modifications such as Fe doping have been extensively explored. Iron is a common transition metal that can reduce bandgap and provide magnetic properties. Fe³⁺ ion can substitute Ti⁴⁺ due to their similar ionic radii, thereby narrowing the bandgap and
imparting magnetic properties. Ferric ion (Fe3+) can function as dopants because both Fe3+ (0.64 Å) and Ti4+ (0.68 Å) ions have similar sizes [1]. In oxide form, Fe can also function as a photocatalyst, magnetic agent, heterojunction, or adsorbent. However, most reported approaches apply doping and magnetization separately, often through sol-gel synthesis using TiO₂ precursors, which is costly, complex, time-consuming, difficult reaction control, and less feasible for large-scale applications [3,4].
Recent studies have also employed TiO₂ powder via hydrothermal or co-precipitation methods to simplify synthesis, though the high stability of anatase limits ion incorporation because TiO₂ powder is a crystal with excellent chemical and physical stability. Shymanovska et al. [2] have conducted Fe3+ ion doping on TiO2 Anatase and Rutile powders. The results have demonstrated that the adsorption of Fe3+ ions on the surface of Anatase is twice as efficacious as that of Rutile. The adsorption of Fe3+ ions on the TiO2 surface causes changes in the crystal lattice, bandgap, and acidity. However, the photocatalytic activity of Safranin T degradation using Fe3+ doped TiO2 is lower than TiO2 without doping. Meanwhile, Afonso et al. [5] found that Fe3+-doped TiO2 photocatalysts lacked magnetic characteristics and had worse RhB photodegradation efficiency (<70%) than undoped TiO2 (74%) under visible light irradiation. Thus, further research is needed to simultaneously enhance photocatalytic activity under visible light and improve catalyst separability through magnetization.
In this study, TiO₂ powder will be modified with simultaneous incorporation of Fe²⁺ and Fe³⁺ ions via a simple approach to form TiO₂-Fe/Fe₂O₃ composites. The simultaneous addition of Fe2+ and Fe3+ is expected to improve electronic and optical properties, visible-light photocatalytic activity, and magnetic separability by doping (TiO₂-Fe) and heterojunction (TiO₂/Fe₂O₃) mechanism. The incorporation of Fe2+ and Fe3+ ions to TiO2 powder will provide a different mechanism and alter its characteristics in contrast to utilizing TiO2 precursors, so further research is needed. The success of this study offers a new approach to TiO₂ powder modification, simplifying the process and making its application in wastewater treatment more cost-effective and practical. Variations in Fe²⁺/Fe³⁺ and Fe₂O₃/TiO₂ ratios (mole/mole) play a crucial role in modifying the properties and activity of TiO2 powder. The composition will induce changes in electron density, interactions, lattice distortion and deformation, structure regularity, crystallinity and crystallite size, bandgap, electron binding energy, surface area, and magnetic behavior, thereby changing structure, electronic, and optical properties so that finally change photocatalytic performance. To determine the effects, the photocatalyst composite will be characterized using FTIR, Raman, XRD, SAA, TEM, DRS, XPS, and VSM.
Materials and methods
Materials
Titanium (IV) Oxide Anatase >99% (Sigma-Aldrich), Iron(III) Chloride hexahydrate (Merck), Iron(II) Chloride Tetrahydrate (Merck), Sodium Hydroxide (Merck), Isopropanol (Merck), Potassium dichromate (Merck), Methyl violet (Loba Chemie PVT, LTD), Demineralized Aqua with TDS < 1.3 μS/cm (Brataco), Acetone (Merck), Nitric Acid (Merck), Diphenylcarbazide (Merck), Chloroform (Merck), Phosphoric Acid (Merck).
Synthesis of TiO2-Fe/Fe2O3 for modification of TiO2 powder
Composite
TiO₂-Fe/Fe₂O₃ had been synthesized using TiO2
Anatase powder, FeCl3.6H2O
and FeCl2.4H2O.
A quantity FeCl3.6H2O
and FeCl2.4H2O
with theoretical mole ratio of Fe2+:
Fe3+
= 1:0.3; 1:0.5; 1:1; 1:2; 1:3 (mole/mole) were dissolved in 25 mL of
distilled water and added with a number of TiO2
Anatase powder in 25 mL of isopropanol with theoretical mole ratio
of TiO2:
Fe2O3
= 1: (TF0.05);
1:
(TF0.05);
1:
 (TF0.07);
1:
(TF0.07);
1:
 (TF0.1);
1:
(TF0.1);
1:
 (TF0.2)
dan 1:1 (FT1.0)
(mole/mole).
Then, 50 mL of distilled water was added to the
mixture and stirred for 1 h (400 rpm). Next, add drop by drop
NaOH 10 M until the pH = 12while stirring continuously for 1 h (700
rpm). Then the mixture was heated at 90 °C for 1 h while stirring
continuously.
The black or gray composite formed was dried overnight at 60 °C (24
h). After grinding into powder, the granules were calcined in a
muffle furnace at 400 °C for 2 h. The synthesized composite was
rinsed with demineralized water until it reached a neutral pH and
dried again overnight in a 60 °C oven (12 h) and then characterized
using Fourier Transform InfraRed (FTIR) Spectroscopy, Raman
Spectroscopy, Diffused Reflectance Spectroscopy (DRS), X-Ray
Diffraction Spectroscopy (XRD), Vibrating Sample Magnetometer (VSM),
Transmission Electron Microscope (TEM), Surface Area Analyzer
(SAA), and X-ray photoelectron spectroscopy (XPS).
(TF0.2)
dan 1:1 (FT1.0)
(mole/mole).
Then, 50 mL of distilled water was added to the
mixture and stirred for 1 h (400 rpm). Next, add drop by drop
NaOH 10 M until the pH = 12while stirring continuously for 1 h (700
rpm). Then the mixture was heated at 90 °C for 1 h while stirring
continuously.
The black or gray composite formed was dried overnight at 60 °C (24
h). After grinding into powder, the granules were calcined in a
muffle furnace at 400 °C for 2 h. The synthesized composite was
rinsed with demineralized water until it reached a neutral pH and
dried again overnight in a 60 °C oven (12 h) and then characterized
using Fourier Transform InfraRed (FTIR) Spectroscopy, Raman
Spectroscopy, Diffused Reflectance Spectroscopy (DRS), X-Ray
Diffraction Spectroscopy (XRD), Vibrating Sample Magnetometer (VSM),
Transmission Electron Microscope (TEM), Surface Area Analyzer
(SAA), and X-ray photoelectron spectroscopy (XPS).
Results and discussion
The influence of Fe2+: Fe3+ composition (mole/mole)
In this section, TiO2-Fe/Fe2O3 photocatalyst have been synthezised with a constan mole ratio of TiO2: Fe2O3 = 1:1/5 (TF0.2). Meanwhile, the variation of Fe2+: Fe3+ was carried out at mole ratio Fe2+: Fe3+ = 1:0.3, 1:0.5, 1:1, 1:2 and 1:3 (mole/mole).
Raman and FTIR Analysis. The simultaneous addition of Fe²⁺ and Fe³⁺ with different composition into TiO₂ powder influences Raman inelastic scattering and vibrational energy, as shown in Figure 1. Based on Raman spectra (Figure 1(a)), the characteristic TiO₂ peaks include Eg at 132.74 cm⁻¹ (O-Ti-O symmetric stretching), B1g at 384.86 cm⁻¹ (O-Ti-O symmetric bending), B1g + A1g at 505.99 cm⁻¹ (symmetric/asymmetric bending), and E3g at 628.82 cm⁻¹ (Ti-O stretching) [6,7]. The asymmetric O-Ti-O vibration is associated with Ti³⁺ or oxygen vacancy defects [8].
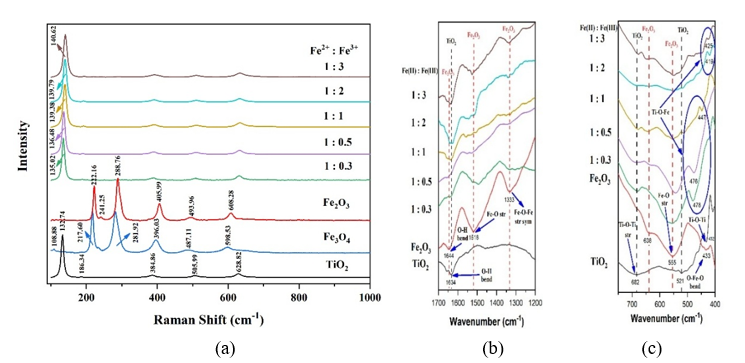
Figure 1 (a) Raman, and (b) - (c) FTIR Spectra of TiO2, Iron Oxide, and composites in the variation of composition Fe2+: Fe3+ (mole/mole).
Figure 1(a) also showed that calcination induces the transformation of Fe₃O₄ (blue) to Fe₂O₃ (red), as indicated by the disappearance of Magnetite peaks at 108.88 and 647.06 cm⁻¹ and the emergence of a new peak at 241.25 cm⁻¹ [9]. The shifts at 217.60 and 281.92 cm⁻¹ confirm the oxidation of Fe²⁺ to Fe³⁺ during the process [10]. The increased intensity ratio of the 281.92 cm⁻¹ peak to the 217.60 cm⁻¹ peak further supports the increasing of Fe³⁺ after calcination. Raman analysis further revealed that increasing Fe³⁺ content shifts the main Eg peak from 132.74 to 140.62 cm⁻¹, indicating enhanced lattice distortion and doping process. The peak shift and broadening at higher dopant levels confirm lattice deformation and defect formation due to Fe³⁺ substitution for Ti⁴⁺ in the TiO₂ lattice [6,11]. When Fe³⁺ substitutes Ti⁴⁺ ions, oxygen vacancies and lattice distortions are generated to maintain local charge neutrality, leading to Raman peak shifts and broadening. The resulting oxygen deficiency and structural distortion locally shorten Ti-O bonds, while the overall lattice d-spacing decreases, causing the Raman peaks to shift toward higher wavenumbers. Compared to Fe²⁺, Fe³⁺ induces stronger distortion, consistent with the increased intensity of hydroxyl groups at 1634 cm-1 and Ti-O-Fe bending vibrations, as shown in Figures 1(b) and 1(c). A new peak appears at 478 - 419 cm⁻¹, assigned to Ti-O-Fe bending vibrations, confirming Fe³⁺ incorporation into the TiO₂ lattice as substitutional dopants replacing Ti⁴⁺. The red shift evidences substitutional doping, which is also characterized by Fe-O vibrations shifting to lower wavenumbers [12].
XRD Analysis. Ratio of Fe2+: Fe3+ (mole/mole) have affected the diffractogram pattern and crystal composition of composite as shown in Figure 2. The diffractogram pattern of Anatase TiO2, Maghemite (γ-Fe2O3), Hematite (α-Fe2O3) are consistent with the diffractogram of ICSD standard No. 9852, ICSD No. 172905, and ICSD No. 164008, respectively.
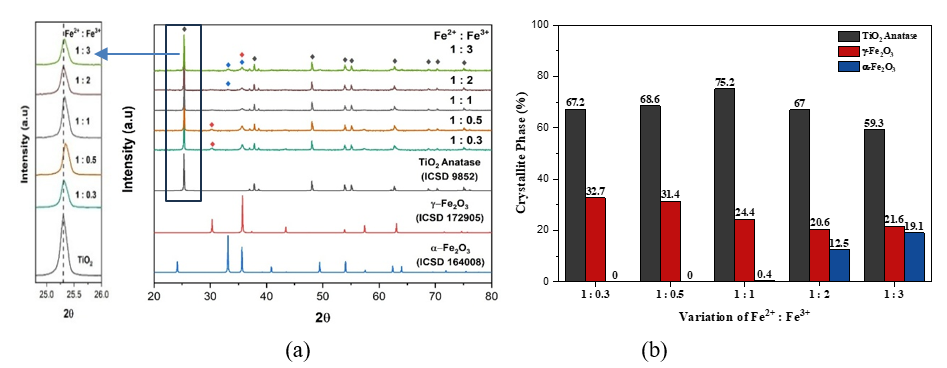
Figure 2 (a) XRD diffractogram, and (b) Crystallite composition (%) of the composite with Fe2+: Fe3+ composition (mole/mole).
Figure 2(a) showed the excessive Fe²⁺ or Fe³⁺ content reduced the intensity of TiO2 peaks at 2θ = 25.3°, 37.8°, 48.0° and 62.72°, compared with the Fe²⁺: Fe³⁺ = 1:1 composite, indicating a decline in TiO₂ crystallinity and crystallite composition due to Fe ion distortion and deformation. The phenomenon is confirmed with crystal composition using HighScore Plus software as shown in Figure 2(b). Figure 2(b) illustrated the effect of Fe²⁺: Fe³⁺ composition on TiO2 crystallite structure and the formation of Maghemit and Hematit. Fe³⁺ more effectively reduces TiO₂ crystallite composition than Fe²⁺, induces stronger lattice distortion and defects, and then facilitates substitutional doping. The presence of substitutional doping causes distortion and structural defects [13]. A higher Fe²⁺ ratio favors Maghemit formation, whereas excess Fe³⁺ decreases Maghemit and promotes Hematit through Fe(OH)3 transformation. A higher Fe³⁺ composition promotes greater Fe(OH)₃ formation and its subsequent transformation into hematite (α-Fe₂O₃). Thus, at high Fe³⁺ levels, hematite primarily originates from both maghemite and Fe(OH)₃ transformation, whereas at low Fe³⁺ levels, it mainly results from maghemite transformation.
The presence of Fe2+ and Fe3+ ions can also affect the crystallinity index and crystallite size of photocatalyst, as seen in Figure 3. This crystallinity was calculated based on Wibowo et al. [14], and crystal size was obtained based on the Scherrer equation [15].
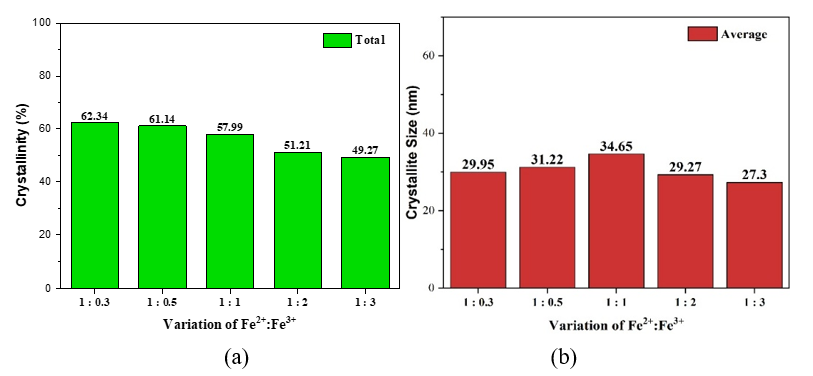
Figure 3 (a) Crystallinity index, (b) Crystal size of photocatalyst composite.
Figure 3(a) indicated that Fe³⁺ more effectively suppresses TiO₂ crystallinity than Fe²⁺ due to its smaller ionic radius and higher charge, which enhance lattice distortion and disorder [5,16]. As shown in Figure 3(b), at low Fe³⁺ levels (Fe²⁺: Fe³⁺ = 1:0.3 - 1:1) promote interfacial interactions between TiO2 and Fe2O3 so that enlarge particle growth and crystallite size [1,17]. The interfacial interactions such as sintering, coupling, or aggregation facilitate heterojunction formation. Whereas, at higher Fe³⁺ compositions (Fe²⁺: Fe³⁺ = 1:1 - 1:3), it induces severe distortion and defects, reducing both crystallinity and crystallite size, and then facilitates Fe ion doping. Loan et al. [11] stated that the greater the Fe3+ doping into TiO2, the smaller the crystallite size. The greater the Fe3+ doping, the greater the distortion and defects so that the deformation becomes greater and the crystallite size becomes smaller.
Surface Area Analysis (SAA). Mole ratio of Fe2+: Fe3+ have also affected the surface area of composite as shown in Figure 4. Figure 4(a) displayed a type IV adsorption isotherm typical of mesoporous materials (2 - 50 nm), with an H3 (slit-shaped pores or plate-like aggregates) or H4 (wedge-shaped pores) hysteresis loop associated with slit or wedge-shaped pores formed by particle irregularities, non-uniform pore structures, incomplete or asymmetric openings, non-linear channels, and broad pore size distribution [18,19]. As shown in Figure 4(b), increasing Fe³⁺ composition enhances surface area and pore volume more effectively than Fe²⁺ due to stronger lattice distortion, as supported by increased hydroxyl groups (Figure 1(b)), and decreased crystallinity (Figure 3(a)).
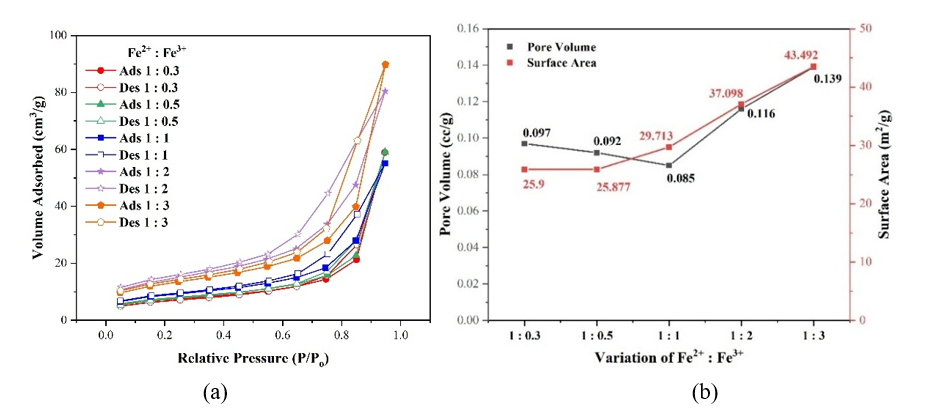
Figure 4 (a) Hysteresis loop Isotherm, (b) Pore volume and surface area of composite with Fe2+: Fe3+ composition (mole:mole).
At low Fe³⁺ composition (Fe²⁺: Fe³⁺ = 1:0.3 - 1:1), distortion is insufficient to significantly deform the TiO₂ lattice, and surface area increases mainly through interfacial interactions, accompanied by reduced pore volume. In contrast, higher Fe³⁺ composition (Fe²⁺: Fe³⁺ = 1:1 - 1:3) induces substitutional doping, oxygen vacancies, and severe lattice deformation, which open and enlarge TiO₂ pores, leading to increased internal pore volume, irregularities, and surface area. Surface area is mainly interpreted as internal area (intraparticle porosity) with additional contribution from surface irregularities. Internal porosity contributes more significantly to surface area than particle size effects [13,20].
Bandgap analysis. The change in Fe²⁺: Fe³⁺ composition causes a variation in the interaction and distortion strength of the TiO₂ crystal and alters the formation of iron oxide, thereby affecting the doping strength and interfacial interactions. Then, in turn, the composition will influence the bandgap of the photocatalyst composite, as shown in Figure 5. The optical energy bandgap of composite has been estimated using Tauc’s Plot equation [(αhʋ)1/n = K (hʋ – Eg)] with plotting (αhʋ)2 vs hʋ. The linier part of the curves is extrapolated such that the intercept on the energy axis (αhʋ)2= 0 gives the energy bandgap.
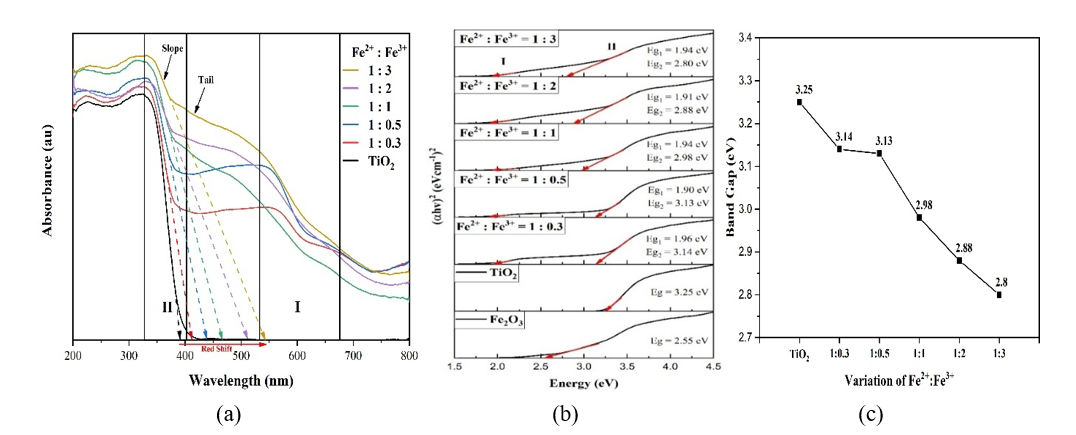
Figure 5 (a) DRS spectra, (b) tauc plots, and (c) band gap of composites with Fe²⁺: Fe³⁺ composition (mole:mole).
Figure 5 showed that increasing Fe³⁺ composition reduces the composite bandgap from 3.25 to 2.80 eV. The decreasing is attributed to 2 main mechanisms: Heterojunction formation between TiO₂ and Fe₂O₃, and Fe³⁺ doping. At lower Fe³⁺ content (Fe²⁺: Fe³⁺ = 1:0.3 - 1:1), bandgap narrowing is dominated by heterojunction formation, driven by interfacial interactions (sintering, coupling, aggregation) that modify the electronic structure without significantly altering TiO₂ intrinsic absorption slope and bandgap (Area II). Interfacial interaction does not directly change the intrinsic bandgap of TiO₂ but occurs through heterojunction formation [21]. The energy band gap of Fe2O3/TiO2 nanocomposites decreased as the Fe2O3 loading increased which can be attributed to the formation of heterojunction structure, and the formation of a new molecular orbital that results in reduced bandgap accordingly [3]. The formation of a heterojunction between TiO₂ and Fe₂O₃ involves the combination of two semiconductors with different band gaps. Since TiO₂ possesses a higher Fermi energy and lower work function than Fe₂O₃, electron transfer occurs from TiO₂ to Fe₂O₃ to equilibrate their Fermi levels.
At higher Fe³⁺ content (1:1 - 1:3), distorsion and doping becomes dominant, where Fe³⁺ substitutes Ti⁴⁺, enhances orbital overlap (Ti 3d-Fe 3d), and introduces mid-gap states, Ti³⁺, and oxygen vacancies [22]. Fe3+ ions substitute Ti4+ ions in TiO2 crystal and cause a change in the band gap by forming their mid gap energy levels in the respective samples along with the formation of Ti3+ and oxygen vacancies [22]. The defects lead to a red-shift of the absorption edge, broadening of the absorption tail and narrowing the bandgap, consistent with previous reports [2,23]. The decrease in bandgap due to doping has also been supported by the decrease in crystal size (Figure 3(b)) which is not accompanied by an increase in bandgap (Figure 5(b)) from the composition Fe2+: Fe3+ = 1:1 - 1:3. Ideally, the decrease in crystallite size at nanoscale should increase the bandgap but the presence of Fe3+ doping has caused a decrease in the composite bandgap [24,25]. The decrease in bandgap due to doping confirmed the Raman analysis (Figure 1).
XPS Analysis. XPS spectra of TiO2 and composites with Fe2+: Fe3+ composition as seen in Figure 6. The composite used in this study was the TF0.2 composite with the composition of Fe2+: Fe3+ = 1:0.3, 1:1 and 1:3 (mole/mole).
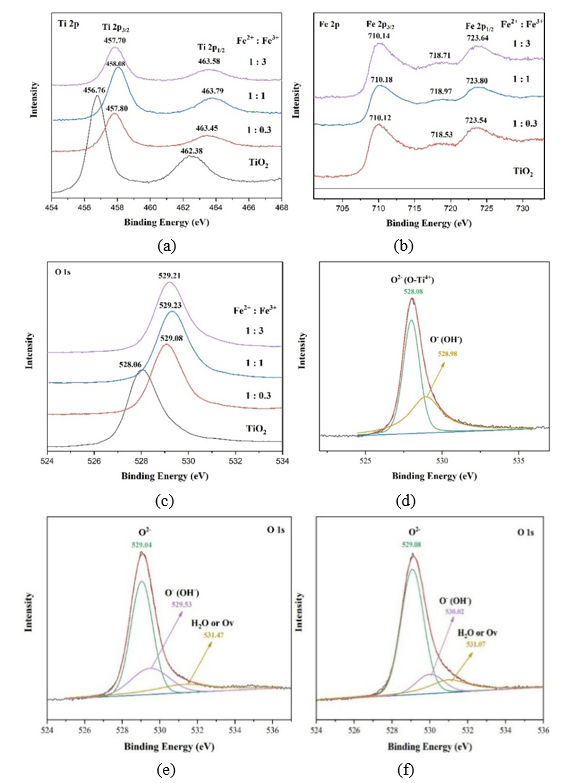
Figure 6 XPS spectra of composites (a) high resolution spectra (HRS) of Ti2p peak, (b) high resolution spectra (HRS) of Fe 2p peak (c) high resolution spectra (HRS) of O 1s peak, (d) deconvolution spectra O1s of TiO2, (e) deconvolution spectra O1s of Fe²⁺: Fe³⁺ = 1:0.3, (f) deconvolution spectra O1s of Fe²⁺: Fe³⁺ = 1:3.
Figure 6(a) showed Ti 2p peaks at 456.8 eV (2p₃/₂) and 462.4 eV (2p₁/₂), with a spin spillting of 5.65 - 5.88 eV, confirming Ti⁴⁺. Incorporation of Fe ions causes binding energy shifts in both Ti 2p peaks, indicating Fe-O-Ti bond formation. At lower Fe³⁺ content (Fe²⁺: Fe³⁺ = 1:0.3 - 1:1), a positive shift of Ti 2p suggests heterojunction formation, driven by electron transfer from TiO₂ (higher Fermi level) to Fe₂O₃ (lower Fermi level), which reduces TiO₂ electron density and increases binding energy. At higher Fe³⁺ content (Fe²⁺: Fe³⁺ = 1:1 - 1:3), a negative Ti 2p shift occurs (~0.1 - 0.5 eV) due to substitutional doping of Ti⁴⁺ by Fe³⁺, which generates oxygen vacancies and promotes Ti³⁺ formation as a charge compensation mechanism, then subsequently increasing the electron density and reducing the binding energy of Ti 2p [16,26]. Consistently, binding energy of O 1s spectra (Figure 6(c)) also exhibits positive shifts (528.06 → 529.23 eV) with increasing Fe³⁺, attributed to charge redistribution from Ti⁴⁺ substitution by Fe³⁺, consistent with lattice distortion and oxygen vacancy formation [16,27]. Based on Figures 6(d) - 6(f), the deconvoluted O 1s spectra showed a new peak at 531.17 eV, absent in pure TiO₂ (Figure 6(d)), which indicated the presence of oxygen vacancies, with intensity increasing as Fe³⁺ content rises. The results demonstrated that higher Fe3+ content enhances oxygen vacancy formation and Fe-O-Ti bonding, mainly through substitutional doping [26]. So that in this case, not only the interfacial interaction and heterojunction occurred but also the doping increased with increasing Fe3+ composition.
VSM Analysis. Vibrating Sample Magnetometry (VSM) analysis was performed to investigate the alteration of magnetic properties in TiO₂ powders upon the simultaneous incorporation of Fe²⁺ and Fe³⁺ ions, as shown in Figure 7 and Table 1.
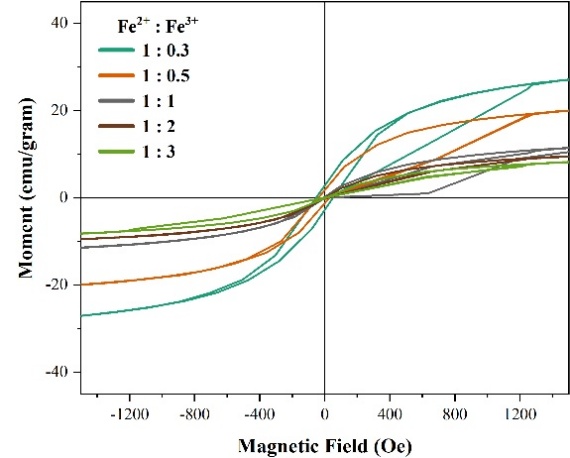
Figure 7 (a) VSM Loop hysteresis of composite with variation of Fe2+: Fe3+ (mole/mole).
Table 1 Saturation Magnetization (Ms), Remanence Magnetisation (Mr), and Coercivity (Oe) composite.
Composition of Fe2+: Fe3+ |
Ms (emu/gram) |
Mr (emu/gram) |
Hc (Oe) |
TiO2 (control) |
0.01 |
0 |
0 |
1:0.3 |
36.83 |
2.80 |
51.99 |
1:0.5 |
26.25 |
1.54 |
33.86 |
1:1 |
17.66 |
0 |
0 |
1:2 |
15.92 |
0 |
0 |
1:3 |
14.86 |
0 |
0 |
Figure 7 and Table 1 indicated that the composite exhibits soft magnetic behavior, characterized by a narrow hysteresis loop, low remanence (Mr), and low coercivity (Hc < 1kA/m). At low Fe3+ composition (0.3:0.5 mole), Loop hysteresis showed ferromagnetic behavior with coercivity (Hc) 51.99 and 33.86 Oe, whereas at high Fe3+ composition (1:2 mole) showed super-paramagnetic behavior with zero coercivity (Hc) and remanence (Mr). Increasing Fe³⁺ composition decreases the saturation magnetization (Ms) from 36.83 to 14.86 emu/g due to the higher fraction of hematite (α-Fe₂O₃), which is paramagnetic, consistent with XRD results (Figure 2). In hematite structure, Fe³⁺ ions occupy symmetrical octahedral sites with antiparallel spins, resulting in a nearly zero net magnetic moment. In contrast, maghemite contains Fe³⁺ ions in both octahedral and tetrahedral sites, creating cation imbalance and vacancies, which prevent complete spin cancellation, producing a measurable net magnetic moment [28].
The influence of TiO2: Fe2O3 composition (mole/mole)
In this section, TiO₂-Fe/Fe₂O₃ photocatalysts were synthesized at a fixed Fe²⁺: Fe³⁺ ratio of 1:2 (mole/mole). The TiO2: Fe2O3 (TF) composition was varied at molar ratios of = 1:1/20 (TF0.05); 1:1/15 (TF0.07); 1:1/10 (TF0.1); 1:1/5 (TF0.2), and 1:1 (FT1.0) (mole/mole).
Raman and FTIR Analysis. The concentration of Fe2+ and Fe3+, as well as the composition of Fe2O3 to TiO2 powder, has impacted Raman light scattering (inelastic) and vibrational energy, as shown in Figure 8.
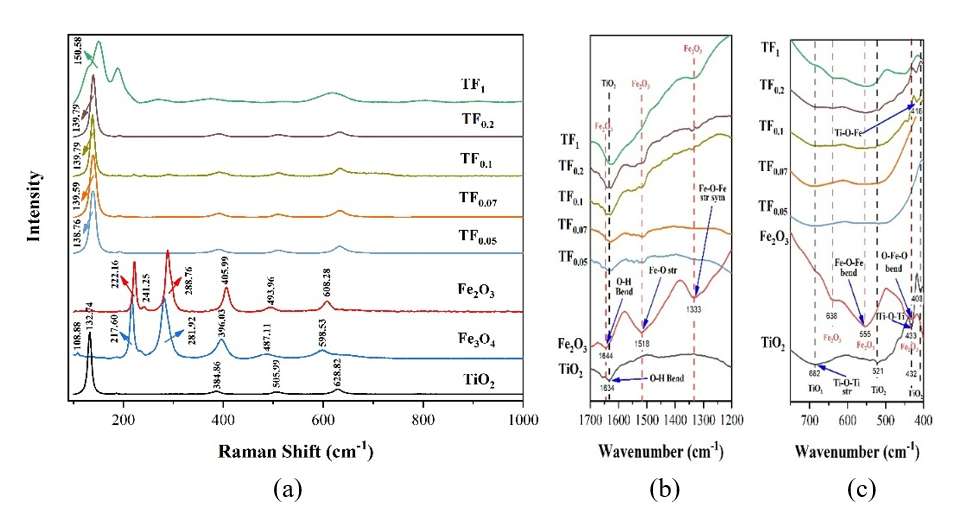
Figure 8 (a) Raman, and (b) - (c) FTIR spectra of composites with TiO2: Fe2O3 composition.
Figure 8(a) indicated that as Fe2O3 composition increases, peak shifts towards higher wavenumbers occur, particularly the primary peak (E1g) from 132.74 - 150.58 cm−1. The shift indicated that the higher the concentration of Fe2+ and Fe3+ with increasing Fe2O3 composition, the greater the polarization of the electron and the distortion of the TiO2 crystal, resulting in a larger Raman shift and decreased crystallinity. A higher Fe³⁺ content extends the Eg peak toward higher wavenumbers, consistent with previous reports [6,11]. The Raman peak shift can be attributed to the lattice distortion caused by the replacement of Ti4+ with Fe3+ in the TiO2 framework, which is supported by FTIR analysis (Figures 8(b) and 8(c)). Figure 8(c) showed a new peak appears at 478 - 415 cm⁻¹ at TF0.1 - TF1, assigned to Ti-O-Fe bending vibrations, confirming Fe³⁺ incorporation into the TiO₂ lattice as substitutional dopants replacing Ti⁴⁺. Whereas at low Fe2O3 composition (TF0.05 - TF0.07), there is no peak at 478 - 419 cm⁻¹.
XRD Analysis. Alteration in the diffraction pattern of the composite with a composition of TiO2:Fe2O3 (TF0.05 - TF1) as shown in Figure 9. Figure 9 indicated that the TiO2 powder is anatase, and the iron oxide is a mixture of Maghemite and Hematite with a composition of TiO2:Fe2O3 (TF0.05 - TF1). Figure 9(a) revealed enhanced peak intensities of Maghemite (γ-Fe₂O₃) at 2θ = 35.71° (311) and Hematite (α-Fe₂O₃) at 2θ = 33.14° (104), indicating their increased formation with higher Fe₂O₃ content. Meanwhile, Figure 9(a) also showed that increasing Fe₂O₃ content (TF0.2 → TF1) induces a shift of the TiO₂ diffraction peak at 2θ = 25.31° (101) toward higher angles, accompanied by peak broadening and intensity reduction. The behavior confirms Fe³⁺ incorporation into the TiO₂ lattice, as the smaller ionic radius of Fe³⁺ (0.64 Å) compared to Ti⁴⁺ (0.68 Å) reduces the interplanar spacing [29]. Moreover, the decrease in peak intensity and crystallinity of TiO₂ is the main effect of Fe doping with increasing Fe concentration [15]. Rietveld refinement using HighScore Plus revealed a reduction in TiO₂ crystallite size and enhanced formation of hematite (α-Fe₂O₃) and maghemite (γ-Fe₂O₃) with increasing Fe₂O₃ composition (TF0.05 - TF1), as illustrated in Figure 9(b).
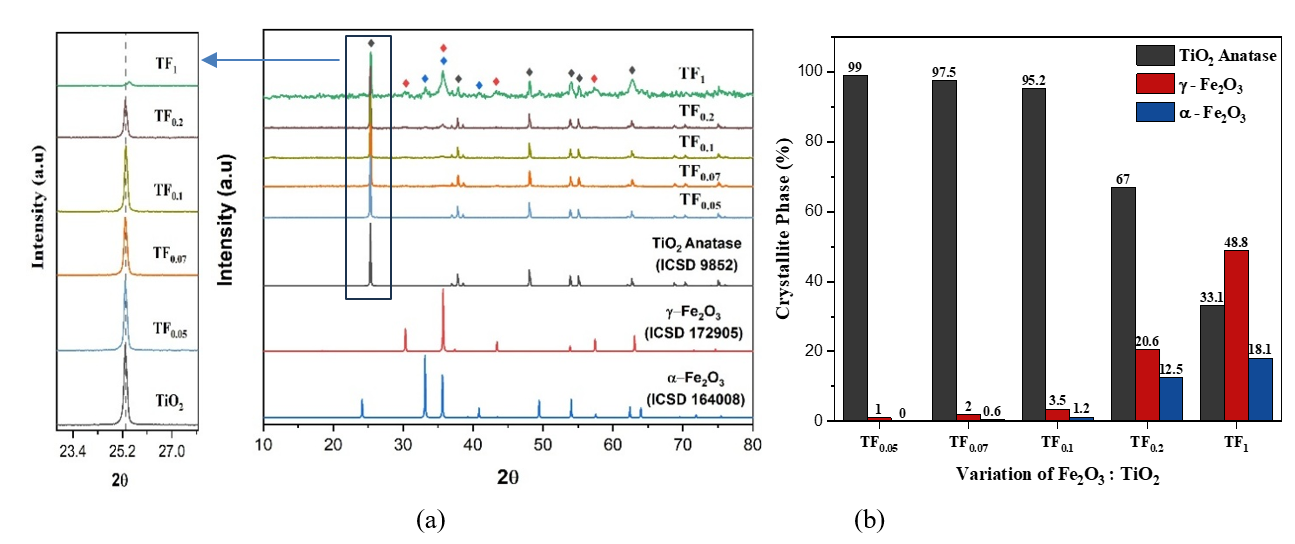
Figure 9 (a) XRD diffractogram and (b) Crystallite composition (%) of composites with TiO2: Fe2O3 composition.
The TiO2: Fe2O3 composition also affected the crystallinity index and crystal size of photocatalyst, as seen in Figure 10. As shown in Figure 10(a), the crystallinity index decreases progressively with higher Fe₂O₃, attributed to stronger electrostatic interactions, lattice distortion, and defects, consistent with increased hydroxyl groups (Figure 8(b)) [5]. The phenomenon indicated that the doping of Fe3+ decreased the crystallization of TiO2 [16].
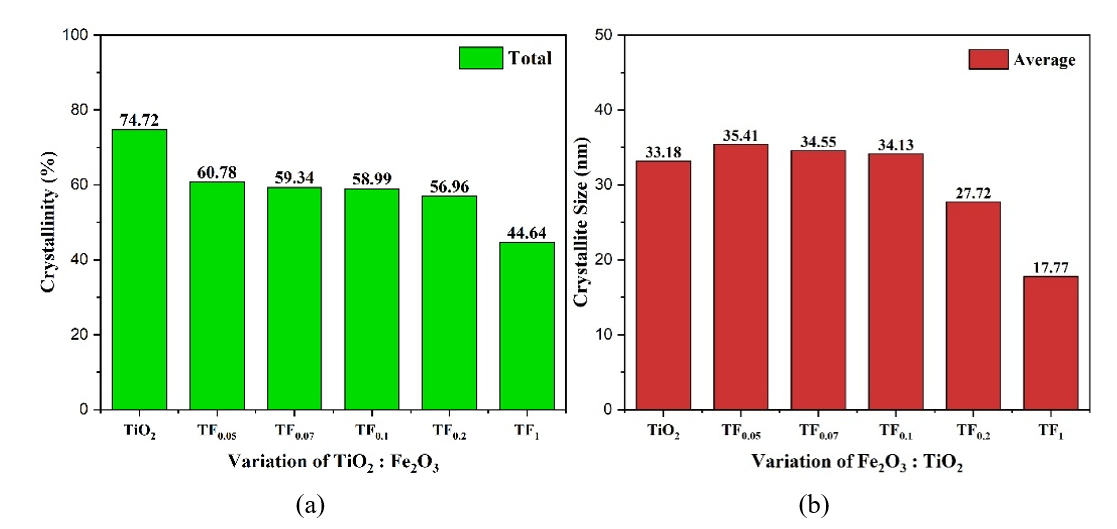
Figure 10 (a) Crystallinity index and (b) Crystal size of composite with TiO2: Fe2O3 composition.
Figure 10(b) showed that at low Fe₂O₃ contents (TF0.05 - TF0.1), crystallite size increases compared to pure TiO₂, suggesting interfacial interactions (sintering, coupling, aggregation) that promote heterojunction formation. However, at higher Fe₂O₃ levels (TF0.2 - TF1), excessive doping and distortion dominate, leading to greater deformation and reduced crystallite size. Loan et al. [11] stated that the greater the Fe3+ doping into TiO2, the smaller the crystallite size. These results confirm that Fe³⁺ doping both suppresses TiO₂ crystallization and induces size reduction, whereas interfacial effects at low Fe₂O₃ promote temporary crystallite growth.
SAA Anlaysis. SAA analysis was performed to evaluate the adsorption isotherm type as well as the influence of TiO₂: Fe₂O₃ composition on surface area and pore volume (Figure 11). Figure 11(a) displayed a type IV isotherm, characteristic of mesoporous materials (2 - 50 nm). Figure 11(b) showed that increasing Fe²⁺ and Fe³⁺ concentrations as increasing Fe2O3 content (TF0.05 - TF1) enhances both surface area and pore volume, which is attributed to stronger lattice distortion, crystal defects, structural deformation, and then promotes the formation of additional pores. As pore volume increases, the surface area also rises linearly, highlighting the dominant contribution of intraparticle porosity compared to external particle size [30]. So, at low Fe₂O₃ compositions (TF0.05 - TF0.1), the increase in pore volume and surface area is primarily attributed to the formation of new pores induced by the interfacial interaction between Fe₂O₃ and TiO₂. In contrast, at higher Fe₂O₃ compositions (TF0.2 - TF1), significant enhancement arises from Fe³⁺ incorporation into the TiO₂ lattice, which opens and enlarges internal pores.
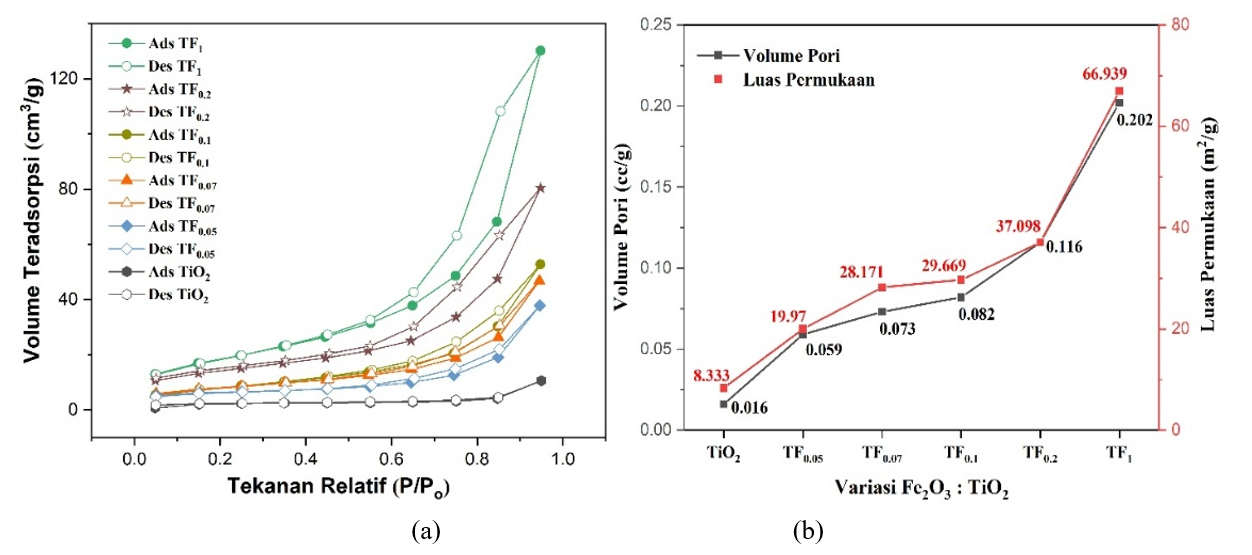
Figure 11 (a) Isotherm type and (b) Pore volume and surface area graph of composite with TiO2: Fe2O3 variation.
Bandgap Analysis. The variation in the TiO2: Fe₂O₃ ratio induces lattice distortion within TiO₂ and promotes iron oxide formation, thereby modulating both doping efficiency and interfacial interactions. These structural, optic, and electronic modifications strongly influence the bandgap of the composite, as illustrated in Figure 12. Figure 12 showed that increasing concentrations of Fe²⁺ and Fe³⁺, along with a higher Fe₂O₃/TiO₂ ratio, reduce the composite bandgap from 3.01 to 2.48 eV. This reduction is mainly attributed to the formation of heterojunctions and Fe doping, particularly Fe³⁺, which substitutes Ti⁴⁺ in the TiO₂ lattice during reaction and sintering, which introduces new electronic states within the bandgap and enhances orbital overlap between Ti 3d and Fe 3d, thus narrowing the bandgap. The doping effect is further evidenced by decreased intrinsic absorption intensity, band-tail extension toward longer wavelengths, and a redshift of the absorption edge [2,23]. Furthermore, the shift of the TiO₂ diffraction peak at 2θ = 25.31° (101) toward higher angles confirms lattice contraction due to Ti⁴⁺ substitution by Fe³⁺ [29].
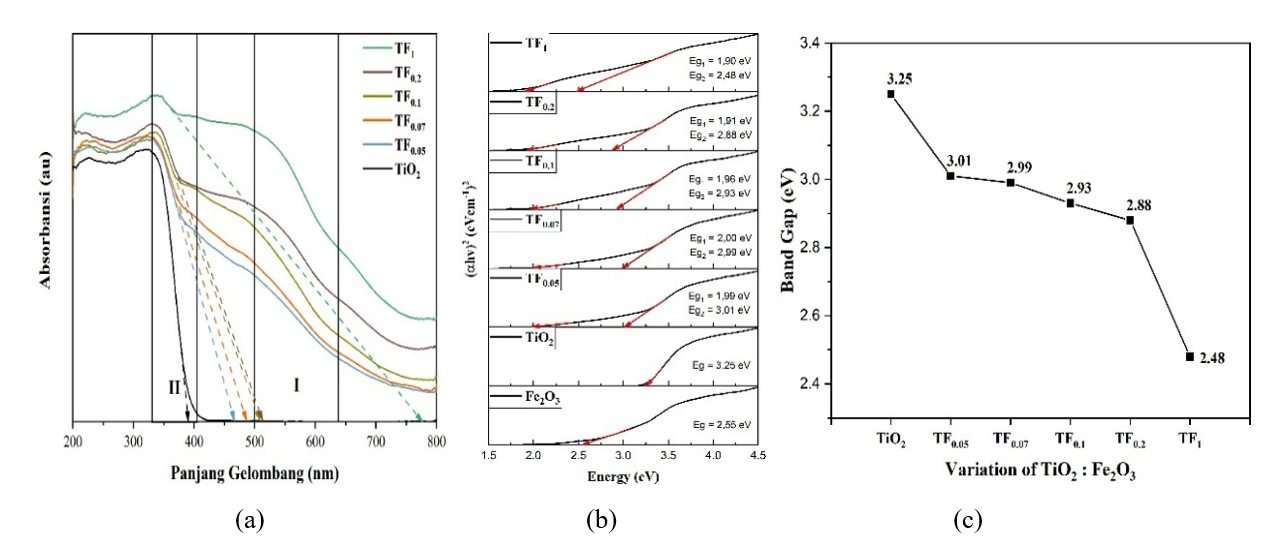
Figure 12 (a) DRS spectra, (b) tauc plots, and (c) band gap of composites with Fe₂O₃: TiO₂ compositions.
XPS Analysis. The XPS spectra of TiO₂ and its composites are shown in Figure 13. The composites were synthesized with TiO₂: Fe₂O₃ composition ratios of 1:0.1 (TF0.1), 1:0.2 (TF0.2) and 1:1 (TF1).
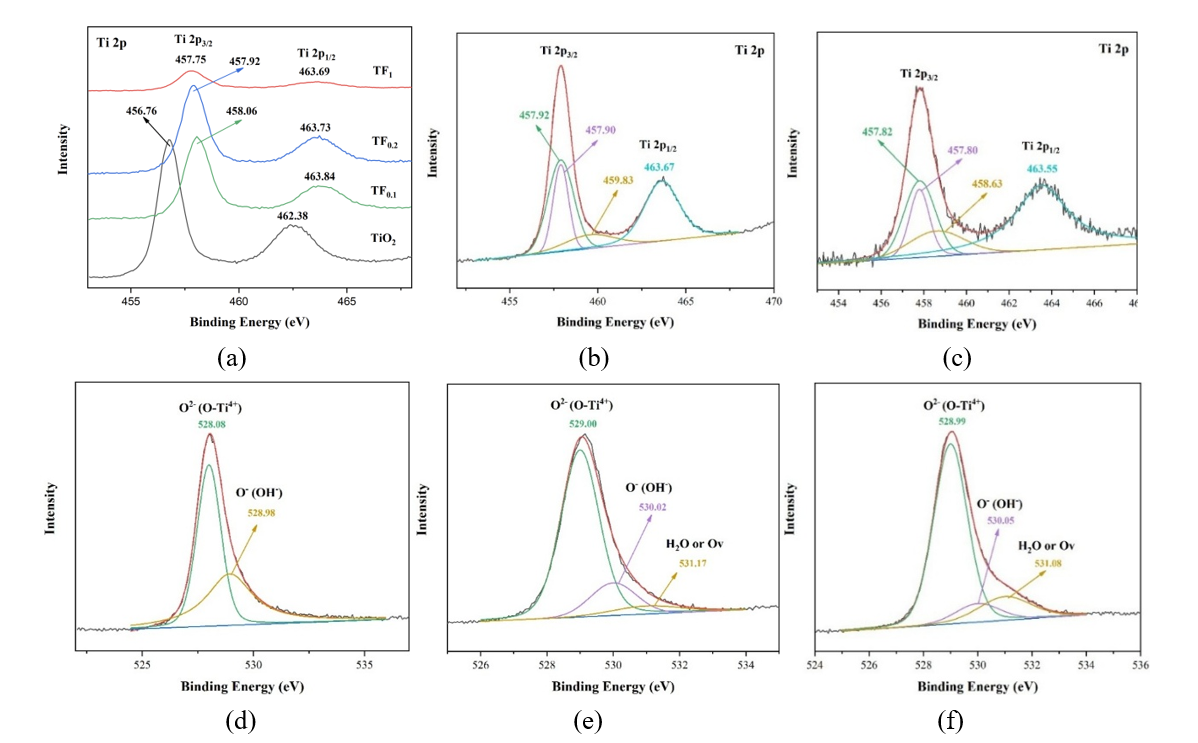
Figure 13 XPS Spectra (a) high resolution spectra (HRS) of Ti2p peak, (b) deconvolution spectra Ti2p of TF0.2, (c) deconvolution spectra Ti2p of TF1, (d) deconvolution spectra O1s of TiO2, (e) deconvolution spectra O1s of TF0.2, and (f) deconvolution spectra O1s of TF1.
Figure 13(a) has shown a shift in the Ti 2p peak with increasing Fe2O3 composition. At low Fe₂O₃ content (< TF0.1), Ti 2p peaks shift positively, indicating interfacial interaction (heterojunction) and binary oxide formation [27,31]. In contrast, at higher Fe₂O₃ loading (>TF0.1), Ti 2p peaks shift negatively (~0.1 - 0.5 eV), signifying substitutional doping, where Fe³⁺ replaces Ti⁴⁺, inducing charge imbalance, oxygen vacancies, and partial Ti⁴⁺ reduction to Ti³⁺. The emergence of a new peak at 459.83 eV in deconvolution spectra (Figures 13(b) and 13(c)) further confirms the presence of Ti³⁺ species [26,32]. Based on Figures 13(d) - 13(f), a new peak at 531.17 eV in the deconvoluted O 1s spectra, absent in pure TiO₂, is assigned to oxygen vacancies, with intensity increasing from TF0.1 to TF1 [26]. These results demonstrate that higher Fe content enhances oxygen vacancy formation and Fe-O-Ti bonding, mainly through substitutional doping.
TEM Analysis. Simultaneously addition of Fe2+ and Fe3+ into TiO2 powder affected the morphology and internal structure of the material as shown in Figure 14.
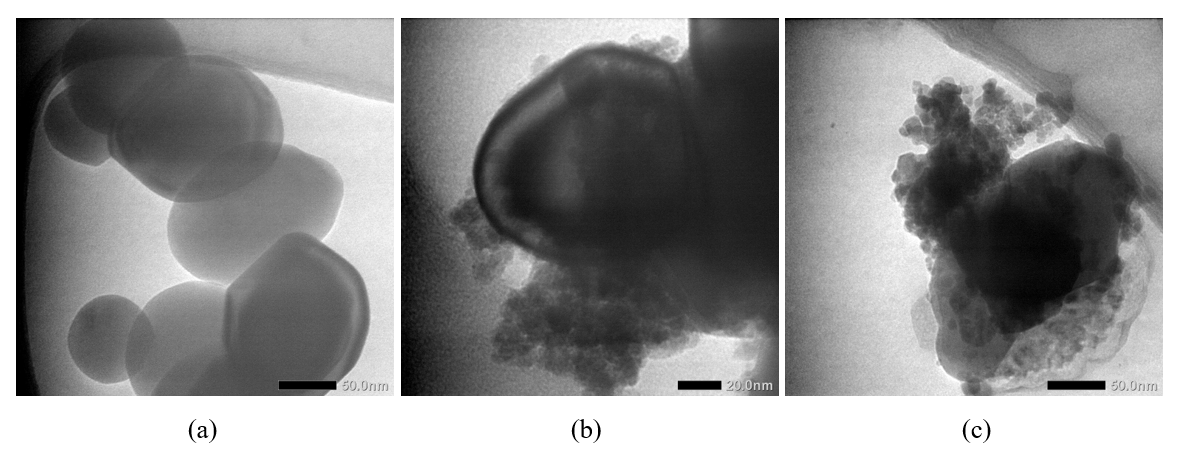
Figure 14 TEM images of (a) TiO2 (b) TF0.2 composite, and (c) TF1 composite.
In the composites, Fe₂O₃ nanoparticles appear either randomly dispersed or partially forming core-shell-like aggregates within the TiO₂ matrix, confirming the presence of Fe2O3 phases [33]. Both TiO₂ and Fe₂O₃ tend to form agglomerates or aggregates, leading to random yet partially ordered dispersion patterns [1]. This coexistence of dispersion and aggregation indicates strong TiO₂-Fe2O3 interactions, which are expected to influence the photocatalytic performance of the composites.
VSM Analysis. The magnetic behavior of the composites with TiO2: Fe2O3 ratio is presented in Figure 15(a). Increasing Fe₂O₃ content enhances the magnetization moment (Ms, emu g⁻¹), mainly due to the preferential formation of maghemite (γ-Fe₂O₃) over hematite (α-Fe₂O₃), as confirmed by XRD (Figure 9(b)). Maghemite exhibits ferrimagnetic or paramagnetic behavior, while hematite is antiferromagnetic [34]. Increasing the magnetic properties will improve the separability and make it easier to separate the photocatalyst from the solution using an external magnet, as seen in Figure 15(b).
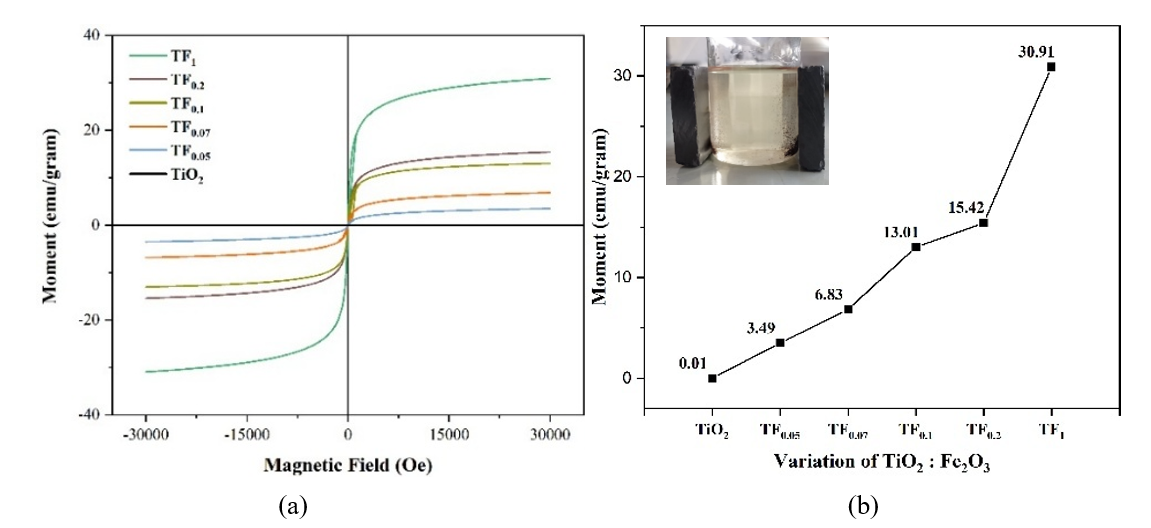
Figure 15 (a) VSM Loop hysteresis and (b) saturation magnetic (Ms) of composite with TiO2: Fe2O3 composition (insert:separation with an external magnet).
Photocatalytic activity. The variation in TiO2: Fe2O3 composition (mole/mole) has affected photocatalysis activities. as shown in Figure 16. Figure 16 showed that increasing Fe2+ and Fe³⁺ concentration as increasing Fe2O3 composition enhances the photocatalytic activity of TiO2 powder under visible-light irradiation. The increase in photocatalytic activity was also shown by increasing the composition of Fe3+ compared to Fe2+. The improvement is attributed to bandgap narrowing, reduced crystallinity and crystallite size, and enlarged surface area. Based on the results, Methyl Violet (MV) degradation is more pronounced than Cr(VI) photoreduction, suggesting that Fe³⁺ primarily functions as an electron trap rather than a hole trap.
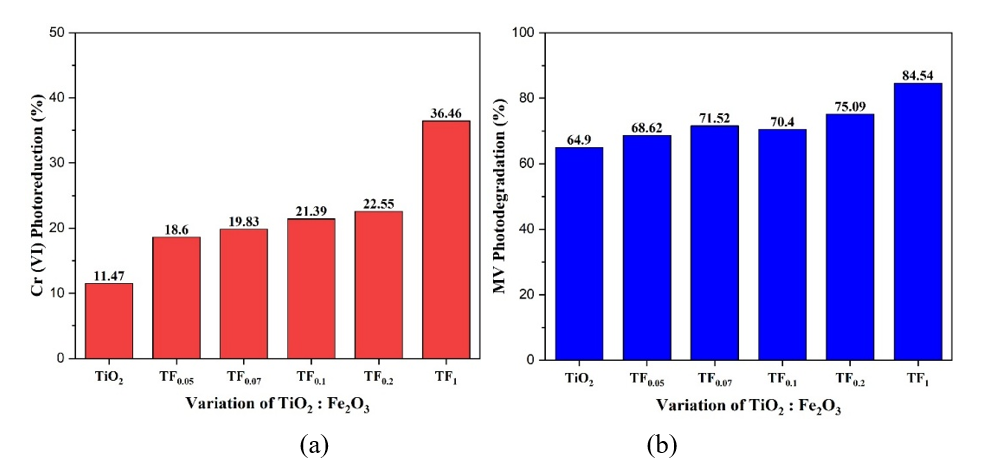
Figure 16 (a) Photoreduction of Cr(VI) and (b) MV photodegradation with TiO2: Fe2O3 composition.
Correlation Analysis. Composition of Fe₂O₃ into TiO₂ powder had significantly influenced properties and photocatalysis activities, whose coefficient correlation (r) is higher than the theoretical coefficient correlation (0.959) at α = 1% and N = 5 as shown in Table 2. Composition of Fe2O3 has negative correlation with crystal size, crystallinity, bandgap, whereas positive correlation had occurred with surface area, saturation magnetic, and photocatalytic activities of composite. Crystal size has positive correlation with crystallinity, and bandgap in nano structure, whereas negative correlation had occurred with surface area, saturation magnetic, and photocatalytic activities of composite.
Table 2 Coefficient correlation (r) between composition of Fe2O3 and dependent parameters.
Correlation with |
Composition of Fe2O3 |
Crystal size |
Crystallinity |
Bandgap |
Surface area |
Moment magnet |
Photoreduction of Cr(VI) |
Composition of Fe2O3 |
1 |
|
|
|
|
|
|
Crystal size |
‒0.9602 |
1 |
|
|
|
|
|
Crystallinity |
‒0.9968 |
0.9716 |
1 |
|
|
|
|
Bandgap |
‒0.9939 |
0.9718 |
0.9968 |
1 |
|
|
|
Surface area |
0.9765 |
‒0.9796 |
‒0.9905 |
‒0.9887 |
1 |
|
|
Moment Magnet |
0.9413 |
‒0.9603 |
‒0.9596 |
‒0.9722 |
0.9812 |
1 |
|
Photoreduction of Cr(VI) |
0.9955 |
‒0.9635 |
‒0.9979 |
‒0.9989 |
0.9882 |
0.9669 |
1 |
Photodegradation of Methyl violet |
0.9674 |
‒0.9898 |
‒0.9821 |
‒0.9743 |
0.9920 |
0.9585 |
0.9722 |
Conclusions
From the preceding discussion, the conclusions were as follows:
1) Simple modification of TiO2 powder by simultaneous addition of Fe2+ and Fe3+ ions has resulted in improved properties, enhanced visible-light response and activity although further improvements are still required.
2) Alterations in the Fe²⁺: Fe³⁺ and TiO2:Fe2O3 (TF) ratio (mole/mole) have affected composite properties with different and interesting mechanism. Overall, Fe³⁺ plays a more dominant role than Fe²⁺ in changing the properties and enhancing the photocatalytic performance of TiO₂-Fe/Fe₂O₃ composites.
3) Increasing the proportion of Fe³⁺ and Fe₂O₃ in TiO₂ powder promoted the formation of Ti-O-Fe bonds, enhanced lattice distortion and defects, reduced crystallinity, enlarged surface area, and narrowed the bandgap.
4) At lower Fe³⁺ and Fe₂O₃ contents (Fe²⁺: Fe³⁺ = 1:0.3 - 1:1; TiO₂: Fe₂O₃ = 1:0.05 - 1:0.1 mol/mol), interfacial interaction and heterojunction formation dominate, leading to increased crystallite size. In contrast, at higher concentrations (Fe²⁺: Fe³⁺ = 1:1 - 1:3; TiO₂: Fe₂O₃ = 1:0.2 - 1:1 mol/mol), substitutional doping predominates, resulting in reduced crystallite size.
5) The magnetic properties decreased with the greater formation of hematite as Fe³⁺ content increased but were enhanced by the growth of maghemite with higher Fe₂O₃ composition.
6) Increasing Fe2+ and Fe³⁺ concentration as increasing Fe2O3 composition enhances the photocatalytic activity of TiO2 powder under visible-light irradiation.
Acknowledgements
This work was supported by the Doctoral Dissertation Research Grant (PDD) 2025 from Universitas Sebelas Maret (UNS), Indonesia and the Ministry of Higher Education, Science, and Technology, Republic of Indonesia with grant numbers 369/UN27.22/PT.01.03/2025.
Declaration of Generative AI in Scientific Writing
During the preparation of this work, the author partly used ChatGPT for paraphrasing to improve the readability and language of the manuscript. After using this tool, the author reviewed and edited the content as needed and takes full responsibility for the content of the published article.
Candra Purnawan: Conceptualization; Methodology; Formal analysis; Data curation; Software, Visualization; Writing - Original draft preparation. Endang Tri Wahyuni: Conceptualization; Supervision, Investigation; Validation. Indriana Kartini: Supervision, Visualization; Formal analysis. Suherman: Supervision, Writing - Review & Editing.
[1] A Kubiak, M Kubacka, E Gabała, A Dobrowolska, K Synoradzki, K Siwińska-Ciesielczyk, K Czaczyk and T Jesionowski. Hydrothermally assisted fabrication of TiO2-Fe3O4 composite materials and their antibacterial activity. Materials 2020; 13(21), 4715.
[2] VV Shymanovska, TA Khalyavka, EV Manuilov, TA Gavrilko, A Aho, VV Naumov and ND Shcherban. Effect of surface doping of TiO2 powders with Fe ions on the structural, optical and photocatalytic properties of anatase and rutile. Journal of Physics and Chemistry of Solids 2022; 160, 110308.
[3] N Madima, KK Kefeni, SB Mishra, AK Mishra and AT Kuvarega. Fabrication of magnetic recoverable Fe3O4/TiO2 heterostructure for photocatalytic degradation of Rhodamine B dye. Inorganic Chemistry Communications 2022; 145, 109966.
[4] E Savitri, SW Yunita, C Winoto and RK Widi. Innovative waste benzene remediation by enhanced photocatalytic with TiO2/Fe3O4-Based material supported by bentonite in batch and continuous system. Trends in Sciences 2024; 21(7), 7872.
[5] C Afonso, O Lima, IR Segundo, S Landi, E Margalho, N Homem, M Pereira, MFM Costa, E Freitas and J Carneiro. Effect of Iron-doping on the structure and photocatalytic activity of TiO2 nanoparticles. Catalysts 2023; 13(1), 58.
[6] P Sun, S Han, J Liu, J Zhang, S Yang, F Wang, W Liu, S Yin, Z Ning and W Cao. Introducing oxygen vacancies in TiO2 lattice through trivalent iron to enhance the photocatalytic removal of indoor NO. International Journal of Minerals, Metallurgy and Materials 2023; 30, 2025-2035.
[7] B Taudul, F Tielens and M Calatayud. On the origin of raman activity in anatase TiO2 (Nano) materials: An Ab initio investigation of surface and size effects. Nanomaterials 2023; 13(12), 1856.
[8] SJ Babu, VN Rao, DHK Murthy, MMM Shastri, M Shetty, KSA Raju, PD Shivaramu, CSA Kumar, MV Shankar and D Rangappa. Significantly enhanced cocatalyst-free H2 evolution from defect-engineered Brown TiO2. Ceramics International 2021; 47(10), 14821-14828.
[9] AHA Gonçalves, PHC Siciliano, OC Alves, DV Cesar, CA Henriques and AB Gaspar. Synthesis of a magnetic Fe3O4/RGO composite for the rapid photo-fenton discoloration of indigo carmine dye. Topics in Catalysis 2020; 63, 1017-1029.
[10] CV Tran, PTH Nguyen, DD Nguyen, HTT Pham, DT Do and DD La. Facile fabrication of Fe2O3/TiO2 composite from titanium slag as adsorbent for As(V) removal from aqueous media. Sustainability 2023; 15(9), 7253.
[11] TT Loan, VH Huong, NT Huyen, LV Quyet, NA Bang and NN Long. Anatase to rutile phase transformation of iron-doped titanium dioxide nanoparticles: The role of iron content. Optical Materials 2021; 111, 110651.
[12] MD Patekari, KK Pawar, GB Salunkhe, PM Kodam, MN Padvi, PP Waifalkar, KK Sharma and PS Patil. Synthesis of maghemite nanoparticles for highly sensitive and selective NO2 sensing. Materials Science and Engineering: B 2021; 272, 115339.
[13] N Abbas, GN Shao, MS Haider, SM Imran, SS Park and HT Kim. Sol-gel synthesis of TiO2-Fe2O3 systems: Effects of Fe2O3 content and their photocatalytic properties. Journal of Industrial and Engineering Chemistry 2016; 39, 112-120.
[14] ES Wibowo and B-D Park. Determination of crystallinity of thermosetting urea-formaldehyde resins using deconvolution method. Macromolecular Research 2020; 28, 615-624.
[15] MS Khan, JA Shah, N Riaz, TA Butt, AJ Khan, W Khalifa, HH Gasmi, ER Latifee, M Arshad, AAA Al-Naghi, A Ul-Hamid, M Arshad and M Bilal. Synthesis and characterization of Fe-TiO2 nanomaterial: Performance evaluation for RB5 decolorization and in vitro antibacterial studies. Nanomaterials 2021; 11(2), 436.
[16] AM Oviedo, H Truong Thi, QC Van and HH Nguyen. Physicochemical properties of Fe-doped TiO2 and the application in Dye-sensitized solar cells. Optical Materials 2023; 137, 113587.
[17] R Hatefi, H Younesi, A Mashinchian-Moradi and S Nojavan. A facile decoration of anatase Fe3O4/TiO2 nanocomposite with graphene quantum dots: Synthesis, characterization, and photocatalytic activity. Advanced Powder Technology 2021; 32(7), 2410-2422.
[18] S Pan, M Zha, C Gao, J Qu and X Ding. Pore structure and fractal characteristics of organic-rich lacustrine shales of the kongdian formation, cangdong sag, bohai bay basin. Frontiers in Earth Science 2021; 9, 760583.
[19] FJ Sotomayor, KA Cychosz and M Thommes. Characterization of micro/mesoporous materials by physisorption: Concepts and case studies. Accounts of Materials & Surface Research 2018; 3(2), 34-50.
[20] S Badawy and P Pandey. Chapter 28 - design, development, and scale-up of the high-shear wet granulation process. Developing Solid Oral Dosage Forms (Second Edition) 2017; 2017, 749-776.
[21] YQ Cao, TQ Zi, XR Zhao, C Liu, Q Ren, JB Fang, WM Li and AD Li. Enhanced visible light photocatalytic activity of Fe2O3 modified TiO2 prepared by atomic layer deposition. Scientific Reports 2020; 10, 13437.
[22] A Khalid, P Ahmad, AI Alharth, S Muhammad, MU Khandaker, MRI Faruque, IU Din and MA Alotaibi. A practical method for incorporation of Fe (III) in Titania matrix for photocatalytic applications. Materials Research Express 2021; 8(4), 045006.
[23] M Gao, L Zhu, CK Peh and GW Ho. Solar absorber material and system designs for photothermal water vaporization towards clean water and energy production. Energy and Environmental Science 2019; 12(3), 841-864.
[24] E Inico, C Saetta and GD Liberto. Impact of quantum size effects to the band gap of catalytic materials: A computational perspective. Journal of Physics Condensed Matter 2024; 36(36), 361501.
[25] P Kaur and G Verma. Converting fruit waste into carbon dots for bioimaging applications. Materials Today Sustainability 2022; 18, 100137.
[26] C Wen, X Ni, M Han, Y Yu, C Liu, Y Zhang, B Zheng and S Feng. The function of photocatalytic performance and carrier separation efficiency tuned by doping content in homogeneous photocatalysts. Advanced Science 2025; 12(25), 2501026.
[27] N Kanjana, W Maiaugree, P Poolcharuansin and P Laokul. Synthesis and characterization of Fe-doped TiO2 hollow spheres for dye-sensitized solar cell applications. Materials Science and Engineering: B 2021; 271, 115311.
[28] M Coduri, P Masala, L Bianco, F Spizzo, D Ceresoli, C Castellano, S Cappelli, C Oliva, S Checchia, M Allieta, DV Szabo, S Schlabach, M Hagelstein, C Ferrero and M. Scavini. Local structure and magnetism of Fe2O3 maghemite nanocrystals: The role of crystal dimension. Nanomaterials 2020; 10(5), 867.
[29] AA Isari, A Payan, M Fattahi, S Jorfi and B Kakavandi. Photocatalytic degradation of rhodamine B and real textile wastewater using Fe-doped TiO2 anchored on reduced graphene oxide (Fe-TiO2/rGO): Characterization and feasibility, mechanism and pathway studies. Applied Surface Science 2018; 462, 549-564.
[30] MSM Zaini and SSA Syed-Hassan. Effects of different physical activation agents on adsorbent pore development and methane uptake. Recent Innovations in Chemical Engineering 2022; 15(2), 127-137.
[31] A Srivastava, JAK Satrughna, MK Tiwari, A Kanwade, SC Yadav, K Bala and PM Shirage. Effect of Ti1-xFexO2 photoanodes on the performance of dye-sensitized solar cells utilizing natural betalain pigments extracted from Beta vulgaris (BV). Energy Advances 2023; 2(1), 148-160.
[32] E Faustino, TF da Silva, RF Cunha, DRV Guelfi, PS Cavalheri, SC de Oliveira, ARL Caires, GA Casagrande, RP Cavalcante and AM Junior. Synthesis and characterization of N and Fe-Doped TiO2 nanoparticles for 2,4-Dimethylaniline mineralization. Nanomaterials 2022; 12(15), 2538.
[33] VE Novala and JG Carriazo. Fe3O4-TiO2 and Fe3O4-SiO2 core-shell powders synthesized from industrially processed magnetite (Fe3O4) microparticles. Materials Research 2019; 22(3), 20180660.
[34] PRS Baabu, HK Kumar, MB Gumpu, J Babu K, AJ Kulandaisamy and JBB Rayappan. Iron oxide nanoparticles: A review on the province of its compounds, properties and biological applications. Materials 2023; 16(1), 59.