Trends
Sci.
2026;
23(6):
12296
Unveiling the Significant Role on Synthesis of Magnetic CuFe2O4 Photocatalyst for Dye Degradation
Is Fatimah1,2,*, Lela Dwi Rahmawati1,2, Nunung Nurlaela1,2,
Suresh Sagadevan3, Mohd Rafie Bin Johan3 and Ruey-An Doong4
1Department of Chemistry, Faculty of Mathematics and Natural Sciences, Universitas Islam Indonesia,
Daerah Istimewa Yogyakarta 55584, Indonesia
2Nanomaterials and Sustainable Chemistry Research Centre, Universitas Islam Indonesia,
Daerah Istimewa Yogyakarta 55584, Indonesia
3Nanotechnology & Catalysis Research Centre, University of Malaya, Kuala Lumpur 50603, Malaysia
4Institute of Analytical and Environmental Sciences, National Tsing Hua University, Hsinchu 300044, Taiwan
(*Corresponding author’s e-mail: [email protected])
Received: 16 October 2025, Revised: 9 November 2025, Accepted: 16 November 2025, Published: 5 February 2026
Abstract
Metal ferrites have been known and utilized in various applications, including as photocatalyst for organic contaminated water treatment. In this work, exploration on synthesis of copper ferrite (CuFe2O4) by evaluating the role of synthesis method and the use of surfactant on physicochemical characteristics has been performed. Effect of hydrothermal (HT) and ultrasound-irradiation methods with and without the addition of cetyltrimethylammonium bromide (CTAB) as templating agent on physical and optical features was analysed using X-ray diffraction (XRD), scanning electron microscopy, Fourier-Transform Infra-red, particle’s size analysis, diffuse reflectance UV-Visible spectrophotometry (UV-DRS), and vibrating sample magnetometer (VSM). Photocatalytic activity of the prepared samples was examined in methyl violet photocatalytic degradation under UV and visible lights exposure. The HT treatment produced higher crystallite and particle’s size, and the increased size is correlated to decreased band gap energy of nanomaterials. In addition, the particle size which also influenced to magnetism. The band gap energy of materials are ranging at 1.71 - 2.01 eV, while magnetism ranging at 14.45 - 18.41 emu/g with the highest value gained by HT-prepared nanomaterial, while the lowest value is observed by ultrasound-irradiated method. Photocatalytic performance of the prepared materials is excellent as shown by an efficient methyl violet degradation under UV and visible light exposure. The maximum degradation of 99.9% was achieved by CuFe2O4 with the lowest band gap and largest crystallite size prepared under hydrothermal method without CTAB addition.
Keywords: Magnetic, Metal ferrite, Photocatalyst, Spinel ferrite
Introduction
In recent years, spinel ferrite magnetic materials have attracted the attention of researchers. Spinel ferrite magnetic materials have unique magnetic, electrical and optical properties and can be applied in various fields [1]. Spinel ferrites are materials with the general formula MFe2O4, where M is a divalent cation such as Zn2+, Ni2+,
Mn2+, or Cu2+. These materials have received increasing attention in recent years due to their beneficial combination of magnetic, electrical, and optical properties, suitable for a wide range of applications from data storage, biomedical and energy storage [2,3]. Spinel ferrites have shown great potential for environmental applications such as water treatment agents (heavy metal removal or catalytic destruction of organic pollutants). CuFe2O4 is a particle that has an inverse spinel crystal structure. CuFe2O4 is one of the spinel ferrites that has been utilized as catalyst and photocatalyst for various reactions. The magnetism of CuFe2O4 gives benefit for easy in separation and reusability [4].
Several methods are used for the synthesis of copper ferrite, and these play an important factor to create physicochemical characters for furthermore determine the chemical activity of the material. The methods consist of the sol-gel, mechanochemical method, coprecipitation, microemulsion, hydrothermal method (HT), ultrasound-irradiation (US) and mechanochemical methods. The coprecipitation method is one of the most used methods for synthesis due to its simple and easiness. Additionally, the combination with HT, US or microwave irradiation were applied to intensity the crystallization and particles growth [5]. Similar to some other nanoparticles synthesis, synthesis routes control the physicochemical features of material, including optical properties [6]. In addition, surfactants influence the growth of nanoparticles.
The physicochemical features are theoretically affecting the chemical activity, including optical properties and photocatalytic activity. Considering the magnetic photocatalyst is a required form in dye degradation by photocatalysis mechanisms recently, evaluation on the photocatalytic activity of CuFe2O4 is interesting to be explored. Previous works investigated the effect of HT-method and US-method on the morphology, magnetism, optical, crystallite size and infra-red radiance performance [7-9] and study of the effect of cationic surfactant on physicochemical feature of CuFe2O4 has been performed [10]. An intensive wavelength and energy supported by US accelerate coprecipitate to the fast nucleation environmentally friendly, safe and inexpensive [11,12]. Particularly, US irradiation leads to faster and more efficient material production, so it is expected to be easily controlled and produce materials that have a specific diameter with a faster rate in the deposition process [2]. However, comparative study on both HT and US methods along with effect of surfactant to the physicochemical character of CuFe2O4 nanoparticles for advance applicability as photocatalyst is not reported yet. Within this scheme, cetyltrimethylammonium bromide (CTAB) is considered as an effective templating agent by the succeed for some nanoparticles synthesis with small concentration required to control nanoparticles growth [13,14]. From these backgrounds, this study is expected to unveil the role of the use of HT method and US irradiation along with the effect of the addition of CTAB in synthesizing CuFe2O4. The comparison of HT and US method and study on the effect surfactant addition to the physicochemical and photocatalytic activity is the novelty of this work which never explored before. The physicochemical characterization was observed is using X-ray diffraction (XRD), Fourier-Transform Infra-Red (FTIR), particle size distribution (PSD), diffuse reflectance UV-Vis Spectrophotometer (UV-DRS), and VSM instruments, while got photocatalytic activity examination, methyl violet was chosen as model of dye molecule. The phenomenon on intensification during nanoparticles formation and was aimed to be studied to get an effective synthesis of CuFe2O4.
Materials and methods
Preparation of CuFe2O4
About 4 g of FeCl3.6H2O, 2.72 g of Cu(II) acetate, 2.05 g of sodium acetate and 0.007 g of sodium citrate were mixed with 200 mL of demineralized water. Into the solution, 50 mL of 0.2% of CTAB was added followed by seting up the solution to get pH 10 with the addition of NaOH solution. After furthermore followed by stirring for 1 h, the solution was transferred into a Teflon-lined autoclave, heated at 180 °C overnight. The obtained slurry from these steps was calcined at 500 °C for 2 h, and the sample was encoded as CFO-HTC.
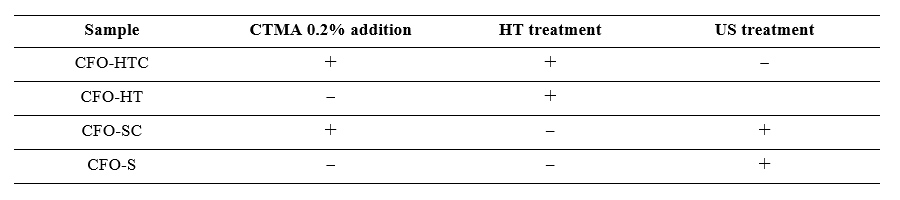
Similar procedure was performed without the addition of CTAB but in HT treatment, and the sample was encoded as CFO-HT. From US treatment, the HT traetment after coprecipitation was replaced by US irradiation to the precipitate for 1 h using commercial ultrasound chamber, and other steps are in same condition. The samples obtained from the synthesis by using CTAB and without CTAB were designated as CFO-S and CFO-SC. Figure 1 depicts the scheme of synthesis, and the summary of synthesis conditions is provided in Table 1.
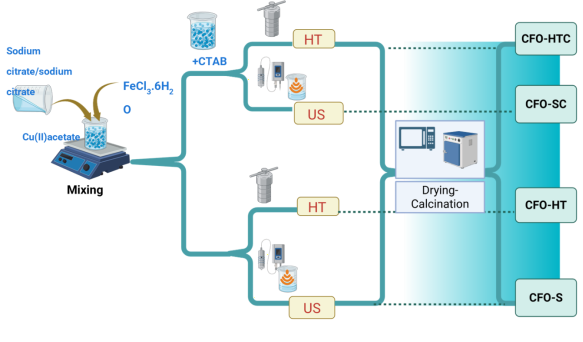
Figure 1 Scheme of synthesis.
Table 1 Resume of samples synthesis condition.
Material’s characterization
The crystallinity and phase of the prepared samples were analysed by using X-ray diffractometer (XRD) spectroscopy on Phenom X’. Ni-filtered Cu Kα irradiation (λ = 1.54) was utilized as photon source, and the measurement was recorded from 10° - 70° of diffraction angles (2θ), step size of 0.1°/step. The morphology of the prepared samples was examined by using field emission scanning electron microscope (FE-SEM). Fourier-transform Infrared Spectroscopy (FT-IR) analysis (Perkin Elmer Spectrum One, USA) was used to investigate the functional groups in the samples recorded at the 4,000 to 500 cm−1 wavelength range. Vibrating magnetometer 7400 Series VSM System (Lake Shore, Ohio) was employed for magnetism analysis, and the hysteresis measurements were performed at 300 K with magnetic field up to 0.9 T to obtain the demagnetisation corrections. Zetta-sizer Nanoseries instrument (Malvern, United Kingdom was utilized to measure the surface potential of the samples. UV-DRS of JASCO V760 was used for the band gap energy determination.
Photocatalytic activity examination
The capability of prepared CuFe2O4 as photocatalyst was evaluated by batch photocatalytic degradation experiments. Close batch experiments of photocatalytic degradation of methyl violet (MV) were conducted using a reactor equipped with UV lamp (Philips, 20 Watt) with the light intensity of 34.9 W/cm2 and xenon lamp (Philips, = 500 nm, 30 watt) with the light intensity of 32.0 W/cm2 as visible light source. In each experiment, about 0.1 g of the CuFe2O4 sample was dispersed into 100 mL of 20 mg/L of MV solution. Stirring for 15 min in a dark condition was performed prior UV light exposure. An aliquot of 5 mL was taken out from that solution after every 15 min, filtered by using syringe filters and then the MV concentration was determined by UV-Visible spectrophotometer (HITACHI U-2080, Japan). Degradation efficiency (DE) was calculated based on the percentage of reduced concentration measured by colorimetric analysis.
Results and discussion
Physicochemical characterization
The XRD diffraction patterns of the prepared sample is presented in Figure 2. From the figure, it is seen that all sample show the characteristic peaks of CuFe2O4 at 2 of 16.2°, 33.2°, 35.6°, 38.7°, 49.5°, 54.1° and 62.5° that are in good agreement with the (111), (220, (311), (222), (400), (422), (511) and (440) planes, respectively referred to the Joint Committee on Powder Diffraction (JCPDS) No. 35-0425. In addition, the HT-prepared samples; CFO-HT and CFO-HTC express additional peak at 2 = 24.22° which potentially demonstrated the presence of Fe2O3. The formation of Fe2O3occurred due to the excess Fe ions in the precursor which accelerate to be hydrated under HT pressure and temperature. Similar phenomenon was obtained in the synthesis of CuFe2O4 reported in previous works [15].
Further calculations on crystallite size based on some peaks were performed by following equation Eq. (1), and the results are provided in Table 2.
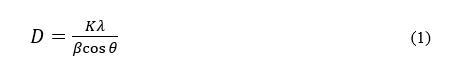
With K is k is a constant related to the crystalline shape, λ is wavelength, β is full width and half maximum (FWHM), and θ is reflection angle.
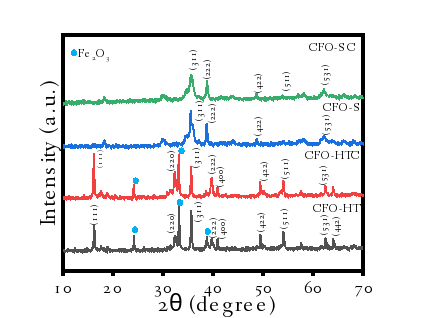
Figure 2 XRD patterns of prepared CuFe2O4
Table 2 Calculation of crystallite size based on XRD measurement.
Angle 2 |
CFO-HT |
CFO-HTC |
CFO-S |
CFO-SC |
||||
|
FWHM |
crystallite size (nm) |
FWHM |
crystallite size (nm) |
FWHM |
crystallite size (nm) |
FWHM |
crystallite size (nm) |
16.2° |
0.245 |
32.11 |
0.216 |
36.43 |
0.330 |
23.77 |
0.268 |
29.27 |
33.2° |
0.175 |
43.52 |
0.173 |
44.03 |
0.679 |
11.14 |
0.706 |
10.87 |
35.6° |
0.223 |
33.92 |
0.213 |
35.52 |
0.283 |
26.49 |
0.747 |
10.12 |
38.7° |
0.230 |
32.59 |
0.394 |
18.97 |
0.283 |
26.49 |
0.339 |
22.11 |
49.5° |
0.235 |
30.71 |
0.199 |
36.27 |
0.315 |
22.99 |
0.148 |
48.94 |
54.1° |
0.266 |
26.60 |
0.247 |
28.66 |
0.810 |
8.58 |
0.228 |
30.62 |
62.5° |
0.293 |
23.19 |
0.305 |
22.28 |
0.731 |
9.31 |
0.540 |
12.61 |
|
Mean size = 34.72 nm |
Mean size = 33.20 nm |
Mean size = 18.40 nm |
Mean size = 23.51 nm |
||||
Based on the results obtained in Table 2, it is seen that CFO-HT, CFO-HTC, CFO-S and CFO-SC have crystal sizes of 34.72, 33.20, 18.40 and 23.51 nm, respectively. The addition of CTAB into a-HT-synthesized material reduces the crystal size, meanwhile the effect is on opposite way for US-irradiation method. The reduced crystallite size by the presence of the surfactant in the crystal gowth is similar to was reported in the synthesis of CuO nanoparticles. The decomposed gel formation of CuO was obtained with the addition of CTAB surfactant and it confirmed the presence of compressive strain in the crystal lattice [16]. Similarly, the addition of Triton-X gave the smaller crystallite size of SnO2 [17]. The addition of surfactant acted as templating agent to fix the better crystallinity of the particles. As also confirmed by the FWHM data and available peaks of CuFe2O4, the HT-synthesized materials have better crystallinity rather than US-irradiated materials [18]. However, as the energy sufficiently provide faster aggregation of the particles, the surfactant promotes particle’s growth for greater size as reported in the use of polyethylene glycol (PEG) in the synthesis of ZnO [19]. Surfactant could increase monodispersion of each reactant to enhance stability of the growth particles. The surfactant concentration modulates the size of nanoparticles due to the hindrance of surfactants and interparticle interaction. Referred to the investigation on effect of surfactants for NiFe2O4 and gold nanoparticles syntheses [20,21], mechanism on hindered aggregation is represented in Figure 3.
Figure 3 Mechanism of nanoparticles growth by the addition of surfactant.
These data imply that that the addition of surfactants consisting of heads (hydrophilic) and tails (hydrophobic) can improve the properties of the synthesized particles. With the presence of surfactants, the surface tension of the solution is reduced so that it can form nucleation and the formation of new phases. However, in the US- irradiation method, the crystal size does not decrease because the reaction takes place quickly, so that the surfactant does not affect the nucleation process or it influenced to force faster aggregation.
Figure 4 FTIR spectra of materials.
FTIR spectra of the samples (Figure 4) show the absorption peaks at around 3,420 - 3,034 cm−1 associated to the peaks at around 1,622 cm−1 refer to water absorption and surface O-H groups in the spectrum of the oxides. In HT-method synthesized samples (CFO-HT and CFO-HTC), some peaks at around 900 - 800 cm−1 are reflected which are assigned to the the binding of OH with Fe and Cu [22]. In addition, there are some peaks observed at around 560 cm−1 corresponded to the vibrations of the Fe-O bonding and the peaks at around 460 - 475 cm−1 revealing the O-Cu binding. The bands are assigned to the Fe-O tetrahedral group which related to Cu-O demonstrating bond formation between iron and oxygen and cupper and oxygen, respectively [23].
Figure 5 SEM images of prepared materials.
Surface morphology of the prepared samples is expressed irregular forms of the particles, and it is a distinctive surface image presented in Figure 5. The hypothesized aggregation is confirmed by the bigger particle’s size in CFO-SC compared to other samples. In addition, both CFO-HT and CFO-HTC display the rod-like forms that are presumable for Fe2O3 as also presented from XRD analysis results [24]. Dynamic light scattering (DLS) was used to evaluate the particle’s size distribution (PSD) of the prepared materials, and the results are presented in Figure 6.
Figure 6 Particle’s size distribution of (a) CFO-S, (b) CFO-SC, (c) CFO-HT, and (d) CFO-HTC.
The particle’s size of HT-prepared materials demonstrated the larger particle’s size compared to coprecipitation method. The faster crystal growth could be provided temperature and pressure in HT condition. In more detail, the addition of CTE reduces the particle’s size suggesting the capping agent effect of secondary metabolite of the extract referred to the colloidal stability of crystal growth in the system. Effect of extract concentration influences the colloidal system and sintering to form the particles. This phenomenon was expressed in the formation of SnO2 and GdPO4·nH2O nanoparticles [25,26].
Magnetic properties
The magnetic properties of the samples were studied using VSM at room temperature, and the hysteresis curves are depicted in Figure 7. It can be observed that in general, all samples exhibit ferromagnetic behaviour with magnetism (Ms) and finite coercivity (Hc). The highest magnetism is expressed by CFP-HT with the magnetism of 18.41 emu/g and the less magnetism is observed from CFO-S with 14.45 emu/g. By plotting the relationship between crystallite size and magnetism, it could be concluded that the magnetism is associated with the larger crystallite size as similar to was reported by the synthesized CuFe2O4 using honey mediated sol-gel combustion method [27]. Meanwhile the coercivity is related to the phase anisotropy of tetragonal and hexagonal in spinel ferrite structure. The magnetism values from these are also comparable to was reported as with similar range of crystallite size, the magnetisms area at around 11 - 19 emu/g. Similar range is also considered by the prepared CuFe2O4 with crystallite size of 15 nm expressing the magnetism of 11 emu/g [28]. The smaller crystallites generally lead to increase surface effects and disordered layers meanwhile larger crystallites can alter the transition from single domain to multi-domain states, but some other factors such as the morphology of nanoparticles and the presence of other minerals or organic component could influence reduce the magnetism. Thus, the smaller crystallite size influences the magnetic properties for weaker magnetization and higher coercivity [29]. Table 3 summarizes the crystallite size and magnetism of similar works.
Table 3 Crystallite size and magnetism of prepared CuFe2O4 with present work.
Crystallite size (nm) |
Magnetism (emu/g) |
Reference |
14.5 - 22.3 |
10.2 - 35.4 |
[28] |
43.9 |
15.4 |
[30] |
17.5 |
11.66 |
[31] |
20 - 30 |
31.4 |
[32] |
40 - 50 |
23.5 |
[33] |
23.51 - 34.72 |
14.45 - 18.41 |
This work |
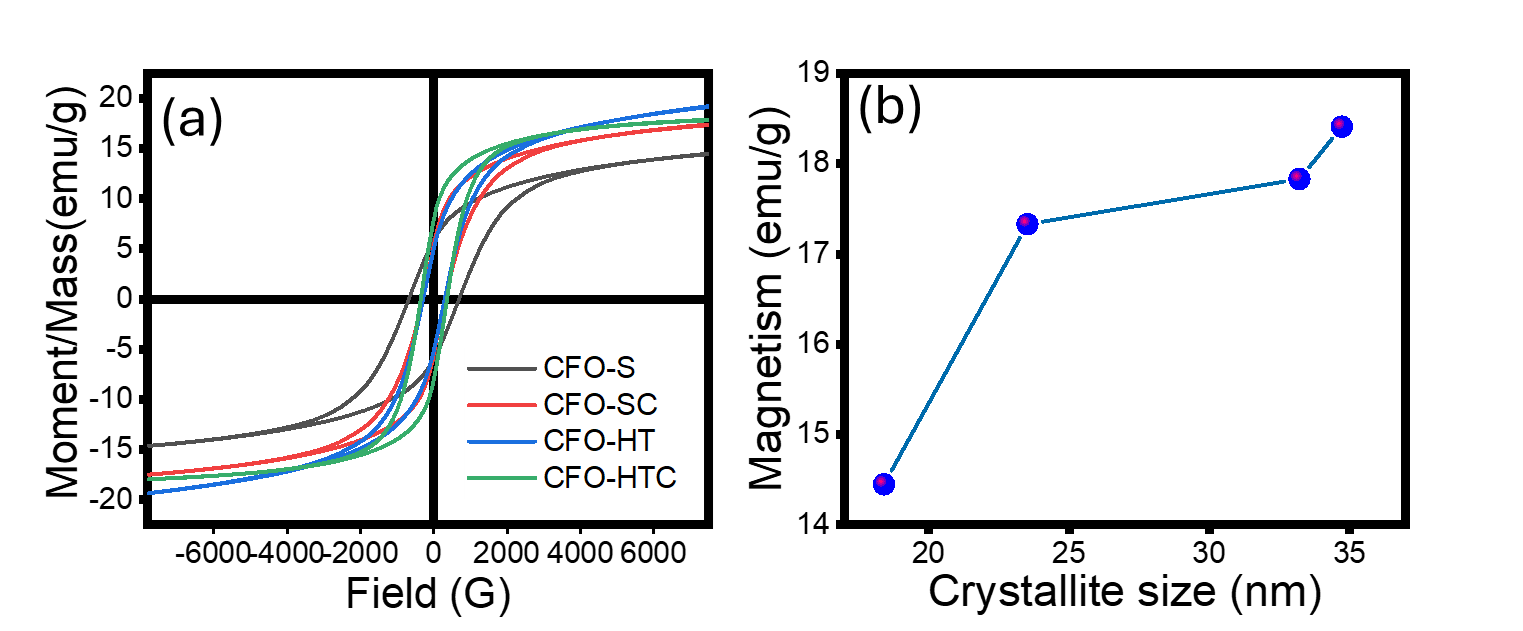
Figure 7 (a) Magnetism of samples and (b) Correlation of crystallite size and magnetism.
Optical properties
The optical property of the prepared materials was evaluated by UV-DRS spectroscopy to determine the band gap energy (Eg). Based on the spectra, Eg was calculated using the Tauc’s method referred to equation:
![]()
With is absorption co-efficient, ħ isPlankʼs constant, and is the frequency of a photon, with n = 2. The Eg values are based on the intrapolation of the graphs between (ahv)2 versus hv as depicted in Figure 8. The calculation gives the Eg values of 2.00, 2.01, 1.71 and 1.81 eV for CFO-S, CFO-SC, CFO-HT and CFO-HTC, respectively. By The smaller crystallite size and higher bandgap energy for NZMF are correlated by the quantum confinement effect. Based on previous research, the crystallite size and particle’s size determine the band gap energy as the higher size contributes to reducing the band gap energy. Investigations into CdTe, ZnS, CdSe, ZnSe, and ZnTe nanoparticles revealed that increased particle size the band gap energy of semiconductor nanomaterials reduces as their particle size increases [34,35].
Investigation resumed the altering optoelectronic properties of InX semiconductor nanoparticles with X = As, Sb, and P significantly dependent on the size and nanoparticles. The blue shifts of optical absorption spectra related to an improved exciton confinement and stronger quantum size effects by smaller nanoparticles. Additionally, morphology and shape of the nanoparticles affect to the density and electronic band structures to change the dynamics and recombination of charge carriers [36]. The correlation between particle’s size and band gap energy of prepared samples is plotted in Figure 8(e). The plot tends a non-linear correlation which is similar to was reported from InX nanoparticles and Nano-TiO2 [37,38].
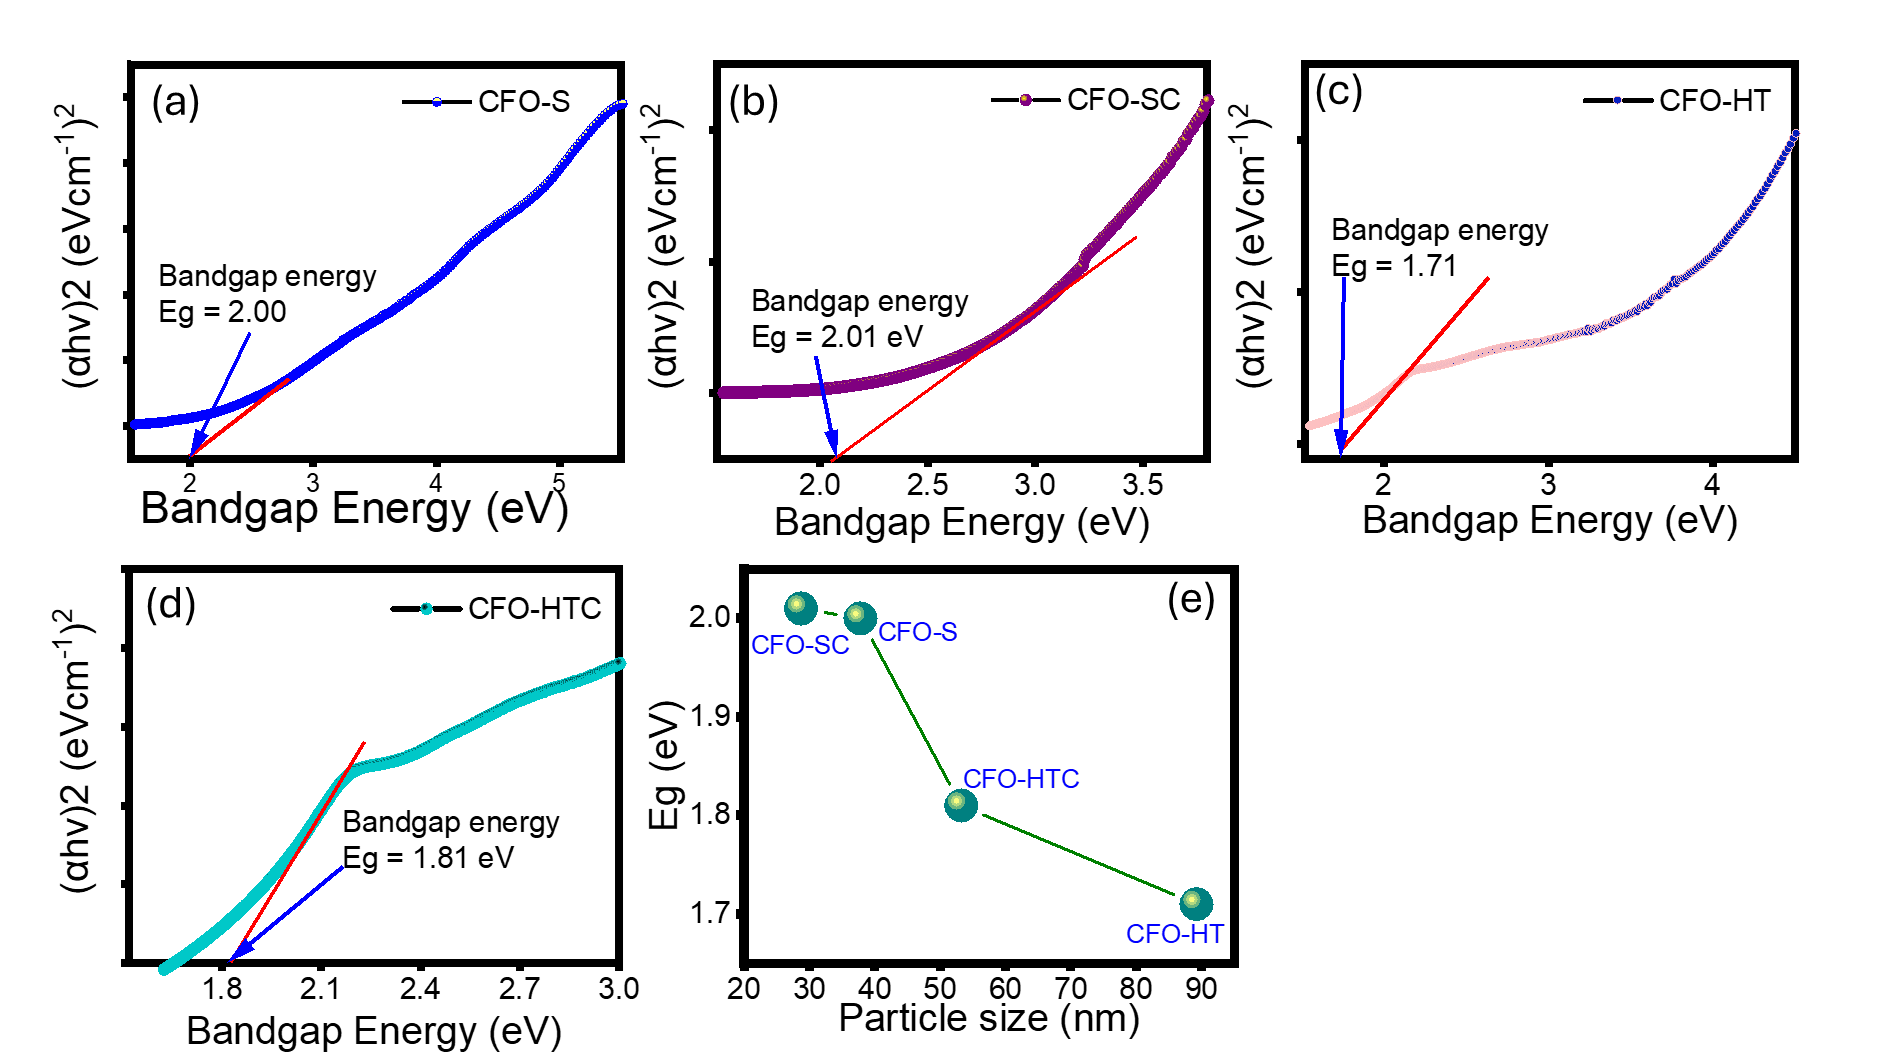
Figure 8 (a) - (d) UV-DRS spectra of prepared materials, (e) Effect of particle’s size on Eg.
Photocatalytic activity
The photocatalytic behaviour of the prepared materials was examined on MV degradation on a batch reaction system under UV and visible light exposure. The kinetics evaluation based on concentration change of MV at interval time. The spectral changes of treated MV under UV and visible light are presented in Figures 7(a) - 7(b). Based on the spectral changes, the kinetics plots and the resumed DE are provided in Figures 7(c) - 7(e). There is significant reduced absorbance of the solution by the photocatalytic treatments either by UV or visible light, implying the degradation mechanism of towards MV. The identified degradation is confirmed by the significant difference among the spectral changes and the plots obtained from the photocatalytic treatments respect to the adsorption treatment. Based on the kinetics data, the provided optical properties of all prepared samples are sufficiently supporting the formation of oxidant to degrade MV compound by their interactions with light sources. Based on RE values, it is considered that the activity of the samples is with following order: CFO-HT>CFO-HTC>CFO-S>CFO-SC. The highest photocatalytic activity achieved by CFO-HT was 99.9%, and it seems that it is in opposite directions with the increased band gap energy. In addition, for all sample, the DE values gained under visible light exposure are higher than that of UV-light exposed treatment.
In this case, the lower band gap energy allows to the faster electron excitation to create radicals for faster oxidation mechanism. Similar phenomenon was observed in the Cu/ZnO composite which the enhanced activity is related to the lowering band gap energy [39]. Similarly, the reduction of band gap of NiSnO3 and ZnS/TiO2 causes enhanced optical absorption to facilitate photocatalytic degradation [40,41]. The data suggest that the capability of the samples to absorb photon is suitable with the range of the band gap energy. The higher photoactivity of HT samples could be related to the presence of Fe2O3. As byproduct or impurity of the synthesis, the combination of small amount Fe2O3 with CuFe2O4 could support the photocatalytic mechanism via Z-scheme as also reported by previous works [42,43]. The proposed scheme is presented in Figure 9.
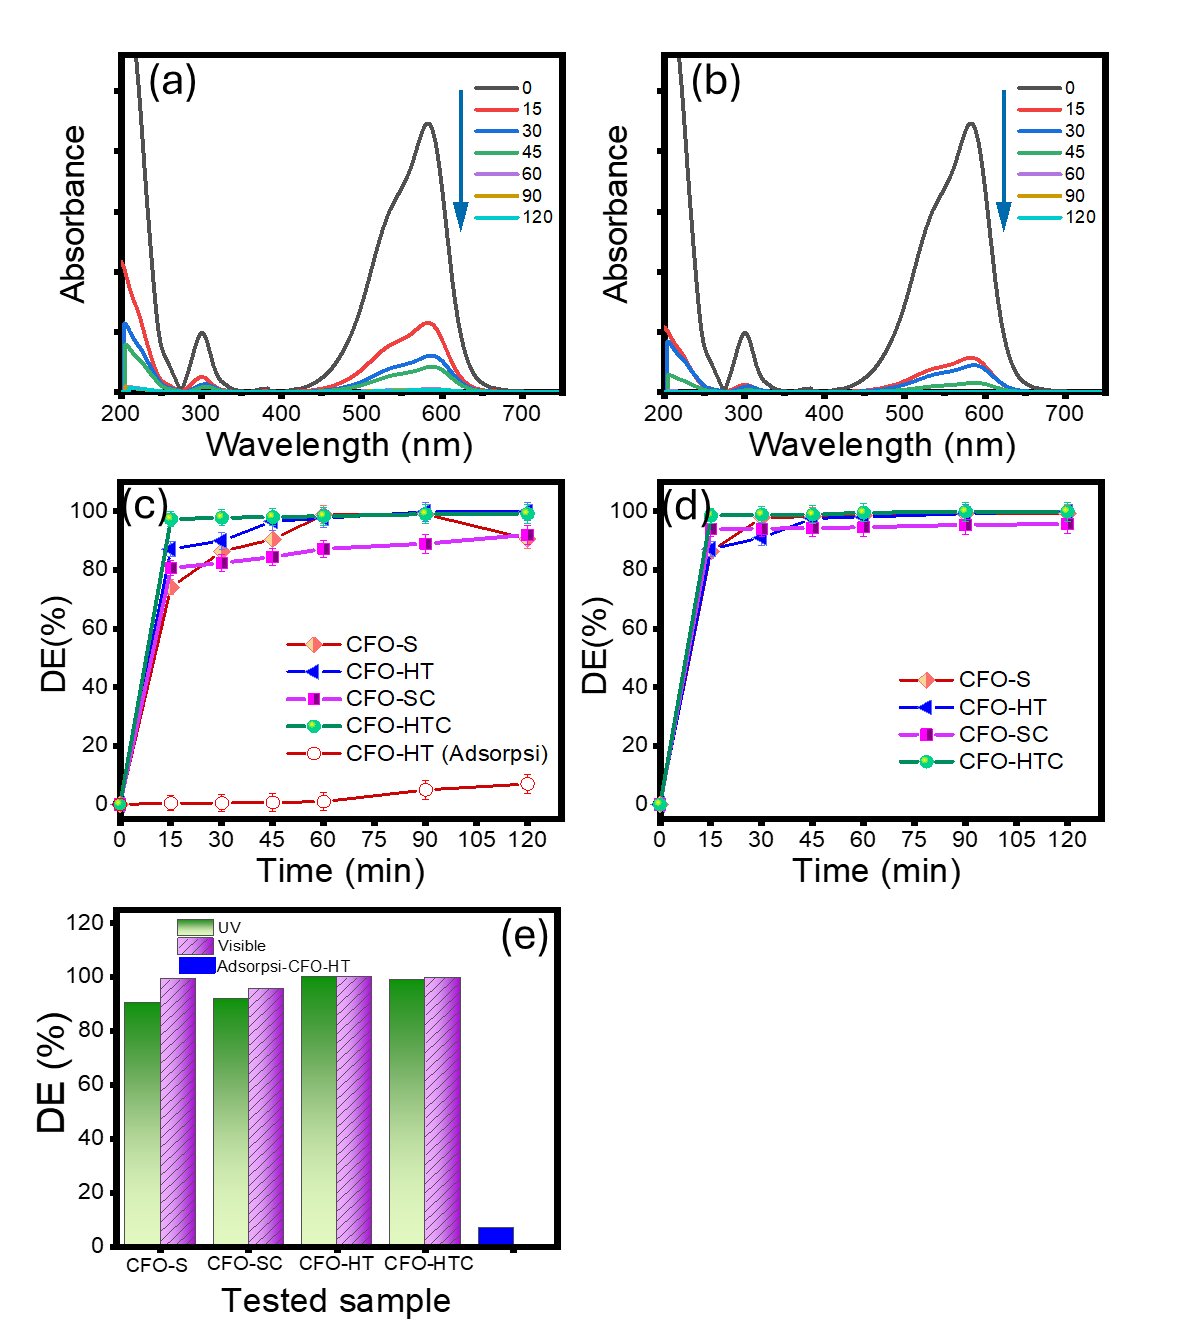
Figure 9 (a) and (b) Spectral changes of treated MV using CFO-HT under UV and visible light, respectively, (c) and (d) Kinetics plots of MV degradation using prepared samples under UV and visible light, e. Resumed DE gained by treatment on the prepared samples.
Based on kinetics data, the photocatalytic degradation of MV obeys first-order kinetic model theory expressed by equation:
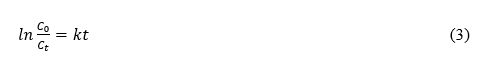
where k represents reaction rate constant (min−1), C0 and Ct are the concentrations of MV at initial and at reaction time of t. The plots and calculated k values referred to the equation are presented in Figure 10. Resumed DE and k values for each process using prepared materials are presented in Table 4.
Table 4 Recapitulated DE and k values of the treatments using prepared materials.
Sample |
Photocatalytic treatment using UV light |
Photocatalytic treatment using visible light |
||
DE (%) |
k (min−1) |
DE (%) |
k (min−1) |
|
CFO-HTC |
99.1 |
1.29×10⁻² |
99.83 |
5.00×10⁻² |
CFO-HT |
99.9 |
5.60×10⁻² |
99.90 |
3.83×10⁻² |
CFO-SC |
91.96 |
5.13×10⁻³ |
95.60 |
3.77×10⁻³ |
CFO-S |
90.58 |
4.70×10⁻³ |
99.23 |
3.00×10⁻² |
The values evidence and in accordance with the performance of materials. In general, all DE data represents a comparable activity to similar materials were reported by previous works as listed in Table 5. In addition, the fitness of MV degradation reaction to the pseudo-first order kinetics is summarized from all listed works.
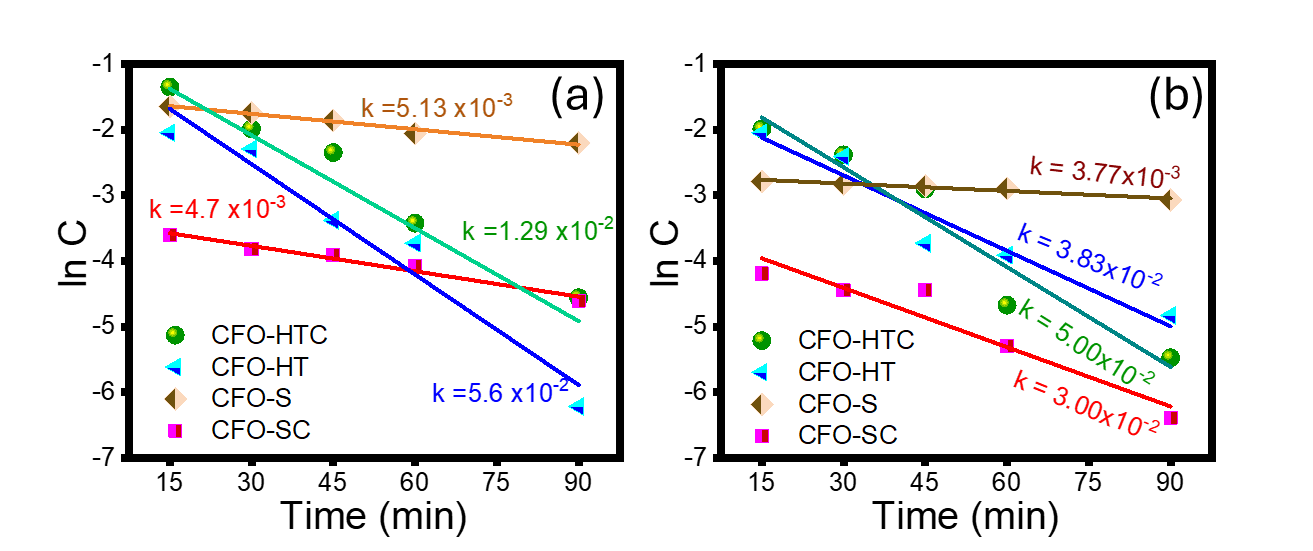
Figure 10 Pseudo-first order plots of MV degradation using prepared samples using (a) UV light and (b) visible light.
Table 5 Comparison on photocatalytic activity of CuFe2O4 and related materials for MV degradation.
Sample |
Remark |
DE (%) |
Reference |
CuFe2O4 |
The prepared CuFe2O4 has a band gap energy of 1.8 eV. The DE applied for 15 mg/L of MV was 98% by treatment under halogen lamp (λ ˃ 400 nm) |
98 |
[44] |
CuFe2O4 and CuFe2O4/clays |
A degradation efficiency of 78% was gained by the material for MV degradation for 60 min under UV light illumination. The increased degradation was achieved by combination in CuFe2O4/clay. |
78 and 98 |
[45] |
CuFe2O4@CeO2 |
CuFe2O4@CeO2 nanocomposite shows an excellent MV degradation rate of 95.35% under visible-light irradiation within 1.5 h |
95.35 |
[46] |
CuFe2O4 and Ag-CuFe2O4 |
The degradation efficiency for MV by was 60% and 82.7%, respectively. The reaction was applied for 8 ppm of MV under visible light for 160 min |
60 and 82.7 |
[47] |
CuFe2O4 |
The nanomaterial was prepared using HT-assisted method and utilizing CTAB as surfactant. The band gap energy of material is 1.71 eV. |
99.9 |
This work |
Mechanism of photocatalysis
It has been discussed elsewhere that the photocatalyst play role to create the radicals as the surface absorb energy from light. The sufficient energy from photon leads to electron excitation and the formation of hole (h+). The interaction among h+ and OH creates radicals which furthermore, by interactions with O2 could form superoxide radicals OOH. From the excited electron, the interaction of surface with O2 could produce can produce superoxide radicals (O2). The oxidation potential of these species is the main reactant for dye degradation. To investigate the contributing species in the dye degradation mechanism, kinetics evaluation of the reaction by the addition of scavengers was performed. Isopropanol (IPR), EDTA and BQ were employed as OH, h+ and OOH scavengers, respectively. The chart provided in Figure 11 suggests that the addition of IPR is the most influential scavenger to inhibit the reaction, followed by BQ and EDTA. This implies that the excitation of electron plays the most important role for creating oxidant. Furthermore, the created radicals propagate the formation of other oxidant species, referred to following mechanism:
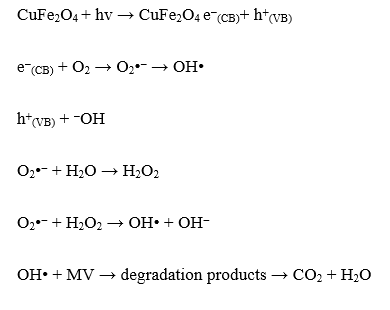
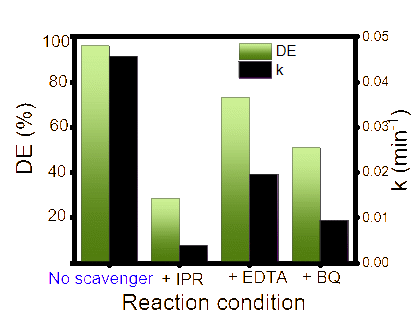
Figure 11 Effect of scavengers on DE and kinetics constant.
Conclusions
This study provides a detailed analysis on effect of hydrothermal and ultrasound-irradiation procedures in the synthesis of CuFe2O4. The results indicate that the synthesis route affected the crystallite size, magnetism, and band gap energy of the nanoparticles. The presence of CTAB surfactant and templating agent governs the crystallite growth, which also depends on the temperature and pressure of the crystallization. This impact to different effect on crystallization under ultrasound-irradiation and hydrothermal condition. The increased crystallite size led to the enhanced magnetism and higher band gap energy. Moreover, the lower band gap energy determines as an important factor to increase photocatalytic activity. An excellent photocatalytic activity was expressed by the high efficiency towards methyl violet degradation. Maximum degradation efficiency of 99.9% was achieved on 120 min photocatalytic treatment under visible light on CuFe2O4 prepared under hydrothermal synthesis without CTAB addition.
Declaration of Generative AI in Scientific Writing
There is no AI tools used for research and manuscript preparation.
CRediT Author Statement
Is Fatimah: Conceptualization; Methodology; Software. Lela Dwi Rahmawati: Data curation; Writing - Original draft preparation. Nunung Nurlaela: Data curation; Writing - Original draft preparation. Suresh Sagadevan: Visualization; Investigation. Mohd Rafie bin Johan: Supervision- Reviewing and Editing. Ruey-an Doong: Methodology- Data Curation-Reviewing and Editing.
References
[1] JR la Calvo-De and M Segarra. Optimization of the synthesis of copper ferrite nanoparticles by a polymer-assisted sol-gel method. ACS Omega 2019; 4(19), 18289-18298.
[2] FH Mulud, NA Dahham and IF Waheed. Synthesis and characterization of copper ferrite nanoparticles. IOP Conference Series: Materials Science and Engineering 2020; 928, 072125.
[3] MQ Fahem, MH Jawad, RO Abdulsada and ZT Turki. The structure and electrical properties of NiFe2O4 and NiMgFe2O4 prepared via sol-gel method. Ionics 2024; 31, 6475-6481.
[4] SP Keerthana, R Yuvakkumar, G Ravi, S Pavithra, M Thambidurai, C Dang and D Velauthapillai. Pure and Ce-doped spinel CuFe2O4 photocatalysts for efficient rhodamine B degradation. Environmental Research 2021; 200, 111528.
[5] MH Jawad, AA Assi and AM Hameed. Hydrothermal synthesis of zinc oxide nanostructures using varied reactor designs: A comparative study. Plasmonic 2025; 20, 7883-7894.
[6] G Nabiyouni, D Ghanbari, A Yousofnejad, M Seraj and Z Mirdamadian. Microwave-Assisted synthesis of CuFe2O4 nanoparticles and Starch-Based magnetic nanocomposites. Journal of Nanostructures 2013; 3(2), 155-160.
[7] H Hou, G Xu, S Tan and S Xiang. A facile hydrothermal synthesis of nanoscale CuFe2O4 spinels with enhanced infrared radiation performance. Journal of Alloys and Compounds 2018; 735, 2205-2211.
[8] U Naresh, RJ Kumar and T Ram. Optical properties of copper ferrite nano-particle synthesized via hydrothermal technique. Bulletin of Pure & Applied Sciences- Physics 2018; 37(2), 172.
[9] T Ramesh, V Madhavi, PV Rao, K Vagdevi, N Basavegowda and KH Baek. Impact of ultrasonic-assisted co-precipitation synthesis and ultrasonication duration on cobalt ferrite nanostructures: A comparative study of structural, morphological, optical and magnetic properties. Inorganic Chemistry Communications 2025; 174(1), 114035.
[10] P Paramasivan and P Venkatesh. Controllable synthesis of CuFe2O4 nanostructures through simple hydrothermal method in the presence of thioglycolic acid. Physica E: Low-Dimensional Systems and Nanostructures 2016; 84, 258-262.
[11] AR Abbasian, SS Hosseini, M Shayesteh, MS Afarani and MR Esmaeilzaei. Ultrasonic-assisted solvothermal synthesis of self-assembled Copper Ferrite nanoparticles. International Journal of Nano Dimension 2020; 11(2), 130-144.
[12] SF Rus, P Vlazan, S Novaconi, P Sfirloaga and I Grozescu. Synthesis and characterization CuFe2O4 nanoparticles prepared by the hydrothermal ultrasonic assisted method. Journal of Optoelectronics and Advanced Materials 2012; 14(3), 293-297.
[13] A Memar, CM Phan and MO Tade. Influence of surfactants on Fe2O3 nanostructure photoanode. International Journal of Hydrogen Energy 2012; 37(22), 16835-16843.
[14] AS Patil, RT Patil and VJ Fulari. Surfactant assisted synthesis of CuO nanostructures for nonenzymatic glucose sensor. Materials Today: Proceedings 2021; 46(6), 2340-2346.
[15] KW Jeon, JW Park, RR Lee, JH Gong, WJ Jang, JO Shim and YW Ju. Facile synthesis of CuFe2O4 catalyst by the electrospinning method to produce hydrogen via the water gas shift of waste-derived syngas. Journal of Environmental Chemical Engineering 2023; 11(3), 110105.
[16] I Singh and RK Bedi. Surfactant-assisted synthesis, characterizations, and room temperature ammonia sensing mechanism of nanocrystalline CuO. Solid State Sciences 2011; 13(11), 2011-2018.
[17] S Karuppiah, S Thangaraj, SA Palaniappan and SO Lakshmanan. Influence of surfactants on structural, morphological, optical and antibacterial properties of SnO2 nanoparticles. IET Nanobiotechnology 2019; 13(9), 952-956.
[18] H Liu, S Ji, H Yang, H Zhang and M Tang. Ultrasonic-assisted ultra-rapid synthesis of monodisperse meso-SiO2@Fe3O4 microspheres with enhanced mesoporous structure. Ultrasonics Sonochemistry 2014; 21(2), 505-512.
[19] CC Vidyasagar and YA Naik. Surfactant (PEG 400) effects on crystallinity of ZnO nanoparticles. Arabian Journal of Chemistry 2016; 9(4), 507-510.
[20] RS López, VF Puntes, NG Bastús, C Hervés and C Jaime. Nucleation and growth of gold nanoparticles in the presence of different surfactants. A dissipative particle dynamics study. Scientific Reports 2022; 12, 13926.
[21] RS Babu, E Madai, DS Nair, P Gonugunta, SM Armaki, R Hendrikx, T Panneerselvam, R Murugan, VVRK Kumar, P Taheri, A Mol, N Satyanarayana and PR Anusuyadevi. Effect of synthesis conditions on morphology, surface chemistry and electrochemical performance of nickel ferrite nanoparticles for lithium ‑ ion battery applications. Journal of Materials Science: Materials in Electronics 2025; 36, 865.
[22] M Sharma, G Sharma, N Tyagi, AM Siddiqui and M Khanuja. Advanced photocatalytic degradation of textile dyes and removal of heavy metal ions from MFe2O4 using photo-Fenton mechanism. Journal of Materials Science: Materials in Electronics 2024; 35, 497.
[23] A Meidanchi and H Ansari. Copper spinel ferrite superparamagnetic nanoparticles as a novel radiotherapy enhancer effect in cancer treatment. Journal of Cluster Science 2020; 32, 657-663.
[24] B Ghalib and M Hessien. Magnetic and antibacterial properties of substituted cobalt spinel ferrite nanocomposites synthesized via henna green microwave hydrothermal method. Scientific Reports 2025; 15, 16653.
[25] I Fatimah, G Purwiandono, MH Jauhari, AAAP Maharani, S Sagadevan, WC Oh and RA Doong. Synthesis and control of the morphology of SnO2 nanoparticles via various concentrations of Tinospora cordifolia stem extract and reduction methods. Arabian Journal of Chemistry 2022; 15(4), 103738.
[26] M Janulevicius, V Klimkevicius, A Vanetsev, V Plausinaitiene, S Sakirzanovas and A Katelnikovas. Controlled hydrothermal synthesis, morphological design and colloidal stability of GdPO4·nH2O particles. Materials Today Communications 2020; 23, 100934.
[27] RS Yadav, I Kuřitka, J Vilcakova, J Havlica, J Masilko, L Kalina, J Tkacz, M Hajdúchová and V Enev. Structural, dielectric, electrical and magnetic properties of CuFe2O4 nanoparticles synthesized by honey mediated sol-gel combustion method and annealing effect. Journal of Materials Science: Materials in Electronics 2017; 28, 6245-6261.
[28] MK Satheeshkumar, ER Kumar, C Srinivas, G Prasad, SS Meena, I Pradeep, N Suriyanarayanan and DL Sastry. Structural and magnetic properties of CuFe2O4 ferrite nanoparticles synthesized by cow urine assisted combustion method. Journal of Magnetism and Magnetic Materials 2019; 484, 120-125.
[29] X Wang, M Zhu, LK Koopal, W Li, W Xu, F Liu, J Zhang, Q Liu, X Feng and DL Sparks. Effects of crystallite size on the structure and magnetism of ferrihydrite. Environmental Science Nano 2016; 3(1), 190-202.
[30] TR Neves, LFL Schildt, MLLSE Silva, VVV Vasconcelos, CD Conzo, F Mura, M Rossi, G Varvaro, M Abdolrahimi, S Quaranta, SAD Ferreira and EC Paris. Magnetic CuFe2O4 nanoparticles immobilized on modified rice husk-derived zeolite for chlorogenic acid adsorption. Magnetochemistry 2024; 10(11), 87.
[31] S Anandan, T Selvamani, G Guru Prasad, AM Asiri and JJ Wu. Magnetic and catalytic properties of inverse spinel CuFe2O4 nanoparticles. Journal of Magnetism and Magnetic Materials 2017; 432, 437-443.
[32] M Awad and I Zhitomirsky. Magnetic CuFe2O4 spinel-polypyrole pseudocapacitive composites for energy storage. Materials 2024; 17(21), 5249.
[33] S Singhal, T Namgyal, N Laxhmi and S Bansal. Doping assisted structural transition in copper substituted MgFe2O4 ferrite: Thermal, electrical and magnetic properties. Scientia Iranica 2013; 20(6), 2323-2331.
[34] M Singh and A Singhal. Modeling of shape and size effects for the band gap of semiconductor nanoparticles. In: Proceedings of the 2018 2nd International Conference on Micro-Electronics and Telecommunication Engineering (ICMETE), Ghaziabad, India. 2018, p. 339-342.
[35] HV Ganvir, B Jonathan, KS Kumar, VP Raju, K Prabhakaran and NP Hegde. Validation of size of semiconductor nano material: Effect on size and shape. Communication on Applied Nonlinear Analysis 2025; 32(2), 113-122.
[36] GT Sherka and HD Berry. Insight into impact of size and shape on optoelectronic properties of InX (X = As, Sb, and P) semiconductor nanoparticles: A theoretical study. Frontiers in Physics 2024; 12, 1447997.
[37] M Singh, M Goyal and K Devlal. Size and shape effects on the band gap of semiconductor compound nanomaterials. Journal of Taibah University for Science 2018; 12(4), 470-475.
[38] A Gautam, K As, S Banerjee, D Vv and K Pk. UVC-Shielding by Nano-TiO 2/PMMA composite: A chemical approach. Journal of Materials Science & Nanotechnology 2016; 4(1), 105.
[39] A Modwi, MA Ghanem, AM Al-Mayouf and A Houas. Lowering energy band gap and enhancing photocatalytic properties of Cu/ZnO composite decorated by transition metals. Journal of Molecular Structure 2018; 1173, 1-6.
[40] M Khatun, P Mitra and S Mukherjee. Effect of band gap and particle size on photocatalytic degradation of NiSnO3 nanopowder for some conventional organic dyes. Hybrid Advances 2023; 4, 100079.
[41] S Khosravi, N Chaibakhsh, S Jafari and M Nilkar. Enhanced photocatalytic activity of ZnS/TiO2 nanocomposite by nitrogen and tetrafluoromethane plasma treatments. Scientific Reports 2024; 14(1), 28385.
[42] S Hussain, S Hussain, A Waleed, MM Tavakoli, Z Wang, S Yang, Z Fan and MA Nadeem. Fabrication of CuFe2O4/α-Fe2O3 composite thin films on FTO Coated Glass and 3-D Nanospike structures for efficient photoelectrochemical water splitting. ACS Applied Materials & Interfaces Journal 2016; 8(51), 35315-35322.
[43] A Alnehia, M Hadi, H Alnahari and A Al‑Sharabi. Optical, structural and antibacterial properties of phase heterostructured nanocomposite. Scientific Reports 2024; 14(1), 14392.
[44] A Aslam, MZ Abid, K Rafiq, A Rauf and E Hussain. Tunable sulphur doping on CuFe2O4 nanostructures for the selective elimination of organic dyes from water. Scientific Reports 2023; 13(1), 6306.
[45] H Madhu and S Rajendra. Green synthesis and reflux method of CuFe2O4 and Clay/CuFe2O4 nanocomposite for photocatalysis and antioxidant studies. Chemistry of Inorganic Materials 2025; 6, 100099.
[46] F Touahra, S Zemmache, S Djema, R Chebout, D Lerari and K Bachari. A new approach to the synthesis of CuFe2O4@CeO2 direct Z-scheme with a core-shell structure for enhanced photo-degradation of methyl violet under ultraviolet and visible-light irradiation. Environmental Progress and Sustainable Energy 2022; 41(5), 13865.
[47] FMA Alzahran, J Arshad, MS Al-Buriahi, ZA Alrowaili and S Munir. Synthesis of graphene-based Ag-doped CuFe2O4 composite for improved photocatalytic activity against industrial effluents. Journal of Taibah University for Science 2023; 17(1), 2209676.