Trends
Sci.
2026;
23(6):
12122
LC–HRMS Metabolomics Fingerprints and Pathway Signatures Authenticate Geographic Origin of Pempek (Channa striata)
Sherly Ridhowati1, Shanti Dwita Lestari1, Daniel Saputra2, Wulandari3,
Diah Anggraini Wulandari4, Siti Nurhasanah5 and Agus Supriadi1,*
1Department of Fisheries Product Technology, Faculty of Agriculture, Sriwijaya University, South Sumatera, Indonesia
2Department of Agricultural Engineering, Faculty of Agriculture, Sriwijaya University, South Sumatera, Indonesia
3Department of Fisheries Product Technology, Faculty of Animal Science, Jambi University, Jambi, Indonesia
4Research Centre for Vaccine and Drug, National Research and Innovation Agency (BRIN), Jakarta Pusat, Indonesia
5Department of Food Technology, Faculty of Agroindustrial Technology, Padjadjaran University, West Java, Indonesia
(*Corresponding author’s e-mail: [email protected])
Received: 30 September 2025, Revised: 21 October 2025, Accepted: 1 November 2025, Published: 30 January 2026
Abstract
This study demonstrates that non‑targeted liquid chromatography–high‑resolution mass spectrometry (LC–HRMS) metabolomics provides a robust framework for authenticating the geographic origin of pempek, a traditional fish‑based food prepared from Channa striata. The work addresses the limited application of untargeted LC–HRMS to processed freshwater fish products across multiple regions by explicitly testing whether molecular fingerprints capture ecological and artisanal differences between Jambi and South Sumatra. Samples were processed under standardized protocols and analyzed with LC–HRMS, followed by variance stabilization and chemometric modeling in MetaboAnalyst (a web-based platform for metabolomics data analysis). Principal component analysis (PCA) revealed origin‑based clustering, and orthogonal projections to latent structures–discriminant analysis (OPLS-DA), supported by extensive permutation validation, confirmed significant separation. Discriminatory metabolites included carnitines, choline, and creatinine enriched in Jambi products, contrasted with ether‑linked phosphatidylcholines and sphingomyelins enriched in South Sumatra products. Pathway enrichment analyses linked these differences to membrane lipid biosynthesis and fatty‑acid beta‑oxidation, while receiver operating characteristic (ROC) curves based on a multi‑marker panel demonstrated near‑perfect discrimination. These findings indicate that both endogenous metabolic traits and exogenous processing signatures jointly shape pempek metabolomes. The study advances food authenticity science by moving beyond descriptive profiling toward mechanistic interpretation and translational application. By establishing evidence‑based fingerprints for pempek, it provides a scientific foundation for protecting the cultural and economic value of this traditional Indonesian food. Future directions should include cross‑season and interlaboratory validation, targeted assays with authentic standards, and expanded regional comparisons to strengthen regulatory translation and consumer trust.
Keywords:
LC–HRMS
metabolomics, Chemometric
modeling, Pempek authentication, Channa
striata,
Food authenticity, Geographic origin, Biomarker discovery
Introduction
Non‑targeted liquid chromatography–high‑resolution mass spectrometry (LC–HRMS) has matured into a central approach for authenticating and differentiating protein‑rich foods by origin through comprehensive molecular fingerprinting. Recent applications illustrate both feasibility and impact. Comparative LC–HRMS metabolomics of Antarctic krill resolved quality shifts across storage regimens, demonstrating that global metabolic profiles can sensitively capture processing and preservation states of a marine protein source [1]. Complementarily, a synthesis of LC–MS strategies for honey origin determination highlighted how untargeted and targeted fingerprints can trace biological and geographic provenance with high discriminatory power [2]. These application‑driven advances have been enabled by technical foundations in workflow harmonization, annotation, and throughput: Comparative evaluations of untargeted LC–HRMS data‑processing pipelines clarified the consequences of peak detection, alignment, and feature curation choices for provenance studies [3], improved unknown identification protocols increased confidence in marker assignment from HRMS data [4], and automation in sample preparation and data capture facilitated scalable screening suitable for origin/authenticity contexts [5]. Together, this literature indicates that non‑targeted LC–HRMS is increasingly robust for authenticity investigations in fish and other protein‑rich products, although direct LC–HRMS comparisons of processed fish across multiple freshwater regions remain underrepresented.
Interpretive gains have paralleled analytical progress through the integration of chemometric platforms, particularly MetaboAnalyst, which standardizes preprocessing, enables robust multivariate modeling, and streamlines biomarker selection and visualization. User‑friendly environments accelerate peak‑table filtering, normalization, principal component analysis (PCA), and projection‑based discrimination (e.g., Partial Least Squares–Discriminant Analysis (PLS-DA) /Orthogonal Projections to Latent Structures–Discriminant Analysis (OPLS-DA)), while permutation validation curbs optimistic bias—features that demonstrably improve reproducibility and interpretability in marine and aquatic applications [1]. When coupled to high‑throughput pipelines, such platforms deliver consistent data inputs that enhance classification and marker discovery in food‑origin studies [2]. Harmonized quality assurance/quality control (QA/QC) procedures and best‑practice multivariate methods further reduce false discoveries and support cross‑site comparability, which is essential for authentication claims [3]. Moreover, adherence to PCA/PLS good practice and transparent validation improves population‑scale discrimination and mitigates overfitting in provenance analyses [4]. Collectively, these developments make chemometric toolchains integral to reliable aquatic food authentication by LC–HRMS.
Against this methodological backdrop, environmental and ecological drivers provide strong a priori reasons to expect regionally distinct metabolomes in freshwater fish and their derived foods. Dissolved‑oxygen deficits reorganize hepatic amino‑acid and energy metabolism, altering transporter systems and pathway fluxes in ways readily detected by metabolomics [6]. Habitat temperature, salinity, pH, and diet composition shape gut communities and diet‑related functional genes, producing downstream shifts in host metabolite pools that distinguish species, diets, and locales [7]. Dietary bioactives can remodel muscle phenotype, implying feeding‑induced metabolomic reprogramming. Anthropogenic contaminants such as microplastics disturb gut microbiota and trigger inflammatory responses, culminating in altered hepatic metabolomes [8]. These ecologically grounded perturbations are resolvable by LC–HRMS when supported by robust data processing and scalable pipelines that improve reproducibility and comparability across studies [9,10].
Regional processing and culinary traditions superimpose additional, reproducible structure on aquatic food metabolomes. Thermal and oxidative reactions during cooking and storage drive Maillard chemistry, lipid oxidation, and trimethylamine‑N‑oxide conversions, shifting profiles of volatiles, amino‑acid derivatives, and osmolytes in fish products [11,12]. Traditional salting, drying, and spice‑infused frying introduce distinctive patterns of lipid classes and small polar metabolites amenable to LC–HRMS discrimination [11]. Fermentation and indigenous microbiota further generate biogenic amines, organic acids, and glycosylated compounds that compound regional signatures and interact with habitat‑derived baselines [13]. Methodological advances in robust LC–HRMS workflows and chemometrics now enable these process‑linked and tradition‑linked fingerprints to be resolved and operationalized for geographic/authenticity classification [14].
Within Southeast Asia, pempek a culturally salient, fish‑based product typically prepared from Channa striata (snakehead fish), tapioca starch, salt, and water, followed by boiling provides a compelling model for disentangling environmental and processing determinants of food identity. Its protein‑starch matrix and region‑specific practices suggest that both endogenous signals (reflecting freshwater fish physiology) and exogenous signals (arising from ingredients, packaging, and thermal handling) will be detectable in LC–HRMS fingerprints. Yet, despite growing metabolomics applications in marine systems and other protein‑rich foods, systematic non‑targeted LC–HRMS studies explicitly contrasting processed freshwater fish products across multiple geographic regions remain scarce in the surveyed literature [1-5]. Addressing this gap is essential to extend authenticity science to traditional Southeast Asian foods and to build evidence capable of supporting geographic‑indication protection, quality assurance, and consumer trust.
The present manuscript advances this agenda by applying non‑targeted LC–HRMS metabolomics, curated through a MetaboAnalyst‑centered chemometric workflow, to pempek produced in two ecologically distinct freshwater regions of Indonesia—Jambi and South Sumatra. The study integrates standardized preprocessing with Principal Component Analysis (PCA) for global structure, Orthogonal Projections to Latent Structures–Discriminant Analysis (OPLS-DA) for supervised discrimination, univariate testing for effect sizes, and pathway enrichment for mechanistic interpretation. In doing so, it seeks to: (i) establish whether metabolomic fingerprints can reliably discriminate pempek by geographic origin; (ii) identify discriminatory metabolites spanning endogenous axes (e.g., amino‑acid/energy metabolism, membrane lipids) and exogenous axes (e.g., process‑linked compounds) that together define a parsimonious authentication panel; and (iii) contextualize these markers within pathways plausibly shaped by habitat and artisanal practice. Building on the analytical and interpretive foundations documented in recent literature [1-5,14], the work contributes an evidence‑based framework for geographic authentication of a traditional Southeast Asian fish product and, more broadly, illustrates how LC–HRMS metabolomics can bridge ecology and culture to safeguard the identity of regionally branded foods.
Materials and methods
The present study employed an untargeted metabolomics strategy based on liquid chromatography coupled with high-resolution mass spectrometry (LC–HRMS) to discriminate pempek, a traditional Indonesian fish-based delicacy, produced from Channa striata (snakehead fish) sourced from two geographically distinct regions, Jambi and South Sumatra. Each specimen’s average total length (28 - 32 cm), and body weight (200 - 300 g) were recorded to ensure biological comparability between regions. The methodological framework was designed to ensure analytical reproducibility and biological representativeness, with a particular emphasis on revealing metabolic fingerprints that could underpin robust approaches to geographical authentication. The experimental design encompassed four principal phases: Sample preparation, metabolite extraction, LC–HRMS analysis, and data processing followed by statistical interrogation. Each of these stages was carefully standardized to minimize potential confounding factors arising from extraneous matrix effects or analytical variability.
Sample preparation
Snakehead fish (Channa striata) specimens were collected directly from freshwater riverine environments located in Jambi (J) and South Sumatra (P). To reduce matrix-related bias and to ensure comparability across experimental groups, all auxiliary ingredients—cassava starch, distilled water (Aquades), and sodium chloride were obtained from a single batch source. Fish were selected based on uniform size and weigh status to minimize biological variability. Pempek preparation adhered strictly to traditional culinary practices, beginning with the mechanical grinding of fish fillets to yield a homogeneous sol in the presence of 2% NaCl. This sol was subsequently combined with 30% water and 40% cassava starch to generate a cohesive dough. The resulting mixture was molded and immersed in boiling water until complete cooking was indicated by flotation of the products on the water surface.
All technical parameters, including ingredient ratios, boiling temperature, and cooking duration, were meticulously documented to ensure inter-batch reproducibility. Five independent biological replicates were prepared per region, and each extract was analyzed in triplicate (technical replicates) to ensure analytical reproducibil. Following preparation, all pempek samples were vacuum-packed, stored at −18 °C for no longer than seven days, and subjected to a single freeze–thaw cycle prior to analysis. This standardized handling protocol was implemented to prevent artefactual metabolic changes and to secure sample integrity for metabolomic analysis.
Metabolite extraction
Metabolites were extracted from 100 mg aliquots of each pempek sample using 1 mL of methanol–water (80:20, v/v, containing 0.1% formic acid, HPLC grade) as the extraction solvent. This solvent system was selected based on previous reports optimizing polar–nonpolar metabolite recovery from fish matrices [15,16]. An isotopically labeled internal standard (L-carnitine-d₃, Sigma-Aldrich) was incorporated into the extraction medium to monitor both extraction efficiency and ionization stability across samples. The homogenized mixture underwent vortex agitation for 2 min using a Thermo Fisher Vortex Mixer (Model MX-S), followed by a 30-minute sonication at 25 °C in an Elmasonic P 30H ultrasonic bath (Elma, Germany), thereby enhancing metabolite solubilization. Subsequently, the samples were centrifuged at 5,000× g for 10 min using a refrigerated Eppendorf 5430 R centrifuge (Hamburg, Germany). The supernatant fraction was carefully collected, filtered through a 0.20 µm nylon membrane (Whatman™, UK) to eliminate residual particulates, and transferred into amber vials to minimize light-induced degradation. All sample preparation and extraction steps were carried out by adapting previously validated workflows for aquatic food metabolomics [16]. All extracts were stored under controlled conditions until instrumental analysis by LC–HRMS.
LC–HRMS analysis
Metabolomic profiling was conducted using a Thermo Scientific™ Vanquish™ Horizon UHPLC system coupled with an Orbitrap™ Exploris 240 mass spectrometer (Thermo Fisher Scientific, Germering, Germany). Chromatographic separation was achieved on a Thermo Scientific™ Accucore™ C18 column (100 mm × 2.1 mm, 2.6 µm particle size, Lithuania), which was maintained at 40 °C to ensure reproducible retention time stability. The binary mobile phase comprised (A) MS-grade water containing 0.1% formic acid and (B) MS-grade acetonitrile containing 0.1% formic acid. The elution gradient was optimized to balance separation efficiency and throughput: The run commenced with 5% B, which was linearly increased to 90% over 16 min, held isocratically at 90% for 4 min, and returned to initial conditions by 25 min. The flow rate was 0.3 mL/min with an injection volume of 5 µL. Such injection volumes, as supported in prior literature [17-19], ensure both sufficient analyte load and reproducible gradient performance.
The Orbitrap Exploris 240 was operated in Full MS/dd-MS2 acquisition mode with positive polarity. The full scan spectra were acquired over a mass-to-charge (m/z) range of 70 - 1,000 at a resolution of 22,500 full width at half maximum (FWHM). Data-dependent fragmentation (dd-MS2) was conducted at a resolution of 30,000 FWHM with normalized collision energies of 30, 50, and 70 to capture comprehensive fragmentation patterns. The ionization source employed OptaMax™ NG Heated Electrospray Ionization (H-ESI) with the following optimized parameters: Spray voltage 3,500 V, sheath gas 35 arbitrary units (AU), auxiliary gas 7 AU, sweep gas 1 AU, ion transfer tube temperature 300 °C and vaporizer temperature 320 °C. These settings collectively provided enhanced ionization efficiency, stable spray characteristics, and minimized in-source fragmentation, thereby ensuring high-quality metabolomic datasets.
Data processing
Raw mass spectrometric data were processed using Thermo Scientific Compound Discoverer 3.3 software (San Jose, USA). Feature detection was based on MS1 precursor signals, with compound grouping across samples set at a mass tolerance of < 5 ppm [20] and a retention time tolerance of 0.2 min, anchored to dominant adducts [M+H]+, [M+NH4]+ and [M+Na]+. Data-dependent MS2 (DDA) was used for preferred ions, while chromatographic peak width thresholds were restricted to ≤ 1 min at half height to reduce false positives. Annotation thresholds were configured with mass delta tolerances of −5 to +5 ppm, and features were subjected to annotation only if the chromatographic peak area exceeded 1.0×10⁶ counts, a valid compound name was available, and a full spectral match with mzCloud (All) was achieved [21,22].
All significant features were then cross-referenced with multiple curated chemical databases, including ChemSpider (BindingDB, ChEBI, ChEMBL, FDA UNII, FooDB, KEGG, LIPID MAPS, Marinlit, NPAtlas, PubChem, among others) as well as specialized mass lists such as Endogenous Metabolites (4,400 compounds), FCCDB_2022, LipidMaps Structure Database 2023, and Natural Products Atlas 2021. This multi-database approach was adopted to enhance annotation confidence, mitigate ambiguity, and ensure the retrieval of biologically relevant identities across both endogenous and exogenous metabolite classes.
Statistical analysis
Processed data were exported into MetaboAnalyst 6.0 for chemometric and statistical interrogation. The dataset was structured into a two-dimensional matrix with samples as rows and metabolite features as columns. Prior to multivariate modeling, normalization by sum, log2 transformation, and Pareto scaling were applied to stabilize variance, correct skewness, and reduce the disproportionate influence of high-abundance metabolites.
Unsupervised Principal Component Analysis (PCA) was first employed to visualize inherent clustering and to evaluate overall data quality. Subsequently, supervised Orthogonal Projections to Latent Structures–Discriminant Analysis (OPLS-DA) was implemented to maximize separation between pempek samples from Jambi and South Sumatra. Rigorous permutation testing (2000 iterations) was conducted to validate model robustness and to exclude spurious associations. The suitability of OPLS-DA for metabolomics datasets arises from its capacity to handle high-dimensional, collinear data structures, while simultaneously enhancing interpretability by isolating variance directly associated with group discrimination [23].
Model performance was assessed using the cumulative explained variance (R2 cum) and predictive capability (Q2 cum), with values above 0.5 considered indicative of acceptable model quality and values approaching 1.0 reflecting superior predictive power. Discriminatory metabolites between regional groups were identified using Variable Importance in Projection (VIP) scores greater than 1 in conjunction with significance thresholds of p-value < 0.05 [21-22]. The combination of VIP-based selection and statistical validation allowed for the delineation of robust metabolite markers underlying regional discrimination of pempek.
Results
Data quality and normalization
The raw LC–HRMS feature table displayed pronounced right‑skew and heteroscedasticity typical of non‑targeted metabolomics, wherein a small subset of high‑abundance ions disproportionately drives total variance. To mitigate these effects, intensities were processed using normalization by sum (MetaboAnalyst 6.0) followed by log2 transformation and Pareto scaling. Variance‑stabilizing transforms such as log and generalized log (glog) are widely recommended to reduce scale dependence, while post‑transform scaling (Pareto or unit variance) balances feature influence in multivariate space without over‑amplifying noise, consistent with best‑practice guidance for PCA/PLS workflows [1,2,7]. In the present dataset (Figure 1), density plots shifted from heavy‑tailed to unimodal, and boxplots showed comparable interquartile ranges across features after preprocessing, indicating effective variance stabilization and improved comparability. Beyond distributional improvements, rigorous normalization is known to enhance classifier accuracy and inter‑platform transferability, whereas inadequate correction inflates false discrimination [3,4,6]. Together with annotation‑aware pipelines that refine feature identity and reduce spurious markers, such preprocessing increases the robustness of downstream interpretation in authenticity contexts [5].
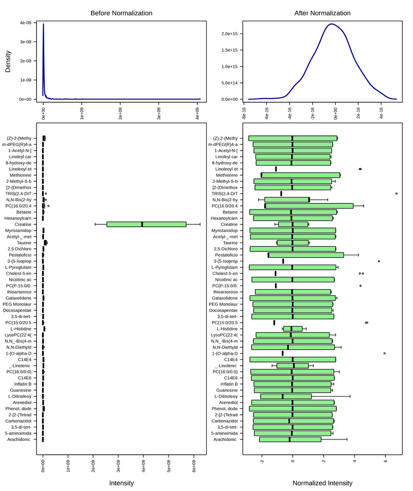
Figure 1 Density distributions and boxplots of metabolite intensities before and after normalization.
Total-Ion chromatogram (TIC) profiles of palembang and jambi samples
The Total-Ion Chromatogram (TIC) profiles of Palembang (P1–P5) (Figure 2(A)) and Jambi (J1–J5) (Figure 2(B)) pempek samples displayed a uniform chromatographic pattern over a 0 - 25 min reversed-phase C18 gradient. Both cohorts exhibited two dominant peaks: An intense early signal at RT ≈ 0.66 - 0.67 min and a pronounced late-eluting apex at RT ≈ 21.16 - 21.17 min, accompanied by reproducible secondary features around ~0.86, ~4.8 - 5.3, ~8.2 - 8.3, ~13.0 - 13.2, ~15.4 - 15.7, ~17.7 - 17.9, ~18.1 - 18.9 and ~19.8 - 21.0 min. Retention-time variation across replicates was less than 0.02 min, confirming excellent system stability and reproducibility. These outcomes are consistent with findings that highlight the importance of effective preprocessing and rigorous QA/QC measures, such as pooled quality control injections, for maintaining retention-time consistency in untargeted LC–HRMS analyses [24,25].
The chromatographic distribution aligns with reversed-phase C18 behavior, where early-eluting peaks (RT < 2 min) represent polar metabolites and late-eluting regions (RT > 15 min) indicate hydrophobic or lipid-based compounds [26]. Stable retention times enhance metabolite identification confidence, particularly when integrated with structural prediction models [27]. Environmental and instrumental factors may influence specificity, underscoring the necessity of harmonized quality assurance and standardized analytical protocols [28,29].
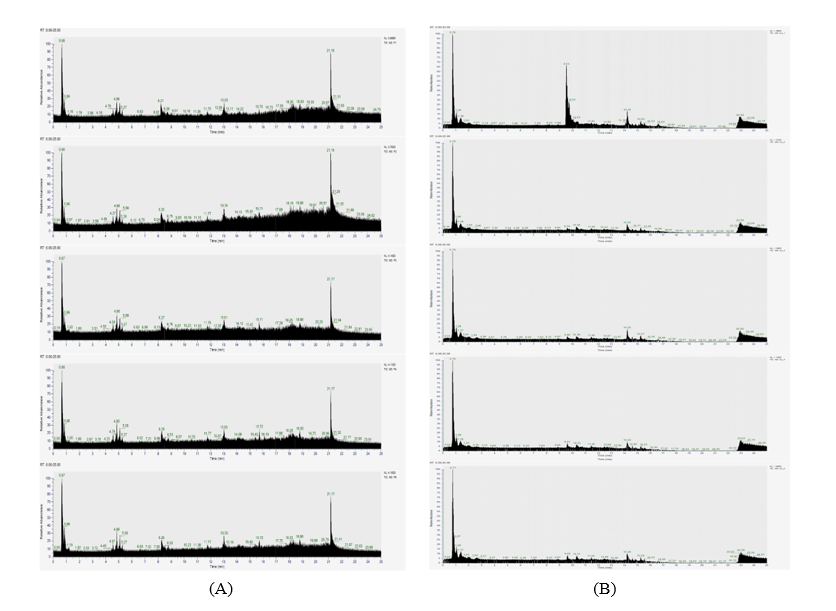
Figure 2 (A) Total-ion chromatograms (0 - 25 min) of Palembang pempek extracts for replicates P1 - P5; (B) Total-ion chromatograms (0 - 25 min) of Jambi pempek extracts for replicates J1 - J5.
Characteristic TIC landmarks at ~5, ~13, ~18, and ~21 min correspond to amino acids, phenolics, and polysaccharides related to food quality [30]. In fish-derived matrices, reproducible TICs arise from optimized sample preparation minimizing matrix effects [31,32]. The late-eluting range (15 - 22 min) typically reflects lipid-rich species such as phospholipids and triglycerides. The similarity between Palembang and Jambi TIC patterns suggests that compositional differences, rather than chromatographic variation, underpin regional discrimination [33,34].
Principal component analysis (PCA)
Unsupervised PCA provided a global view of compositional structure and revealed clear segregation of Jambi (J) and South Sumatra (P) along PC1 (89.9%) with minor dispersion on PC2 (3.2%) (Figure 3(A)). In fish and fish‑product metabolomics, PCA is routinely used to visualize natural clustering by species, tissue, processing or storage state, and to guide early marker selection; loading and biplot panels (Figures 3(B) - 3(C)) loadings pinpoint variables that drive separation [35]. Consistent with prior aquatic food studies, discriminant loadings in our biplot included amino‑acid–related features and osmolytes together with lipid classes [38]. The interpretability of these loadings benefits from improved, context‑aware annotation resources that strengthen identity assignment and reduce ambiguity in authenticity or provenance settings [36,37].
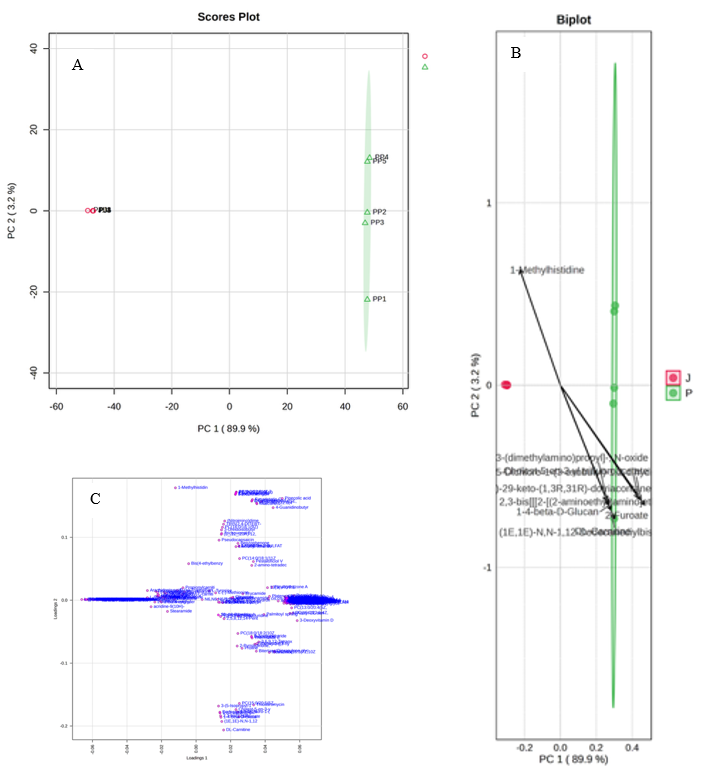
Figure 3 PCA analysis of pempek metabolomes. (A) PCA score plot showing separation of Jambi (J) and South Sumatra (P) samples. (B) PCA biplot identifying major discriminatory metabolites. (C) Loading plot highlighting the distribution of metabolites across PC1 and PC2.
Supervised OPLS‑DA modeling
To quantify group separation and identify predictive structure, we applied Orthogonal Projections to Latent Structures–Discriminant Analysis (OPLS-DA). The scores revealed complete separation of J and P along the predictive component T [1] (89.9%) with limited orthogonal variance (2.4%) (Figure 4(A)), indicating that class‑unrelated noise was efficiently partitioned. Model quality indices were high (R²X(cum) = 0.899; R²Y(cum) ≈ 1.0; Q²(cum) = 0.999), and 2,000‑iteration permutation testing (Figures 4(B) - 4(D)) confirmed statistical significance of the observed separation. Recommended practice for avoiding OPLS/PLS overfitting in small or imbalanced cohorts combines repeated cross‑validation with extensive permutation schemes that respect data structure [38]. In authentication research, OPLS‑based models validated by such procedures have supported robust geographic and varietal classification and the selection of minimal marker panels with improved transferability [39,40].
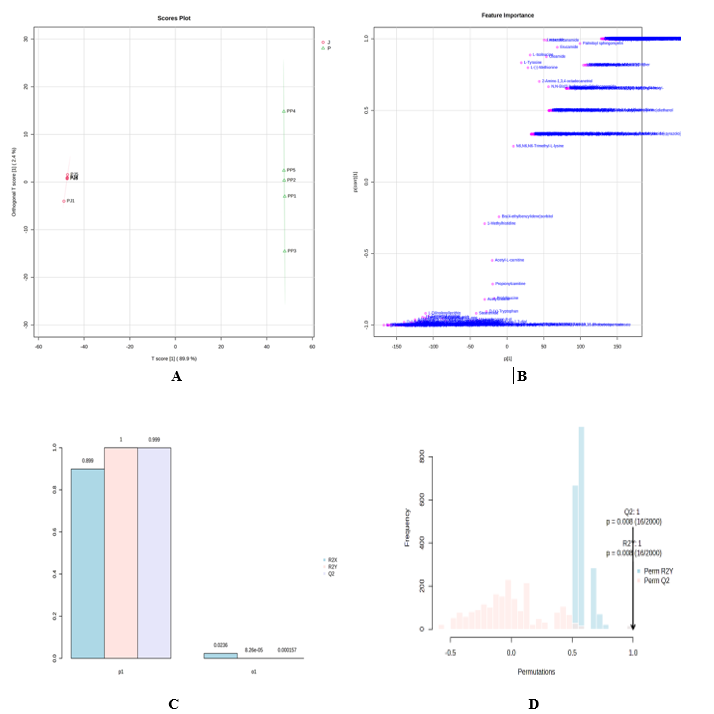
Figure 4 OPLS‑DA results. (A) OPLS‑DA score plot showing distinct clustering of J and P. (B) S‑plot indicating discriminatory metabolites. (C) Model performance statistics (R²X, R²Y, Q²). (D) Permutation test validating model robustness.
Identification of discriminatory metabolites
We integrated univariate and multivariate evidence to curate discriminatory metabolites. Volcano plots (Figure 5(B)) quantified fold change and significance, VIP scores (Figure 5(A)) from the OPLS model prioritized variables contributing most to separation, and hierarchical heatmaps visualized (Figure 5(C)) effect direction and sample‑level consistency. In addition, a comprehensive summary of the top discriminatory metabolites identified through LC–HRMS analysis is presented in Table 1, highlighting compounds with high annotation confidence (Δmass ≤ 5 ppm) and VIP > 1.2. This sequential convergence univariate significance plus multivariate importance plus pattern reproducibility is widely used in authenticity workflows to build robust candidate sets [39,41]. In agreement with recurrent findings for aquatic foods, the leading classes included free amino acids and osmolytes, acylcarnitines/carnitine ratios indicative of lipid/energy metabolism, complex lipids including phospholipids and neutral lipids, and small organic acids/biogenic amines associated with processing or microbial activity [39,40-43]. Consistent with these results, Table 1 enumerates 15 major metabolites contributing to regional discrimination. L-carnitine, choline, and creatinine were notably enriched in Jambi samples, whereas ether-linked phosphatidylcholines and sphingomyelins predominated in South Sumatra products. These differences reflect the combined influence of endogenous membrane composition and exogenous processing inputs.
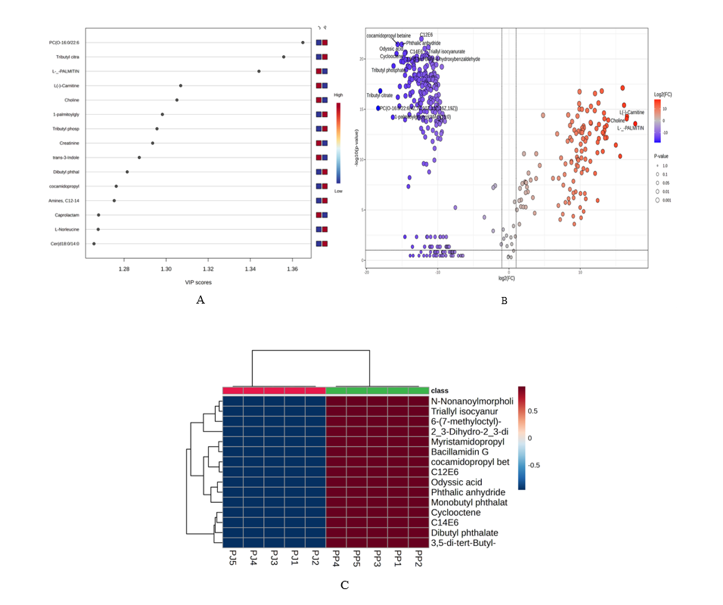
Figure 5 Biomarker identification. (A) VIP plot of top discriminatory metabolites. (B) Volcano plot showing statistically significant features by fold‑change and p‑value. (C) Heatmap clustering of discriminatory metabolites across J and P.
Table 1 Discriminatory metabolites identified by LC–HRMS analysis and OPLS-DA modeling (Δmass ≤ 5 ppm, VIP > 1.2)
No |
Name Metabolites |
Formula |
Annot. DeltaMass [ppm] |
Calc. MW |
RT [min] |
Area |
VIP |
|
1 |
PC(P-16:0/22:6(4Z,7Z,10Z,13Z,16Z,19Z)) |
C43 H74 N O7 P |
–2.36 |
747.51852 |
15.715 |
19615368.7 |
1.36 |
|
2 |
Tributyl citrate |
C18 H32 O7 |
–2.41 |
360.21394 |
13.028 |
1735839680 |
1.36 |
|
3 |
L-α-Palmitin |
C19 H38 O4 |
–2.84 |
330.27607 |
14.233 |
1272093195 |
1.34 |
|
4 |
L-Carnitine |
C7 H15 N O3 |
–2.11 |
161.10485 |
0.756 |
936237785 |
1.31 |
|
5 |
Choline |
C5 H13 N O |
0.1 |
103.09972 |
0.746 |
632752281 |
1.31 |
|
6 |
1-palmitoylglycerol;MAG(16:0) |
C19 H38 O4 |
–2.24 |
330.27627 |
15.721 |
602870199 |
1.30 |
|
7 |
Tributyl phosphate |
C12 H27 O4 P |
–2.15 |
266.16412 |
11.759 |
456565448 |
1.30 |
|
8 |
Creatinine |
C4 H7 N3 O |
–0.4 |
113.05887 |
0.774 |
556497190 |
1.29 |
|
9 |
trans-3-Indoleacrylic acid |
C11 H9 N O2 |
–1.85 |
187.06298 |
2.015 |
284933520 |
1.29 |
|
10 |
Dibutyl phthalate |
C16 H22 O4 |
–2.35 |
278.15116 |
12.957 |
335534619 |
1.28 |
|
11 |
cocamidopropyl betaine |
C19 H38 N2 O3 |
–2.24 |
342.28748 |
8.486 |
303090922 |
1.28 |
|
12 |
Amines, C12-14-tert-alkyl, ethoxylated propoxylated |
C14 H31 N O |
–2.35 |
229.24003 |
8.309 |
279282894 |
1.28 |
|
13 |
Caprolactam |
C6 H11 N O |
–1.84 |
113.08386 |
2.627 |
404354954 |
1.27 |
|
14 |
L-Norleucine |
C6 H13 N O2 |
–2.42 |
131.09431 |
0.909 |
218176153 |
1.27 |
|
15 |
Cer(d18:0/14:0) |
C32 H65 N O3 |
–2.12 |
511.49536 |
16.139 |
225194925 |
1.27 |
|
Classification performance
Receiver operating characteristic analysis quantified the translational potential of single markers and composite panels. Consistent with recent metabolomics authentication studies, the multi‑marker model outperformed individual features, achieving near‑perfect cross‑validated AUC (Figure 6(B)), whereas single metabolites showed lower AUCs (Figure 6(A)) [14]. ROC curves provide a principled basis for choosing operating points that balance false positives and negatives against industry thresholds and for rationally reducing panels for targeted assay development. To safeguard generalization, performance estimates should be anchored by repeated cross‑validation and label permutation tests and supported by harmonized analytical pipelines and QA/QC measures that enable inter‑laboratory transferability [5,44].
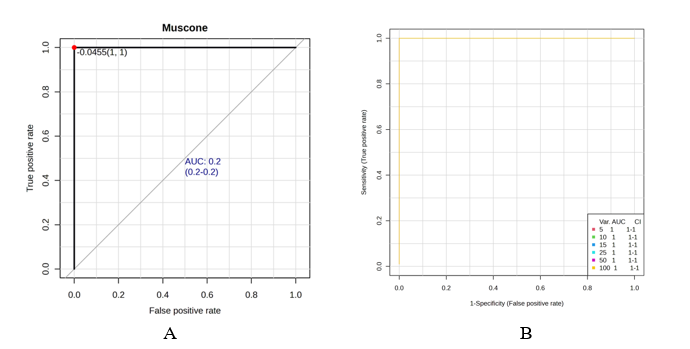
Figure 6 ROC curves comparing individual biomarkers (A) and multi‑marker panel performance (B).
Pathway enrichment analysis
Pathway level interrogation translated feature‑level differences into biological hypotheses relevant to habitat and processing. Lipid and amino‑acid metabolism emerged as dominant axes (Figures 6(A) - 6(B)). Prior fish metabolomics has repeatedly linked geographic origin to variation in complex lipid classes triacylglycerides, diacylglycerides, and phospholipids as well as to shifts in fatty‑acid and arachidonic‑acid pathways, while carnitine/acylcarnitine profiles reflect differences in β‑oxidation and energetic state across habitats [45]. In our data, phosphatidylethanolamine/phosphatidylcholine biosynthesis was enriched in P, consistent with membrane remodeling, whereas carnitine-associated pathways and very-long-chain β-oxidation were elevated in J, aligning with enhanced fatty-acid transport and oxidation.
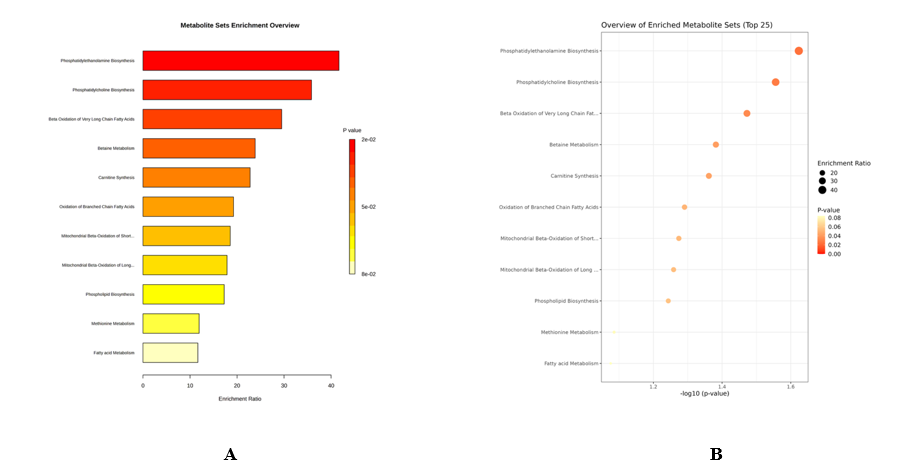
Figure 7 Pathway enrichment analysis. (A) Bar plot of enriched metabolite sets. (B) Bubble plot showing enrichment ratios and p‑values of top pathways.
Integrated Findings
Synthesizing unsupervised structure, supervised discrimination, univariate effect sizes, and pathway context yields a coherent, biologically anchored narrative for geographic fingerprinting of pempek. These integrative results are reinforced by highly reproducible Total-Ion Chromatogram (TIC) profiles across both Palembang and Jambi cohorts, where stable retention-time alignment (≤ 0.02 min) and conserved peak architecture demonstrate excellent instrumental reproducibility and data integrity. Exploratory PCA defined natural groupings; OPLS‑DA with rigorous validation quantified predictive separation; volcano/VIP/heatmaps converged on reproducible discriminants; and enrichment analyses linked markers to lipid and amino‑acid pathways implicated in habitat and processing influences. This multi-layered evidence complements TIC observations, confirming that chromatographic stability and consistent signal intensity underpin the reliability of downstream chemometric modeling [24,25]. Such sequential integration advocated in metabolomics reporting frameworks reduces false discovery and enhances plausibility by combining endogenous, pathway‑anchored metabolites with exogenous, process‑linked signatures where appropriate [26,46]. Within this scaffold, J samples were characterized by higher carnitines, choline, and creatinine, whereas P samples exhibited ether-linked phospholipids and sphingomyelins. The TIC comparison further showed shared chromatographic frameworks but differences in signal amplitude within late-eluting zones (15 - 22 min), correlating with lipid-rich metabolite abundance [26,31]. The agreement across analytical layers supports the development of targeted, parsimonious marker panels for authentication and motivates future external validation to ensure transferability across seasons, lots and laboratories.
Discussion
Discussion on Total-Ion chromatogram (TIC) interpretation and analytical framework
The interpretation of Total-Ion Chromatogram (TIC) profiles in untargeted LC–HRMS metabolomics requires rigorous quality assurance and control (QA/QC) to ensure reproducibility and analytical reliability. Best-practice QA/QC frameworks recommend incorporating pooled quality control (QC) samples every 10 - 15 runs, maintaining a feature presence threshold of 70%, and controlling relative standard deviation (RSD) within 20 – 30% for QC replicates [24], [47]. Retention-time (RT) alignment tolerances of ± 0.1 - 0.5 min safeguard consistent chromatographic behavior and prevent misinterpretation of biological differences [47]. These parameters confirm that the observed TIC reproducibility between Palembang and Jambi pempek reflects genuine compositional variation rather than instrumental drift.
Comparative evaluation of TIC profiles revealed subtle yet biologically meaningful distinctions. Both cohorts exhibited conserved chromatographic structures, with dominant peaks at RT ≈ 0.66 - 0.67 min and RT ≈ 21.16 - 21.17 min, indicating consistent separation performance. However, Palembang samples displayed stronger late-eluting signals (15 - 22 min), corresponding to lipid-rich compounds such as phospholipids and sphingomyelins, whereas Jambi samples exhibited greater intensity in early and mid-eluting regions (0 - 10 min), reflecting polar metabolites like carnitine, choline, and creatinine.
These polarity-driven differences corroborate chemometric findings that associate Palembang with lipid-based pathways and Jambi with energy and amino acid metabolism [26,31]. Integrating TIC-level evidence into the analytical framework strengthens data-dependent MS/MS acquisition strategies. Prioritizing late-eluting regions ensures comprehensive coverage of hydrophobic lipids, while adaptive acquisition methods that monitor TIC intensity enhance fragmentation efficiency and reduce ion suppression [48]. Nevertheless, TIC-based interpretation remains sensitive to ion suppression, isomerism, and matrix effects, necessitating transparent reporting of QA/QC metrics, calibration routines, and retention-time tolerances to maintain interpretive accuracy [49,50]. Collectively, the integration of QA/QC rigor with TIC-derived insights confirms that regional differences in pempek metabolomes arise from authentic biochemical diversity rather than analytical variance.
Overview of key findings
The present study represents one of the first systematic efforts to apply non-targeted LC–HRMS (liquid chromatography–high-resolution mass spectrometry) metabolomics for the characterization and fingerprinting of pempek, a traditional fish-based product prepared from Channa striata in two distinct geographic regions of Indonesia. By integrating robust data normalization, unsupervised exploration, supervised discrimination, and pathway enrichment analyses, the study successfully demonstrated that pempek from Jambi and South Sumatra harbor distinct metabolomic signatures. These differences were consistently observed across multiple statistical layers, including Principal Component Analysis (PCA), Orthogonal Projections to Latent Structures–Discriminant Analysis (OPLS-DA), univariate testing, and hierarchical clustering, and were further supported by pathway-level enrichment. Collectively, the results highlight the feasibility of metabolomics as a tool for geographic authentication of traditional fish-derived foods and provide insights into the biochemical underpinnings of regional variation.
Data preprocessing and quality assurance
Methodological advances in LC–HRMS preprocessing have substantially improved reproducibility and interpretability in food metabolomics. Trackable, deterministic feature detection with standardized peak‑picking parameterization reduces analyst‑to‑analyst variability and preserves auditability across studies [6]. End‑to‑end, harmonized chemometric toolchains—such as MetaboAnalyst/MetaboAnalystR—facilitate automated normalization, batch correction, and downstream inference under transparent provenance, thereby enabling cross‑dataset comparability [14]. Model‑based normalization and batch‑aware approaches, including EigenMS and ratio‑to‑reference strategies like Metchalizer, effectively remove systematic technical variance while preserving biological signal [51,52]. In parallel, embedding rigorous QA/QC with internal standards, pooled QC, and interlaboratory checks supports semi‑quantitative comparability across runs and platforms [5,53] . When combined with curated spectral/retention‑time libraries and retention‑time databases, these pipelines raise annotation confidence and reduce false discovery [54].
Normalization choices directly shape biological interpretation. Inappropriate or absent batch correction can inflate false positives and generate spurious pathway signals; normalization by sum or other model‑based normalization stabilizes variance, improves classifier performance, and yields pathway enrichments that reflect true ecological or processing differences rather than artifacts [51,52]. For translational impact, transparency in QC reporting alongside reproducible, validated preprocessing is essential so that authenticity claims are both defensible and portable to industry settings [14].
Multivariate exploration: PCA insights
Unsupervised PCA reliably reveals ecologically and processing‑relevant clustering in fish metabolomics by projecting variance driven by osmolytes, free amino acids, and lipid classes—features that track habitat, stress, spoilage trajectories, and processing stages [39,55]. In our data, the separation of Jambi and South Sumatra along PC1 (89.9%) with modest dispersion on PC2 (3.2%) is consistent with patterns reported in aquatic foods. Such PCA outcomes are hypothesis‑generating, guiding targeted follow‑up via volcano/VIP analyses and pathway interrogation to prioritize biomarkers for authenticity and quality monitoring [39].
PCA’s strength lies in detecting natural structure without supervision, but it is less sensitive for classification than rigorously validated supervised models. Best practice is therefore to combine PCA for exploration with PLS-DA (Partial Least Squares–Discriminant Analysis)/OPLS-DA or other classifiers only after repeated k‑fold cross‑validation and permutation testing to avoid optimistic claims of origin discrimination [39]. Our workflow adhered to this principle, using PCA to frame hypotheses and OPLS‑DA to quantify predictive separation under strict validation.
Supervised discrimination: OPLS‑DA model performance
OPLS‑DA isolates predictive variation from orthogonal, class‑unrelated variance, enhancing interpretability and variable selection for authentication panels [1,2]. In the present study, near‑complete separation of J and P with high R²Y and Q² was corroborated by extensive permutation testing, aligning with recommended safeguards against overfitting. Nonetheless, OPLS‑DA can be optimistic in high‑dimensional, small‑n settings if validation is insufficient; reported quality metrics are vulnerable to inflation, and model instability across batches or instruments can hinder transferability without harmonized preprocessing and interlaboratory validation [3,4]. Robust workflows therefore mandate repeated cross‑validation coupled with ≥ 1,000 label permutations or structure‑preserving schemes to construct null distributions for Q² and Area Under the Receiver Operating Characteristic Curve (AUROC), ensuring that observed performance exceeds chance [3,4]. Within these constraints, supervised projection provides strong class separation and Variable Importance in Projection (VIP)‑based prioritization that is actionable for targeted assay development and industrial translation when paired with stringent QC [2].
Discriminatory metabolites and biomarker discovery
Effective prioritization integrates statistical strength, multivariate importance, reproducibility, biochemical plausibility, and analytical tractability. Discovery pipelines commonly shortlist by fold change and false-discovery-rate–adjusted p-value, rank by VIP/loadings and verify directionality and sample‑level consistency via heatmaps; candidates are further filtered by expected retention time, ionization behavior, and abundance to support transferability [56]. Interlaboratory coverage and spectral‑library match rates help triage features likely to validate across platforms [57,58]. In our dataset, Jambi enrichment of carnitines/choline versusm South Sumatra enrichment of ether-linked phosphatidylcholines and sphingomyelins is coherent with known aquatic‑food discriminants: Free amino acids/osmolytes, acylcarnitines reflecting β‑oxidation, complex lipids, and small organic acids/biogenic amines [39,41], [42,43]. Downstream validation should employ targeted MS with stable‑isotope dilution or SRM/PRM for accurate quantitation and identity confirmation, complemented by orthogonal MS/MS and, where needed, NMR prior to industrial deployment [59].
Biological and environmental interpretations
Ecological differences in water chemistry, trophic status, temperature, salinity, and pollution reshape fish metabolomes by altering osmolytes, amino‑acid pools, and lipid signatures. Habitat‑linked β‑diversity and exposure studies show that acylcarnitines, tri‑/diacylglycerides, and phospholipids vary with diet quality, osmotic stress, and oxygen regimes, while aromatic amino‑acid pathways (phenylalanine, tyrosine, tryptophan) respond to salinity and pollutant pressures [13,60]. The pathway enrichments observed here carnitine synthesis and β‑oxidation in Jambi; phosphatidylethanolamine/phosphatidylcholine biosynthesis in South Sumatra are therefore consistent with mechanistic links between habitat and energy/membrane metabolism.
Processing‑related and exogenous contributions
Distinguishing endogenous from exogenous signals is central to authenticity claims. Isotope‑assisted workflows and context‑aware annotation can separate biosynthetic metabolites from contaminants or processing derived molecules, while curated MS/MS and retention‑time resources reduce false assignments [1-3]. Trackable feature pipelines further improve reproducibility in such distinctions [4], with rigorous QC guiding acceptance thresholds for classification [5]. Exogenous compounds including plasticizers, surfactants, and processing by‑products can serve as practical provenance/process markers when contamination routes are documented [6]. Nonetheless, industrial translation requires targeted confirmation against authentic standards and explicit control of artifacts prior to deployment [2,3,5].
Pathway‑level insights
The pathway enrichment results summarized in Table 1 provide metabolic-level insights that contextualize the discriminant metabolites within biologically meaningful frameworks. Among the identified pathways, those related to lipid metabolism including phospholipid biosynthesis, β-oxidation of fatty acids, and carnitine synthesis were consistently enriched, emphasizing the centrality of lipid turnover in the observed biochemical profiles. Specifically, the enrichment of phosphatidylethanolamine and phosphatidylcholine biosynthesis pathways underscores the modulation of membrane lipid remodeling processes, which are tightly linked to environmental adaptation and processing-induced biochemical shifts [11,61,62].
Meanwhile, fatty acid β-oxidation pathways, spanning short-, long-, and very-long-chain substrates, reflect enhanced mitochondrial energy flux and substrate flexibility, suggesting that lipid catabolism plays a pivotal role in metabolic differentiation. The detection of carnitine-related and branched-chain fatty acid oxidation pathways further supports the hypothesis of active acyl-transfer and detoxification processes, consistent with mechanistic interpretations in earlier metabolomic studies [44,63,64].
In addition, methionine and betaine metabolism pathways indicate dynamic regulation of one-carbon and methyl-donor metabolism, which connects lipid modification with redox homeostasis and amino acid turnover [3,65]. These findings collectively demonstrate that integrating topology-aware pathway mapping provides a biologically coherent framework that transcends individual metabolite annotation, enabling a systems-level understanding of biochemical adaptation mechanisms.
However, it should be noted that the relatively modest p-values and identical FDR adjustments across pathways reflect limitations in annotation depth and coverage. The dependency on curated databases such as SMPDB and KEGG introduces potential biases, particularly where experimental MS/MS validation or retention time (RT) predictions are lacking. This aligns with earlier critiques that emphasize the importance of improved annotation confidence, incorporation of orthogonal datasets, and harmonization across laboratories to refine pathway-based interpretations.
Thus, while the pathway-level analysis supports biologically anchored hypotheses—particularly concerning lipid and amino acid metabolism—it simultaneously highlights methodological gaps in current untargeted LC–HRMS workflows. Future studies integrating topology-aware enrichment and multi-omics correlation frameworks could enhance interpretability, bridging the gap between data-driven discovery and curated biochemical knowledge networks, thereby fulfilling the mechanistic potential of metabolomic pathway analysis [3,65].
Table 2 Pathway enrichment analysis of discriminant metabolites.
Set Name |
Metabolites |
Total |
Hits |
Expect |
p- value |
Holm P |
FDR |
Reference |
Phosphatidylethanolamine Biosynthesis |
Cytidine triphosphate; Cytidine monophosphate; Choline; Ethanolamine; Serine; O-Phosphoethanolamine; Pyrophosphate; Adenosine triphosphate; ADP; CDP-ethanolamine; Carbon dioxide; Hydrogen Ion |
12 |
1 |
0.024 |
0.0238 |
1 |
0.621 |
SMPDB |
Phosphatidylcholine Biosynthesis |
Cytidine triphosphate; Cytidine monophosphate; Choline; Ethanolamine; O-Phosphoethanolamine; Pyrophosphate; Adenosine triphosphate; S-Adenosylhomocysteine; S-Adenosylmethionine; ADP; CDP-ethanolamine; Phosphorylcholine; Carbon dioxide; Hydrogen Ion |
14 |
1 |
0.0279 |
0.0278 |
1 |
0.621 |
SMPDB |
Beta Oxidation of Very Long Chain Fatty Acids |
L-Carnitine; L-Acetylcarnitine; Caprylic acid; Capric acid; Caproic acid; Adenosine triphosphate; Magnesium; Dodecanoic acid; Acetyl-CoA; ADP; Coenzyme A; Tetradecanoyl-CoA; Tetracosanoic acid; Hexacosanoic acid; Lauroyl-CoA; Hexacosanoyl-CoA; Tetracosanoyl-CoA |
17 |
1 |
0.0339 |
0.0337 |
1 |
0.621 |
SMPDB |
Betaine Metabolism |
Betaine; Adenosine; Dimethylglycine; Choline; Pyrophosphate; Adenosine triphosphate; Magnesium; Potassium; Methionine; Homocysteine; NAD; S-Adenosylhomocysteine; S-Adenosylmethionine; FAD; Betaine aldehyde; Zinc; 5-Methyltetrahydrofolic acid; Phosphate; NADH; Tetrahydrofolic acid; Water |
21 |
1 |
0.0419 |
0.0415 |
1 |
0.621 |
SMPDB |
Carnitine Synthesis |
Ascorbic acid; L-Carnitine; Glycine; Lysine; Oxoglutaric acid; Succinic acid; Fe2+; NAD; S-Adenosylhomocysteine; 4-Trimethylammoniobutanoic acid; S-Adenosylmethionine; N6,N6,N6-Trimethyl-L-lysine; 4-Trimethylammoniobutanal; Hydrogen; Oxygen; 3-Hydroxy-N6,N6,N6-trimethyl-L-lysine; NADH; Pyridoxal 5'-phosphate; Carbon dioxide; Water; D-Lysine; Hydrogen Ion |
22 |
1 |
0.0439 |
0.0435 |
1 |
0.621 |
SMPDB |
Oxidation of Branched Chain Fatty Acids |
Ascorbic acid; L-Carnitine; L-Acetylcarnitine; Oxoglutaric acid; Pyrophosphate; Succinic acid; Adenosine triphosphate; Magnesium; Pristanic acid; Phytanic acid; Propionylcarnitine; Acetyl-CoA; Propionyl-CoA; 2-Hydroxyphytanoyl-CoA; ADP; Phytanoyl-CoA; Thiamine pyrophosphate; Oxygen; Coenzyme A; Pristanal; Carbon dioxide; Pristanoyl-CoA; Formyl-CoA; 4,8 Dimethylnonanoyl carnitine; 4,8-Dimethylnonanoyl-CoA; Iron |
26 |
1 |
0.0519 |
0.0512 |
1 |
0.621 |
SMPDB |
Mitochondrial Beta-Oxidation of Short Chain Saturated Fatty Acids |
Adenosine monophosphate; L-Carnitine; Pyrophosphate; Caprylic acid; Caproic acid; Adenosine triphosphate; Octanoylcarnitine; NAD; Octanoyl-CoA; Butyryl-CoA; 3-Hydroxybutyryl-CoA; Acetyl-CoA; FAD; Hydrogen; Coenzyme A; Acetoacetyl-CoA; NADH; Crotonoyl-CoA; Water; Hexanoyl-CoA; (S)-Hydroxyoctanoyl-CoA; 3-Oxooctanoyl-CoA; (S)-Hydroxyhexanoyl-CoA; 3-Oxohexanoyl-CoA; trans-2-Hexenoyl-CoA; (2E)-Octenoyl-CoA; Hydrogen Ion |
27 |
1 |
0.0539 |
0.0532 |
1 |
0.621 |
SMPDB |
Mitochondrial Beta-Oxidation of Long Chain Saturated Fatty Acids |
Adenosine monophosphate; L-Carnitine; Pyrophosphate; Adenosine triphosphate; Magnesium; Stearic acid; Stearoylcarnitine; NAD; Stearoyl-CoA; Acetyl-CoA; FAD; Palmityl-CoA; Hydrogen; Coenzyme A; NADH; Tetradecanoyl-CoA; Water; Lauroyl-CoA; (S)-3-Hydroxyhexadecanoyl-CoA; (S)-3-Hydroxytetradecanoyl-CoA; 3-Oxotetradecanoyl-CoA; (2E)-Hexadecenoyl-CoA; (2E)-Tetradecenoyl-CoA; 3-Oxohexadecanoyl-CoA; 3-Oxooctadecanoyl-CoA; trans-Octadec-2-enoyl-CoA; (S)-Hydroxyoctadecanoyl-CoA; Hydrogen Ion |
28 |
1 |
0.0559 |
0.0551 |
1 |
0.621 |
SMPDB |
Phospholipid Biosynthesis |
Choline; Glycerylphosphorylethanolamine; Glycerol 3-phosphate; Ethanolamine; Calcium; Magnesium; PC(32:0); PS(16:0/16:0); PA(16:0/16:0); Acetylcholine; NAD; FADH; FAD; Manganese; Palmityl-CoA; Citicoline; Dihydroxyacetone phosphate; NADH; Phosphorylcholine; CDP-DG(16:0/16:0); DG(16:0/16:0); LysoPA(16:0/0:0); PE(16:0/16:0); PI(16:0/16:0); LysoPC(16:0/0:0); PG(16:0/16:0); LysoPE(16:0/0:0); PGP(16:0/16:0); CL(16:0/16:0/16:0/16:0) |
29 |
1 |
0.0579 |
0.0571 |
1 |
0.621 |
SMPDB |
Methionine Metabolis |
2-Ketobutyric acid; Betaine; Adenosine monophosphate; Adenosine; Ammonia; Dimethylglycine; Choline; L-Cystathionine; Glycine; Serine; Pyrophosphate; Sarcosine; Adenosine triphosphate; Magnesium; L-Cysteine; Potassium; Methionine; L-Homoserine; Homocysteine; NAD; S-Adenosylhomocysteine; 5-Methylthioribose 1-phosphate; 10-Formyltetrahydrofolate; S-Adenosylmethioninamine; 5'-Methylthioadenosine; S-Adenosylmethionine; FAD; Spermidine; Zinc; Oxygen; 5-Methyltetrahydrofolic acid; Putrescine; Phosphate; NADH; Pyridoxal 5'-phosphate; 5,10-Methylene-THF; 2-Oxo-4-methylthiobutanoic acid; Tetrahydrofolic acid; Carbon dioxide; Methionine sulfoxide; Water; Hydrogen peroxide |
42 |
1 |
0.0838 |
0.0821 |
1 |
0.749 |
SMPDB KEGG |
Fatty acid Metabolism |
Adenosine monophosphate; L-Carnitine; Palmitic acid; L-Palmitoylcarnitine; Pyrophosphate; Adenosine triphosphate; Magnesium; NAD; Octanoyl-CoA; Butyryl-CoA; 3-Hydroxybutyryl-CoA; Acetyl-CoA; FAD; Palmityl-CoA; Glutaryl-CoA; Coenzyme A; Acetoacetyl-CoA; NADH; Tetradecanoyl-CoA; Carbon dioxide; Crotonoyl-CoA; Water; Hexanoyl-CoA; Lauroyl-CoA; (S)-3-Hydroxyhexadecanoyl-CoA; (S)-3-Hydroxytetradecanoyl-CoA; 3-Oxotetradecanoyl-CoA; (S)-3-Hydroxydodecanoyl-CoA; 3-Oxododecanoyl-CoA; (S)-Hydroxydecanoyl-CoA; 3-Oxodecanoyl-CoA; (S)-Hydroxyoctanoyl-CoA; 3-Oxooctanoyl-CoA; (S)-Hydroxyhexanoyl-CoA; 3-Oxohexanoyl-CoA; trans-2-Hexenoyl-CoA; (2E)-Hexadecenoyl-CoA; (2E)-Tetradecenoyl-CoA; (2E)-Decenoyl-CoA; (2E)-Octenoyl-CoA; 3-Oxohexadecanoyl-CoA; Decanoyl-CoA (n-C10:0CoA); Hydrogen Ion |
43 |
1 |
0.0858 |
0.084 |
1 |
0.749 |
SMPDB KEGG |
Implications for food authentication
Metabolomic fingerprinting is increasingly integrated into regulatory and industry practice through validated targeted panels and robust untargeted workflows that support routine screening and origin assignment. Validated LC–MS methods for geographic discrimination in commodities such as hazelnuts demonstrate how panels can be translated to routine laboratories with internal‑standarded quantitation and guideline‑level validation [66]. Non‑targeted LC‑MS and NMR fingerprinting, when coupled with chemometrics and cross‑laboratory testing, achieve high classification performance and outline feasible routes to routine adoption [39,67]. Implementation requires stringent QA/QC, representative sampling, and harmonized preprocessing to ensure interlaboratory comparability [68-70]. Prospects for deploying biomarker panels are strong—multiplexed, sensitive, and rapid—but constrained by annotation uncertainty, inter‑lab variability, and incomplete spectral/RT/ collision cross-section (CCS) resources; orthogonal validation and standardized workflows are prerequisites for regulatory acceptance [66,71,72].
Limitations and future directions
Common limitations in food metabolomics include non‑representative sampling and variable sample preparation, which introduce bias and reduce reproducibility [44]. Interlaboratory analytical differences and limited coverage of untargeted MS libraries hinder marker transferability across platforms [44,73]. Annotation gaps persist because many LC–HRMS features lack confident MS/MS, retention‑time, or collision cross‑section matches, inflating false positives and constraining pathway or biomarker assignment [74]. Robust QA/QC, batch references, and stringent feature filtering are essential but not uniformly applied [51]. To remedy these challenges, integrative multi‑omics with metagenomics/transcriptomics and targeted validation can increase mechanistic resolution and marker robustness [75]. Longitudinal sampling and population reference sets improve sensitivity to temporal variability and support regulatory translation [51,76]. Collectively, multi‑omics, temporal designs, and strengthened QA/QC can bridge discovery‑stage annotations to validated, deployable authentication assays [77,78].
Broader context and significance
Metabolomic analysis valorizes and protects culinary heritage by generating comprehensive molecular fingerprints that document provenance, processing, and varietal traits for certification and traceability; consortia‑level efforts underscore the creation of molecular reference libraries and workflows to support origin and quality claims [79]. Such fingerprints also link culinary practices to health‑related intake markers, enabling nutritional narratives that bolster cultural products [80]. For fish‑based foods, metabolomics connects authenticity and nutritional quality by resolving spoilage‑ and processing‑related metabolites that track freshness, storage effects, and biogenic amine risk, while microbial drivers of amine formation explain compositional changes relevant to safety and identity [81]. Finally, cross‑platform validation and advanced separations (e.g., ion mobility) improve robustness and transferability necessary for regulatory adoption [82]. In this context, our pempek case study illustrates how rigorously validated LC–HRMS chemometrics can provide culturally meaningful, scientifically defensible evidence to safeguard geographic identity and inform industry practice.
Conclusions
This study demonstrates that non‑targeted LC–HRMS metabolomics, interpreted within a rigorously validated chemometric framework, yields a reliable molecular fingerprint of pempek and enables robust discrimination of geographic origin between Jambi and South Sumatra. Convergent evidence across analytical layers indicated coherent biochemical themes: Jambi products showed elevated carnitines, choline, and creatinine, whereas South Sumatra products exhibited enrichment of ether-linked phosphatidylcholines and sphingomyelins. Pathway enrichment mapped these differences to phosphatidylethanolamine/ phosphatidylcholine biosynthesis and carnitine-associated β-oxidation, providing mechanistic context for the observed separations. Receiver Operating Characteristic (ROC) analysis of a parsimonious multi-marker panel yielded near-perfect cross-validated performance, underscoring translational potential for geographic authentication.
Beyond identifying an operational marker set, the work contributes to the field by disentangling endogenous metabolic traits from exogenous processing signatures within a single non‑targeted workflow. This integrative perspective strengthens the evidentiary basis for authenticity claims and suggests broader applicability to traditional aquatic foods. Next steps include external, multi-season and interlaboratory validation, confirmation of key markers with authentic standards and orthogonal MS/MS (and, where appropriate, NMR), and translation into targeted assays with internal-standardized quantitation suited to regulatory and industrial use. Expanding regional coverage and recording environmental covariates at sampling will further resolve habitat versus processing contributions. Collectively, these steps will convert discovery‑stage fingerprints into robust, reproducible tools for safeguarding the identity, quality, and cultural value of regionally branded fish‑based foods.
Declaration of generative AI in scientific writing
During the preparation of this work the author(s) used ChatGPT to improve manuscript writing. After using this tool/service, the author(s) reviewed and edited the content as needed and take(s) full responsibility for the content of the published article.
CRediT author statement
Agus Supriadi: Conceptualization; Methodology; Writing - Original draft preparation. Daniel Saputra: Writing - Review & Editing. Sherly Ridhowati: Investigation; Software; Formal analysis. Shanti Dwita Lestari: Review & Editing. Wulandari: Software; Validation. Diah Anggraini Wulandari: Data Curation; Validation; Writing. Siti Nurhasanah: Writing - Reviewing and Editing
References
[1] X Ma, D Su, J Zhu, J Miao, X Liu, K Leng, X Wang and W Xie. Comparative metabolomics study on the quality of Antarctic krill (Euphausia superba) stored at different temperatures. International Journal of Food Science & Technology 2024; 59(7), 4489-4499.
[2] X Wang, Y Li, L Chen and J Zhou. Analytical strategies for LC-MS-Based untargeted and targeted metabolomics approaches reveal the entomological origins of honey. Journal of Agricultural and Food Chemistry 2022; 70(4), 1358-1366.
[3] S Hemmer, SK Manier, S Fischmann, F Westphal, L Wagmann and MR Meyer. Comparison of three untargeted data processing workflows for evaluating LC-HRMS metabolomics data. Metabolites 2020; 10(9), 378.
[4] CK Asef, MA Rainey, BM. Garcia, GJ Gouveia, AO Shaver, FE Leach, AM Morse, AS Edison, LM McIntyre and FM Fernández. Unknown metabolite identification using machine learning collision cross-section prediction and tandem mass spectrometry. Analytical Chemistry 2023; 95(2), 1047-1056.
[5] JM Malinowska, T Palosaari, J Sund, D Carpi, GR Lloyd, RJM Weber, M Whelan amd MR Viant. Automated sample preparation and data collection workflow for high-throughput in vitro metabolomics. Metabolites 2022; 12(1), 52.
[6] H Liang and K Song. Comprehensive metabolomics and transcriptomics analysis reveals protein and amino acid metabolic characteristics in liver tissue under chronic hypoxia. PLoS One 2023; 18(9), e0291798.
[7] DG Wu, CR Harris, KM Kalis, M Bowen, JF Biddle and IF Farag. Comparative metagenomics of tropical reef fishes show conserved core gut functions across hosts and diets with diet-related functional gene enrichments. Applied and Environmental Microbiology 2025; 91(2), e0222924.
[8] N Zhou, T Gu, M Duan, Y Tian, L Chen, T Zeng, X Hou, X Wang, Q Xu, Y Zhang and L Lu. Gut microbiota dysbiosis exacerbates polystyrene microplastics-induced liver inflammation via activating LPS/TLR4 signaling pathway in ducks. Poultry Science 2025; 104(11), 105757.
[9] L Malm, E Palm, A Souihi, M Plassmann, J Liigand and A. Kruve. Guide to semi-quantitative non-targeted screening using LC/ESI/HRMS. Molecules 2021; 26(12), 3524.
[10] S Li, A Siddiqa, M Thapa, Y Chi and S Zheng. Trackable and scalable LC-MS metabolomics data processing using asari. Nature Communications 2023; 14(1), 4113.
[11] J Zhang, M Sun, AH Elmaidomy, KA Youssif, AMM Zaki, HH Kamal, AM Sayed and UR Abdelmohsen. Emerging trends and applications of metabolomics in food science and nutrition. Food & Function 2023; 14(20), 9050-9082.
[12] D Dörfel, S Rohn and E Jantzen. Electrostatic repulsion hydrophilic interaction liquid chromatography (ERLIC) for the quantitative analysis of polyamines. Journal of Chromatography 2024; 1720, 464820.
[13] RE Danczak, RK Chu, SJ Fansler, AE Goldman, EB Graham, MM Tfaily, J Toyoda and JC Stegen. Using metacommunity ecology to understand environmental metabolomes. Nature Communications 2020; 11(1), 6369.
[14] Z Pang, J Chong, S Li and J Xia. Metaboanalystr 3.0: Toward an optimized workflow for global metabolomics. Metabolites 2020; 10(5), 186.
[15] A Supriadi, S Ridhowati, D Saputra and SD Lestari. Untargeted metabolomics profiling for the geographical authentication of traditional pempek using high-resolution orbitrap mass spectrometry. Food Chemistry Advances 2025; 6, 100914.
[16] A Windarsih, Suratno, HD Warmiko, AW Indrianingsih, A Rohman and YI Ulumuddin. Untargeted metabolomics and proteomics approach using liquid chromatography-Orbitrap high resolution mass spectrometry to detect pork adulteration in Pangasius hypopthalmus meat. Food Chem 2022; 386, 132856.
[17] A Supriadi, S Ridhowati, D Saputra, Wulandari and SD Lestari. Untargeted metabolomics profiling for the geographical authentication of traditional pempek using high-resolution orbitrap mass spectrometry. Food Chemistry Advances 2025; 6, 100914.
[18] J Kusuma, Analianasari, A Wahyudi, MK Abdullah, AZ Hasan, I Asrowardi, Fitriani and M Tahir. Diversity of the non-targeted metabolomic data across various varieties of Cloves (Syzygium spp.). Data in Brief 2024; 58, 111237.
[19] MT Fernández-del-Campo-García, AM Casas-Ferreira, E Rodríguez-Gonzalo and JLP Pavón. Combining Orbitrap-HRMS acquisition modes and direct injection by a guard column for targeted analysis of underivatized amino acids in urine. Microchemical Journal 2024; 196, 109663,
[20] A Windarsih, Suratno, HD Warmiko, AW Indrianingsih, A Rohman and YI Ulumuddin. Untargeted metabolomics and proteomics approach using liquid chromatography-Orbitrap high resolution mass spectrometry to detect pork adulteration in Pangasius hypopthalmus meat. Food Chemistry 2022; 386, 132856.
[21] CH Yong, SA Muhammad, FA Aziz, FI Nasir, MZ Mustafa, B Ibrahim, SD Kelly, A Cannavan and EK Seow. Detecting adulteration of stingless bee honey using untargeted 1H NMR metabolomics with chemometrics. Food Chemistry 2022; 368, 130808.
[22] Y Pan, Hui-Wen Gu, Y Lv, XL Yin, Y Chen, W Long, H Fu and Y She. Untargeted metabolomic analysis of Chinese red wines for geographical origin traceability by UPLC-QTOF-MS coupled with chemometrics. Food Chemistry 2022; 394, 133473.
[23] A Akbar AJr Siddiqui, A Raza, A Zia, K Nakyinsige, K Hakiimu and SG Musharraf. Untargeted-metabolomics differentiation of unripened cow milk cheese produced from different sources of rennet. Food Control 2025; 171, 111113.
[24] G Riquelme, N Zabalegui, P Marchi, CM Jones and ME Monge. A python-based pipeline for preprocessing LC–MS data for untargeted metabolomics workflows. Metabolites 2020; 10(10), 416.
[25] JD Mosley, TB Schock, CW Beecher, WB Dunn, J Kuligowski, MR Lewis, G Theodoridis, CZU Holland, D Vuckovic, ID Wilson and KA Zanetti. Establishing a framework for best practices for quality assurance and quality control in untargeted metabolomics. Metabolomics 2024; 20(2), 20.
[26] X Shen, R Wang, X Xiong, Y Yin, Y Cai, Z Ma, N Liu and ZJ Zhu. Metabolic reaction network-based recursive metabolite annotation for untargeted metabolomics. Nature Communications 2019; 10(1), 1516.
[27] P Bonini, T Kind, H Tsugawa, DK Barupal and O Fiehn. Retip: Retention time prediction for compound annotation in untargeted metabolomics. Analytical chemistry 2020; 92(11), 7515-7522.
[28] CM Vitale, A Lommen, C Huber, K Wagner, BG Molina, R Nijssen, EJ Price, M Blokland, F Tricht, HGJ Mol, M Krauss, L Debrauwer, O Pardo, N Leon, J Klanova and JP Antignac. Harmonized quality assurance/quality control provisions for nontargeted measurement of urinary pesticide biomarkers in the HBM4EU multisite SPECIMEn study. Analytical Chemistry 2022, 94(22), 7833-7843.
[29] H Villalba, M Llambrich, J Gumá, J Brezmes and R Cumeras. A metabolites merging strategy (MMS): Harmonization to enable studies’ intercomparison. Metabolites 2023; 13(12), 1167.
[30] S Hemmer, SK Manier, S Fischmann, F Westphal, L Wagmann and MR Meyer. Comparison of three untargeted data processing workflows for evaluating LC-HRMS metabolomics data. Metabolites 2020; 10(9), 378.
[31] R Gil‐Solsona, J Nácher-Mestre, L Lacalle-Bergeron, JV Sancho, JA Calduch-Giner, F Hernández and J Pérez-Sánchez. Untargeted metabolomics approach for unraveling robust biomarkers of nutritional status in fasted gilthead sea bream (<i>Sparus Aurata</I>). PeerJ 2017; 5, e2920.
[32] M Schwaiger-Haber, H Schoeny, YE Abiead, G Hermann, E Rampler and G Koellensperger. Merging metabolomics and lipidomics into one analytical run. Analyst 2019; 144(1), 220-229
[33] KN Tran, HG Sutherland, A Mallett, LR Griffiths and RA Lea. New composite phenotypes enhance chronic kidney disease classification and genetic associations. PLoS Genetics 2025; 21(5), e1011718
[34] Y Xu, L Cao, Y Chen, Z Zhang, W Liu, H Li, C Ding, J Pu, K Qian and W Xu. integrating machine learning in metabolomics: A path to enhanced diagnostics and data interpretation. Small Methods 2024; 8(12), e2400305.
[35] N Sousa, MJ Moreira, C Saraiva and JMMMD Almeida. Applying fourier transform mid infrared spectroscopy to detect the adulteration of salmo salar with oncorhynchus mykiss. Foods 2018; 7(4), 55.
[36] M Barranco-Altirriba, P Solà-Santos, S Picart-Armada, S Kanaan-Izquierdo, J Fonollosa and A Perera-Lluna. MWISE: An Algorithm for Context-Based Annotation of Liquid Chromatography-Mass Spectrometry Features through Diffusion in Graphs. Analytical Chemistry 2021; 93(31), 10772-10778
[37] I Blaženović, T Kind, J Ji and O Fiehn. Software tools and approaches for compound identification of LC-MS/MS data in metabolomics. Metabolites 2018; 8(2), 31.
[38] JA Etzel and TS Braver. MVPA permutation schemes: Permutation testing in the land of cross-validation. In Proceedings - 2013 3rd International Workshop on Pattern Recognition in Neuroimaging, Philadelphia, United States. 2013, pp. 140-143.
[39] D Schütz, E Achten, M Creydt, J Riedl and M Fischer. Non-targeted LC-MS metabolomics approach towards an authentication of the geographical origin of grain maize (Zea mays L.) samples. Foods 2021; 10(9), 2160.
[40] A Maléchaux, YL Dréau, J Artaud and N Dupuy. Control chart and data fusion for varietal origin discrimination: Application to olive oil. Talanta 2020; 217, 121115.
[41] X Wang, C Li, Z Li, Y Qi, X Zhang, X Zhao, C Zhao, X Lin, X Lu and G Xu. A structure-guided molecular network strategy for global untargeted metabolomics data annotation. Analytical Chemistry2023; 95(31), 11603-11612.
[42] TN Bayissa, M Geerardyn, D Vanhauteghem, M Wakjira and GPJ Janssens. Nutrient-related metabolite profiles explain differences in body composition and size in Nile tilapia (Oreochromis niloticus) from different lakes. Scientific Reports 2021; 11(1), 16824
[43] M Schwaiger, H Schoeny, YE Abiead, G Hermann, E Rampler and G Koellensperger. Merging metabolomics and lipidomics into one analytical run. Analyst 2018; 144(1), 220-229.
[44] S Nishiumi Y Izumi, A Hirayama, M Takahashi, M Nakao, K Hata, D Saigusa, E Hishinuma, N Matsukawa, SM Tokuoka, Y Kita, F Hamano, N Okahashi, K Ikeda, H Nakanishi, K Saito, MY Hirai, M Yoshida, Y Oda, F Matsuda and T Bamba. Comparative evaluation of plasma metabolomic data from multiple laboratories. Metabolites 2022; 12(2), 135.
[45] YC Sun, SC Han, MZ Yao, YM Wang, LW Geng, P Wang, WH Lu and HB Liu. High-throughput metabolomics method based on liquid chromatography-mass spectrometry: Insights into the underlying mechanisms of salinity–alkalinity exposure-induced metabolites changes in Barbus capito. Journal of Separation Science 2021; 44(2), 497-512.
[46] X Liang, Q He, G Qin, G Li, Q Li, H Tan, Z Wang, M Fan and D Xu. Effectively removing the homodimer in bispecific antibodies by weak partitioning mode of anion exchange chromatography. Journal of Chromatography B 2023; 1225, 123767,
[47] GJ Gouveia, AO Shaver, BM Garcia, AM Morse, EC Andersen, AS Edison and LM McIntyre. Long-term metabolomics reference material. Analytical Chemistry 2021; 93(26), 9193-9199.
[48] C Claassen, J Kuballa and S Rohn. Polar lipids in starch-rich commodities to be analyzed with LC-MS-Based metabolomics—optimization of ionization parameters and high-throughput extraction protocols. Metabolites 2019; 9(8), 167.
[49] J Ivanišević and EJ Want. From samples to insights into metabolism: Uncovering biologically relevant information in LC-HRMS metabolomics data. Metabolites 2019; 9(12), 308.
[50] R González-Domínguez, A Sayago and Á Fernández-Recamales. An overview on the application of chemometrics tools in food authenticity and traceability. Foods 2022; 11(23), 3940.
[51] M Bongaerts R Bonte, S Demirdas, EH Jacobs, E Oussoren, AT Ploeg, MAEM Wagenmakers, RMW Hofstra, HJ Blom, MJT Reinders and GJG Ruijter. Using out-of-batch reference populations to improve untargeted metabolomics for screening inborn errors of metabolism. Metabolites 2020; 11(1), 8.
[52] S Zheng. Safeguarding food heritage through social media? between heritagization and commercialization. International Journal of Gastronomy and Food Science 2023; 31, 100678.
[53] A Scalbert, L Brennan, O Fiehn, T Hankemeier, BS Kristal, B Ommen, E Pujos-Guillot, E Verheij, D Wishart and S Wopereis. Mass-spectrometry-based metabolomics: Limitations and recommendations for future progress with particular focus on nutrition research. Metabolomics 2009; 5(4), 435-458.
[54] C Lavarello, S Barco, M Bartolucci, I Panfoli, E Magi, G Tripodi, A Petretto and G Cangemi. Development of an accurate mass retention time database for untargeted metabolomic analysis and its application to plasma and urine pediatric samples. Molecules 2021; 26(14), 4256.
[55] YP Tsentalovich, EA Zelentsova, LV Yanshole, VV Yanshole and IM Odud. Most abundant metabolites in tissues of freshwater fish pike-perch (Sander lucioperca). Scientific Reports 2020; 10, 17128.
[56] G Pimentel, D Burnand, LH Münger, FP Pralong, N Vionnet, R Portmann and G Vergères. Identification of milk and cheese intake biomarkers in healthy adults reveals high interindividual variability of lewis system–Related oligosaccharides. Journal of Nutrition 2020; 150(5), 1058-1067,
[57] M Kortesniemi, S Noerman, A Kårlund, J Raita, T Meuronen, V Koistinen, R Landberg and K Hanhineva. Nutritional metabolomics: Recent developments and future needs. Current Opinion in Chemical Biology 2023; 77, 102400.
[58] M Vinaixa, EL Schymanski, S Neumann, M Navarro, RM Salek and O Yanes. Mass spectral databases for LC/MS- and GC/MS-based metabolomics: State of the field and future prospects. TrAC - Trends in Analytical Chemistry 2016; 78, 23-35.
[59] RM Boiteau, DW Hoyt, CD Nicora, HA Kinmonth-Schultz, JK Ward and K Bingol. Structure elucidation of unknown metabolites in metabolomics by combined NMR and MS/MS prediction. Metabolites 2018; 8(1), 8.
[60] YP Tsentalovich, EA Zelentsova, ED Savina, VV Yanshole and RZ Sagdeev. Influence of ecological factors on the metabolomic composition of fish lenses. Biology 2022; 11(12), 1709.
[61] Y Peng, C Zheng, S Guo, F Gao, X Wang, Z Du, F Gao, F Su, W Zhang, X Yu, G Liu, B Liu, C Wu, Y Sun, Z Yang, Z Hao and X Yu. Metabolomics integrated with machine learning to discriminate the geographic origin of Rougui Wuyi rock tea. NPJ Science of Food 2023; 7, 7.
[62] B Zhang, S Hu, E Baskin, A Patt, JK Siddiqui and EA Mathé. RaMP: A comprehensive relational database of metabolomics pathways for pathway enrichment analysis of genes and metabolites. Metabolites 2018; 8(1), 16.
[63] P Bonini, T Kind, H Tsugawa, DK Barupal and O Fiehn. Retip: Retention time prediction for compound annotation in untargeted metabolomics. Analytical Chemistry 2020; 92(11), 7515-7522.
[64] L Cottret, D Wildridge, F Vinson, MP Barrett, H Charles, MF Sagot and F Jourdan. MetExplore: A web server to link metabolomic experiments and genome-scale metabolic networks. Nucleic Acids Research 2010; 38(S2), W132-W137.
[65] M Bayerlová, K Jung, F Kramer, F Klemm, A Bleckmann and T Beißbarth. Comparative study on gene set and pathway topology-based enrichment methods. BMC Bioinformatics 2015; 16(1), 344.
[66] S Klockmann, E Reiner, N Cain and M Fischer. Food targeting: Geographical origin determination of hazelnuts (corylus avellana) by LC-QqQ-MS/MS-Based targeted metabolomics application. Journal of Agricultural and Food Chemistry 2017; 65(7), 1456-1466.
[67] B Musio, R Ragone, S Todisco, A Rizzuti, E Iorio, M Chirico, ME Pisanu, N Meloni, P Mastrorilli and V Gallo. Non-targeted nuclear magnetic resonance analysis for food authenticity: A comparative study on tomato samples. Molecules 2024; 29(18), 4441.
[68] T Martinović, M Šrajer Gajdošik and D Josić. Sample preparation in foodomic analyses. Electrophoresis 2018; 39(13), 1527-1542.
[69] AM Teixeira, JMGD Queiroz, BC Garrido, AJR Silva, A Bauermeister and RM Borges. Quality assurance in untargeted metabolomics. Quim Nova 2025; 48(3), e-20250048.
[70] G Riquelme, EE Bortolotto, M Dombald and M Eugenia. Model-driven data curation pipeline for LC–MS-based untargeted metabolomics. Metabolomics 2023; 19(3), 15.
[71] M Lenski, S Maallem, G Zarcone, G Garçon, JM Lo-Guidice, S Anthérieu and D Allorge. Prediction of a Large-Scale database of collision cross-section and retention time using machine learning to reduce false positive annotations in untargeted metabolomics. Metabolites 2023; 13(2), 282.
[72] E Sinclair, KA Hollywood, C Yan, R Blankley, R Breitling and P Barran. Mobilising ion mobility mass spectrometry for metabolomics. Analyst 2018; 143(19), 4783-4788.
[73] VM Koistinen, AB Silva, L Abrankó, D Low, RG Villalba, FT Barberán, R Landberg, O Savolainen, I Alvarez-Acero, SD Pascual-Teresa, CV Poucke, C Almeida, L Petrásková, K Valentová, S Durand, W Wiczkowski, D Szawara-Nowak, R González-Domínguez, R Llorach, C Andrés-Lacueva, … MR Bronze. Interlaboratory coverage test on plant food bioactive compounds and their metabolites by mass spectrometry-based untargeted metabolomics. Metabolites 2018; 8(3), 46.
[74] ZA Quinlan, I Koester, AT Aron, D Petras, LI Aluwihare, PC Dorrestein, CE Nelson and LW Kelly. ConCISE: Consensus annotation propagation of ion features in untargeted tandem mass spectrometry combining molecular networking and In Silico metabolite structure prediction. Metabolites 2022; 12(12), 1275.
[75] Y Cui, D Pan, Ji Feng, D Zhao, M Liu, Z Dong, S Liu and S Wang. Untargeted metabolomics and soil community metagenomics analyses combined with machine learning evaluation uncover geographic differences in ginseng from different locations. Journal of Agricultural and Food Chemistry 2024; 72(39), 21922-21934.
[76] Y Wang, RA Hodge, VL Stevens, TJ Hartman and ML McCullough. Identification and reproducibility of urinary metabolomic biomarkers of habitual food intake in a cross-sectional analysis of the cancer prevention study-3 diet assessment sub-study. Metabolites 2021; 11(4), 248.
[77] M Bongaerts, R Bonte, S Demirdas, EH Jacobs, E Oussoren, AT Ploeg, MAEM Wagenmakers, RMW Hofstra, HJ Blom, MJT Reinders and GJG Ruijter. Using out-of-batch reference populations to improve untargeted metabolomics for screening inborn errors of metabolism. Metabolites 2020; 11(1), 8.
[78] X Wu, W Huang, K Wang, Y Han and Z Liu. Visual bibliometric analysis of the research status and hotspots of myopia in children and adolescents in the past five years. Chinese Journal of Optometry Ophthalmology and Visual Science 2024; 26(9), 677-684.
[79] G Theodoridis, A Pechlivanis, NS Thomaidis, A Spyros, CA Georgiou, T Albanis, I Skoufos, S Kalogiannis, GT Tsangaris, AS Stasinakis, I Konstantinou, A Triantafyllidis, K Gkagkavouzis, AS Kritikou, ME Dasenaki, H Gika, C Virgiliou, D Kodra, N Nenadis, I Sampsonidis, … OBO The FoodOmicsGR Ri Consortium. Foodomicsgr_ri. a consortium for comprehensive molecular characterisation of food products. Metabolites 2021; 11(2), 74.
[80] J Wang, Y Xue, P Wang, J Chen and L Yao. Participation mode and production efficiency enhancement mechanism of Geographical Indication products in rural areas: A meta-frontier analysis. Physics and Chemistry of the Earth 2021; 121, 102982.
[81] A Kritikos, I Aska, S Ekonomou, A Mallouchos, FF Parlapani, SA Haroutounian and IS Boziaris. Volatilome of chill-stored european seabass (Dicentrarchus labrax) fillets and atlantic salmon (salmo salar) slices under modified atmosphere packaging. Molecules 2020; 25(8), 1981.
[82] T Cajka. Liquid chromatography–mass spectrometry–based metabolomics approaches for foodomics research. Current Opinion in Food Science 2024; 58, 101201.