Trends
Sci.
2026;
23(6):
12137
Microstructural Characterization of Cassava Flour Biscuit: Effect of Cassava Cultivar and Flour Particle Size
Slamet
Sulistiadi1,2,
![]() ,
Nursigit Bintoro1,*,
,
Nursigit Bintoro1,*,
Joko
Nugroho Wahyu Karyadi1,
![]() and Arifin Dwi Saputro1,
and Arifin Dwi Saputro1,
![]()
1Department of Agricultural and Biosystems Engineering, Faculty of Agricultural Technology,
Gadjah Mada University, Yogyakarta 55281, Indonesia
2Department of Agricultural and Biosystems Engineering, Universitas of Nahdlatul Ulama,
Purwokerto 10320, Indonesia
(*Corresponding author’s e-mail: [email protected])
Received: 1 October 2025, Revised: 6 November 2025, Accepted: 13 November 2025, Published: 1 February 2026
Abstract
Cultivar and particle size of cassava flour are two important factors that greatly influence the characteristics of the resulting biscuits. This study proposes to evaluate the effect of cultivar and particle size of cassava flour on the microstructural characteristics of the biscuits it produces. Research was carried out using a 4×2 Factorial-Completely Randomized Design, with 4 cassava cultivars and 2 particle sizes. It was found that Kamling cultivar with 100-mesh sieve produced the smallest biscuit granules (18.99 µm), while Slenteng cultivar with 140-mesh sieve yielded the smallest biscuit pores (13.20 µm). Cassava cultivar, flour particle size, and their interaction significantly and distinctly affected biscuit granule diameter, pore diameter, surface roughness (Ra, Rq, Rz), topography (height distribution), and elemental content of carbon and oxygen, but showed no significant effect on nitrogen atom levels. The lowest roughness parameters were found in Slenteng cultivar with mesh 140, showing Ra (0.22), Rq (0.30) and Rz (2.52). The EDS analysis results of cassava biscuit indicated the presence of carbon (C) > oxygen (O) > nitrogen (N) in the majority of biscuit evaluated.
Keywords: Cassava flour cultivar, Flour particle size, Biscuit microstructure, Surface roughness parameters, Granule and pore morphology, Element composition, Wheat flour substitution
Introduction
The use of cassava flour as a substitute for wheat flour plays an important role in the field of food security and the economy in wheat importing countries such as Indonesia [1]. Supported by a global cassava production that reaches 314,806,747 tonnes [2], its abundant availability reinforces the strategic potential of cassava flour in developing sustainable and locally sourced alternatives to wheat. As a substitute for wheat, cassava flour is modified by fermentation using lactic acid bacteria to have the expected characteristics [3]. The modification process will produce pectinolytic and cellulolytic enzymes that can destroy the cassava cell wall, releasing starch granules [4]. Starch granule liberation causes changes in the characteristics of the
flour produced in the form of increased viscosity, gelation ability, rehydration power, and ease of dissolution. When the material is processed, it will be able to produce a distinctive aroma and flavor that can cover the aroma and flavor of cassava, which consumers tend to dislike. This process will also produce flour that can replace wheat flour in terms of characteristics and quality for biscuit production [4].
One of the worldʼs most popular uses of cassava flour is to replace wheat flour in bakeries [5]. This is also supported by the increasing demand for gluten-free products, so it is necessary to study the relationship between the properties of gluten-free flour and the quality of the resulting products [6]. Gluten-free bakery products from cassava flour, such as biscuit, have technical challenges because they need better performance [7]. Uncontrolled cookie texture, like being too hard, soft, or crumbly, is a significant problem which is unacceptable to consumers [8]. This condition is often attributed to the different characteristics of the cassava flour used as the primary raw material. Cassava flour requires the best cassava cultivars so that the physicochemical, functional, and product quality characteristics meet industry standards. The existence of starch modification using lactic acid bacteria in making cassava flour [9] allows cassava flour to be made using sweet or bitter cassava cultivars. Due to the diverse number of cassava cultivars, modified cassava flour has no fixed standard qualification, especially in determining the best cassava cultivar as a substitute for wheat flour processed through baking processes such as biscuit and other bakery products.
Cassava, as an easily accessible source of carbohydrates, is the main ingredient in various food products, including biscuit. The use of local cultivars not only supports food security, but also makes a significant contribution to the economy of the community. In Tamansari village, Banyumas Regency of Indonesia has various original cassava cultivars such as Kamling, Marjoko, Mertega, and Slenteng. The existence of local cultivars not only reflects the richness of local biodiversity, but also an integral part of the culinary tradition that has been inherited from previous generations. Differences in cassava cultivars significantly affects characteristics of the cassava flour produced [10]. Even for the same cassava variety, differences in production processes also result in different biscuit qualities [11]. The effect of cultivar on the flour, dough, or biscuit produced has also been reported for wheat by several researchers [12,13]. Therefore, it is emphasized that to produce a certain bakery product, it is important to use a certain type of flour [14].
Another important parameter in any bakery product manufacturing process is the particle size of flour [15,16]. The particle size will determine the structure of the flour, thus impacting the physical, functional, and microstructure properties [17]. As a non-gluten flour, the particle size of cassava flour biscuit is not ideal, resulting in a dough that is not mixed, too dense, or lumpy. According to Dziki and Krajewska [18], particle size reduction increases particle surface area and facilitates subsequent processing by increasing contact between raw materials and various factors. The larger particle size makes the dough cohesive and crumbles easily when baked [19]. Meanwhile, a particle size that is too fine also causes the crust of the cookie to be hard and the final color of the cookie to be too burnt. Previous study reveals that flour with the correct particle size significantly influences the flour gelatinization process during baking, resulting in a more homogeneous and tight starch matrix as smaller granules better fill the space between particles [20]. In this study, the microstructure quality of cassava flour cookie was improved by making cassava flour with particle size pass through 100 and 140 mesh sieves or 105 - 149 μm and less than 105 μm, aiming to determine the potential of fine particle size on biscuit quality.
The choice of flour particle size above is based on several previously reported studies. It is reported that whole pinhao flour with 105 μm particle size fraction is very promising because of the increase in carbohydrate content, total starch, and viscosity, making it ideal for bakery products, while particle size less than 105 μm results in increased fiber content, phenolic compounds, and antioxidant activity [21]. Soy flour with the particle finer than 132 µm increases protein, lipid, and ash content [19]. When related to the microstructure properties, lentil flour with the particle size less than 210 µm shows a difference in microstructure and gives a significant reduction in the size of starch granules [22]. In contrast, it is also reported that finer particle size caused significant product texture problems due to changes in flour functionality properties [22]. Smaller flour particle size improves the mixing properties of the dough, but can have a negative impact on crumb firmness [23]. Based on the above findings, differences in the particle size of flours from different plant species affect the resulting products characteristics [24]. In the absence of a regular trend between particle size and the properties and behavior of the resulting product [19] requires every powdered food raw material to have a comprehensive study of particle size to explain its further use in product development and food engineering processes.
A common trend in product quality monitoring in the food industry is monitoring products through image processing techniques by displaying structural features that provide an understanding of the underlying mechanisms of physicochemical changes [25]. Several observable attributes such as the diameter of granules and pores, roughness parameter, and surface topography will help in interpreting product quality. As a baked product, biscuit have quality standards that depend on appearance, texture, and volume [26]. These properties are significantly influenced by the structure of the food, which varies from molecular to macroscopic levels. Therefore, knowledge of the macro and microstructure of biscuit is essential, especially in modified cassava flour biscuit where there is a lack of information. Even examining the microstructure of foodstuffs is difficult because the size of the structural elements is below the range of 100 μm. Currently, a solution has been found using the popular Scanning electron microscopy (SEM) technology, as has been done by several previous studies [27]. SEM is one of the most important image analysis techniques, combining more detailed magnification, greater depth of focus, excellent resolution, and ease of sample observation. In addition to observations using SEM instruments, cassava biscuits were also studied using Energy Dispersive X-ray (EDS) spectroscopy [28] to determine how much influence cassava varieties and particle size had on the chemical structure of biscuits. This study highlights the microstructural advantages of cassava flour-based biscuits, revealing how cultivar type and flour particle size significantly influence granule diameter, pore structure, surface roughness and elements composition of biscuit. By evaluating these effects, the research provides a novel basis for optimizing biscuit formulations as a promising substitute for wheat flour.
Materials and methods
Materials
Four cassava cultivars, namely Kamling, Marjoko, Mertega, and Slenteng, obtained from local farmers in Tamansari, Banyumas Regency, Indonesia, were used as the raw materials to produce modified cassava flour (mocaf). This region is situated at a moderate elevation and features a tropical monsoon climate with fertile volcanic soils, which are favorable for root crop cultivation. Local farmers in Tamansari typically employ traditional rain-fed farming systems with minimal chemical inputs. These agroecological conditions contribute to the distinctive agronomic traits of the local cassava, including high adaptability to marginal soils and consistent starch yield, making it suitable for flour production and gluten-free food applications. The produced cassava flours were then sieved, and for research purposes, only the fine flour, that that passed through the 100 and 140 mesh sieves was used. These flours were then used to make biscuit which were used as samples in the research. Other ingredients used to make biscuit were eggs, powdered sugar, milk powder, butter, and baking powder.
Methods
In Indonesia, biscuit generally uses wheat flour with several other additional ingredients. In this study, the wheat flour was replaced with cassava flour. The composition of ingredients used to produce biscuit samples consisted of 100 g modified cassava flour, 52 g eggs, 25 g powdered sugar, 25 g milk powder, 75 g butter, and 1g baking powder. The butter, egg, and sugar powder were first mixed until a smooth paste was formed. Cassava flour, milk powder, and baking powder were then added to the mixture, followed by thorough mixing to obtain a uniform dough. The dough was rested briefly, rolled out, and cut into biscuit shapes of the desired size. The shaped dough was baked in a preheated oven at 170 °C for 20 min. After baking, the biscuits were cooled to room temperature, packed, and stored under ambient conditions [29]. A flowchart of the flour and biscuit-making process is shown in Figure 1 and the photographs of the resulted biscuit samples are shown in Figure 2.
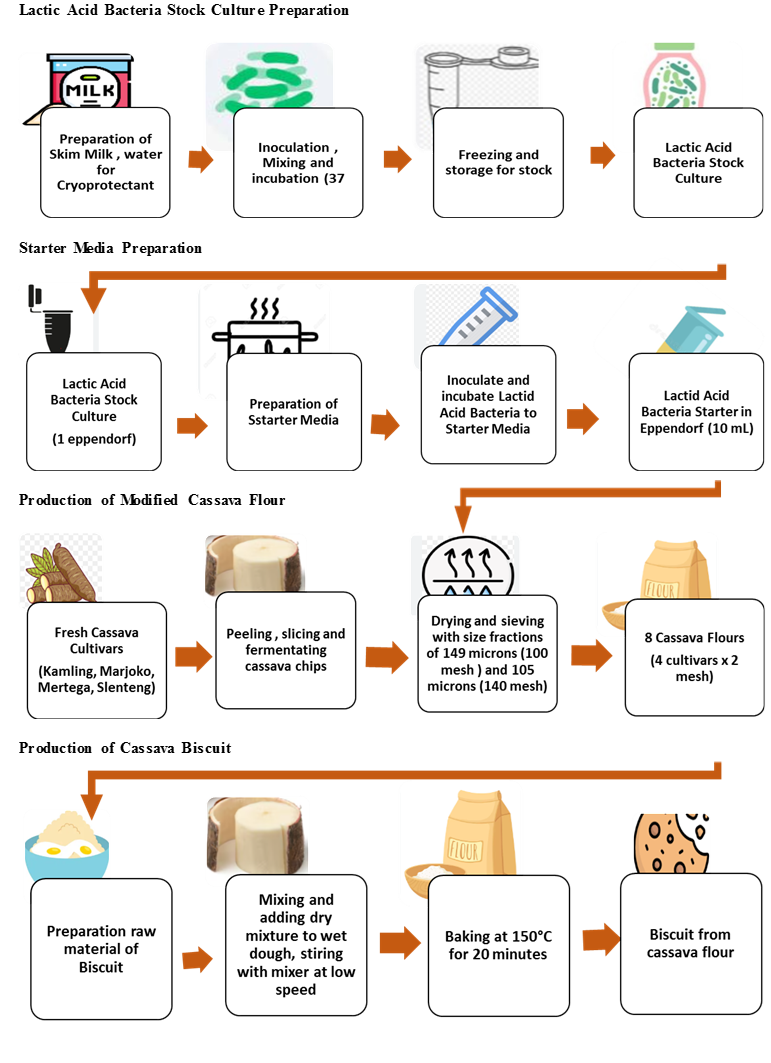
Figure 1 Technology process of cassava flour and biscuit base of production system divided into four main subsystems.
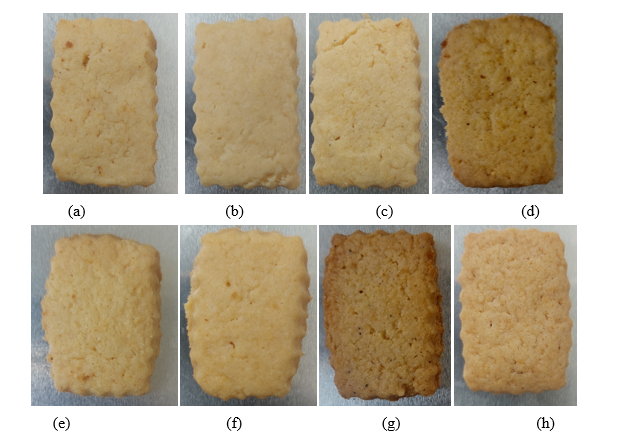
Figure 2 Visual appearance of biscuit made from cassava flour (a) Kamling mesh 100, (b) Kamling mesh 140, (c) Marjoko mesh 100, (d) Marjoko mesh 140, (e) Mertega mesh 100, (f) Mertega mesh 140, (g) Slenteng mesh 100, and (h) Slenteng mesh 140.
Granules and pores diameter
Biscuit samples were analyzed using a scanning electron microscope (SEM, model JSM-6510LA; JEOL Ltd., Japan) to determine the granules and pore diameters. Before measurement, biscuit samples underwent gold-coating to improve conductivity. Then placing it on a sample holder of the SEM unit using 3,000 magnifications in the scanning process [30]. The low-vacuum mode was implemented to reduce the occurrence of sample charging artefacts.
In addition to the biscuits produced by cassava flour was measured for granule and pore diameters. Investigation was carried out using ImageJ software [31-33]. Measurement of granule and pore diameter was done by drawing a straight line in the center of the granule or pore in the SEM image. The measured diameter was taken as the value of the largest granule or pore diameter. Measurements were taken on a representative number of granules and pores to obtain accurate data with three replicates conducted each sample.
Surface roughness
Three parameters of surface roughness included Ra (arithmetic mean roughness), Rq (root mean square roughness), and Rz (maximum roughness) were determined based on the image produced from SEM micrographs captured at appropriate magnifications. Ra representing the average deviation of the surface from the mean line, Rq quantifying the standard deviation of surface heights and thus more sensitive to larger peaks and valleys, and Rz measuring the vertical distance between the highest peak and lowest valley within a defined sampling area [34]. Following image acquisition, the surface profiles were extracted and analyzed using Gwyddion software, a free and open-source software developed by the Czech Metrology Institute, based in the Czech Republic. These parameters would provide a comprehensive assessment of the Biscuit surface texture, reflecting the combined effects of ingredient composition, processing conditions, and microstructural features. Mathematical expressions of Ra, Rq, and Rz were given by Eqs. (1) - (3), respectively.

where Ra was the arithmetic mean roughness, Rq was the root mean square roughness, Rz was the maximum roughness, l was the sampling length, Z(x) was the height of the surface at a given position (x), Zps was the vertical distance between the highest peak and the lowest valley, Zps was the highest peak, and Zv was the depth of the lowest valley.
Topography
Biscuit topography of was also determined using Gwyddion software based on SEM images with 1,000x magnification. Quantitative analysis was performed using statistics menu and the 1D statistical function tool. In the statistical function, Height Distribution was selected to determine the height distribution of the biscuit surface. The data obtained from this analysis would be used to study the surface topography characteristics of the cassava biscuit.
Element composition of biscuit
In this research, Energy Dispersive Spectrometry (EDS) analysis was also performed using the same scanning electron microscope. EDS was used to determine the elemental composition of the biscuit sample. The primary focus was on quantifying the carbon (C), oxygen (O), and nitrogen (N) contents, as these elements were essential components of organic matter. Firstly, Biscuit was dried to remove moisture and then ground into a fine powder. This powder was then pressed to produce pellets, ensuring a smooth surface for the X-ray beam to interact with. These pellets were placed in the EDS chamber, where they were exposed to X-rays beam. When the X-rays interact with the atoms in the sample, they cause the emission of secondary X-rays. The energy of these secondary X-rays was characteristic of the elements present in the sample. To determine the quantitative composition of the elements in the cassava biscuit, the ZAF correction method was applied. By applying the ZAF correction, the measured X-ray intensities were converted into concentrations of the elements of interest, including C, O and N. This analysis allowed for the identification of any significant differences in the C, O, N and other elemental contents between the various samples [35].
Statistics analysis
This study employed a Completely Randomized Design-Factorial with two factors, namely cultivars (Kamling, Marjoko, Mertega, Slenteng) and particle size (mesh 100, 140). A total of 8 treatment combinations were created, and each treatment was replicated three times. The mean comparison analysis was carried out using Duncanʼs Multiple Range Test (DMRT) at a 5% significance level.
Results and discussion
Granules diameter
Figure 3 depicts SEM images showing the microstructure of biscuit at 3,000x magnification provide important insights into the quality of the biscuit. Several parts could be identified, namely granule, pore, aggregate, and crack. Granule served as the source of starch that give the biscuit texture and flavor [36], while pore played a role in determining the density and moisture of the biscuit, which greatly affected crispness [37]. Aggregate indicated particle groupings that could affect dough homogeneity, while crack could indicate structural weaknesses that might reduce biscuit durability [38].
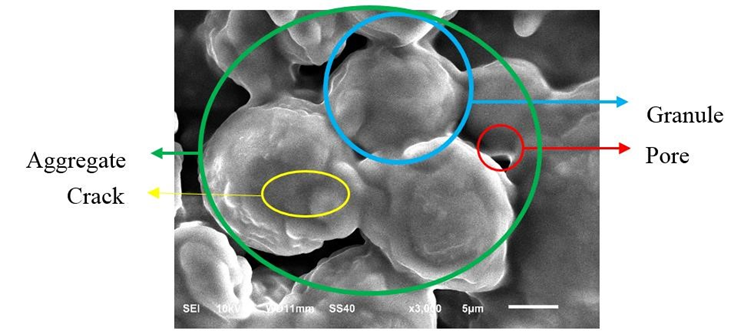
Figure 3 Parts of cassava biscuit microstructure.
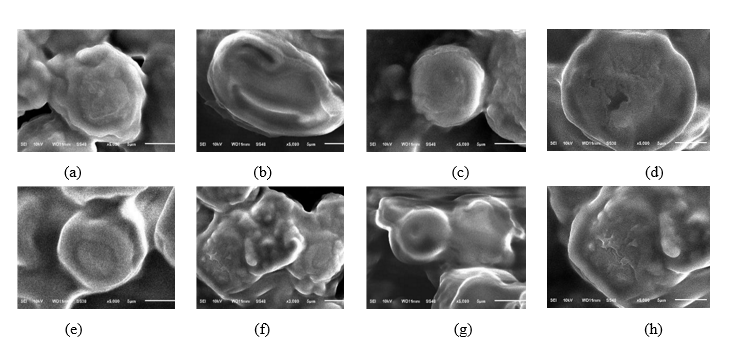
Figure 4 shows granules of all cassava biscuit samples with the magnification of 5,000x to provide a visual comparison of the granularity of each biscuit produced. It could be observed that some granules showed cracks, especially in the smaller ones. These cracks might indicate that the granules were not fully hydrated or subjected to mechanical stress during baking. Cracks could affect the texture and density of the biscuit, potentially reducing the quality of the final product. On the other hand, granules that appeared more intact and well bonded, as seen with Mertega mesh 140 (Figures 4(f) and 4(g)), showed that there was a good interaction between starch and other ingredients. This strong bond was important to give the biscuit a stable structure.
 Figure
4
Granules of cassava biscuit with magnification 5,000x (a) Kamling
mesh 100; (b) Kamling mesh 140; (c) Marjoko mesh 100; (d) Marjoko
mesh 140; (e) Mertega mesh 100; (f) Mertega mesh 140; (g) Slenteng
mesh 100; (h) Slenteng 140.
Figure
4
Granules of cassava biscuit with magnification 5,000x (a) Kamling
mesh 100; (b) Kamling mesh 140; (c) Marjoko mesh 100; (d) Marjoko
mesh 140; (e) Mertega mesh 100; (f) Mertega mesh 140; (g) Slenteng
mesh 100; (h) Slenteng 140.
Table 1 shows the measurement results of granule diameter of the biscuit samples. The diameter of biscuit granules made from cassava flour ranged from 18.99 - 109.88 µm, overlapping with those from soft wheat flour (36 - 43 µm) [38]. It was also observed that cassava flour with smaller particle size consistently produced larger biscuit granule diameters. This phenomenon occurred because particle size of 105 µm had a relatively large surface area that easily interacted and stuck together during dough mixing. During baking, partial gelatinization of starch occurred, starch granules absorbed water, expanded, and stuck together to form aggregates or lumps whose size could be far exceeded the initial particle size. Flour with a particle size of 140 μm was prone to fragmentation during mechanical stirring or baking because the granules were relatively mechanically fragile. These fragments were then dispersed as small granules, resulting in a smaller average final granule diameter (18.99 μm). These results supported previous research that flour particle size less than 100 µm would have poor cookie quality [39] because the biscuit granule produced was getting bigger.
Cassava flour made from the Kamling cultivar 100 mesh sieve produced the smallest biscuit granules or the smoothest biscuit. Meanwhile cassava flour from the Slenteng cultivar 140 mesh produced the largest or coarsest biscuits. Statistical analysis revealed that cassava cultivars and flour particle size and interaction of these two factors had a significant different on biscuit granule (p < 0.05). This showed that the diameter of biscuit granules was influenced by many factors, so complex considerations were needed to be able to produce biscuits with the desired granule size.
Tabel 1 Granules, pores and roughness parameter in biscuit.
Sample |
Diameter Granules (µm) |
Diameter Pores (µm) |
Ra |
Rq |
Rz |
Kamling mesh 100 |
18.99 ± 7.74a |
13.64 ± 2.51ab |
0.45 ± 0.12bc |
0.68 ± 0.09cd |
6.73 ± 0.89de |
Kamling mesh 140 |
46.32 ± 7.33c |
17.56 ± 3.6abc |
0.35 ± 0.00abc |
0.49 ± 0.06bc |
3.96 ± 1.06ab |
Marjoko mesh 100 |
21.87 ± 10.19ab |
30.48 ± 8.77d |
0.37 ± 0.07bc |
0.53 ± 0.15bcd |
6.33 ± 0.97bc |
Marjoko mesh 140 |
41.9 ± 5.59c |
23.94 ± 2.8bcd |
0.4 ± 0.02bc |
0.72 ± 0.08d |
8.03 ± 0.08e |
Mertega mesh 100 |
36.29 ± 5.4bc |
24.8 ± 2.33c |
0.46 ± 0.0c |
0.62 ± 0.00bcd |
4.97 ± 1.00bc |
Mertega mesh 140 |
41.36 ± 5.37c |
20.94 ± 3.62abcd |
0.433 ± 0.11bc |
0.6 ± 0.11bcd |
4.74 ± 0.9bc |
Slenteng mesh 100 |
39.84 ± 3.76c |
29.39 ± 9.09d |
0.31 ± 0.1ab |
0.47 ± 0.12ab |
6.23 ± 0.9cd |
Slenteng mesh 140 |
109.8818.07±d |
13.20 ± 6.59a |
0.22 ± 0.1a |
0.3 ± 0.12a |
2.52 ± 1.82a |
Pores diameter
The pore diameter of the biscuit samples ranged from 13.24 - 30.48 µm. These values correspond to the range of pore diameters of soft wheat flour biscuits, namely 11 - 267 µm [37]. Flour with a finer particle size consistently produced a smaller biscuit pore diameter, except for Kamling cultivar. In general, these results were in line with the phenomenon that smaller flour particles increased water absorption capacity, formed a more cohesive dough matrix, and produced small and uniform pores [40,41]. Biscuits made from Kamling cultivar 100 mesh and Slenteng cultivar 140 mesh produced the smallest biscuit pores. However, there were striking differences between the two cultivars. The Kamling cultivar 100 mesh produced the smallest pore diameter along with the smallest granule diameter, while Slenteng 140 mesh cultivar which approximately had the same pore diameter but had the largest granule diameter. The larges pore was resulted in biscuit produced from Marjoko cultivar 100.
ANOVA confirmed that cassava cultivar, flour particle size, and their interaction significantly influenced biscuit pore structure (p < 0.05). These statistical findings support previous work [42], which showed that high-starch cultivars like cassava enhance swelling, viscosity, and gel strength, thereby producing larger, more uniform pores. The observed decrease in pore size with finer particles aligns with theories on particle-size-dependent swelling power and reduced shear stress [43] as well as documented benefits of blending fine and coarse fractions for pore uniformity [44]. Finally, the significant interaction effect corroborates the conceptual framework linking cultivar-specific cell morphology to particle fragmentation-modulated gel behavior [45]. No contradictions with the cited literature were detected; minor quantitative differences likely arise from variations in flour pre-treatment and milling protocols.
Roughness parameters
In general, the values of Ra, Rq and Rz were smaller for flour passed 140 mesh than those passed at 100 mesh, indicating a smoother surface of the biscuit for smaller particle sizes of the flour. It could also be observed that each cultival produced different Ra, Rq and Rz values (Table 1). Slenteng mesh 140 consistently produced the smallest Ra, Rq and Rz values among all the samples studied. Statistical analysis revealed that cassava cultivar, particle size, and the interaction of these two factors significantly affected the values of Ra, Rq and Rz (p < 0.05). Where Ra was the arithmetic mean roughness, Rq was the root mean square roughness, Rz was the maximum roughness. These findings are conceptually aligned with prior research on mechanical vibration, where frequency and acceleration were shown to significantly affect surface roughness metrics in metallic substrates [46]. Although conducted outside the food domain, the study underscores that particle size when shaped by vibratory sieving is a mechanical derivative that directly influences surface texture. Furthermore, the relevance of surface roughness in food systems is reinforced by Kapłonek et al. [47]. who demonstrated through stylus profilometry that even minor variations in Ra values (ranging from 0.038 - 0.142 μm) on mixing unit surfaces reflect precise machining and functional integrity [47]. Their work confirms that Ra, Rq and Rz are sensitive indicators of surface quality in food processing contexts, validating the use of these parameters in evaluating biscuit texture. Thus, the present study not only supports the mechanical basis of particle size formation but also affirms the applicability of stylus-based roughness metrics in characterizing food product surfaces.
In the Kamling sample, Ra decreased from 0.45 µm at mesh 100 to 0.35 µm at mesh 140, with similar trends observed for Rq and Rz. This difference in roughness value is also reflected in the other samples, indicating that the type of material and mesh size affect the surface texture of biscuit. Kamling mesh 140 biscuit have relatively high Ra, Rq and Rz values, this is consistent with the visualization of roughness parameters in (Figure 4(b)) which shows the roughest and most uneven biscuit surfaces. The highest Ra, values were measured in Kamling flour mesh 100 (0.45) and Mertega flour mesh 100 (0.46), while the lowest Ra value was found in Slenteng flour mesh 140 (0.22). The decreasing trend of Ra, Rq and Rz values in all cultivars as the mesh size increased from 100 to 140 indicates that flour with a finer mesh size (140) has a flatter or smoother surface. This is consistent with the basic principle of the Ra, Rq and Rz parameters as an average measure of surface roughness, where lower values reflect smoother surfaces and less height variation in the surface profile.
With Ra values ranging from 0.22 - 0.45 µm (equivalent to 220 - 450 nm), the biscuit surface exhibits a relatively acceptable level of roughness. When compared with reference Ra values of other food products, such as whey protein films that have Ra values in the nanometer scale [48], apple cultivars with Ra values that vary in the submicron to several micron range [49], and blooming chocolate with higher Ra values [50], it can be seen that the type of material and processing process strongly influences Ra values. This difference in Ra value scale reflects the significant variation in surface texture between food products, ranging from very fine to relatively coarse. This difference in Ra value reflects the variation in surface characteristics influenced by each productʼs ingredient composition and processing. The moderate Ra value of Biscuit indicates a sufficiently smooth surface for a dry and crunchy product, which may contribute to the desired sensory quality and final texture. Thus, understanding the range of Ra values is important to control and optimize surface texture in food product development.
The Ra values obtained in the cassava biscuit in the study are in the lower range compared to the Ra values reported in pharmaceutical products, which are between 2 and 7.5 µm for particle sizes of 13 - 366 µm [51]. This difference can be explained by the different material characteristics and processes between. In a mechanical point of view, lower Rq values correlate with higher tensile strength due to tighter inter-particle bonding on smoother surfaces. This is relevant to cassava biscuit that have a smooth surface, which has the potential to provide good mechanical properties such as a crunchy texture and adequate strength, which are important characteristics for food products. Overall, these results reinforce the understanding that surface roughness parameters, particularly Rq, are critical parameters that can be used to predict and optimize the mechanical properties of products. In comparison, previous research on the surface of apple skins with three different cultivars, namely Jonagold, red delicious, and golden delicious, revealed that a decrease in surface roughness (Ra, Rq, Rmax and Rz) occurred due to changes in chemical composition due to differences in apple cultivars [47]. Surface roughness measurements on biscuit show a pattern consistent with the theory of 3D (Figures 5 and 6) roughness parameters for surfaces with a Gaussian distribution. The difference between the calculated and measured roughness values is within ±10%, indicating the validity of the method used can be the basis of 3D roughness calculations [52], conceptually related to Ra, Rq and Rz measured in this study.
The data presented in Table 1 shows a clear relationship between granule diameter, pore diameter, and surface roughness parameters (Ra, Rq and Rz). Larger granule sizes tend to produce larger pore diameters, so that coarse particles form a more open structure in the biscuit matrix. This more open structure contributes to increased surface irregularity, as reflected in the Ra, Rq and Rz values. This pattern indicates that particle size and porosity directly affect the topographical texture of the biscuit surface, where a rougher surface correlates with larger granules and pores. The relationship between these parameters provides important insights into how formulation and processing conditions affect the microstructure and physical characteristics of the final product.
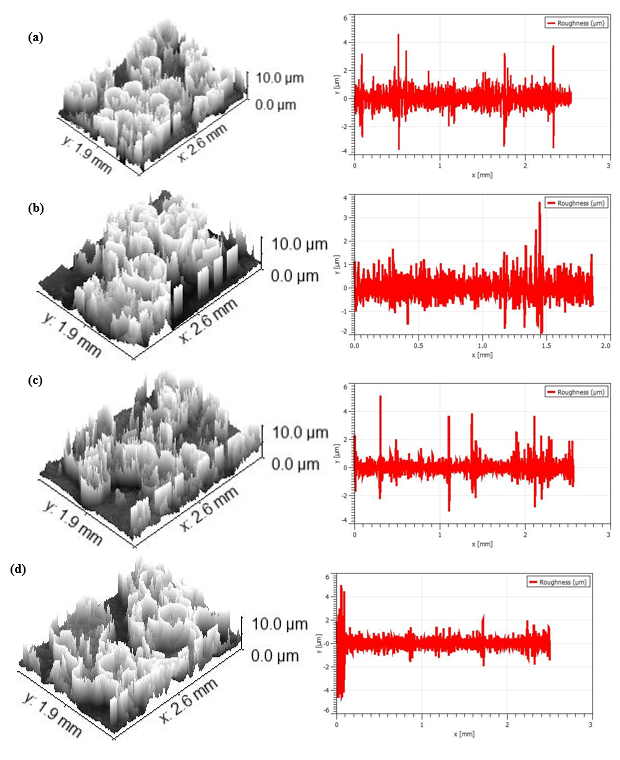
Figure 5 Roughness parameters visualization in cassava biscuit (a) Kamling mesh 100; (b) Kamling mesh 140; (c) Marjoko mesh 100; (d) Marjoko mesh 140.
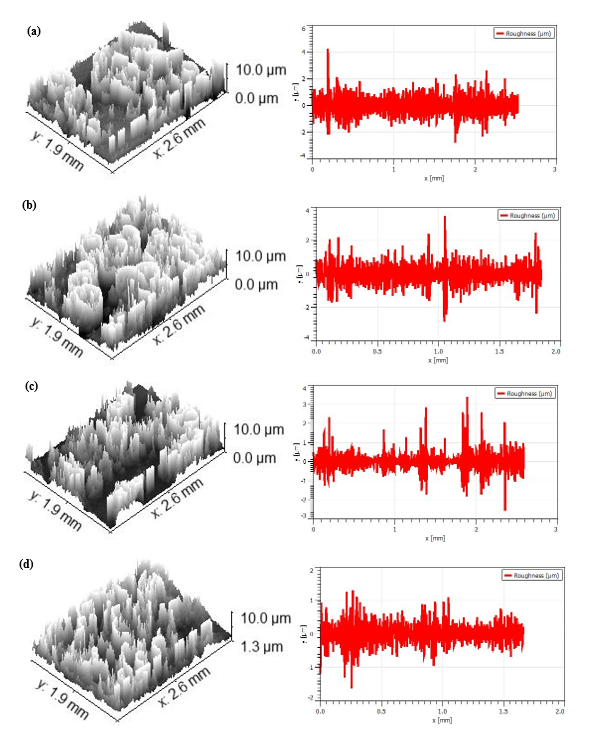
Figure 6 Roughness visualization in cassava biscuit (a) Mertega mesh 100; (b) Mertega mesh 140; (c) Slenteng mesh 100; (d) Slenteng mesh 140.
Surface topography
Based on surface topography analysis using Gwyddion, biscuit made with 140 mesh flour showed a narrower peak height distribution compared to 100 mesh flour, indicating a more homogeneous surface with minimal height variation. This is in line with the importance of peak surface height measurement as a parameter of biscuit quality and consistency [53]. Furthermore, the results showed that biscuit from the Slenteng cultivar with 140 mesh particle size (Figure 7(h)) had the narrowest height distribution and the highest peak, indicating good surface homogeneity. This phenomenon can be attributed to the smaller flour particle size at 140 mesh, which results in better interparticle interaction during biscuit formation, as alluded to in the ingredient composition factor [54] regarding the effect of particle size. In contrast, biscuit from the Kamling cultivar with 100 mesh (Figure 7(a)) showed a wider height distribution, indicating a rougher and non-uniform surface, possibly due to the larger flour particle size. Dough aeration conditions [55] and baking conditions [56,57] are also important factors affecting the height and texture of biscuit, but in the context of this study, flour particle size and cultivar characteristics seem to play a dominant role in determining surface homogeneity. In addition, gluten content [58], although not directly explored in this cassava biscuit study, in wheat-based biscuit, optimal gluten content correlates with height and weight uniformity. Lastly, the presence of cracks or structural defects [59] can weaken strength and affect consistency height, which makes the surface homogeneity observed in 140 mesh Slenteng biscuit a good indicator of quality.
Tabel 2 shows range height of peak (1.9 - 2.66 μm) on surface biscuits sample. The statistical analysis confirmed that cassava cultivars, flour particle size, and their interaction significantly affected the height distribution of biscuit surface topography (p < 0.05). These findings are in agreement with previous studies, such as the work on millet flour by Europe PMC, which demonstrated that both cultivar type and particle size influence surface characteristics and textural quality of steamed bread [60]. Similarly, the review by Dacanal emphasized that particle morphology and size distribution play a critical role in shaping food surface structure [61]. The consistency between these references and the present results reinforces the notion that cultivar-specific starch properties and mechanically derived particle sizes jointly determine the spatial texture of baked products.
Table 2 DMRT analyzed of height peak, Atom C, N and O samples.
Sample |
Height of Topography |
Atom C |
Atom N |
Atom O |
Kamling mesh 100 |
2.16 ± 0.28abcd |
64.85 ± 2.9bc |
13.91 ± 2.65a |
20.91 ± 2.96cd |
Kamling mesh 140 |
1.9 ± 0.36a |
63.78 ± 0.35 b |
15.92 ± 0.53 a |
14.36 ± 1.88 ab |
Marjoko mesh 100 |
2.6 ± 0.17bcd |
61.15 ± 3.03 b |
14.07 ± 3.01 a |
17.99 ± 2.55 bcd |
Marjoko mesh 140 |
2.13 ± 0.23abc |
64.14 ± 3.41 bc |
13.21 ± 3.5 a |
22.53 ± 1.66 d |
Mertega mesh 100 |
2.66 ± 0.28d |
72.22 ± 2.06 d |
15.2 ± 2.43 a |
11.02 ± 2.69 a |
Mertega mesh 140 |
2.2 ± 0.34abcd |
68.37 ± 2.77 cd |
15.49 ± 2.96 a |
16.27 ± 1.92 bc |
Slenteng mesh 100 |
2.63 ± 0.23cd |
69.36 ± 0.98 d |
14.91 ± 2.54 a |
14.79 ± 2.1 ab |
Slenteng mesh 140 |
2.3 ± 0.17ab |
53.83 ± 1.88 a |
10.92 ± 2.72 a |
31.24 ± 4.88 e |
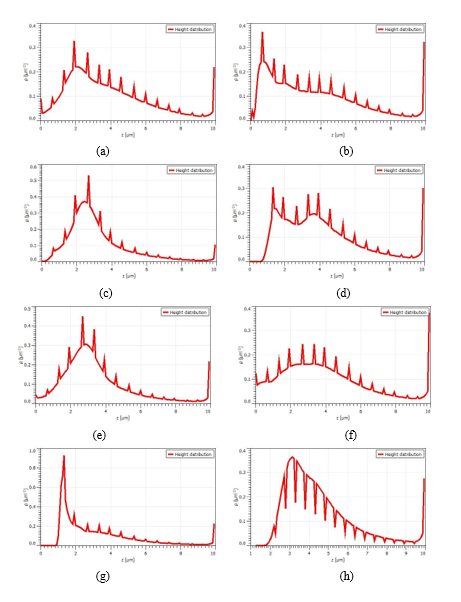
Figure 7 Topography of cassava biscuit (a) Kamling mesh 100; (b) Kamling mesh 140; (c) Marjoko mesh 100; (d) Marjoko mesh 140; (e) Mertega mesh 100; (f) Mertega mesh 140; (g) Slenteng mesh 100; (h) Slenteng 140.
Energy dispersive Xray of biscuit
Based on the results of EDS spectra analysis of biscuit from various cassava cultivars and mesh sizes, the majority of samples showed the main elemental composition in the order of carbon (C) > oxygen (O) > nitrogen (N). This pattern is consistent with previous findings [62], which identified carbon, oxygen, and nitrogen as the main components in cassava starch and biscuit. This indicates that the cassava biscuit matrix studied in this study is comparable to the reference standard cassava starch, as described by Regério Luis Dariva et al. [62] who stated that the EDS can be used to investigate the elemental composition in various elements of each particle of a sample that has been visually characterized. Differences in composition patterns were found in the Mertega mesh 100 cultivar, which had a different percentage of elements with decreasing patterns than the other samples. The other samples showed a lower rate of oxygen (O) than nitrogen (N). This phenomenon is based on previous research conducted by Syahfitri et al. [63] and EDS analysis of the N component detected in foodstuffs provides accurate data and can be used as an alternative method in addition to neutron activation analysis and atomic absorption spectrometry.
The presence of minor elements such as sodium (Na) and chlorine (Cl) also showed variation. The 100 mesh slurry lacks sodium (Na) and chlorine (Cl), in addition to the significant components of carbon (C), nitrogen (N), and oxygen (O). Furthermore, chlorine (Cl) was not detected in Kamling mesh 140 and Mertega 100. This non-detection of chloride could be due to chloridic precipitation, a phenomenon also mentioned in reference [63] in their study on elemental composition analysis of cassava biscuit, suggesting that chlorine detection may be difficult due to chloride precipitation that can occur in humid environments. Regarding elemental proportion, the Slenteng mesh 140 biscuit had the smallest percentage overall, while the Mertega mesh 100 had the highest proportion. Slenteng mesh 100 and Mertega mesh 140 showed moderate proportions. Specifically, Slenteng mesh 100 had the highest nitrogen concentration at 15.21%, while Slenteng mesh 140 contained the most significant amount of oxygen (Figure 9). Marjoko mesh 140 biscuits showed the highest salt (Na) and chlorine (Cl) levels. This variation in elemental content may be influenced by differences in cassava cultivars and processing conditions, as suggested research before [64,65] and SEM/EDS analysis in [65], which showed how elemental content can vary depending on the preparation method and source of the material. Research [64] also implies that environmental factors, such as nutrition and hydration, can affect the elemental composition of cassava tubers.
Statistical analysis revealed a highly significant effect (p < 0.01) of cassava cultivar, particle size, and their interaction on the carbon (C) and oxygen (O) atom content in cassava flour samples. DMRT confirmed (Table 2) distinct differences in both elemental distribution and intensity as detected via EDS. These findings are consistent with Niemeyer’s observations [66], where EDS effectively maps organic and inorganic elements—particularly C and O—in food matrices, and where particle morphology and size modulate X-ray signal strength. In this study, cultivar-specific cellular architecture and chemical composition, coupled with increased surface area in finer particles, enhanced elemental detectability. The synergistic interaction suggests that both genetic and physical parameters shape elemental profiles. Conceptually, this aligns with the previous study on functional bakery products, which highlights how raw material modification and particle refinement influence chemical composition and nutritional attributes [67]. Given that C and O dominate carbohydrate and fiber structures, their variation directly impacts texture, color, and nutritional value in bakery applications.
The absence of significant effects from cassava cultivar, particle size, and their interaction on nitrogen (N) atom content aligns with Niemeyer’s assertion that EDS is inherently less sensitive to light elements such as nitrogen, compared to heavier atoms like carbon and oxygen [66]. This methodological limitation likely obscures subtle compositional differences attributable to genotype or particle morphology. While the other study on functional bakery products underscores the nutritional relevance of protein-bound nitrogen, it does not address elemental distribution or EDS applicability, suggesting that techniques like Kjeldahl or CHNS analysis are more appropriate for nitrogen quantification [68]. Furthermore, findings from reference indicate that cultivar-related nitrogen variation is contingent on nitrogen availability and plant type; given cassava’s low protein profile, cultivar differences may not translate into measurable shifts in nitrogen content. Collectively, these references support the statistical outcome and highlight the analytical boundaries of EDS in food matrix studies.
In addition, proximate composition analysis was not included in this study, as the primary objective was to investigate the influence of cassava cultivar and mesh size on the microstructural characteristics of cassava biscuits. While proximate data may offer complementary nutritional insights, it falls outside the scope of the current investigation and is recommended for future studies aiming to correlate nutritional content with structural attributes.
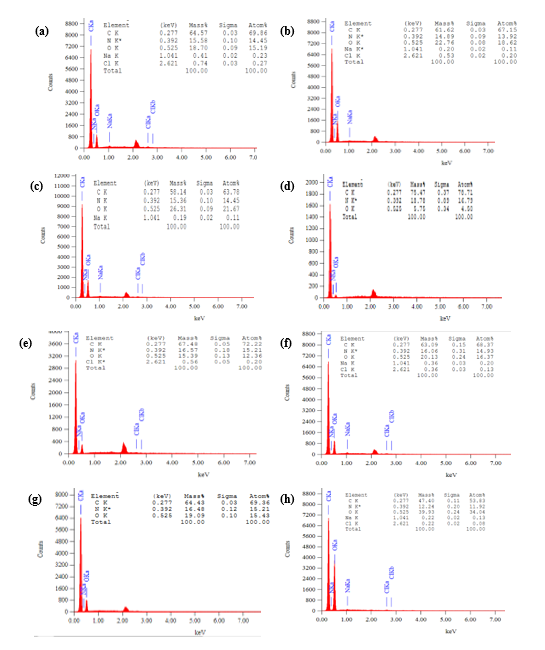
Figure 8 The element of cassava biscuit analysed by EDS (a) Kamling mesh 100; (b) Kamling mesh 140; (c) Marjoko mesh 100; (d) Marjoko mesh 140; (e) Mertega mesh 100; (f) Mertega mesh 140; (g) Slenteng mesh 100; (h) Slenteng 140.
Conclusions
Fermented cassava flour demonstrates strong potential for producing high-quality, economical, and sustainable gluten-free biscuits. The manipulation of cassava cultivar and mesh size had a significant effect (p < 0.05) on the diameter granule, pore, Ra, Rq and Rz biscuit. The holographic diagram, evaluated using peak function and log normal analysis, revealed a coefficient of determination (R2) value near to 1. This indicates a strong association and influence between the cassava cultivar and mesh size on the particle size distribution. Biscuits made from the Kamling cultivar typically exhibit smaller and more evenly distributed pores in comparison to those made from the others cultivars. The mean roughness average (Ra) value of Kamling Biscuit is the lowest across both mesh sizes. The EDX analysis results of cassava biscuits indicated the presence of carbon (C), nitrogen (N) and oxygen (O) elements in all biscuits. Thus, it can be inferred that cassava flour can be used as a partial alternative for wheat flour and biscuits in order to create gluten-free biscuits that possess ideal quality attributes. Future studies are encouraged to explore a wider range of cassava cultivars, fermentation conditions, and biscuit formulations, including sensory evaluation and shelf-life analysis.
However, a limitation of this study is the absence of wheat flour as a reference comparator, which restricts direct conclusions regarding the substitution potential of cassava flour in conventional food formulations. Future studies are encouraged to explore a wider range of cassava cultivars, fermentation conditions, and biscuit formulations, including proximate analysis, sensory evaluation, shelf-life analysis, and direct comparisons with wheat-based biscuits.
Acknowledgements
The authors would like to thank Gadjah Mada University, Yogyakarta 55281, Indonesia for partial funding of this research through the Final Assignment Recognition Program (Program Rekognisi Tugas Akhir, RTA) with assignment letter No: 4193/UN1.P1/Dit-Lit/PT.01.03/2025.
Declaration of Generative AI in Scientific Writing
All scientific content, parameter analysis, research data interpretation, discussion, and conclusion writing were carried out and developed by the author. AI was only used for language editing and readability improvement.
CRediT Author Statement
The individual contributions of the authors are as follows: Slamet Sulistiadi was responsible for the conceptualization of the study, developing the methodology, conducting formal analysis, and curating the data, as well as preparing the original draft of the manuscript. Nursigit Bintoro carried out the investigations, provided essential resources, contributed to data visualization, and assisted with the review and editing of the manuscript. Joko Nugroho Wahyu Karyadi provided supervision throughout the project, managed the administration, and secured funding for the research. Arifin Dwi Saputro was involved in the validation of results, utilized relevant software, and critically reviewed and edited the manuscript
Abbreviations
SEM Scanning electron microscopy
EDS Energy Dispersive X-ray spectroscopy
Ra Arithmetic mean roughness
Rq Root mean square roughness
Rz Maximum roughness
C Carbon
O Oxygen
N Nitrogen
CRD Completely Randomized Design
DMRT Duncan’s Multiple Range Test
LAB Lactic Acid Bacteria
References
[1] M Hasmadi, L Harlina, L Jau-Shya, AH Mansoor, MHA Jahurul and MK Zainol. Physicochemical and functional properties of cassava flour grown in different locations in Sabah, Malaysia. Food Research 2020; 4(4), 991-999.
[2] OA Otekunrin. Cassava (Manihot esculenta Crantz): A global scientific footprint—production, trade, and bibliometric insights. Discover Agriculture 2024; 2, 94.
[3] PP Akhila, KV Sunooj, B Aaliya, M Navaf, C Sudheesh, DN Yadav, MA Khan, SA Mir and J George. Morphological, physicochemical, functional, pasting, thermal properties and digestibility of hausa potato (Plectranthus rotundifolius) flour and starch. Applied Food Research 2022; 2(2), 100193.
[4] N Diniyah, A Subagio, RNL Sari, PG Vindy and AA Rofiah. Effect of fermentation time and cassava varieties on water content and the yield of starch from Modified Cassava Flour (MOCAF). Indonesian Journal of Pharmaceutical Science and Technology 2018; 5(2), 71-75.
[5] R Sangpueak, C Saengchan, K Laemchiab, D Kiddeejing, S Siriwong, K Thumanu, NH Hoang, P Phansak and K Buensanteai. Flour on gluten-free muffins from different edible cassava varieties in Thailand. Foods 2022; 11(24), 4053.
[6] I Burešová, L Červenka, R Šebestíková, M Augustová and A Jarošová. Applicability of flours from pigmented and glutinous rice in gluten-free bread baking. Foods 2023; 12(6), 1324.
[7] H Lu, L Guo, L Zhang, C Xie, W Li, B Gu and K Li. Study on quality characteristics of cassava flour and cassava flour short biscuits. Food Science & Nutrition 2019; 8(1), 521-533.
[8] H Marta, IL Anastasia, Y Cahyana, F Filianty, Fetriyuna and D Sondari. Evaluation of pasting and functional properties of composite flour from Indonesian local tubers and its application in gluten-free biscuits. Journal of Food Measurement and Characterization 2024; 18(8), 6782-6792.
[9] N Diniyah, M Iguchi, M Nanto, T Yoshino and A Subagio. Dynamic rheological, thermal, and structural properties of starch from Modified Cassava Flour (MOCAF) with Two Cultivars of Cassava. Industria: Jurnal Teknologi dan Manajemen Agroindustri 2023; 12(1), 89-101.
[10] SS Dewi and T Widyastuti. Effect of planting time and cassava variety to MOCAF (Modified Cassava Flour) quality level. IOP Conference Series: Earth and Environmental Science 2021; 752, 012054.
[11] LD Kaale and M Eduardo. Development of value added cassava-based foods enriched with Irish potato peels and moringa leaves for sustainable food security and improved nutrition. Applied Food Research 2025; 5(1), 100762.
[12] AS Subaşı and R Ercan. Technological characteristics of whole wheat bread: Effects of wheat varieties, sourdough treatments and sourdough levels. European Food Research and Technology 2024; 250, 2593-2608.
[13] SA Oyeyinka and IAV Bassey. Composition, functionality, and baking quality of flour from four brands of wheat flour composition, functionality, and baking quality of flour from four brands of Wheat Flour. Journal of Culinary Science & Technology 2025; 23(1), 87-107.
[14] K Bodor, J Szilágyi, B Salamon, O Szakács and Z Bodor. Physical – chemical analysis of different types of flours available in the Romanian market. Scientific Reports 2024; 14, 881.
[15] AG Ikechukwu and SR Oyiza. Effects of different tuber crop flours and melon seed meal on the physicochemical and sensory properties of biscuits. Asian Journal of Applied Science and Technology 2021; 5(3), 196-212.
[16] AA Memon, I Mahar, R Memon, S Soomro, J Harnly, N Memon, MI Bhangar and DL Luthria. Impact of flour particle size on nutrient and phenolic acid composition of commercial wheat varieties. Journal of Food Composition and Analysis 2020; 86, 103358.
[17] NT Alzuwaid, CM Fellows, B Laddomada and M Sissons. Impact of wheat bran particle size on the technological and phytochemical properties of durum wheat pasta. Journal of Cereal Science 2020; 95, 103033.
[18] D Dziki, A Krajewska and P Findura. Particle size as an indicator of wheat flour quality: A review. Processes 2024; 12(11), 2480.
[19] A Cazzaniga, S Hase, MM Brousse and AR Linares. Properties of dehydrated cassava puree and wheat flour blends and its relationship with the texture of doughs. LWT 2021; 136(2), 110310.
[20] DG Stevenson, JL Jane and GE Inglett. Structure and physicochemical properties of starches from sieve fractions of oat flour compared with whole and pin-milled flour. Cereal Chemistry 2007; 84(6), 533-539.
[21] MJO de Almeida, BRSM da Wanderley, A de Francisco, ER Amante, CBF Freire, CV Helm and RDMC de Amboni. Effects of particle size on the physical, chemical, and technological properties of pre-gelatinized whole pinhão (Araucaria angustifolia) flour. Journal of Food Measurement and Characterization 2024; 18, 5695-5709.
[22] WL Kerr, CDW Ward, KH McWatters and AVA Resurreccion. Milling and particle size of cowpea flour and snack chip quality. Food Research International 2001; 34(1), 39-45.
[23] J Pang, E Guan, Y Yang, M Li and K Bian. Effects of wheat flour particle size on flour physicochemical properties and steamed bread quality. Food Science & Nutrition 2021; 9(9), 4691-4700.
[24] F Cheng, K Ding, H Yin, M Tulbek, CM Chigwedere and Y Ai. Milling and differential sieving to diversify flour functionality: A comparison between pulses and cereals. Food Research International 2023; 163, 112223.
[25] ID Mert, G Sumnu and S Sahin. Microstructure of gluten-free baked products. Imaging Technologies and Data Processing for Food Engineers 2016; 2016, 197-242.
[26] I Demirkesen, G Sumnu and S Sahin. Image analysis of gluten-free Breads prepared with Chestnut and Rice Flour and baked in Different Ovens. Food and Bioprocess Technology 2013; 6, 1749-1758.
[27] OA Adedara and JRN Taylor. Roles of protein, starch and sugar in the texture of sorghum biscuits. LWT 2021; 136(1), 110323.
[28] IK AÇARI. Determination of the chemical structure of diet biscuits with modern enstrumental techniques. Cumhuriyet Science Journal 2021; 42(2), 299-309.
[29] M Esrafil, S Akter, MJ Alam, MA Alim, MSA Reza, M Zubair, PR Joy, M Jahan and M Khatun. Development and quality evaluation of novel biscuits by utilizing fruits and vegetables seed. Food Research 2024; 8(1), 181-189.
[30] Y Senaweera and BDR Prasantha. Structural and elemental analysis of Waraka and Wala Jackfruit seed flour samples by SEM-EDX method. Tropical Agricultural Research 2024; 35(2), 169-174.
[31] F Kouhsari, F Saberi, PL Kowalczewski, JM Lorenzo and M Kieliszek. Effect of the various fats on the structural characteristics of the hard dough biscuit. LWT 2022; 159, 113227.
[32] GH Bagheri, C Bonadonna, I Manzella and P Vonlanthen. On the characterization of size and shape of irregular particles. Powder Technology 2015; 270, 141-153.
[33] HR Azarbad, MM Tehrani and H Rashidi. Optimization of gluten-free bread formulation using sorghum, rice, and millet flour by D-Optimal mixture design approach. Journal of Agricultural Science and Technology 2019; 21, 101-115.
[34] SR Yadhuraj, GS Babu and MU Kumari. Measurement of thickness and roughness using gwyddion. In: Proceedings of the 2016 3rd International Conference on Advanced Computing and Communication Systems (ICACCS), Coimbatore, India. 2016.
[35] AM Gatti, D Tossini, A Gambarelli, S Montanari and F Capitani. Investigation of the presence of inorganic micro- and nanosized contaminants in bread and biscuits by environmental scanning electron microscopy. Critical Reviews in Food Science and Nutrition 2009; 49(3), 275-282.
[36] S Aghajanzadeh, A Sultana, AM Ziaiifar and S Khalloufi. Formation of pores and bubbles and their impacts on the quality attributes of processed foods: A review. Food Research International 2024; 188, 114494.
[37] MT Molina, SM Vaz, A Leiva and P Bouchon. Rotary-moulded biscuits: Dough expansion, microstructure and sweetness perception as affected by sucrose: Flour ratio and sucrose particle size. Food Structure 2021; 29, 100199.
[38] Y Dadmohammadi and AK Datta. Food as porous media: A review of the dynamics of porous properties during processing. Food Reviews International 2022; 38(5), 953-985.
[39] S Barak, D Mudgil and BS Khatkar. Effect of flour particle size and damaged starch on the quality of cookies. Journal of Food Science and Technology 2014; 51(7), 1342-1348.
[40] H Boz. Effect of flour and sugar particle size on the properties of cookie dough and cookie. Czech Journal of Food Sciences 2019; 37(2), 120-127.
[41] M Jia, R Ma, C Liu, X Pan, W Shen and Y Tian. Insight into the relationship between cell wall, intracellular starch structure and physicochemical properties of cassava cells from cassava varieties. International Journal of Biological Macromolecules 2025; 288, 138728.
[42] M Belorio, M Sahagún and M Gómez. Influence of flour particle size distribution on the quality of maize gluten-free cookies. Foods 2019; 8(2), 83.
[43] S Romuli, A Abass and J Müller. Physical properties of cassava grits before and after pneumatic drying. Journal of Food Process Engineering 2016; 40(2), 12397.
[44] NKO Ojijo and E Shimoni. Minimization of cassava paste flow properties using the “Farris effect”. LWT - Food Science and Technology 2008; 41(1), 51-57.
[45] D Murayama, M Kasano, DM Santiago, H Yamauchi and H Koaze. Effect of pre-gelatinization on the physicochemical properties of dry flours produced from 5 cassava varieties of the Philippines. Food Science and Technology Research 2014; 20(6), 1131-1140.
[46] J Dobes, JES Leal, J Profeta, MM de Sousa, FPL Neto, A Piratelli-Filho and RV Arencibia. Effect of mechanical vibration on Ra, Rq, Rz, and Rt roughness parameters. The International Journal of Advanced Manufacturing Technology 2017; 92, 393-406.
[47] W Kapłonek, M Ungureanu, K Nadolny and P Sutowski. Stylus profilometry in surface roughness measurements of the vertical conical mixing unit used in a food industry. Journal of Mechanical Engineering 2017; 47(1), 1-8.
[48] PSP de Herrmann, CMP Yoshida, AJ Antunes and JA Marcondes. Surface evaluation of whey protein films by atomic force microscopy and water vapour permeability analysis. Packaging Technology and Science 2004; 17(5), 267-273.
[49] Y Yang, X Xie, R Huang, K Yan, M Wang, W Liu, X Zeng, X Ren and H Gong. Characterization of morphological and chemical changes using atomic force microscopy and metabolism assays: The relationship between surface wax and skin greasiness in apple fruit. Frontiers in Plant Science 2024; 15, 1489005.
[50] V Briones, CA Brown and JM Aguilera. Scale-sensitive fractal analysis of the surface roughness of bloomed chocolate. Journal of the American Oil Chemists’ Society 2006; 83(3), 193-199.
[51] P Narayan and BC Hancock. The influence of particle size on the surface roughness of pharmaceutical excipient compacts. Materials Science and Engineering: A 2005; 407(1-2), 226-233.
[52] N Bulaha. Calculations of surface roughness 3D parameters for surfaces with irregular roughness. Engineering for Rural Development 2018; 2018, 1437-1444.
[53] H Mamat, MOA Hardan and SE Hill. Physicochemical properties of commercial semi-sweet biscuit. Food Chemistry 2010; 121(4), 1029-1038.
[54] B Filipčev, N Nedeljković, O Šimurina, M Sakač, M Pestorić, D Jambrec, B Šarić and P Jovanov. Partial replacement of fat with wheat bran in formulation of biscuits enriched with herbal blend. Hemijska Industrija 2017; 71(1), 61-67.
[55] RB Edoura-Gaena, I Allais, G Trystram and JB Gros. Influence of aeration conditions on physical and sensory properties of aerated cake batter and biscuits. Journal of Food Engineering 2007; 79(3), 1020-1032.
[56] C Lizhu, F Yiyi2, L Shiwei, W Yongxia, T Zhichao and D Shenglin. Optimization for baking process of sea-buckthorn biscuits based on sensory evaluation of fuzzy mathematics. Science and Technology of Food Industry 2021; 42(15), 163-169.
[57] PA Conforti, DK Yamul and CE Lupano. Influence of milk, corn starch, and baking conditions on the starch digestibility, gelatinization, and fracture stress of biscuits. Cereal Chemistry 2012; 89(4), 205-210.
[58] Q Zhou, X Li, J Yang, L Zhou, J Cai, X Wang, T Dai, W Cao and D Jiang. Spatial distribution patterns of protein and starch in wheat grain affect baking quality of bread and biscuit. Journal of Cereal Science 2018; 79, 362-369.
[59] E Garcia-Armenta, G Gutierrez, S Anand and K Cronin. Analysis of the failure of cracked biscuits. Journal of Food Engineering 2017; 196, 52-64.
[60] SH Li, W Zhao, PL Li, G Min, AX Zhang, JL Zhang, YY Liu and JK Liu. Effects of different cultivars and particle sizes of non-degermed millet flour fractions on the physical and texture properties of Chinese steamed bread. Cereal Chemistry 2020; 97(3), 661-669.
[61] GC Dacanal. Particle size and morphology in food science and technology: A review. International Journal of Food Science & Technology 2024; 59(10), 6821-6833.
[62] R Dariva, R Colet, A Manzoli, IA Fernandes, GS de Hassemer, RL Cansian, GT Backes and E Valduga. Structural and techno-functional properties of cassava starches and application on cheese bread. Biointerface Research in Applied Chemistry 2021; 11(1), 7400-7409.
[63] WYN Syahfitri, S Kurniawati, N Adventini, E Damastuti and DD Lestiani. Macro elemental analysis of food samples by nuclear analytical technique. Journal of Physics: Conference Series 2017; 860, 012023.
[64] O Nwaiwu and H Onyeaka. New model high temperature pasting analysis of fermented cassava granules. Fermentation 2022; 8(2), 89.
[65] C Khongla, P Yuwang, T Yuwang and S Musika. Physicochemical, phytochemical and antioxidant properties of organic sweet potato flour and its application in breadstick. Trends in Sciences 2024; 21(10), 8162.
[66] WD Niemeyer. SEM/EDS analysis for problem solving in the food industry. Volume 9636. In: Proceedings of the SPIE - The International Society for Optical Engineering, California. 2015.
[67] P Zarzycki, A Wirkijowska and U Pankiewicz. Functional bakery products: Technological, chemical and nutritional modification. Applied Sciences 2024; 14(24), 12023.
[68] I Djalovic, PVV Prasad, K Akhtar, A Paunović, M Riaz, M Dugalic, S Katanski and S Zaheer. Nitrogen fertilization and cultivar interactions determine maize yield and grain mineral composition in calcareous soil under semiarid conditions. Plants 2024; 13(6), 844.