Trends
Sci.
2026;
23(6):
12323
A Chronological Record of Contamination: Coral Skeletons Reveal Increasing Microplastic Diversity in Central Tapanuli, Indonesia
Rahmatsyah Rahmatsyah1,*, Rita Juliani1, Hendro Pranoto2, Ali Arman Lubis3,
Koko Ondara4, Agung Setia Batubara2 and Riri Syavira5
1Department
of Physics, Faculty of Mathematics and Natural Sciences, Universitas
Negeri Medan, Medan, Indonesia
2Department
of Biology, Faculty of Mathematics and Natural Sciences, Universitas
Negeri Medan, Medan, Indonesia
3Research Center for Radiation Process Technology, National Research and Innovation Agency,
Tangerang Selatan, Banten 15314, Indonesia
4Research Center for Oceanologi - National Research and Innovation Agency, Jakarta 12440, Indonesia
5Department of Chemistry, Faculty of Mathematics and Natural Sciences, Universitas Gadjah Mada,
Yogyakarta 20221, Indonesia
(*Corresponding author’s e-mail: [email protected])
Received: 17 October 2025, Revised: 5 November 2025, Accepted: 15 November 2025, Published: 1 February 2026
Abstract
Microplastic pollution has increasingly been recognized as a critical environmental threat to coral reef ecosystems, known to disrupt feeding behavior, hinder skeletal deposition, and induce bleaching events. Despite growing awareness, little is known about how such stressors are chronologically archived within coral growth bands, particularly in regions exposed to simultaneous anthropogenic and natural pressures. This study investigates the relationship between coral growth dynamics and microplastic contamination in the coastal waters of Central Tapanuli, Indonesia an area characterized by dense human settlements (population 250,017 - 394,910), active shipping routes, and industrial growth (1,802 - 2,568 units). The research was conducted at 2 reef sites representing gradients of human influence, Karang Island and Ungge Island; coral cores were sectioned, X-rayed to visualize annual growth bands, and analyzed for embedded microplastics using stereo microscopy and Fourier Transform Infrared Spectroscopy (FTIR). Growth rates at Karang Island (2015 - 2024) ranged from 11 - 26 mm yr⁻¹, while rates at Ungge Island (2019 - 2024) were 8 - 20 mm yr⁻¹; microplastic concentrations were 3 - 20 particles g⁻¹ (Karang, 2015 - 2024) and 3 - 16 particles g⁻¹ (Ungge, 2019 - 2024). Fibers (58% - 63%) were the dominant morphology, with particle sizes ranging from 25 - 873 µm. FTIR analysis (peaks: 555 - 3,409 cm⁻¹) identified a complex polymer mixture dominated by Polystyrene (19.9%), Polypropylene (16.2%), and Polyvinyl Chloride (13.4%). Crucially, chronological analysis revealed a significant temporal trend: polymer diversity increased from 11 unique types in 2015 to 15 unique types in 2024, including new engineered plastics. The dominance of packaging-derived polymers reflects strong anthropogenic input, and this study provides the first evidence of microplastic incorporation within coral growth bands in Central Tapanuli, demonstrating that coral skeletons not only archive contamination but also record its increasing compositional complexity over time. These findings emphasize the urgent need for integrated coastal management and stricter plastic-waste regulation in Indonesia’s reef ecosystems.
Keywords: Coral reefs, Microplastics, Anthropogenic causes, Natural causes, Ungge Island, Karang Island, Central Tapanuli
Introduction
Indonesia, as the epicenter of the Coral Triangle, possesses the world’s richest marine biodiversity, including over 574 coral species spanning 19,805 km² of its waters [1]. These ecosystems are vital for supporting biodiversity, providing coastal protection, and sustaining livelihoods, particularly in regions like the Central Tapanuli Regency. However, these vital ecosystems face an emergent threat from microplastic (MP) pollution plastic fragments less than 5 mm in diameter [2-5], originating from coastal anthropogenic activities and the degradation of macroplastic waste [6,7].
The ecological impacts of microplastics (MPs) are multifaceted, posing both a physical and chemical threat to marine biota. Physically, ingestion has been documented across diverse taxa, including shellfish [8] and fish [9]. Chemically, MPs act as vectors for contaminants; their inherent physicochemical properties (e.g., size, functional groups) and ambient environmental conditions (e.g., temperature, salinity) govern the sorption of external hazardous pollutants. Simultaneously, they can leach their own intrinsic toxic additives [10]. This synergistic effect, combining the particle with adsorbed or leached toxins, exacerbates toxicity to marine organisms, from primary producers like phytoplankton to higher-level organisms [12]. This process facilitates the trophic transfer of contaminants from prey to predator, bioaccumulating up the food web and ultimately threatening the safety of seafood consumed by humans [13]. The comprehensive impacts of these stressors on complex and sensitive coral reef ecosystems, in particular, are now a subject of increasing scientific scrutiny [11].
Recent research has confirmed that MPs pose a direct threat to coral physiology. Experimental studies demonstrate that MP exposure can reduce growth rates, cause tissue necrosis, and weaken polyp activity [14,15]. Furthermore, chemical leachates from specific polymers have been shown to disrupt the critical settlement processes of coral larvae [18]. Field studies from diverse locations, including the Mediterranean and the Gulf of Thailand, have detected high concentrations of MPs in reef habitats, even within protected areas [16,17]. These findings confirm that MPs are found in coral mucus, tissue, and skeletons, suggesting that reefs may act as ‘biological sinks’ for these contaminants [16].
While the contamination of coral matrices by MPs is established, the understanding of how these stressors are chronologically archived within the annual skeletal growth bands remains severely limited. Consequently, very little is known about whether coral skeletons can be utilized as high-resolution archives to record historical trends in plastic pollution, analogous to their use in paleoclimatology. This knowledge gap is particularly critical in regions like Indonesia, where historical pollution data is scarce, yet anthropogenic pressures are intensifying.
To address this knowledge gap, this study investigates the relationship between coral growth dynamics and microplastic contamination in the coastal waters of Central Tapanuli. Specifically, this research aims to: (1) reconstruct the temporal trends of microplastic abundance embedded within coral cores from 2015 to 2024; (2) identify the polymer composition of these archived particles; and (3) assess the relationship between microplastic accumulation in corals and local anthropogenic drivers.
Materials and methods
The research was conducted in the coastal waters of Central Tapanuli Regency, North Sumatra, Indonesia, during the dry season (June - August 2025) to ensure stable oceanographic conditions and optimal underwater visibility.
A purposive sampling design was employed. Two coral reef sites, Karang Island and Ungge Island (Figure 1), were selected to represent a clear gradient of anthropogenic influence, with Karang Island being closer to denser coastal settlements and shipping lanes. At each island, 2 distinct coring stations (Karang: 1PK2, 4PK1; Ungge: 3PU1, 5PU) were established, for a total of four sampling stations. At each station, one core was retrieved from a massive Porites sp. colony at an average water depth of 2 m using a pneumatic drill, yielding four independent coral cores (biological replicates). Immediately upon retrieval, cores were rinsed with pre-filtered deionized (DI) water to remove surface contaminants, and the precise growth direction was marked [19].
In the laboratory, all four cores were vertically sectioned into 3 mm slices and X-radiographed to visualize annual high and low-density growth bands. These bands were used to establish an annual chronology and measure annual growth rates (mm yr⁻¹). Based on the retrieved core lengths and clear banding, the established chronology for Karang Island (stations 1PK2, 4PK1) covered the period 2015 - 2024, while the chronology for Ungge Island (stations 3PU1, 5PU) covered 2019 - 2024. For microplastic analysis, a subsample of approximately 2 g of coral skeleton was precisely extracted from each identified annual growth band from each of the four cores.
Microplastics were isolated from the carbonate matrix via chemical digestion. Each 2 g subsample was placed in a sealed glass beaker, and hydrochloric acid (HCl, 10% v/v) was added until the carbonate skeleton fully dissolved. Density separation was then performed using a saturated NaCl solution (approx. 1.2 g cm⁻³) to concentrate low-density particles.
Rigorous QA/QC protocols were implemented to prevent and quantify background contamination: (1) All glassware was pre-combusted at 450 °C for 5 h and thoroughly rinsed with pre-filtered DI water before use, (2) All solutions (DI water, HCl, NaCl) were filtered through a 0.45 µm filter prior to use, (3) All digestion and filtration procedures were conducted in a closed-beaker system under a laminar flow hood to prevent airborne contamination, (4) Procedural blanks (n = 3), consisting of all reagents without a coral sample, were processed alongside the samples to quantify any contamination introduced during the laboratory phase. The insoluble residue from each sample was filtered through Whatman No. 540 nitrocellulose membranes. Particle counts from samples were corrected by subtracting the average contamination found in the procedural blanks.
Filtered membranes were observed under a stereo microscope. Particles were characterized and counted based on morphology (fiber, fragment, film, etc.) and color. The polymer composition of a representative subset of isolated particles was confirmed using Fourier Transform Infrared (FTIR) spectroscopy (Thermo Scientific Nicolet i510) equipped with a KBr/Ge beam splitter and a DTGS detector. Acquired infrared absorption spectra were compared against an international polymer reference database to identify dominant polymer types (Figure 2).
To investigate potential drivers of contamination, time-series data for anthropogenic factors (population density, coastal industrial activity) [20] and natural parameters (rainfall, air temperature, sea surface temperature - SST) [21-25] were obtained from official government and climatological sources (Figure 3).
Data processing employed a descriptive-quantitative approach. All statistical analyses were performed using R (v4.3.1). Pearson correlation analysis was used to assess the linear relationships between: (1) annual microplastic abundance (particles g⁻¹) and coral growth rate (mm yr⁻¹), and (2) microplastic abundance and the corresponding environmental variables. Subsequently, linear regression models were applied to quantify the predictive strength of significant anthropogenic (e.g., population) and natural (e.g., SST) drivers on the observed microplastic concentrations over time.
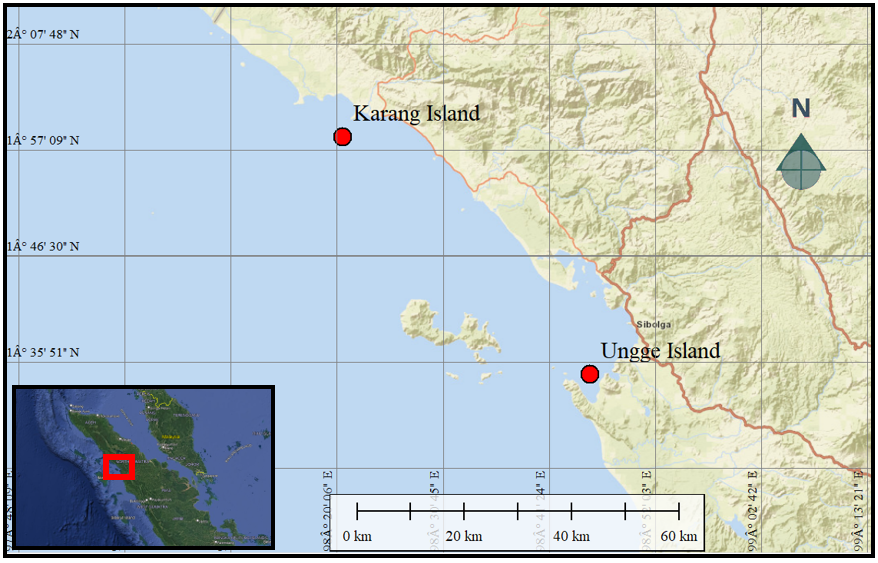
Figure 1 Location of Ungge Island and Karang Island, Central Tapanuli.
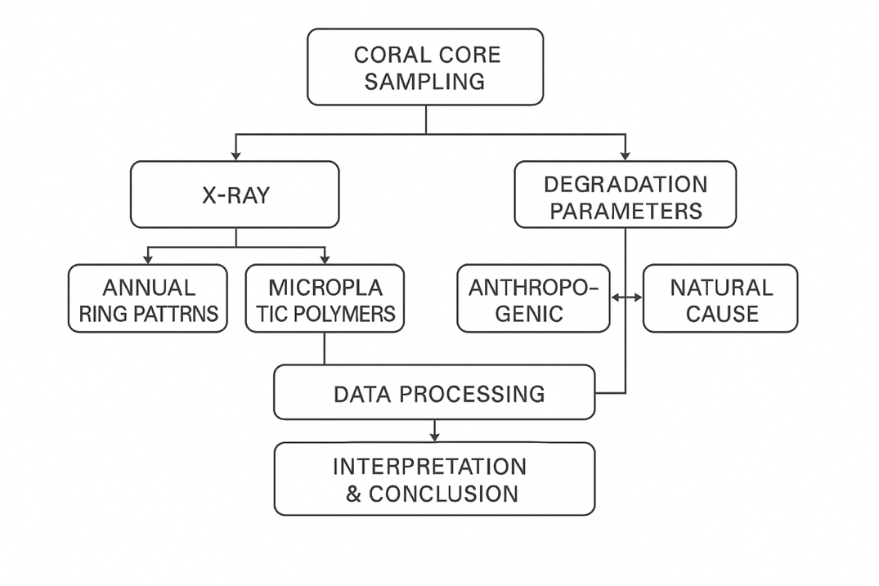
Figure 2 Research flowchart.
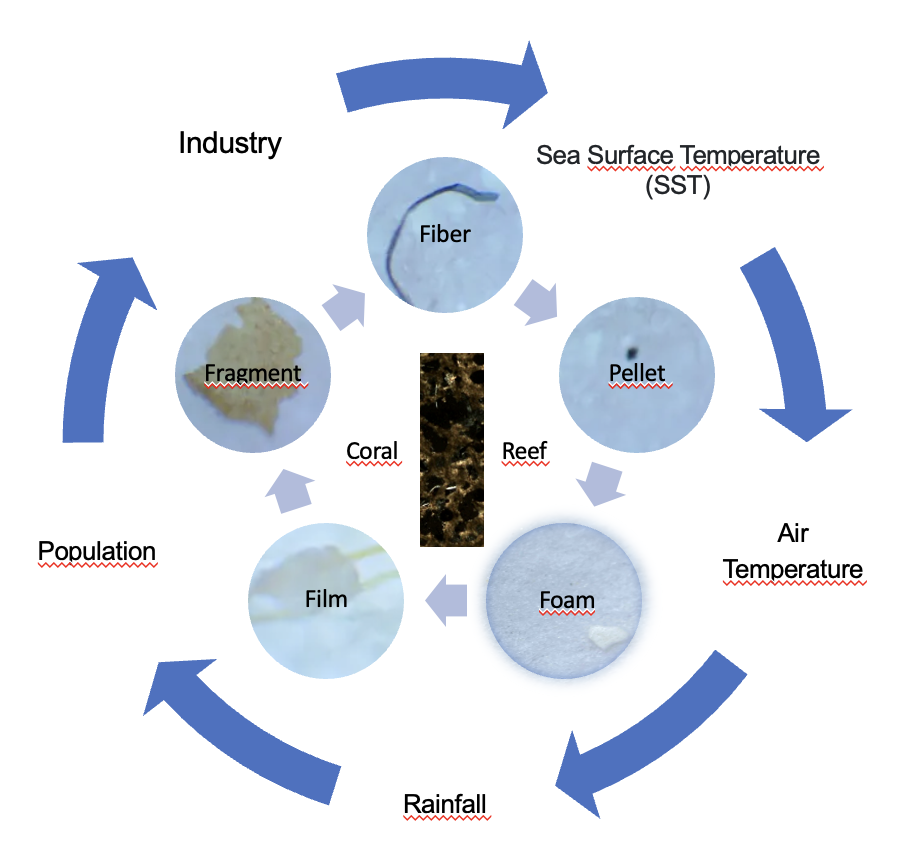
Figure 3 Cycle of anthropogenic cause and natural cause in microplastics.
Results and discussion
Temporal distribution and abundance of microplastics
The temporal distribution and composition of microplastic (MP) particles from 2015 - 2024 (Karang Island) and 2019 - 2024 (Ungge Island) revealed highly localized and variable contamination patterns across the four stations (Figures 4 and 5). At Karang Island, station 1PK2 experienced an extreme contamination event in 2020 (40 particles), dominated by Fibers and Fragments, while the nearby station 4PK1 exhibited different peaks in 2018 and 2021 (20 particles) with a notable presence of Pellets (Figure 4). Conversely, at Ungge Island, station 5PU showed a steady increase to its maximum in 2024 (23 particles), consisting almost entirely of Fibers. In stark contrast, station 3PU1 displayed major peaks in both 2020 (32 particles) and 2024 (33 particles) and was uniquely characterized by a high abundance of Pellets and Films (Figure 5). These results demonstrate complex local dynamics, as 2020 was a peak contamination year for stations 1PK2 and 3PU1 but a low-contamination year for 4PK1 and 5PU. This temporal divergence, combined with the significant compositional differences (e.g., the high prevalence of Pellets at 3PU1), strongly suggests that the reef stations are impacted by varied and distinct local pollution sources.
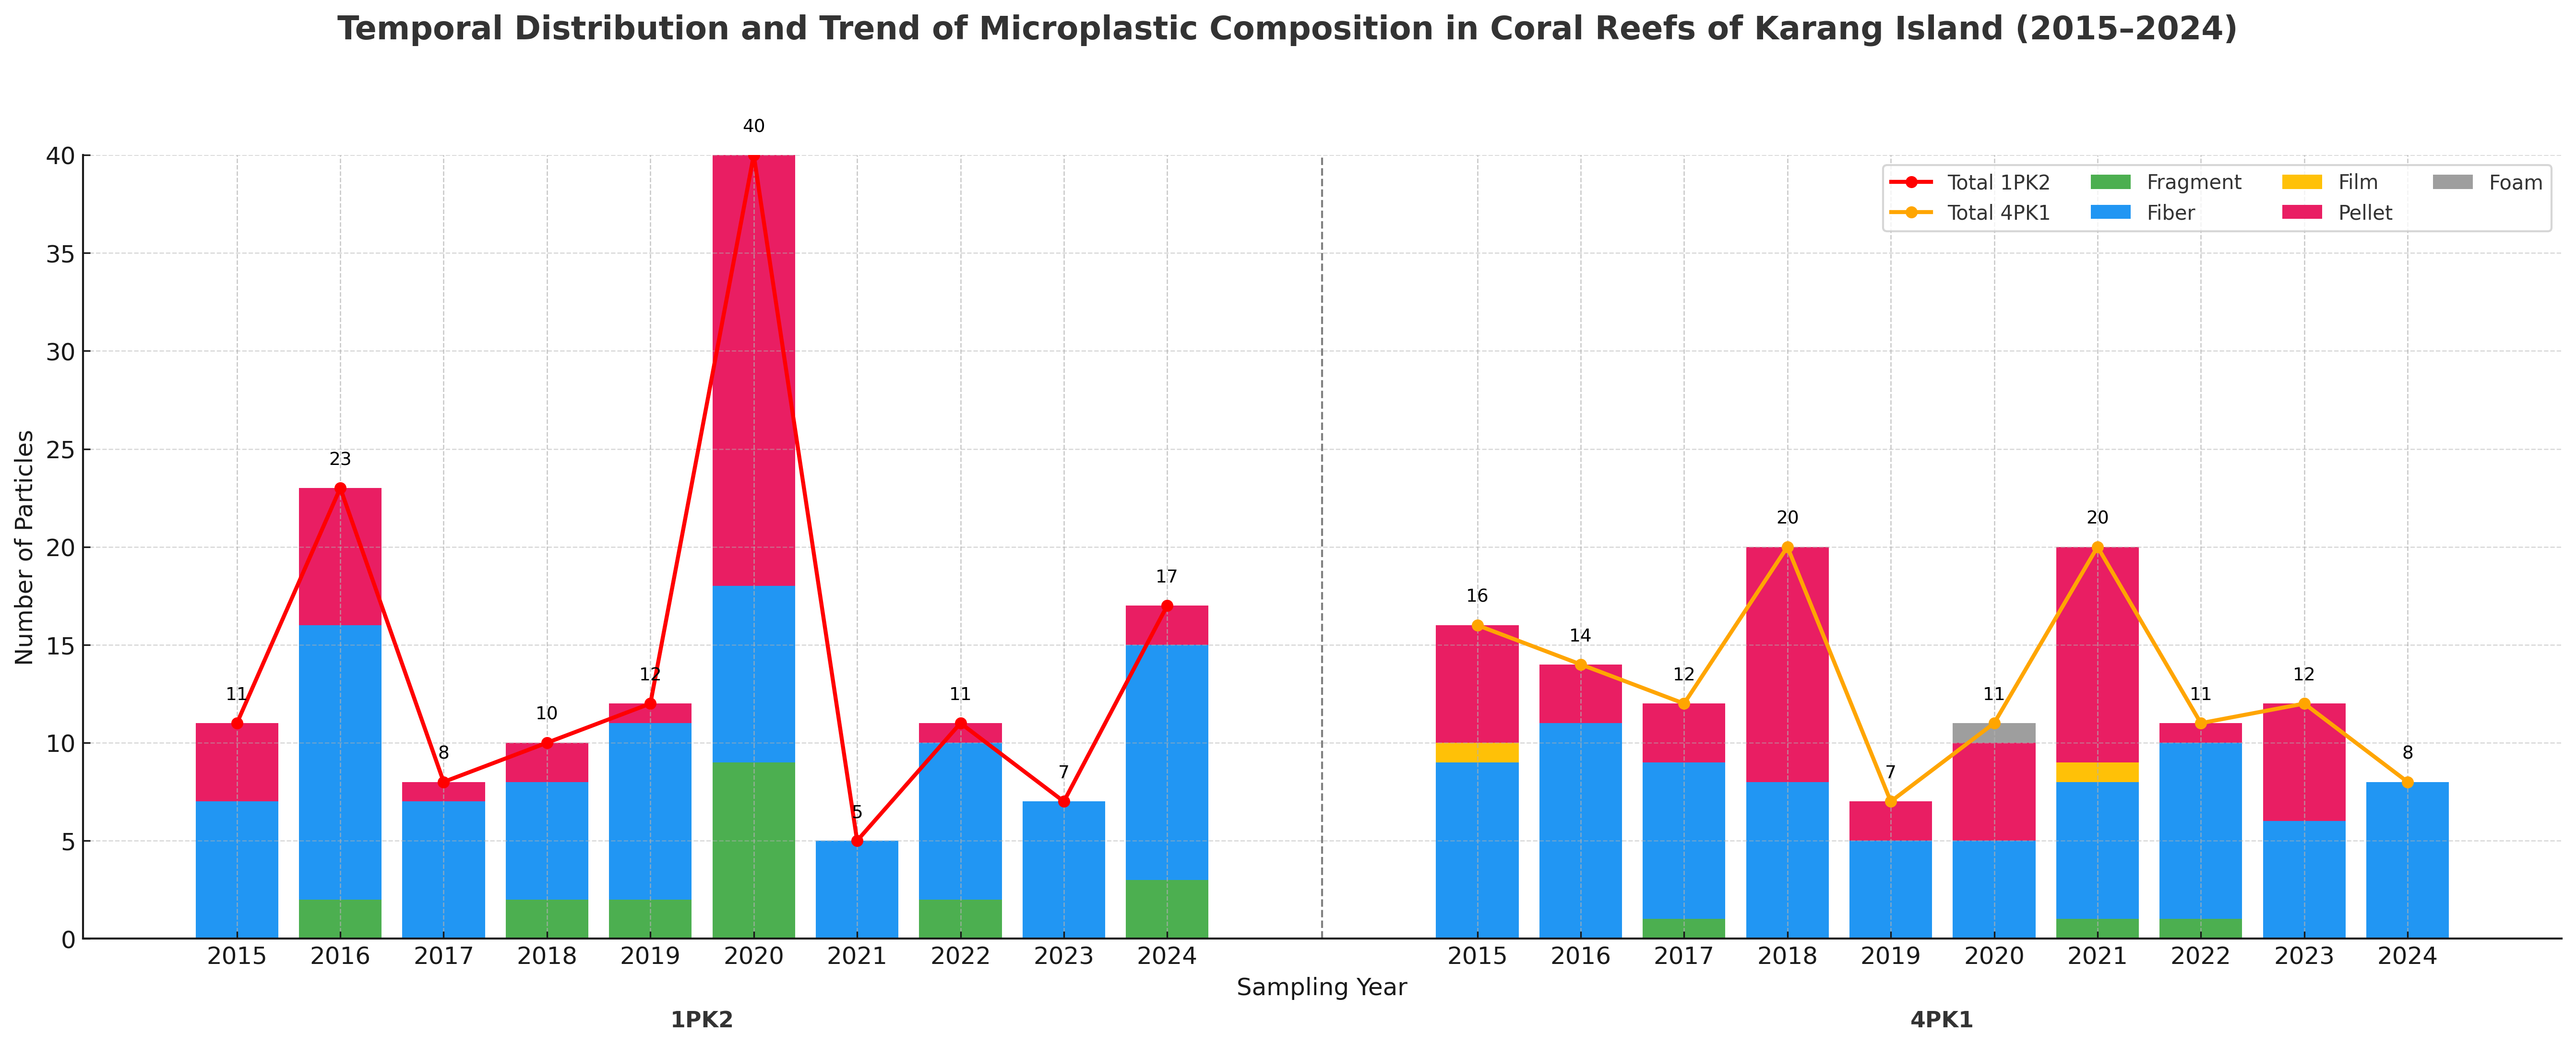
Figure 4 Temporal distribution and composition of microplastic particles at Karang Island Stations (1PK2 and 4PK1) from 2015 - 2024.
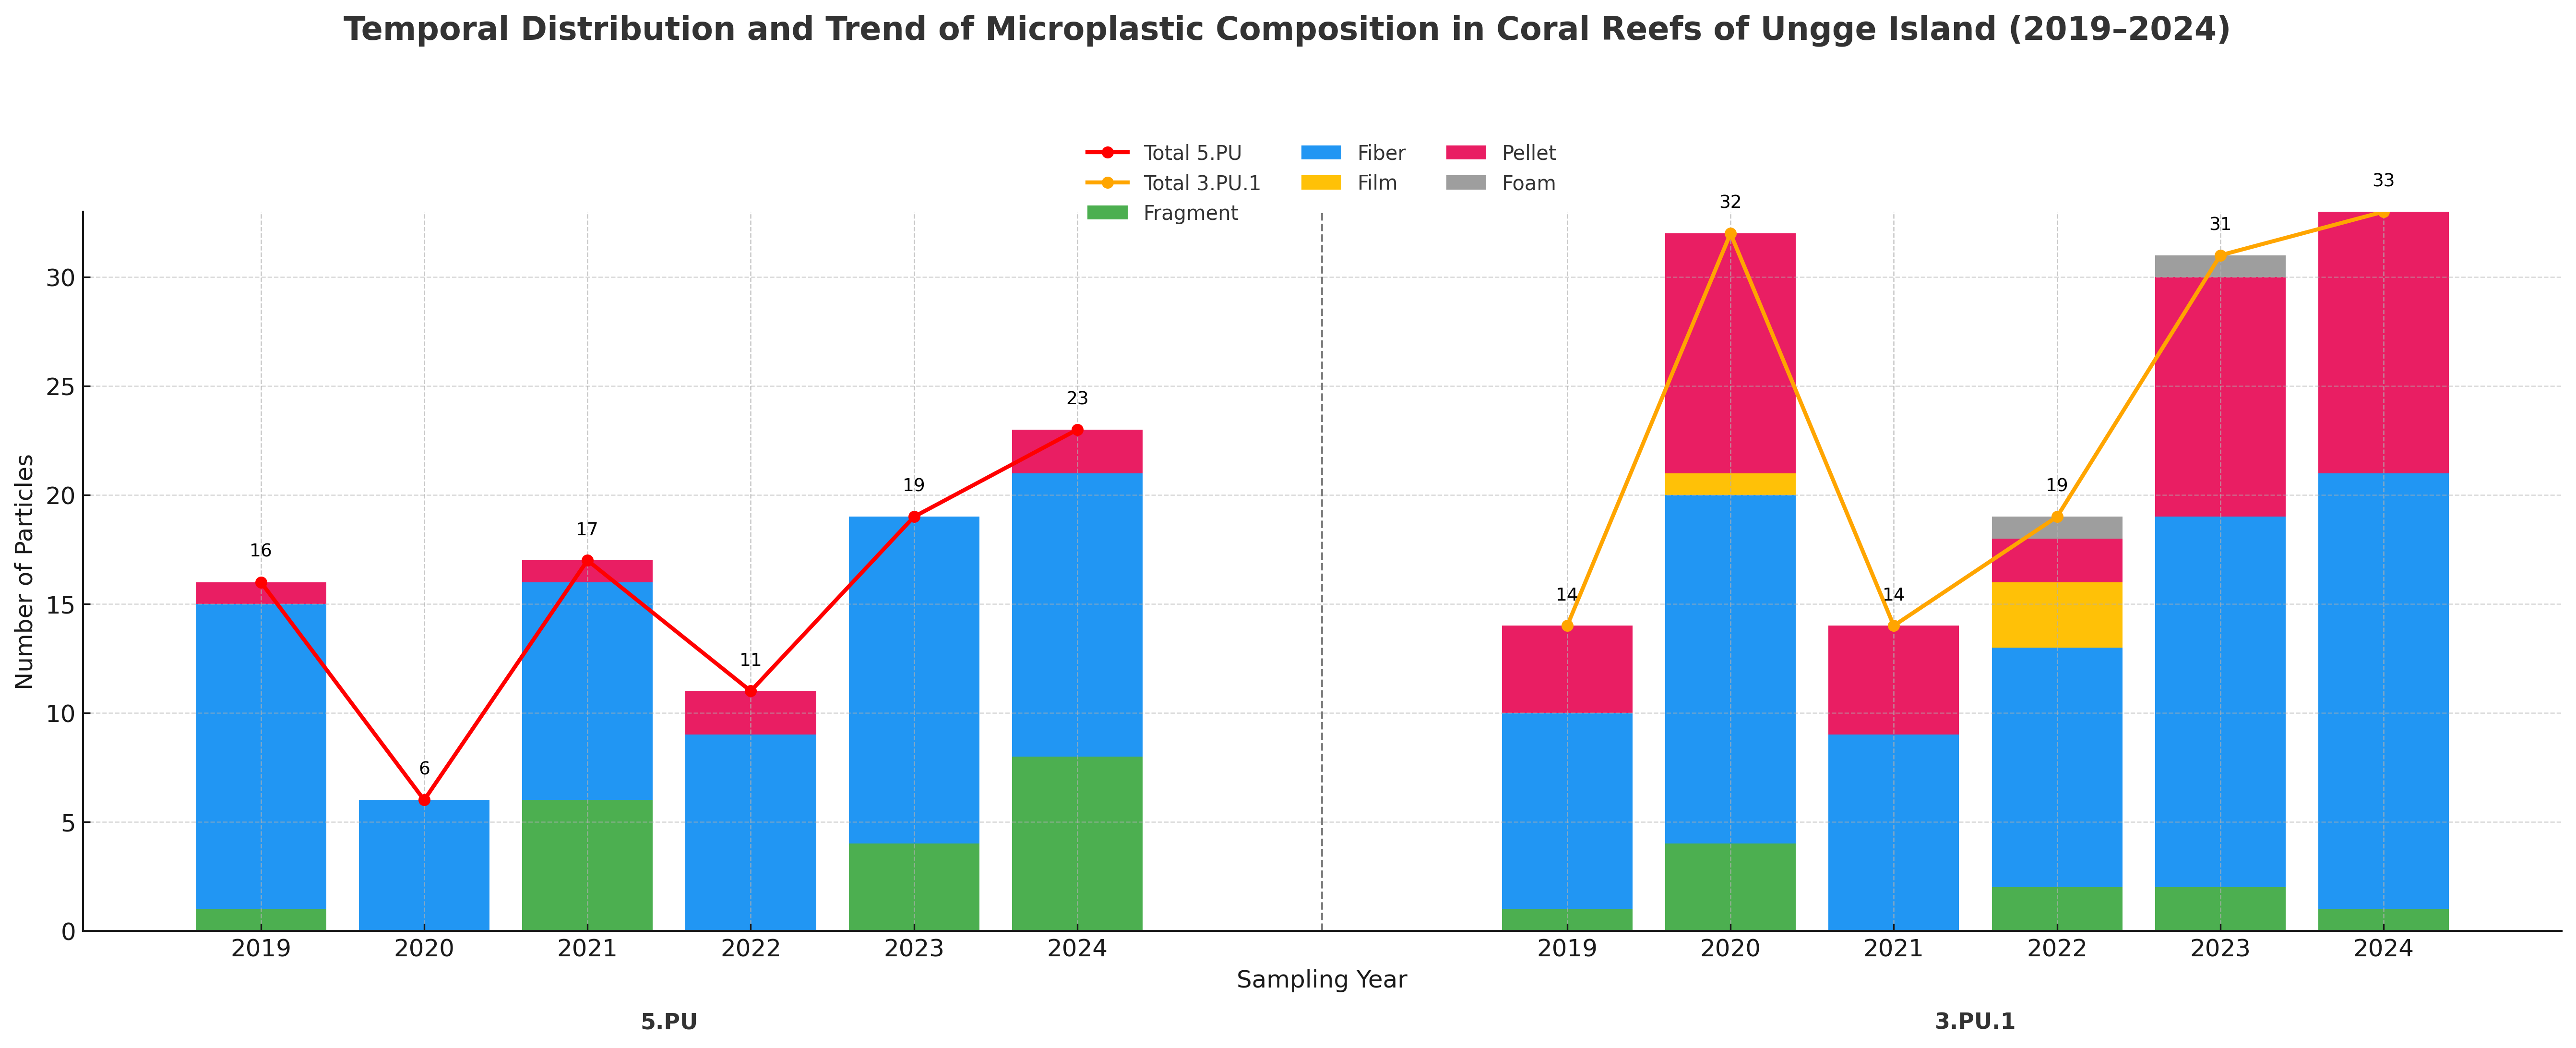
Figure 5 Temporal distribution and composition of microplastic particles at Ungge Island Stations (5PU and 3PU1) from 2019 - 2024.
Microplastic characterization by morphology and color
The analysis of overall microplastic prevalence (Figure 6) demonstrated that Fibers were unequivocally the most dominant morphology at both sites, composing 63.4% of the total particles at Ungge Island and 58.2% at Karang Island. The secondary composition varied by location: Pellets were the second most abundant type at Karang Island (32.4%), whereas at Ungge Island, this rank was shared by Pellets (21.7%) and Fragments (12.3%). Films and Foams were negligible at both sites (< 2%). The color distribution analysis (Figure 7) further detailed these compositions by particle count, revealing that the dominant Fiber category (160 particles at Karang, 149 at Ungge) was primarily composed of Black (e.g., 32.5% at Karang) and Blue (e.g., 33.8% at Karang) particles. In contrast, the significant Pellet category (89 particles at Karang, 51 at Ungge) was overwhelmingly dominated by Yellow (69.7% at Karang, 66.7% at Ungge) and Black (25.8% at Karang, 31.4% at Ungge) particles, while Fragments were also predominantly Black.
The annual microplastic size distribution and dominant morphological types are detailed in Table 2. Particle sizes were highly variable across the chronology, ranging from a minimum of 25 µm (recorded at Ungge Island in 2020) to a maximum of 873 µm (at Karang Island in 2016). Fibers were the most persistent dominant morphology, identified as a primary or co-dominant type in every year at both locations. Fragments and Pellets were also frequently co-dominant, though their prevalence varied annually. For instance, Pellets were notably co-dominant with Fibers at Karang Island during the 2015 - 2016 period and again in 2020. The data also reveals significant annual fluctuations in size distribution. At Karang Island, the largest maximum particle sizes (873 and 838 µm) were recorded in the earliest years (2016 and 2015, respectively), while the smallest particles (e.g., 25 µm at Ungge Island) were observed in later years, indicating a complex and dynamic influx of particle sizes over time.
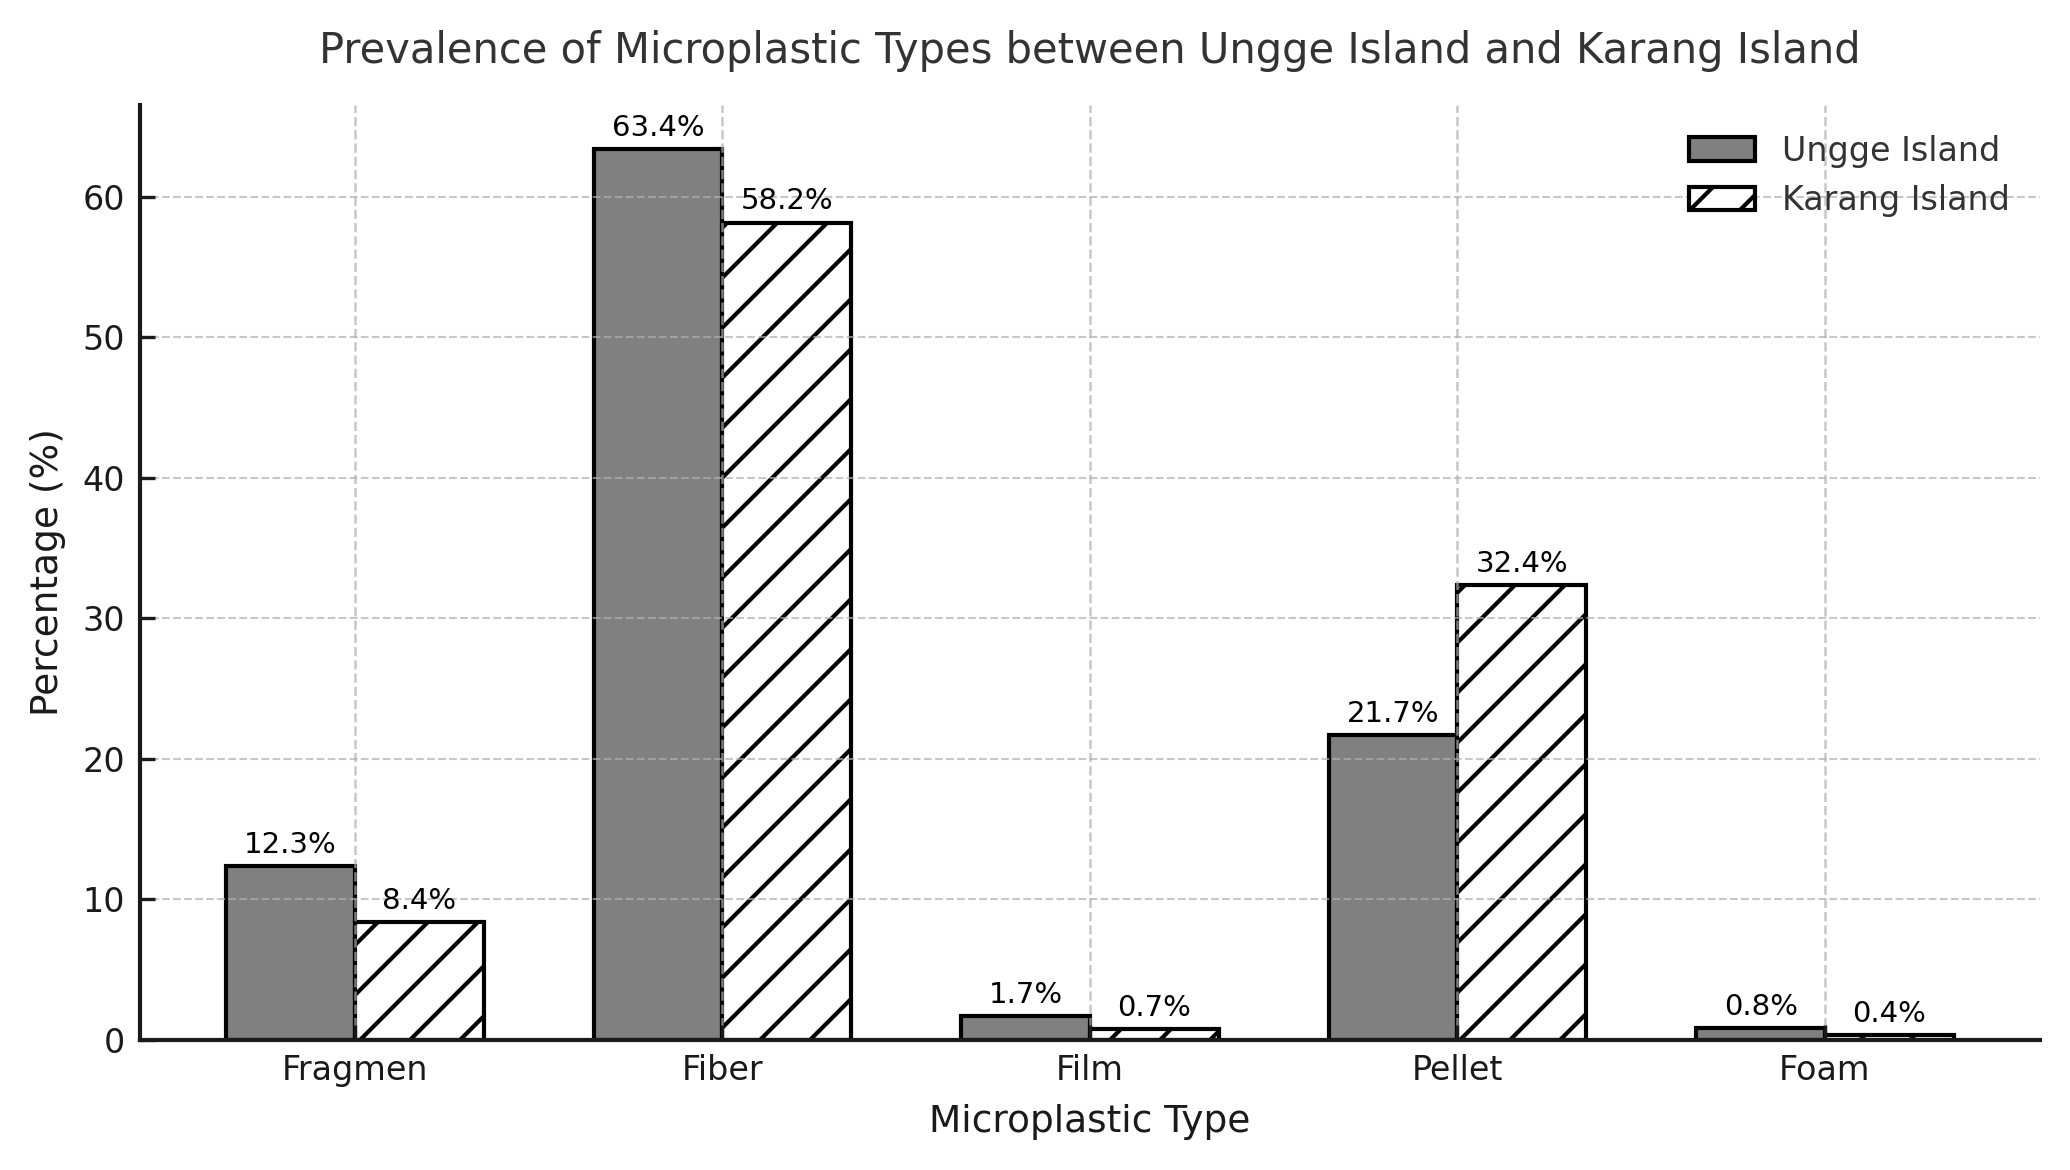
Figure 6 Overall microplastic prevalence by morphological type (%) at Karang Island and Ungge Island.
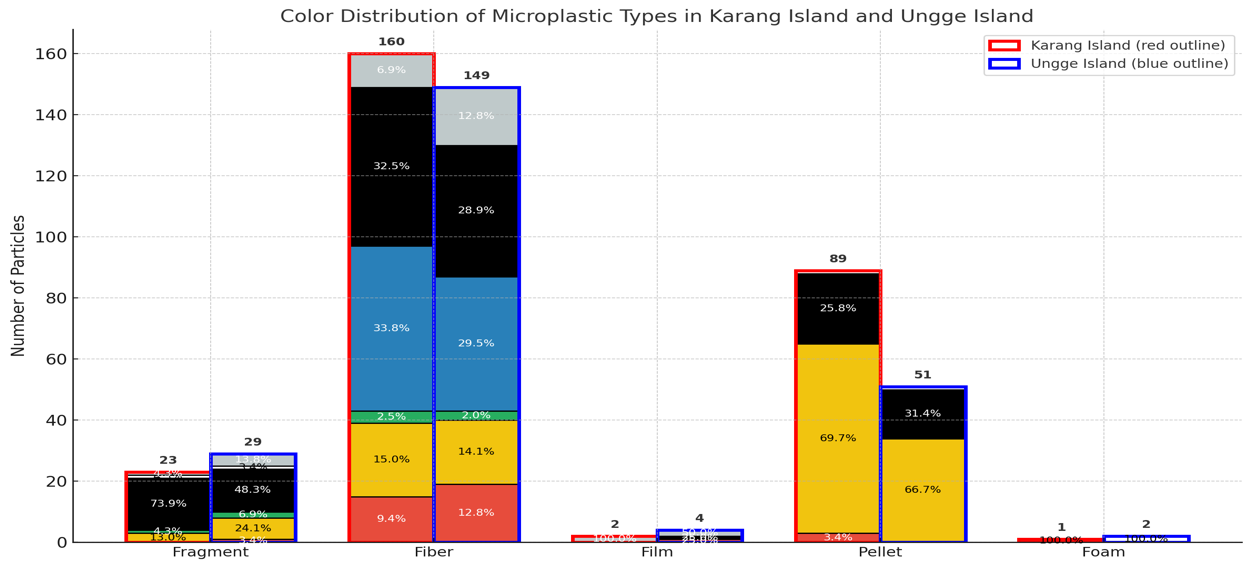
Figure 7 Total particle count by color and morphological type across both islands.
Table 2 Annual microplastic size range (µm) and dominant morphological types identified at Karang Island (2015 - 2024) and Ungge Island (2019 - 2024).
Location |
Year |
Lowest (µm) |
Highest (µm) |
Dominant types of microplastics |
Karang Island |
2024 |
76 |
101 |
Fiber, Fragment |
|
2023 |
62 |
298 |
Fiber |
|
2022 |
44 |
84 |
Fiber, Fragment |
|
2021 |
39 |
96 |
Fiber |
|
2020 |
40 |
479 |
Pellet, Fiber |
|
2019 |
38 |
185 |
Fiber, Fragment |
|
2018 |
55 |
108 |
Fiber, Fragment |
|
2017 |
56 |
247 |
Fiber |
|
2016 |
90 |
873 |
Fiber, Pellet |
|
2015 |
457 |
838 |
Fiber, Pellet |
Ungge Island |
2024 |
71 |
328 |
Fiber, Fragment |
|
2023 |
29 |
77 |
Fiber, Fragment |
|
2022 |
31 |
285 |
Fiber, Pellet |
|
2021 |
92 |
839 |
Fiber, Fragment |
|
2020 |
25 |
115 |
Fiber |
|
2019 |
31 |
151 |
Fiber, Fragment
|
Polymer composition and spatial divergence
The polymer composition of microplastics was confirmed using Fourier Transform Infrared (FTIR) spectroscopy, which identified characteristic absorption peaks for key functional groups, including N-H stretching (Nylon), C-O stretching (Polycarbonate), C-C stretching (Polypropylene), and C-H bending (Polystyrene and PET) (Figure 8). An analysis of the overall contribution of all identified polymers from 2015 - 2024 (Figure 11) revealed that the contamination was dominated by conventional packaging plastics. The most abundant polymers were Polystyrene (PS, 19.9%), Polypropylene (PP, 16.2%), and Polyvinyl chloride (PVC, 13.4%), followed by textile-related polymers Nylon (PA, 8.7%) and PET (7.6%). However, the temporal frequency analysis revealed that this overall composition was not uniform between the 2 sites. At Karang Island (2015 - 2024) (Figure 9), the dominance of PS and PP was evident, with both polymers being detected at high frequencies (frequency 3 - 6) consistently across the entire decade. In stark contrast, Ungge Island (2019 - 2024) (Figure 10) exhibited a distinctly different polymer profile; PS and PP were detected at very low frequencies (frequency 0 - 2), while Acrylonitrile Butadiene Styrene (ABS) and Latex were the most frequently identified polymers (frequency 3 - 5). This spatial divergence in polymer composition suggests different and distinct primary pollution sources impacting each island.
The annual polymer identification for both Karang Island stations, 1PK2 (Table 3) and 4PK1 (Table 4), was confirmed using FTIR analysis. A strikingly consistent contamination profile emerged across the entire island. The most significant finding was the ubiquitous and persistent presence of Nylon (polyamides), which was detected in 10 out of 10 years at station 4PK1 and 8 out of 10 years at station 1PK2. This dominant Nylon signal was consistently co-identified with other major industrial and packaging polymers. Polyvinyl chloride (PVC) was frequently detected at both sites (e.g., C-Cl stretching at 619.61 cm⁻¹), identified in 5 of the 10 years at 4PK1 and 3 of the 10 years at 1PK2. Polystyrene (PS) was also a recurring contaminant at both stations (e.g., C-H bending at 699.35 cm⁻¹). The data from both stations confirms that Karang Island is subjected to a persistent, mixed-polymer contamination signal strongly dominated by Nylon, PVC, and PS, suggesting chronic inputs from sources like fishing gear and packaging waste.
The annual polymer identification for the 2 Ungge Island stations, 3PU1 and 5PU, is presented in Tables 5 and 6, respectively. A strikingly consistent contamination profile was observed across both sites, which differed significantly from the profile at Karang Island. The data reveals the ubiquitous presence of Nylon (polyamides), which was detected in 10 of the 11 total station-years analyzed (e.g., via N−H stretching at 3,346.60 cm⁻¹ in 2024 at 3PU1). This persistent Nylon signal was consistently co-mingled with Acrylonitrile Butadiene Styrene (ABS) (e.g., C−H stretching at 699.43 cm⁻¹ in 2021) and Polyvinyl Chloride (PVC) (e.g., C-Cl stretching at 654.44 cm⁻¹ in 2020), which were both identified in multiple years at both stations. Notably, Polystyrene (PS), which was a dominant polymer at Karang Island, was largely absent at Ungge Island. This distinct polymer signature (Nylon + ABS + PVC) suggests a different set of primary pollution sources. Furthermore, the identification of the engineered plastic PTFE in 2024 at station 3PU1 (Table 5) supports the finding of increasing polymer complexity over time.
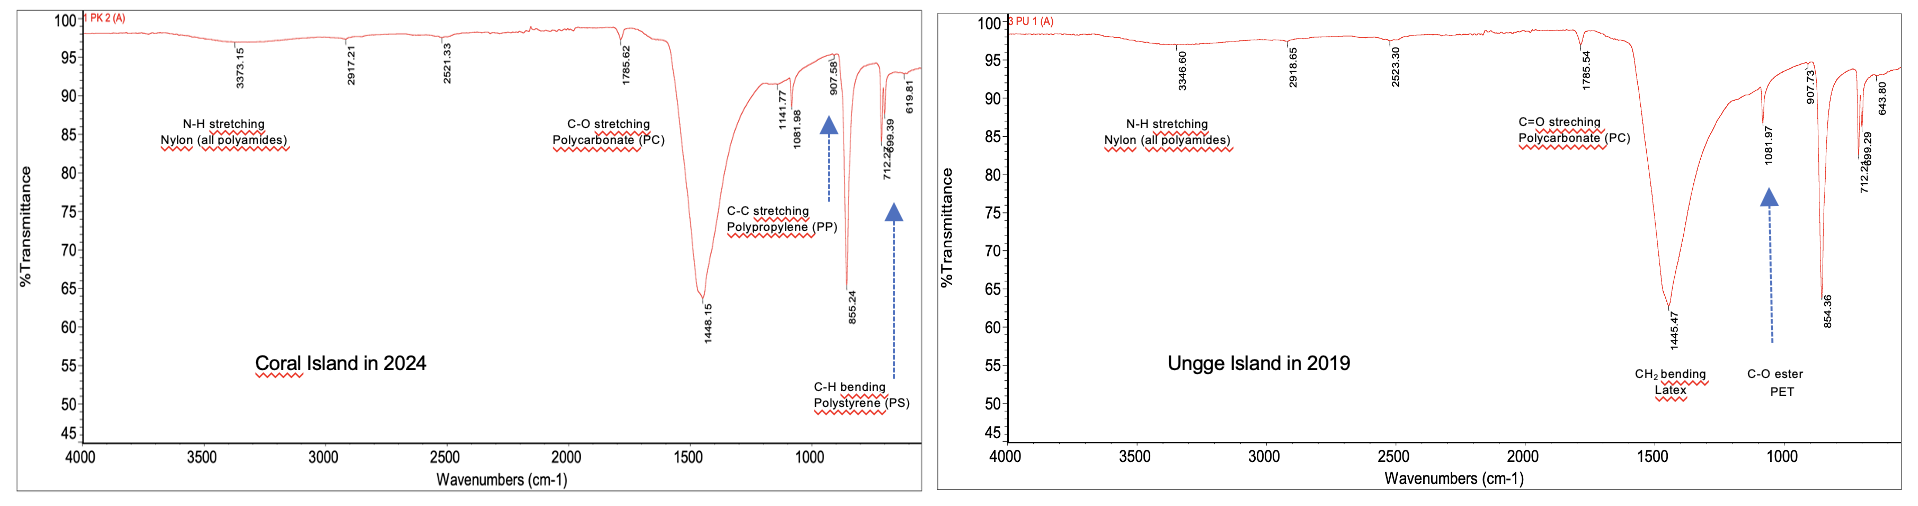
Figure 8 Representative FTIR spectra identifying key polymer functional groups from coral samples.
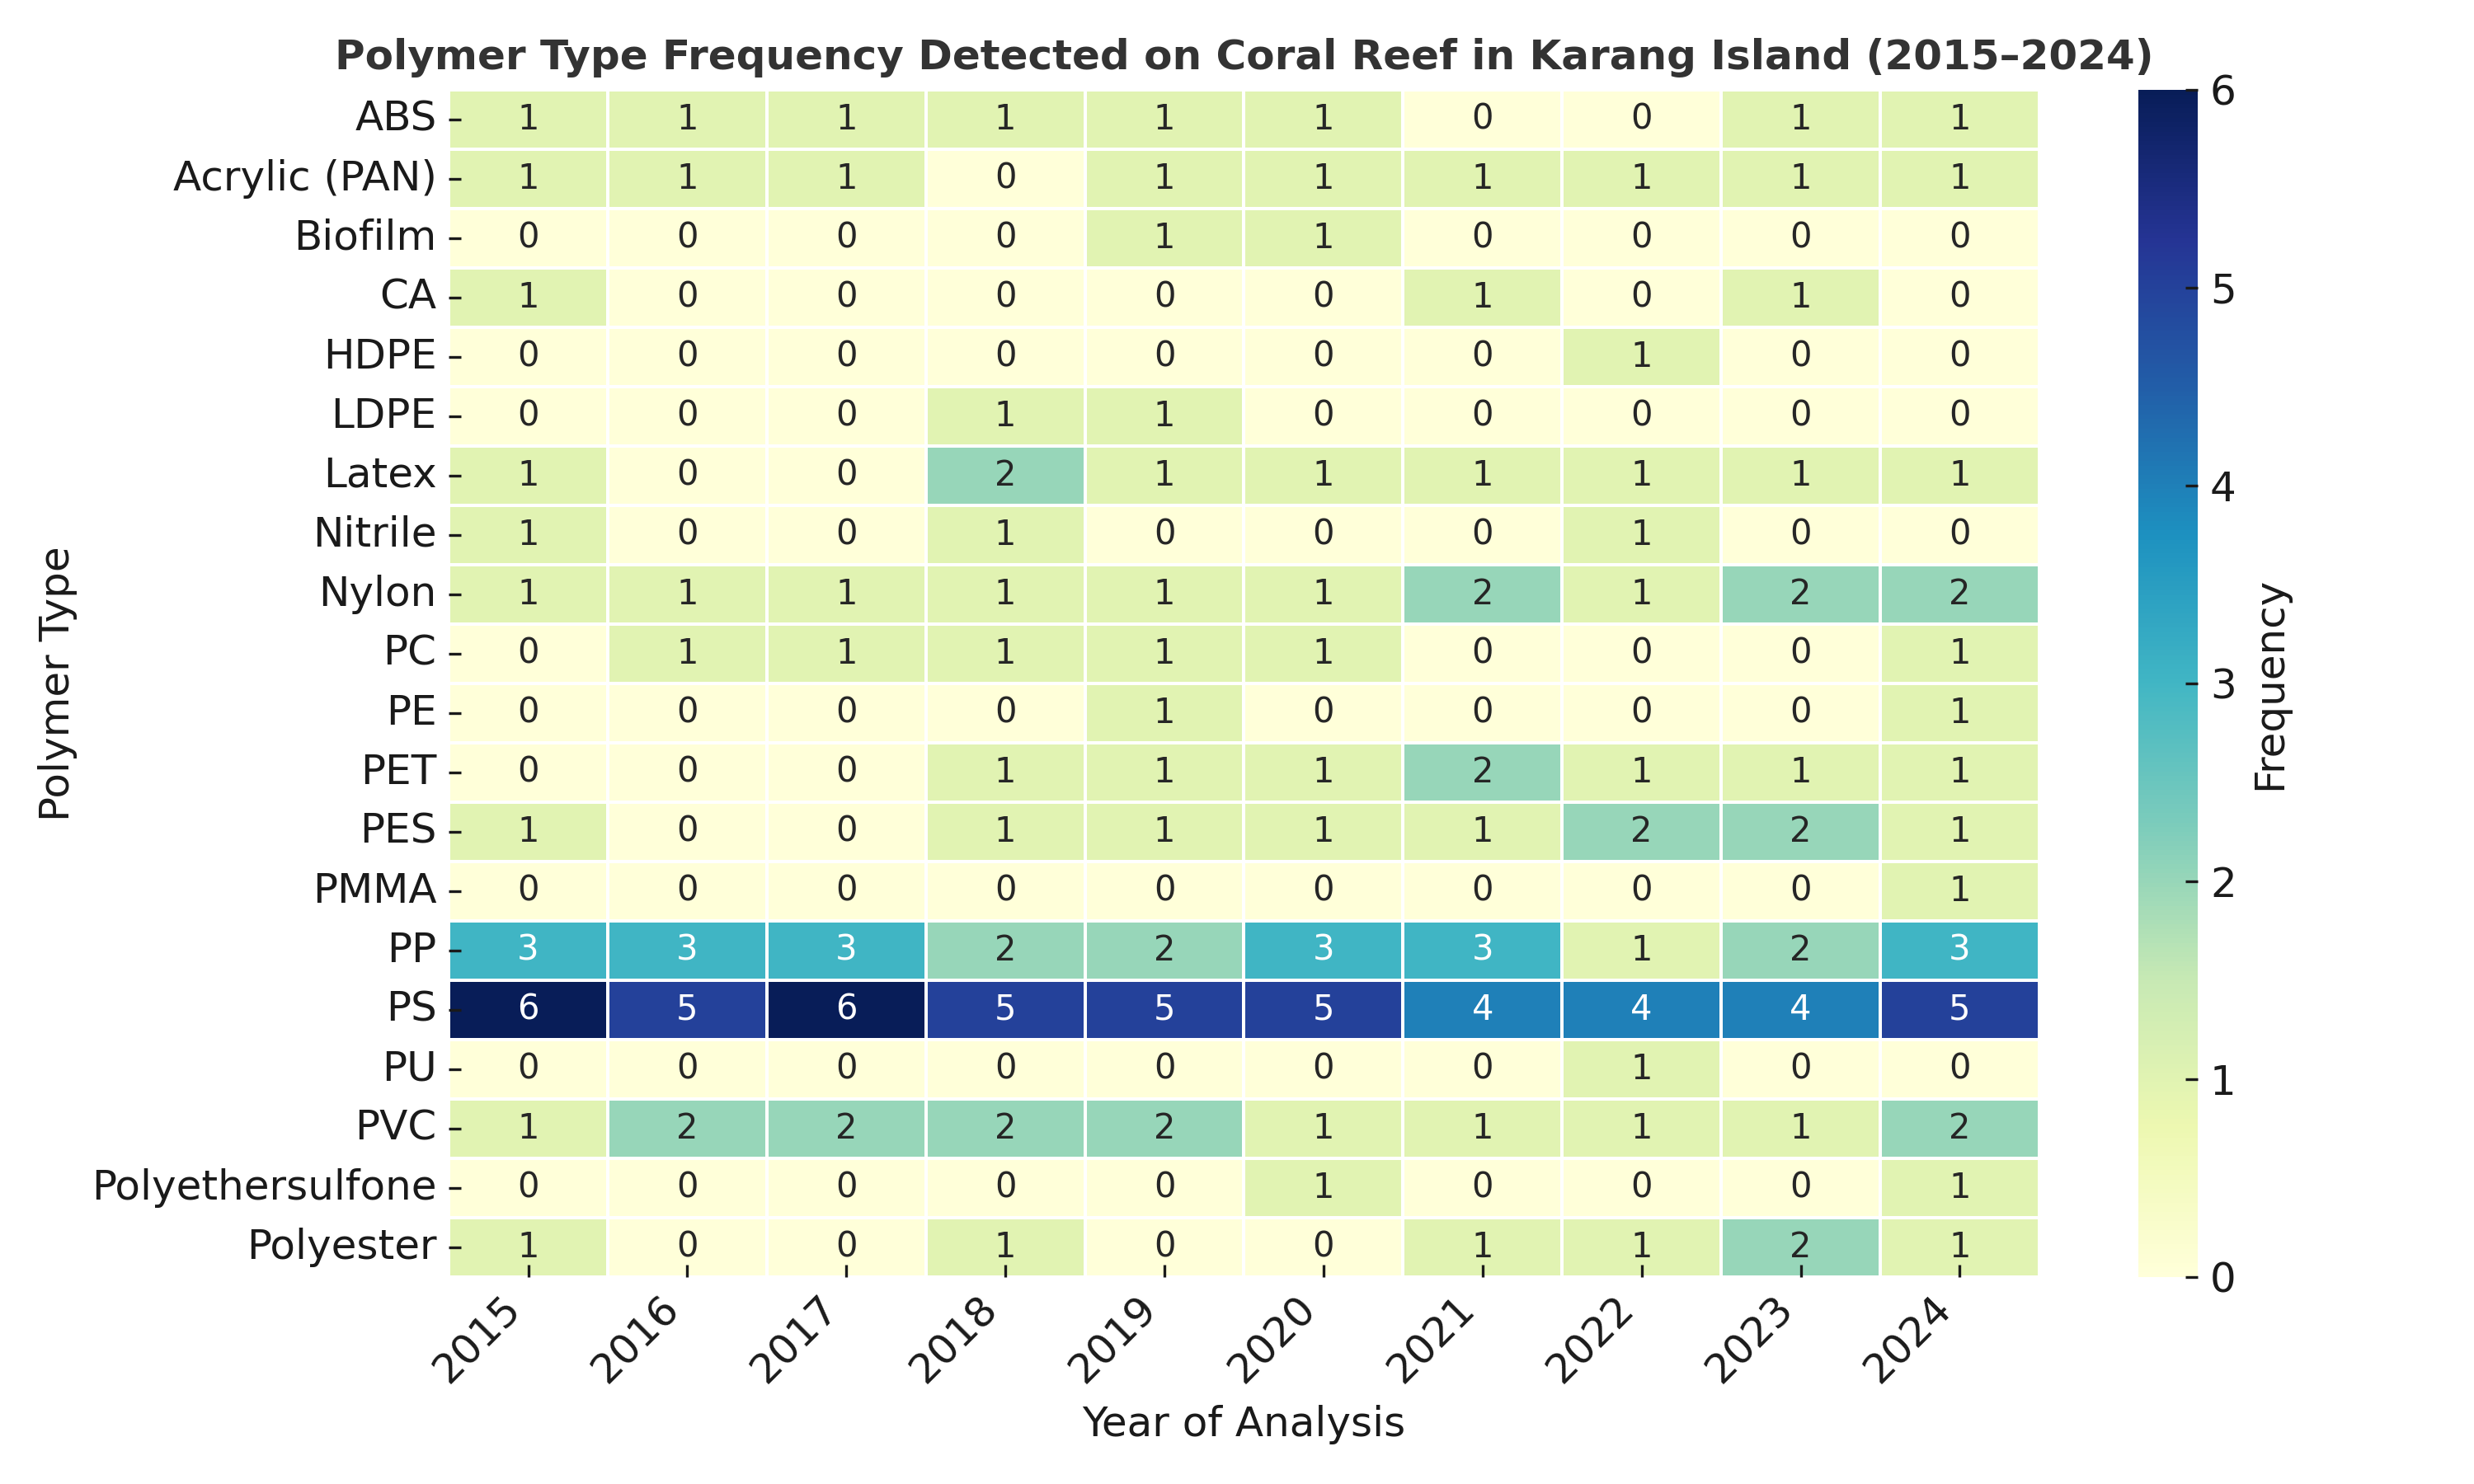
Figure 9 Temporal frequency of polymer types detected at Karang Island (2015 - 2024).
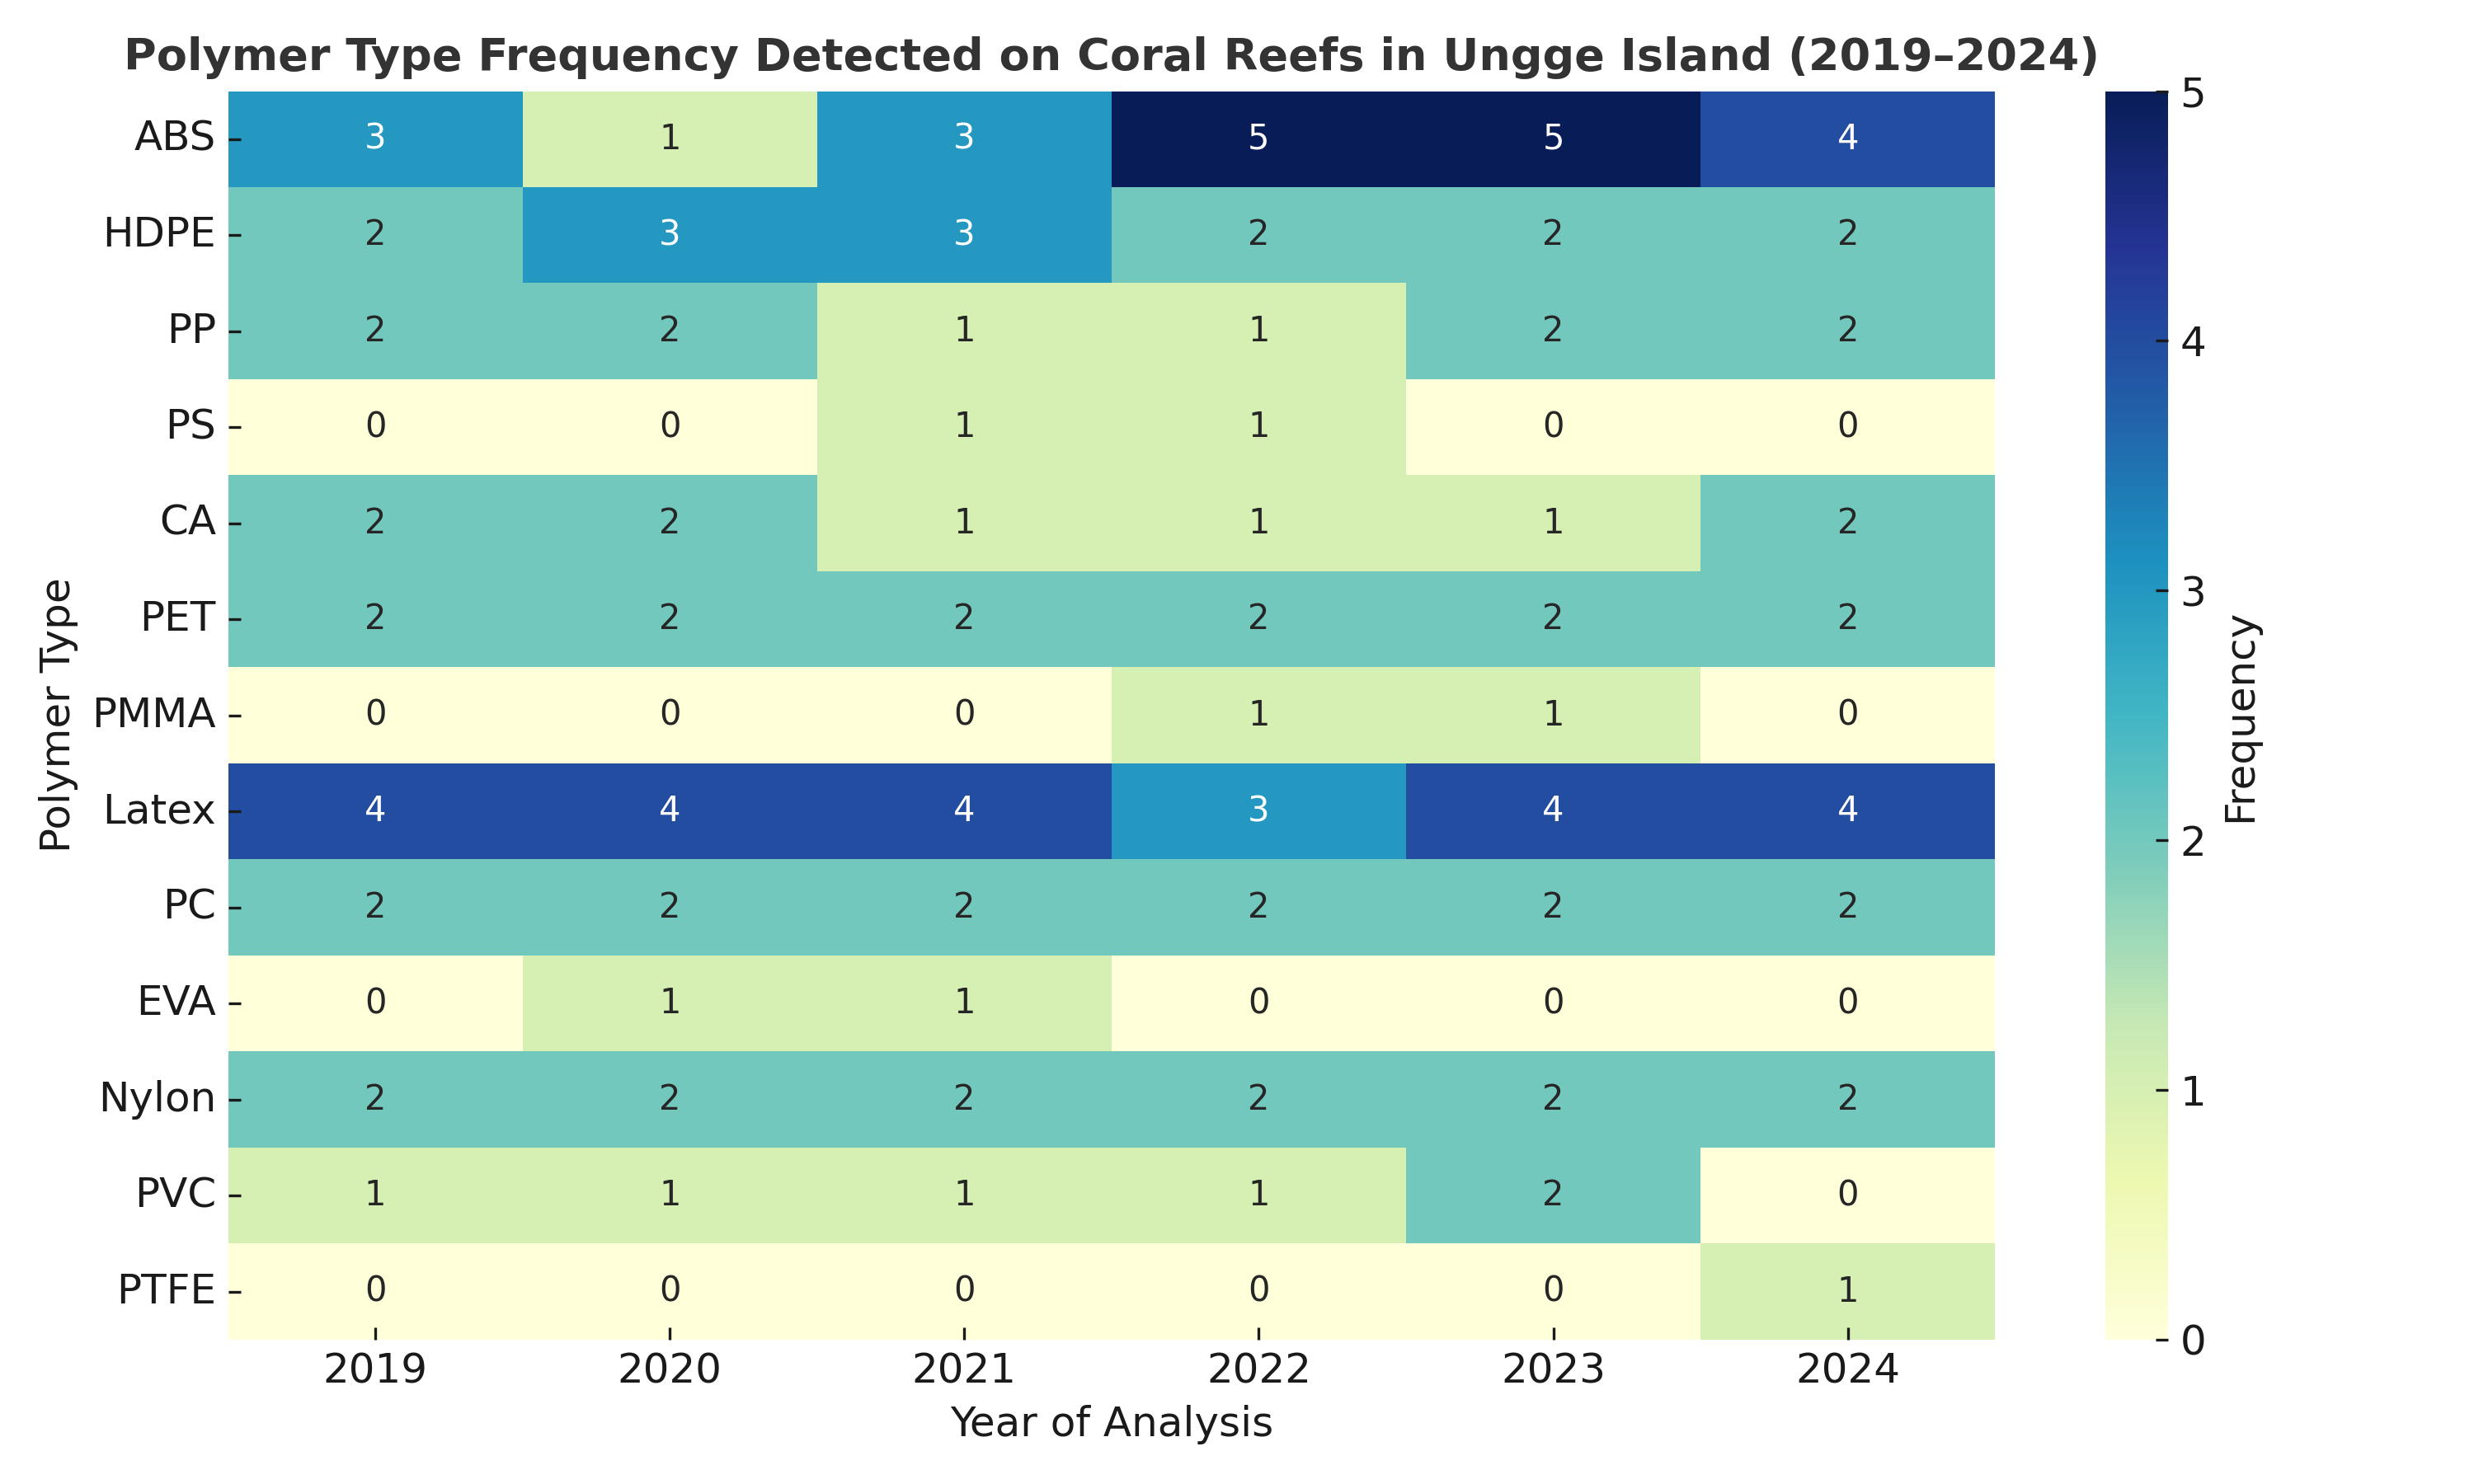
Figure 10 Temporal frequency of polymer types detected at Ungge Island (2019 - 2024).
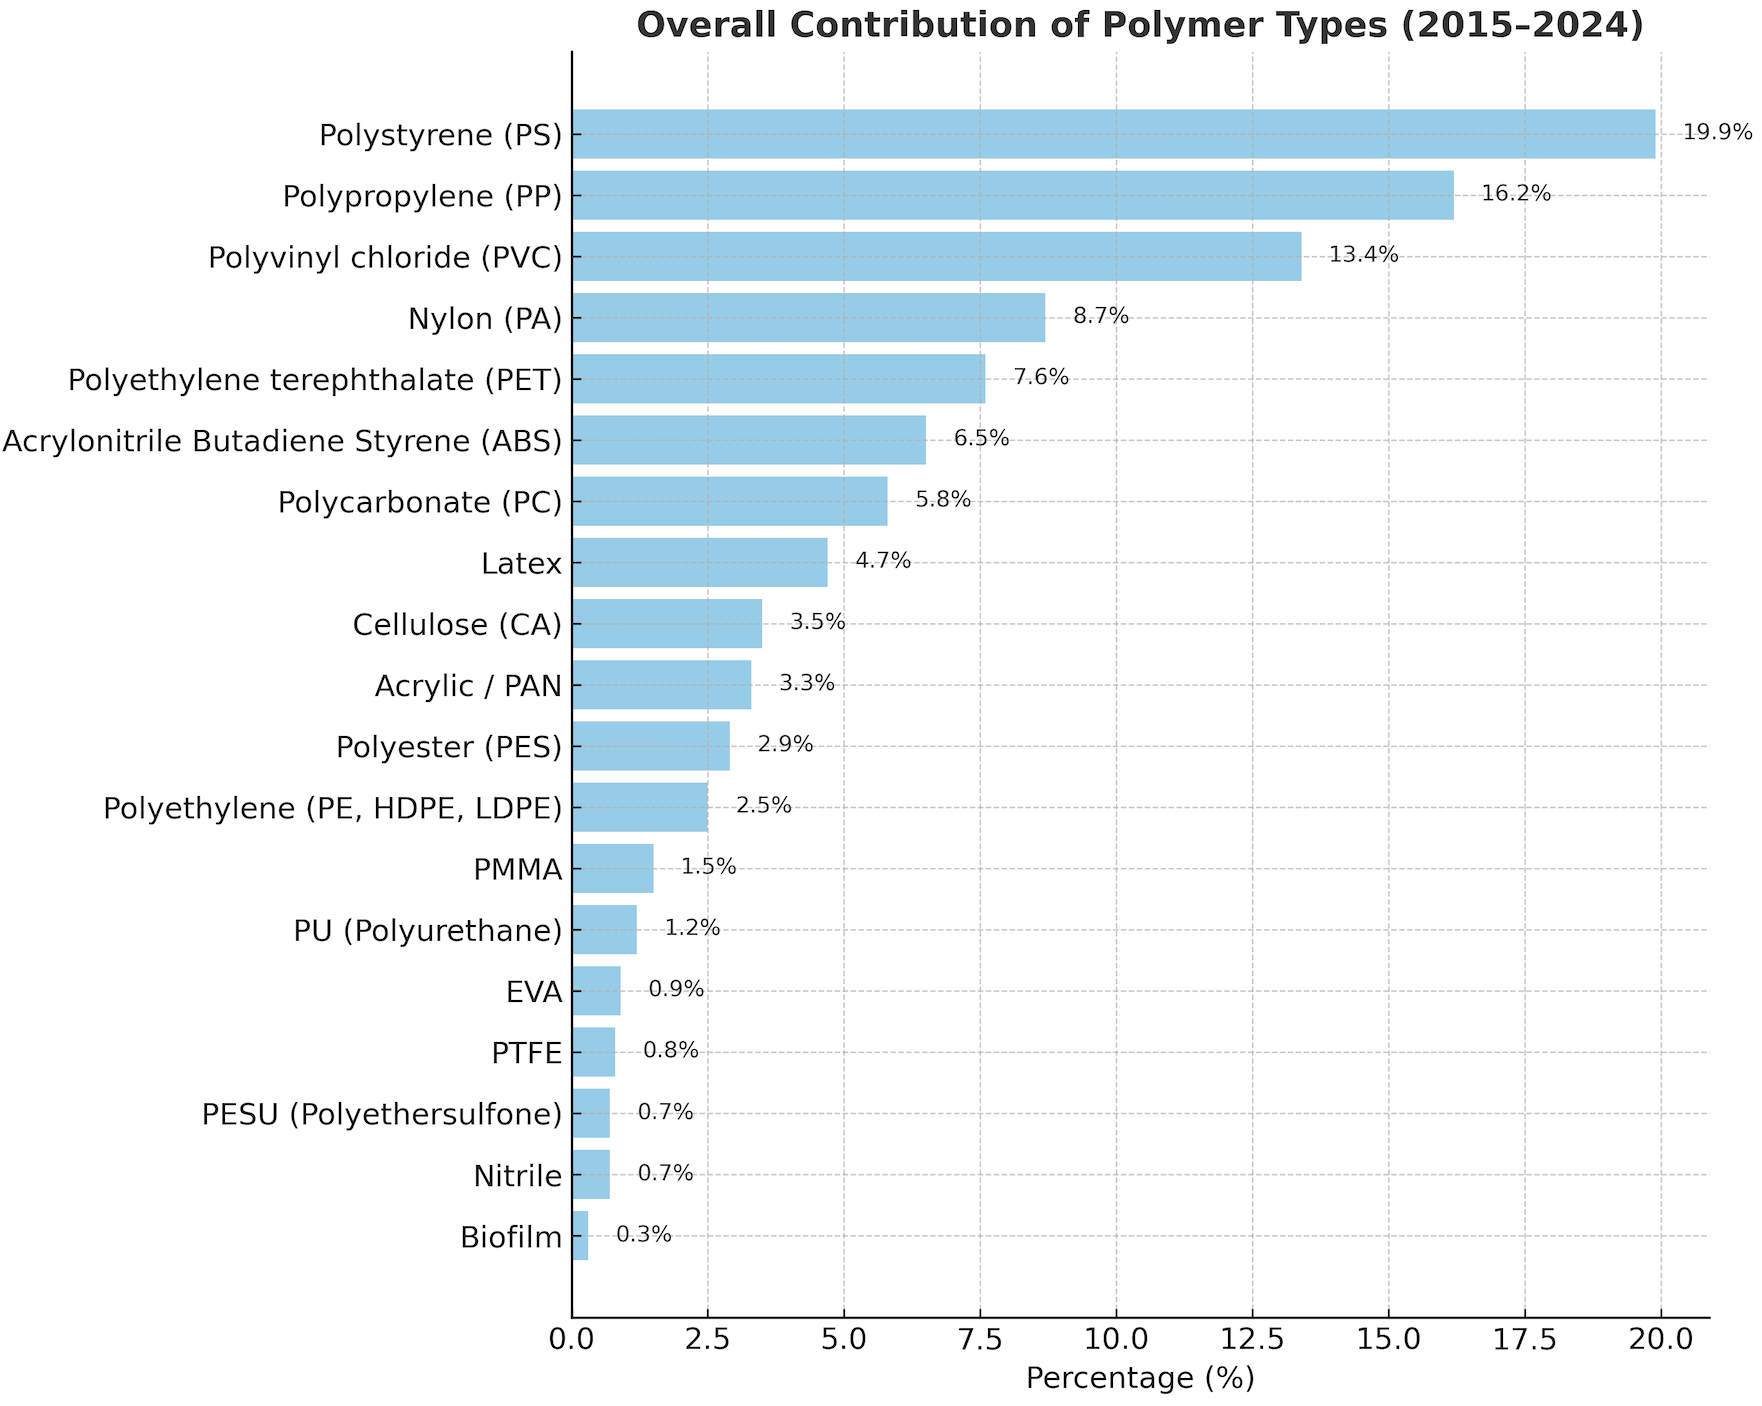
Figure 11 Overall percentage contribution of dominant polymer types identified across all samples (2015 - 2024).
Table 3 Annual polymer identification from FTIR analysis at Karang Island Station 1PK2 (2015 - 2024).
Location |
Year |
Wave Number (cm⁻¹) |
Functional Group |
Polymer Type |
Karang Island |
2024 |
619.81, 3,373.15 |
N–H stretching |
Nylon (all polyamides) |
|
2023 |
621.08, 3,356.02 |
O–H bending |
Cellulose (CA), Nylon |
|
2022 |
699.35, 2,522.56 |
C–H bending, C≡N stretching |
Polystyrene (PS), Acrylic (PAN, Polyacrylonitrile) |
|
2021 |
620.11, 3,383.31 |
C–Cl stretching, N–H stretching |
Polyvinyl chloride (PVC), Nylon |
|
2020 |
619.61 |
C–Cl stretching |
Polyvinyl chloride (PVC) |
|
2019 |
3,390.95, 627.50, 3,376.97 |
O–H stretching, C–H bending, N–H stretching |
Biofilm, PVC, Nylon |
|
2018 |
623.50, 3,380.45 |
Ester C=O, N–H stretching |
Polyethylene terephthalate (PET), Nylon |
|
2017 |
594.14, 3,373.46 |
C–Br stretching, N–H stretching |
Polystyrene (PS), Nylon |
|
2016 |
624.74, 3,409.38 |
C–Cl stretching, N–H stretching |
Polyvinyl chloride (PVC), Nylon |
|
2015 |
699.35, 3,370.22 |
C–H bending, C=O stretching |
Polystyrene (PS), Nylon (PA)
|
Table 4 Annual Polymer Identification from FTIR Analysis at Karang Island Station 4PK1 (2015 - 2024).
Location |
Year |
Wave Number (cm⁻¹) |
Functional Group |
Polymer Type |
Karang Island |
2024 |
603.37, 3,322.11 |
C–Br stretching, N–H stretching |
Polyvinyl chloride (PVC), Nylon |
|
2023 |
625.26 |
Ester C=O |
Polyethylene terephthalate (PET) |
|
2022 |
627.42, 3,404.54 |
C–Cl stretching, N–H stretching |
Polyvinyl chloride (PVC), Nylon |
|
2021 |
623.66, 3,344.04 |
O–H bending, N–H stretching |
Cellulose (CA), Nylon |
|
2020 |
617.28, 3,370.94 |
C–Cl stretching, N–H stretching |
Polyvinyl chloride (PVC), Nylon |
|
2019 |
617.66, 3,382.07 |
C–Cl stretching, N–H stretching |
Polyvinyl chloride (PVC), Nylon |
|
2018 |
572.32, 3,360.44 |
C–Cl stretching (chlorine vibration), N–H stretching |
Polyvinyl chloride (PVC), Nylon |
|
2017 |
699.42, 3,376.10 |
C–H bending, N–H stretching |
Polystyrene (PS), Nylon |
|
2016 |
699.37, 3,374.75 |
C–H bending, N–H stretching |
Polystyrene (PS), Nylon |
|
2015 |
655.19, 3,363.32 |
O–H bending, N–H stretching |
Cellulose (CA), Nylon
|
Table 5 Annual polymer identification from FTIR analysis at ungge island station 3PU1 (2019 - 2024).
Location |
Year |
Wave Number (cm⁻¹) |
Functional Group |
Polymer Type |
Ungge Island
|
2024 |
643.80, 3,346.60, 566.55 |
C–C–F bending, N–H stretching, C–Cl |
PTFE, Nylon (all polyamides), Polyvinyl Chloride (PVC) |
|
2022 |
3,372.28, 625.43 |
N–H stretching, C–Cl stretching |
Nylon (all polyamides), Polyvinyl Chloride (PVC) |
|
2021 |
3,363.59, 699.43 |
N–H stretching, C–H stretching |
Nylon (all polyamides), Acrylonitrile Butadiene Styrene (ABS) |
|
2020 |
3,331.34, 654.44 |
N–H stretching, C–Cl stretching |
Nylon (all polyamides), Polyvinyl Chloride (PVC) |
|
2019 |
3,308.33, 3,363.28 |
N–H stretching, Aromatic C–H out of plane bending |
ABS, Nylon (all polyamides) |
Table 6 Annual polymer identification from FTIR analysis at ungge island station 5PU (2019 - 2024).
Location |
Year |
Wave Number (cm⁻¹) |
Functional Group |
Polymer Type |
Ungge Island
|
2024 |
699.39 |
Aromatic C–H out of plane bending |
ABS |
|
2023 |
3,375.23, 622.10 |
N–H stretching, C–Cl stretching |
Nylon (all polyamides), Polyvinyl Chloride (PVC) |
|
2022 |
3,374.54, 699.34 |
N–H stretching, Aromatic C–H out of plane bending |
Nylon (all polyamides), ABS |
|
2021 |
3,315.99, 610.24 |
N–H stretching, C–Cl stretching |
Nylon (all polyamides), Polyvinyl Chloride (PVC) |
|
2020 |
3,330.98, 699.40 |
N–H stretching, Aromatic C–H out of plane bending |
Nylon, ABS |
|
2019 |
3,376.32, 627.98, 3,388.89 |
N–H stretching, C–Cl stretching |
Nylon, Polyvinyl Chloride (PVC), Nylon |
Temporal decline in annual coral growth rates
A pronounced and consistent decline in annual coral growth rates was observed across all four stations (Figure 12). At Karang Island, station 1PK2 (St.1) decreased from its growth peak of 26 mm yr⁻¹ in 2016 to 15 mm yr⁻¹ by 2024. Station 4PK1 (St.4) exhibited a similar decline, falling from 25 mm yr⁻¹ in 2017 to 11 mm yr⁻¹ in 2024. The trend was also evident at Ungge Island; station 5PU (St.5) declined from 20 mm yr⁻¹ in 2019 to 11 mm yr⁻¹ in 2024, while station 3PU1 (St.3) showed the steepest decline, from 14 to 8 mm yr⁻¹ over the same 6-year period.
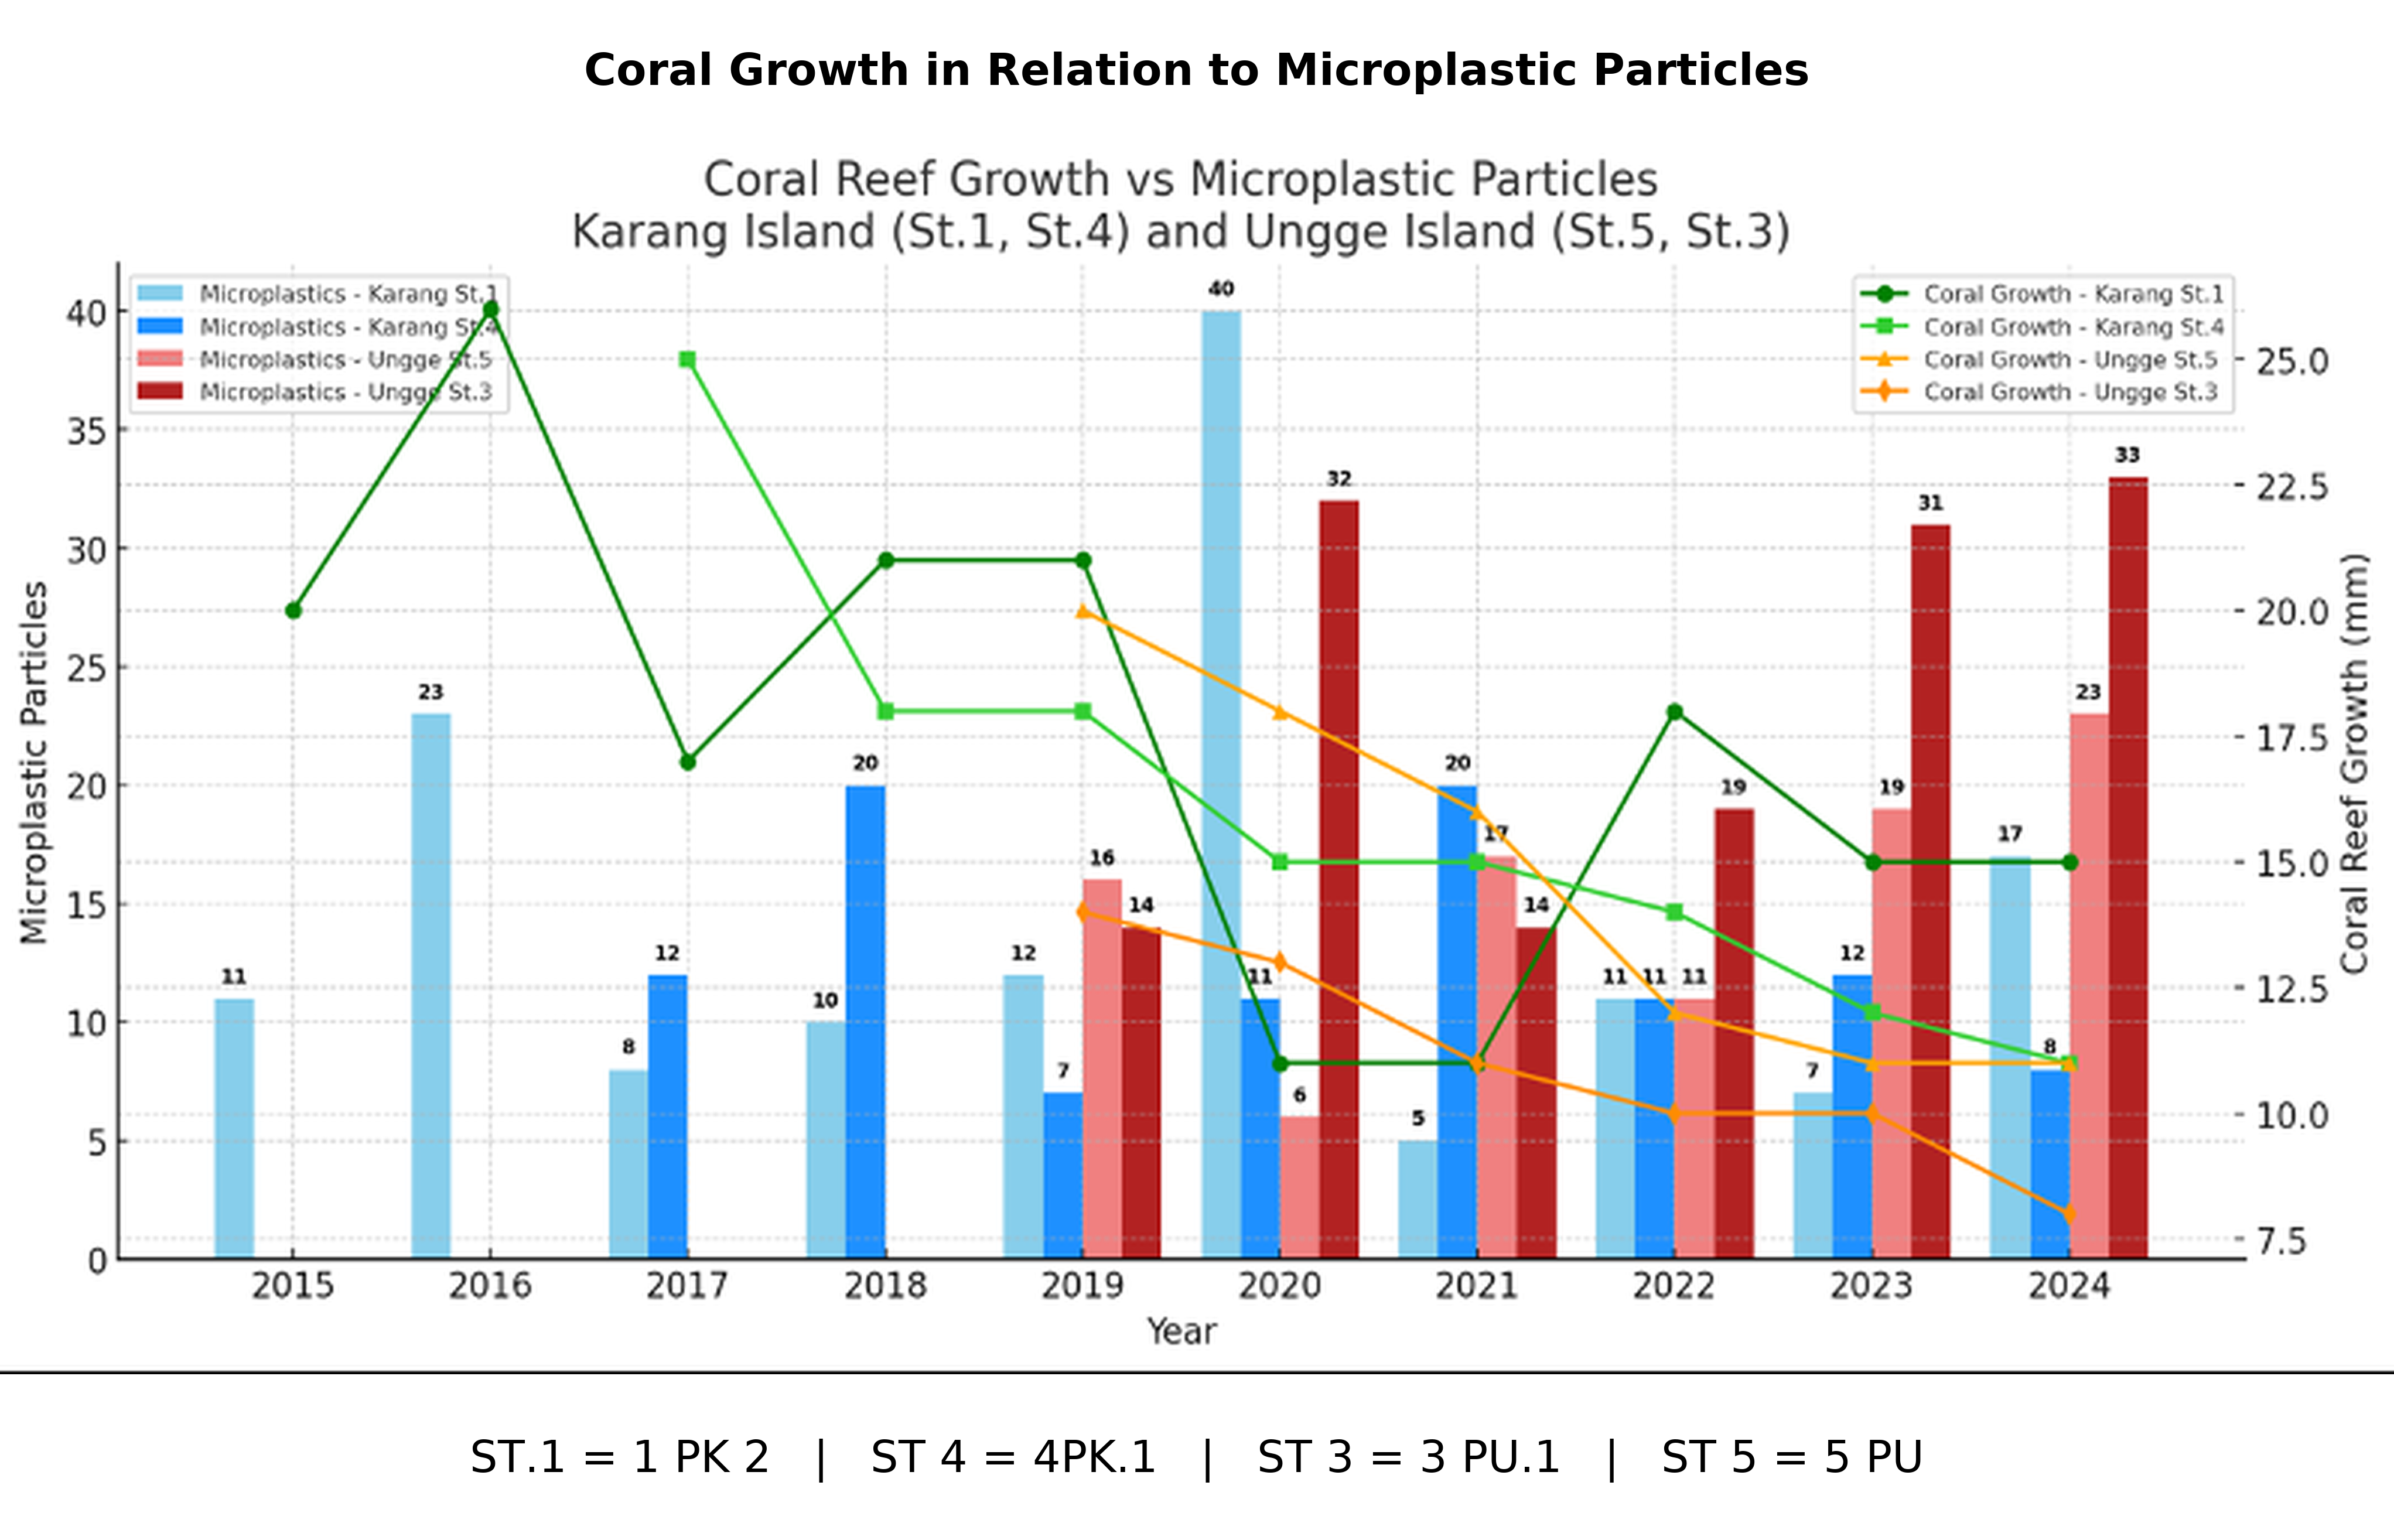
Figure 12 Annual Coral Growth Rates (mm yr⁻¹) at Karang Island and Ungge Island.
Intensification of anthropogenic drivers
This decline in coral health coincided with a clear and steady intensification of local anthropogenic pressures. The total population of Central Tapanuli Regency increased from 350,017 in 2015 to 394,910 in 2024 (Figure 13). Similarly, the number of total industries expanded from 1,802 units in 2015 to 2,568 units in 2024, with a particularly sharp increase in annual growth observed in 2020 (Figure 14 and Table 1).
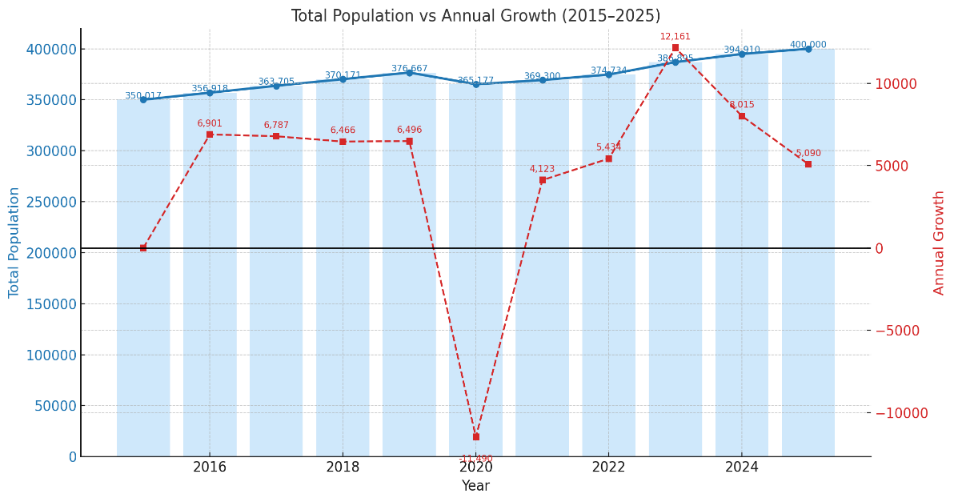
Figure 13 Total population growth in Central Tapanuli Regency (2015 - 2024).
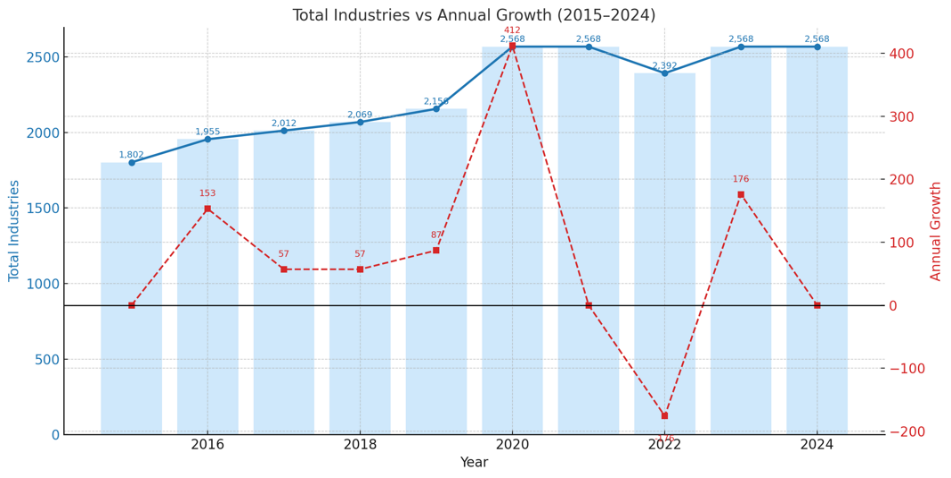
Figure 14 Growth in the number of industries in Central Tapanuli Regency (2015 - 2024).
Visual synthesis of coral growth and environmental stressors
Figure 15 visually synthesizes these relationships, overlaying the declining coral growth lines with the temporal trends of microplastic contamination and the implicit rise of anthropogenic factors. The graph visually suggests an inverse relationship: Years with high microplastic particle loads (e.g., 40 particles at 1PK2 in 2020) correspond to low points in coral growth (11 mm at 1PK2 in 2020).
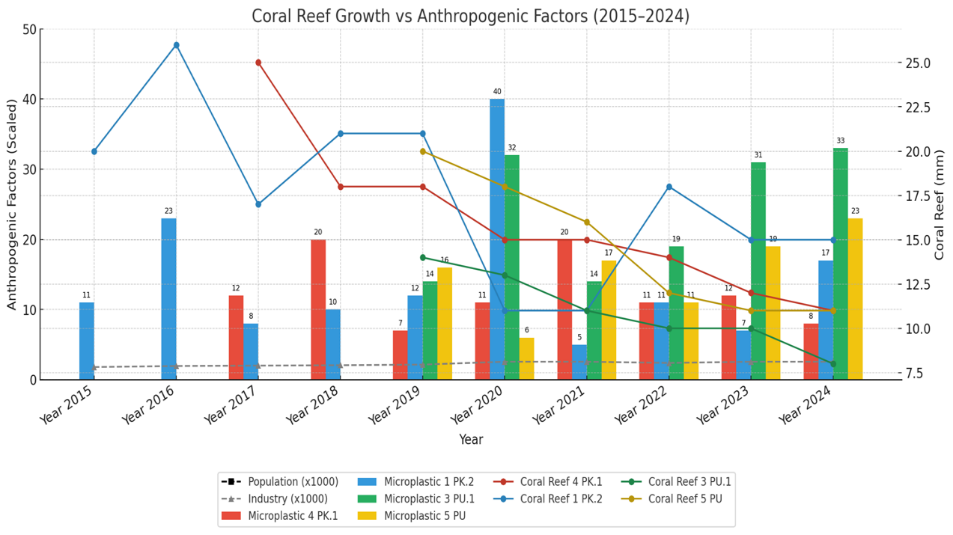
Figure 15 Visual synthesis of declining coral growth rates in relation to anthropogenic factors.
Table 1 Summary of minimum and maximum values for measured anthropogenic and natural causes (2015 - 2024).
Parameter |
Min |
Max |
Population (People) |
250,017 |
394,910 |
Number of Industries |
1,802 |
2,568 |
Rainfall (mm) |
301.21 |
449.39 |
Air Temperature (°C) |
26.32 |
27.36 |
Sea Surface Temperature (SST °C) |
29.49 |
30.38 |
Ungge Island Microplastic (Particles/g) |
6 |
33 |
Karang Island Microplastic (Particles/g) |
4 |
40 |
Coral Growth on Ungge Island (mm) |
8 |
20 |
Coral Growth on Karang Island (mm) |
11 |
26 |
Trends in natural climate factors
Natural factors also exhibited potential stress-inducing trends during the study period. Annual rainfall was highly variable, with major precipitation years in 2016 (449.39 mm) and 2021 (402.42 mm) and a significant dry period in 2022 (301.21 mm) (Figure 16). More critically, thermal stressors intensified. Air temperature fluctuated but concluded with a sharp increase, reaching its decadal peak in 2024 (27.36 °C) (Figure 18). This corresponded with trends in Sea Surface Temperature (SST), which consistently showed median annual temperatures approaching or exceeding the 30 °C thermal stress threshold, particularly in 2016, 2020, 2021, and 2024 (Figure 17).
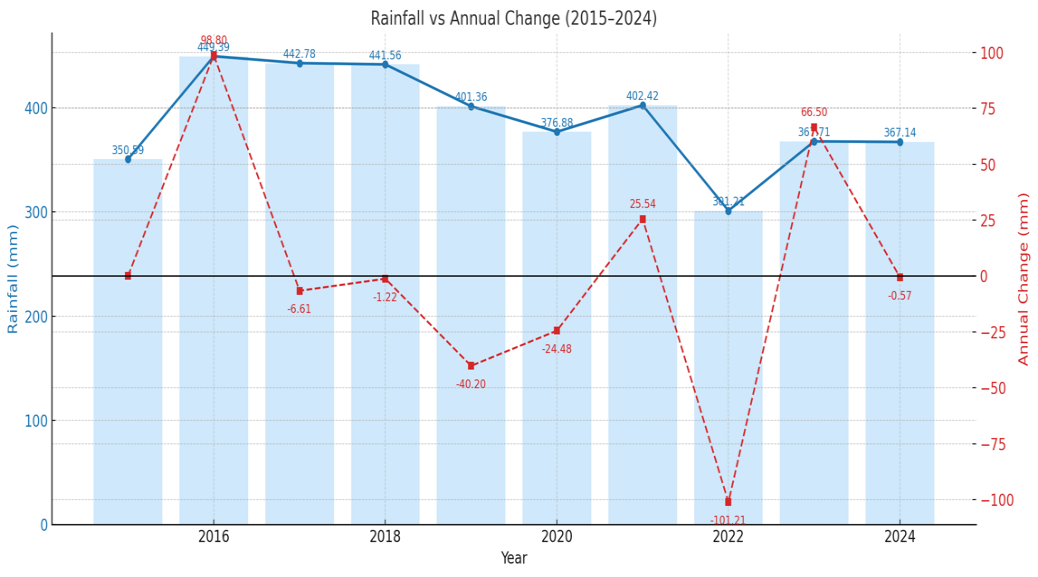
Figure 16 Total annual rainfall (mm) in Central Tapanuli Regency (2015 - 2024).
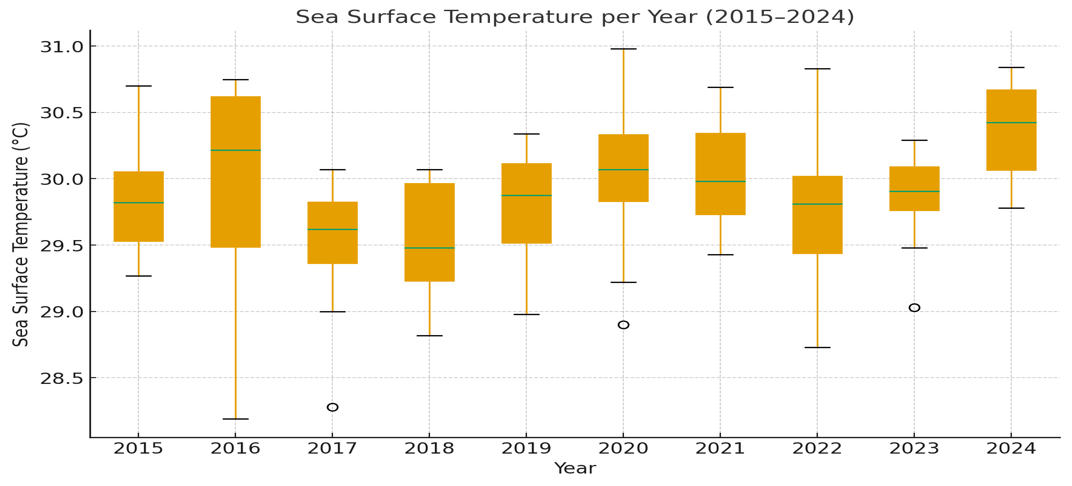
Figure 17 Annual Sea Surface Temperature (SST) trends at Karang Island and Ungge Island (2015 - 2024).
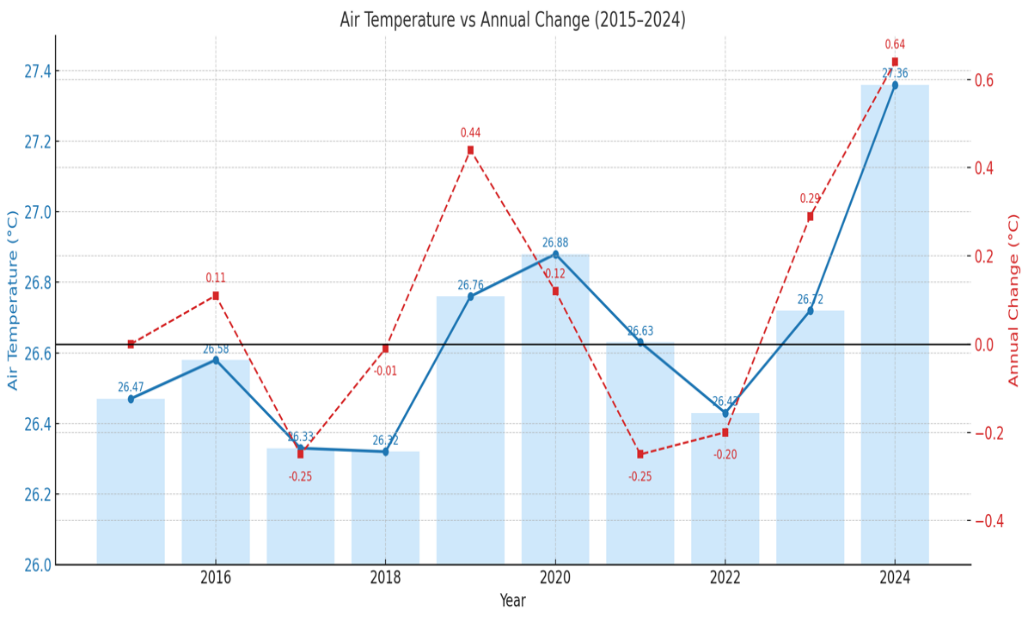
Figure 18 Annual mean air temperature trends at Central Tapanuli Regency (2015 - 2024).
Statistical correlation between coral growth and environmental drivers
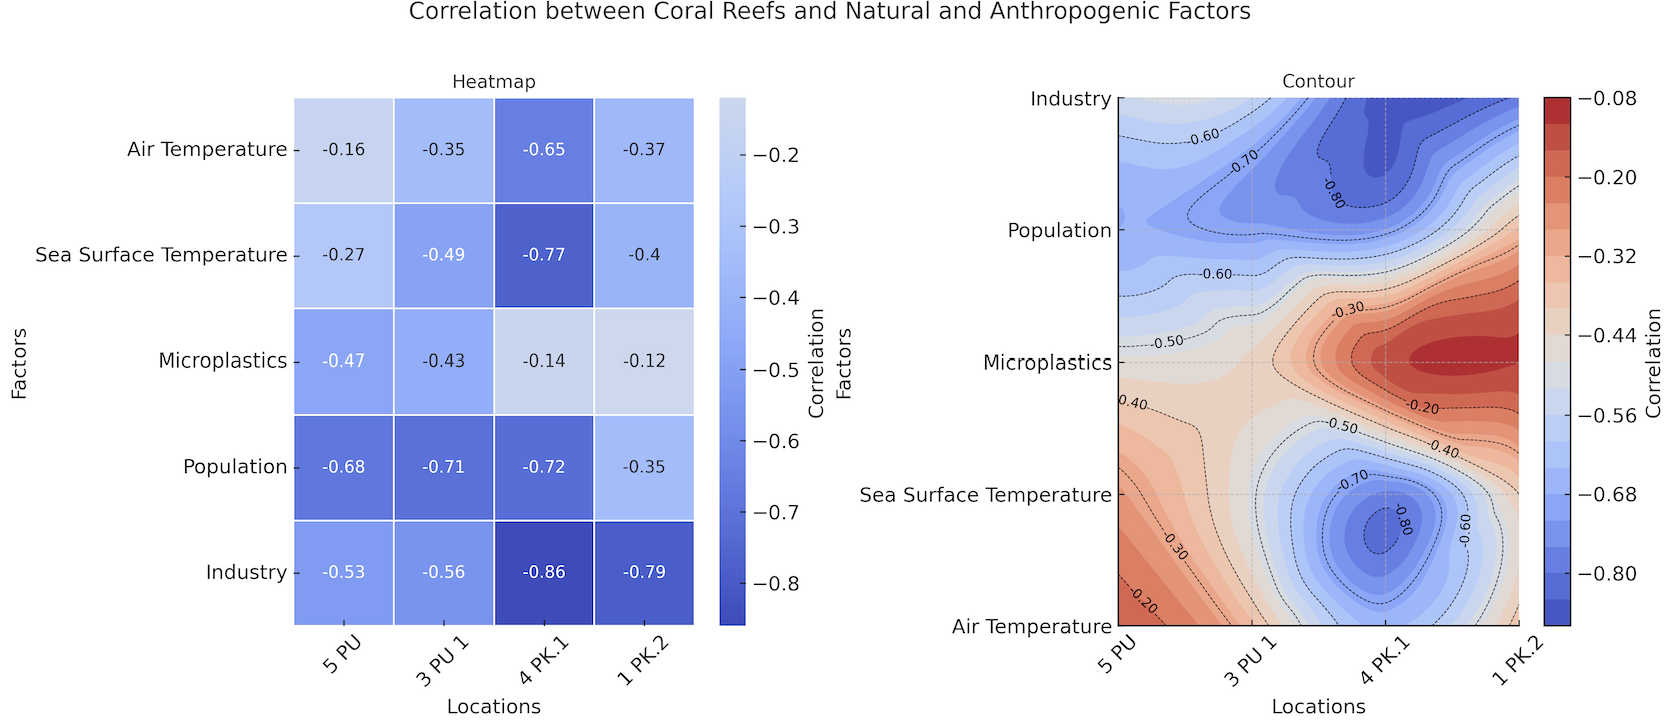
To statistically validate the relationships suggested visually, a Pearson correlation analysis was performed, correlating annual coral growth at each station against the 5 primary environmental stressors (Figure 19). The resulting heatmap and contour plot confirmed a predominantly strong and negative correlation between coral growth and the measured drivers. The strongest and most consistent negative correlations were observed between coral growth and the anthropogenic factors: Industry (r-values ranging from −0.53 to −0.86) and Population (r-values ranging from −0.35 to −0.72). Thermal stress from SST also showed a strong negative correlation, particularly at station 4PK1 (r = −0.77). Microplastic abundance demonstrated a consistent, though more moderate, negative correlation with annual growth at all four sites, with coefficients ranging from r = −0.12 to r = −0.47. These statistical results quantitatively confirm that the observed decline in coral growth is significantly associated with the cumulative pressures of coastal industrial and population growth, regional thermal stress, and persistent microplastic pollution.
 Figure
19 Pearson
correlation matrix detailing the relationships between annual coral
growth and measured environmental drivers (anthropogenic
and natural).
Figure
19 Pearson
correlation matrix detailing the relationships between annual coral
growth and measured environmental drivers (anthropogenic
and natural).
Discussion
The quantification of microplastic particles embedded within the coral skeletons (ranging from 3 - 20 particles/g at Karang Island and 3 - 16 particles/g at Ungge Island) provides the first critical baseline for this contamination vector in Central Tapanuli [11,26]. The observed concentrations suggest significant local environmental loading. This is strongly supported by the parallel data on regional anthropogenic pressures, which showed a steady increase in population (to 394,910) and industrial activity (to 2,568 units). This finding aligns with a broad consensus in the literature that escalating anthropogenic activities in coastal zones are a primary driver of microplastic pollution in adjacent marine ecosystems [27-29].
The morphological analysis reinforces this link to anthropogenic sources. The unequivocal dominance of fibers (58.18% - 63.40%) at both sites is highly consistent with global marine pollution studies [30,31]. This strongly implicates 2 primary pollution pathways: 1) domestic wastewater (from synthetic textile laundry) and 2) degradation of fishing gear (nets, ropes, and lines), which are known to be major sources of microplastic fibers [30,31]. The wide particle size range (25 - 873 µm) and the co-occurrence of fragments and films reflect a complex pollution landscape, indicative of continuous in-situ fragmentation of larger plastic debris by UV radiation, hydrodynamic-driven mechanical abrasion, and biological interactions [26,35-40]. The prevalence of dark-colored particles (black, blue) also aligns with findings from other marine studies [12,32-34].
The FTIR analysis (peaks: 555.19 - 3,409.38 cm⁻¹) provided a definitive chemical fingerprint of the pollution [41-44]. The overall dominance of Polystyrene (PS, 19.9%), Polypropylene (PP, 16.2%), and Polyvinyl Chloride (PVC, 13.4%) confirms that the primary pollution sources are linked to conventional, single-use packaging and industrial materials [40]. The additional contribution of Nylon (8.7%) and PET (7.6%) further corroborates the hypothesized inputs from textiles and fishing gear [45,46].
Perhaps the most significant finding of this study is the temporal increase in polymer diversity, which rose from 11 unique types in 2015 to 15 types by 2024. This trend, supported by Sutthacheep et al. [37]; Hierl et al. [47], indicates that the sources of plastic pollution are not only persistent but are actively broadening. While conventional polymers (PS, PP, PVC) remain the core pollutants [40,46], the emergence of new engineered plastics such as ABS, PMMA, and PTFE in recent years signals new, complex contamination pathways linked to expanding industrial applications and consumer product waste streams. This simultaneous rise in polymer abundance and diversity [37,47] presents a compounding ecological challenge, as each polymer possesses distinct degradation rates, chemical leachates, and potential toxicological impacts.
The strongest statistical drivers identified were industrial growth (r-values up to −0.86) [20], Sea Surface Temperature (SST) (r up to −0.77), and population growth (r up to −0.72) [27]. The strong negative correlation with population and industry supports the hypothesis that coastal development, leading to factors such as habitat degradation, resource exploitation, and declining water quality, is a primary cause of reef degradation [52,53].
Simultaneously, the thermal stress from rising SST is a well-established driver of coral decline. Our data, showing SSTs consistently approaching or exceeding the critical 30°C bleaching threshold, provides clear evidence of this pressure. This aligns perfectly with studies by Abeysinghe et al. [32]; Yao and Wang [58], which confirm that heat stress disrupts the coral-zooxanthellae symbiosis, impairs photosynthetic activity, and increases oxidative stress, leading directly to bleaching and reduced calcification. These stressors are likely compounded by high rainfall events, which can increase terrestrial runoff, leading to sedimentation and eutrophication that further reduce light penetration and coral resilience [54-57].
This study demonstrates that microplastic pollution acts as a significant, chronic, and compounding stressor. The observed moderate negative correlation (r = −0.12 to −0.47) between microplastic abundance and coral growth is mechanistically plausible and supported by extensive literature. High concentrations of MPs are known to negatively impact coral physiology by reducing growth rates and weakening polyp activity [15,31,50,51].
The physical presence of particles, as observed in this study, can interfere with feeding mechanisms and block light, thereby disrupting the photosynthetic processes of symbiotic algae [48,49]. Furthermore, chemical leachates from the polymers (such as those identified in our FTIR analysis) have been shown to inhibit the critical settlement process of coral larvae, directly threatening reef regeneration [18].
The relationship is not always linear; for example, high growth in 2016 at 1PK2 occurred despite moderate MP levels. This reinforces that microplastics are not the sole driver of mortality but are a crucial part of a synergistic stress model. The coral ecosystems in Central Tapanuli are under a multi-faceted assault. The data strongly suggests that coral resilience, already severely compromised by chronic thermal stress (SST) and declining water quality (population, industry), is being further eroded by an intensifying and increasingly complex burden of microplastic pollution.
Conclusions
This study provides the first quantitative evidence of microplastic (MPs) incorporation within the annual growth bands of corals in Central Tapanuli, establishing their utility as chronological archives for pollution. We documented significant contamination (ranging from 3 - 20 particles/g), predominantly composed of fibers (58% - 63%) and polymers linked to packaging and industrial sources (e.g., PS, PP, PVC, and Nylon). Crucially, this research reveals not only the presence of plastics but also a significant temporal increase in polymer diversity over the last decade (from 11 to 15 unique types), indicating a broadening and intensification of pollution sources. Statistical analysis confirmed a pronounced decline in coral growth rates across all sites. This decline was most strongly correlated with intensifying anthropogenic drivers, specifically industrial expansion (r-values up to −0.86), and natural stressors, namely Sea Surface Temperature (r-values up to −0.77). Microplastic abundance demonstrated a moderate but statistically significant negative correlation (r-values up to −0.47), identifying it as a chronic, compounding stressor. These findings quantitatively demonstrate that coral ecosystems in this region are under a cumulative assault from thermal stress, accelerating coastal development, and an increasingly complex plastic pollution burden, underscoring the urgent need for integrated coastal management and stricter regional waste regulations.
Acknowledgements
The author would like to thank the Directorate of Research and Community Service (DPPM) for funding this research (contract number: 087/C3/DT.05.00/PL/2025; 006/UN33.8/DPPM/PL/ 2025); Medan State University, Pinang Sori Meteorology, Climatology and Geophysics Agency, and the Head of Sitiris-Tiris Village for facilitating this research.
Declaration of generative AI in scientific writing
Declaration of Generative AI in Scientific Writing. This manuscript utilized generative AI tools, namely QuillBot and Grammarly, to enhance language clarity, grammar, and overall readability. The authors declare that they have no known competing financial interests or personal relationships that could have appeared to influence the work reported in this paper.
CRediT author statement
Rahmatsyah Rahmatsyah: Conceptualization; Coral reef annual cycle analysis; Writing - original draft; Methodology. Rita Juliani: Methodology; Equipment and material preparation; Validation. Hendro Pranoto: Anthropogenic cause data analysis. Ali Arman Lubis: Drafting publication article; Writing - review & editing; Validation; Formal analysis. Koko Ondara: Natural cause data analysis; Writing - review & editing; Validation. Agung Setia Batubara: Methodology; Drafting publication article; Project administration. Riri Syavira: FTIR analysis; Project administration.
References
WWF Internasional, Available at: https://wwf.panda.org/discover/knowledge_hub/where_we_work/coraltriangle/coraltrianglefacts, accessed January 2025.
H Ritchie, V Samborska and M Roser. Plastic pollution, Available at: https://ourworldindata.org/plastic-pollution, accessed January 2025.
Kementerian Lingkungan Hidup dan Kehutanan. Sistem Informasi Pengelolaan Sampah Nasional (SIPSN), Available at: https://sipsn.menlhk.go.id/, accessed January 2025.
K Zhang, AH Hamidian, A Tubić, Y Zhang, JKH Fang, C Wu and PKS Lam. Understanding plastic degradation and microplastic formation in the environment: A review. Environmental Pollution 2021; 274, 116554.
B Rani-Borges, E Gomes, G Maricato, LHF de Carvalho Lins, BR de Moraes, V Lima, LGF Côrtes, M Tavares, PHC Pereira, RA Ando and LG Queiroz. Unveiling the hidden threat of microplastics to coral reefs in remote South Atlantic islands. Science of The Total Environment 2023; 897, 165401.
SS Singh, R Chanda, NS Singh, Ramtharmawi, NR Devi, KV Devi, KK Upadhyay and SK Tripathi. Microplastic pollution: Exploring trophic transfer pathways and ecological impacts. Discover Environment 2024; 2(1), 103.
W Li, X Li, J Tong, W Xiong, Z Zhu, X Gao, S Li, M Jia, Z Yang and J Liang. Effects of environmental and anthropogenic factors on the distribution and abundance of microplastics in freshwater ecosystems. Science of The Total Environment 2023; 856(2), 159030.
R Rahmatsyah, R Juliani, S Syarifuddin, K Andini and RY Purba. Growth pattern and microplastic accumulation of Anadara spp. harvested from the eastern waters of North Sumatra Province, Indonesia. AACL Bioflux 2024; 17(5), 2139-2147.
R Rahmatsyah, S Syarifuddin, R Juliani, A F Azzahra, S Rahmeida and A S Batubara. Microplastic contamination of four important commercial fish in east coast of North Sumatera Province, Indonesia. The Philippine Journal of Fisheries 2024; 31(2), 321-330.
N Rafa, B Ahmed, F Zohora, J Bakya, S Ahmed, SF Ahmed, M Mofijur, AA Chowdhury and F Almomani. Microplastics as carriers of toxic pollutants: Source, transport, and toxicological effects. Environmental Pollution 2024; 343, 123190.
T Biswas, SC Pal, A Saha, D Ruidas, M Shit, ARMT Islam and G Malafaia. Microplastics in the coral ecosystems: A threat which needs more global attention. Ocean & Coastal Management 2024; 249, 107012.
S Jandang, MB Alfonso, H Nakano, N Phinchan, U Darumas, V Viyakarn, S Chavanich and A Isobe. Possible sink of missing ocean plastic: Accumulation patterns in reef-building corals in the Gulf of Thailand. Science of The Total Environment 2024; 954, 176210.
L Reuning, L Hildebrandt, DK Kersting and D Pröfrock. High levels of microplastics and microrubber pollution in a remote, protected Mediterranean Cladocora caespitosa coral bed. Marine Pollution Bulletin 2025; 217, 118070.
MO Soares, L Rizzo, ARX Neto, Y Barros, JE Filho, T Giarrizzo and EF Rabelo. Do coral reefs act as sinks for microplastics? Environmental Pollution 2023; 337, 122509.
V Tirpitz, M Hutter, H Hutter, J Prume, M Koch, T Wilke and J Reichert. Increasing microplastic concentrations have nonlinear impacts on the physiology of reef-building corals. Science of The Total Environment 2025; 960, 178318.
S Jandang, MB Alfonso, H Nakano, N Phinchan, U Darumas, V Viyakarn, S Chavanich and A Isobe. Possible sink of missing ocean plastic: Accumulation patterns in reef-building corals in the Gulf of Thailand. Science of The Total Environment 2024; 954, 176210.
L Reuning, L Hildebrandt, DK Kersting and D Pröfrock. High levels of microplastics and microrubber pollution in a remote, protected Mediterranean Cladocora caespitosa coral bed. Marine Pollution Bulletin 2025; 217, 118070.
KW Wilkins and RH Richmond. Unseen threats: Negative effects of microplastic leachate on coral planulae settlement. Frontiers in Marine Science 2025; 12, 1596594.
S Krishnakumar, S Anbalagan, SM Hussain, R Bharani, PS Godson and S Srinivasalu. Coral annual growth band impregnated microplastics (Porites sp.): A first investigation report. Wetlands Ecology and Management 2021; 29, 677-687.
Central Bureau of Statistics. Statistics Indonesia (BPD) publication portal, Available at: https://www.bps.go.id/publication/2025/, accessed January 2025.
BMKG. Pinang Sori Meteorological Station weather data report, Available at: https://www.bmkg.go.id/, accessed January 2025.
NP Jones and DS Gilliam. Temperature and local anthropogenic pressures limit stony coral assemblage viability in southeast Florida. Marine Pollution Bulletin 2024; 200, 116098.
MK Donovan, DE Burkepile, C Kratochwill, T Shlesinger, S Sully, TA Oliver, G Hodgson, J Freiwald and R van Woesik. Local conditions magnify coral loss after marine heatwaves. Science 2021; 372, 977-980.
J Cavailles, C Kuzmics and M Grube. Symbiont dynamics and coral regulation under changing temperatures. Coral Reefs 2025; 44, 1107-1126.
National Oceanic and Atmospheric Administration. NOAA Optimum Interpolation Sea Surface Temperature (OISST) version 2.1 daily data, Available at: https://psl.noaa.gov/data/gridded/data.noaa.oisst.v2.html, accessed January 2025.
CF Chen, YR Ju, MH Wang, YC Lim, CW Chen, YR Cheng and CD Dong. Microplastic pollution in stony coral skeletons and tissues: A case study of accumulation and interrelationship in South Penghu Marine National Park, Taiwan Strait. Journal of Hazardous Materials 2025; 484, 136761.
AS Wong, S Vrontos and ML Taylor. An assessment of people living by coral reefs over space and time. Global Change Biology 2022; 28, 7136-7153.
M Andrello, ES Darling, A Wenger, AF Suárez-Castro, S Gelfand and GN Ahmadia. A global map of human pressures on tropical coral reefs. Conservation Letters 2022; 15, 12858.
F Haque and C Fan. Fate of microplastics under the influence of climate change. iScience 2023; 26(9), 107649.
W Bian, Y Zeng, Y Li, G Na, J Mu, S Lv and M Liu. Microplastic pollution in tropical coral reef ecosystems from the coastal South China Sea and their impacts on corals in situ. Journal of Hazardous Materials 2024; 480, 135898.
C Hankins, D Lasseigne, SM Davis, K Edwards and JS Paul. Coral reef attributes associated with microplastic exposure. Coral Reefs 2025; 44, 193-207.
KMSN Abeysinghe, KPGKP Guruge, T Bandara and PBTP Kumara. Microplastic pollution status in the coral reef ecosystems on the Southern and Western coasts of Sri Lanka during the Southwest monsoon. Marine Pollution Bulletin 2024; 206, 116713.
Y Barros, MO Soares, AP Ayala, VS Neto, T Giarrizzo and RM Cavalcante. First evidence of microplastic contamination in the tissue and skeletons of the keystone reef-building coral Siderastrea stellata in coastal reefs. Discover Oceans 2025; 2, 20.
K Hansani, E Thilakarathne, JB Koongolla, W Gunathilaka, B Perera, W Weerasingha and K Egodauyana. Contamination of microplastics in tropical coral reef ecosystems of Sri Lanka. Marine Pollution Bulletin 2023; 194(A), 115299.
O Pantos. Microplastics: Impacts on corals and other reef organisms.Emerging Topics in Life Sciences 2022; 6(1), 81-93.
Z Zhou, L Wan, W Cai, J Tang, Z Wu and K Zhang. Species-specific microplastic enrichment characteristics of scleractinian corals from reef environment: Insights from an in-situ study at the Xisha Islands. Science of The Total Environment 2022; 815, 152845.
M Sutthacheep, C Chamchoy, W Suebpala, A Wongnutpranont, L Jungrak, W Aunkhongthong, S Pengsakun, W Klinthong, M Jowantha, L Sangsawang and T Yeemin. Assessment of microplastic pollution in corals, seawater, and marine sediments in the Gulf of Thailand. Frontiers in Marine Science 2025; 12, 1669901.
JB Axworthy, KS Lasdin and JL Padilla-Gamiño. Low incidence of microplastics in coral reefs of Kāne’ohe Bay, Hawai’i, USA. Marine Pollution Bulletin 2024; 208, 116996.
LP Yen, CLX Yong and PA Todd. The effect of coral colony morphology, coral surface condition, particle size, and seeding point on the trapping and deposition of microplastics. Science of The Total Environment 2024; 921, 171077.
KT Tahsin, N Sangmanee, C Chamchoy, S Phoaduang, T Yeemin and E Winijkul. Coral feeding behavior on microplastics. In: Microplastic occurrence, fate, impact, and remediation. Environmental Chemistry for a Sustainable World 2023; 73, 65-86.
V Isa, F Saliu, A Becchi, G Spadaccino, M Quinto, M Veronelli, M Lasagni, P Galli and S Lavorano. Impacts of microplastics on reef-building corals: Disentangling the contribution of the chain scission products released by weathering. Science of The Total Environment 2025; 975, 179239.
Y Aminot, C Lanctôt, V Bednarz, W J Robson, A Taylor, C Ferrier-Pagès, M Metian and I Tolosa. Leaching of flame-retardants from polystyrene debris: Bioaccumulation and potential effects on coral. Marine Pollution Bulletin 2020; 151, 110862.
S Veerasingam, M Ranjani, R Venkatachalapathy, A Bagaev, V Mukhanov and D Litvinyuk. Contributions of Fourier transform infrared spectroscopy in microplastic pollution research: A review. Environmental Science and Pollution Research 2021; 51(22), 2681-2743.
Y Chen, D Wen, J Pei, Y Fei, D Ouyang, H Zhang and Y Luo. Identification and quantification of microplastics using Fourier-transform infrared spectroscopy: Current status and future prospects. Current Opinion in Environmental Science & Health 2020; 18, 14-19.
J John, A R Nandhini, P V Chellam and M Sillanpää. Microplastics in mangroves and coral reef ecosystems: A review. Environmental Chemistry Letters 2022; 20, 397-416.
B Rani-Borges, E Gomes, G Maricato, LHF de Carvalho Lins, BR de Moraes, GV Lima, LGF Côrtes, M Tavares, PHC Pereira, RA Ando and LG Queiroz. Unveiling the hidden threat of microplastics to coral reefs in remote South Atlantic islands. Science of The Total Environment 2023; 891, 165401.
F Hierl, H C Wu and H Westphal. Scleractinian corals incorporate microplastic particles: Identification from a laboratory study. Environmental Science and Pollution Research 2021; 28, 37882-37893.
MN Rahman, SH Shozib, MY Akter, ARMT Islam, MS Islam, S Sohel, C Kamaraj, MRJ Rakib, AM Idris, A Sarker and G Malafaia. Microplastic as an invisible threat to the coral reefs: Sources, toxicity mechanisms, policy intervention, and the way forward. Journal of Hazardous Materials 2023; 454, 131522.
C Hankins, E Moso and D Lasseigne. Microplastics impair growth in two Atlantic scleractinian coral species, Pseudodiploria clivosa and Acropora cervicornis. Environmental Pollution 2021; 275, 116649.
M Rades, P Schubert, T Wilke and J Reichert. Reef-building corals do not develop adaptive mechanisms to better cope with microplastics. Frontiers in Marine Science 2022; 9, 863187.
E Corona, C Martin, R Marasco and CM Duarte. Passive and active removal of marine microplastics by a mushroom coral (Danafungia scruposa). Frontiers in Marine Science 2020; 7, 128.
J Patterson, KI Jeyasanta, RL Laju, AM Booth, N Sathish and JKP Edward. Microplastic in the coral reef environments of the Gulf of Mannar, India: Characteristics, distributions, sources and ecological risks. Environmental Pollution 2022; 298, 118848.
H Zhang, Y Nie, S Zhao, L Wu, X Xi, L Xu, Y Fang, X Long and X Liu. Distribution characteristics and transport pathways of soil microplastics in coral reef islands with different developmental stages and human activities. Marine Pollution Bulletin 2025; 215, 117848.
CKH Cheung and C Not. Impacts of extreme weather events on microplastic distribution in coastal environments. Science of The Total Environment 2023; 904, 166723.
MP Belioka and DS Achilias. The effect of weathering conditions in combination with natural phenomena/disasters on microplastics’ transport from aquatic environments to agricultural soils. Microplastics 2024; 3(3), 518-538.
C Li, X Wang, L Zhu, K Liu, C Zong, N Wei and D Li. Enhanced impacts evaluation of Typhoon Sinlaku (2020) on atmospheric microplastics in South China Sea during the East Asian summer monsoon. Science of The Total Environment 2022; 806(4), 150767.
L Piazzi, E Cecchi, MF Cinti and G Ceccherelli. Extreme events and conservation of subtidal habitats: Effects of a rainfall flood on coralligenous reefs. Marine Pollution Bulletin 2021; 165, 112106.
Y Yao and C Wang. Marine heatwaves and cold-spells in global coral reef zones. Progress in Oceanography 2022; 209, 102920.