Trends
Sci.
2026;
23(7):
11708
Dynamic Expression of E2F1 and eEF1A1 During Lipopolysaccharide-Induced Activation of Primary Hepatic Stellate Cells
Thanh Minh Dang1,4,#, Phuoc Phu Van1,4,#, Trinh Van Le1,4, Uyen Luu Thao Nguyen1,4,
Tu Nguyen Anh Le1,4, Nhan Ngo The Tran2,4, Long Thanh Le3 and Nhung Hai Truong1,4,*
1Laboratory of Regenerative Biomedicine, Faculty of Biology and Biotechnology, VNUHCM-University of Science,
Ho Chi Minh City 70000, Vietnam
2Stem Cell Institute, VNUHCM- University of Science, Ho Chi Minh City 70000, Vietnam
3Animal Biotechnology Department, Institute of Life Science, Vietnam Academy of Science and Technology,
Ho Chi Minh City 70000, Vietnam
4Viet Nam National University, Ho Chi Minh City 70000, Vietnam
(*Corresponding author’s e-mail: [email protected])
(#These authors contributed equally to this work)
Received: 27 August 2025, Revised: 8 October 2025, Accepted: 15 October 2025, Published: 10 February 2026
Abstract
Hepatic stellate cells (HSCs) are the principal mediators of liver fibrosis. Upon liver injury, they undergo activation marked by phenotypic transformation, proliferation, and extracellular matrix deposition. However, the gene regulatory networks driving this activation remain incompletely understood. This study investigates the expression of E2F1 and eEF1A1 - 2 genes involved in cell proliferation and protein synthesis - in HSCs activated by lipopolysaccharide (LPS), an inflammatory stimulant used to model liver injury. Primary HSCs were isolated from Swiss mice and cultured in vitro. Cells were treated with 0, 100 or 200 ng/mL LPS for 24 h and assessed up to 7 days. Morphological changes were assessed microscopically, lipid content was evaluated via Oil Red O staining, and expression of α-SMA, E2F1, and eEF1A1 was measured by immunocytochemistry and qRT-PCR. LPS induced dose- and time-dependent HSC activation, characterized by morphological changes, loss of lipid droplets, and increased α-SMA expression. E2F1 expression increased progressively, peaking at Day 3 and remaining elevated through Day 7. eEF1A1 expression showed a biphasic pattern, with upregulation at Day 3 followed by a reduction at Day 7. Notably, 200 ng/mL LPS yielded the most pronounced gene expression changes. E2F1 and eEF1A1 are dynamically regulated during LPS-induced HSC activation, indicating their potential roles in fibrogenic processes. These findings offer new insights into the transcriptional and translational control of HSC biology and suggest novel targets for antifibrotic therapies.
Keywords: Antifibrosis, Activation, E2F1, eEF1A1, HSCs, Liver fibrosis, LPS
Introduction
Liver diseases, particularly fibrosis and cirrhosis, constitue a significant global health burden, accounting for over 1.4 million death in 2019 and a number that is projected to continue rising over the next 2 decades [1]. Cirrhosis and chronic liver diseases rank among the top 10 causes of death in several regions (e.g. Africa, Southeast Asia) in 2023 [2]. Understanding the molecular mechanisms driving the progression of these
conditions is crucial for developing effective therapeutic strategies.
Hepatic stellate cells (HSCs) play a central role in liver fibrosis, serving as the predominant source of hepatic myofibroblast, as evidenced by extensive cell-fate mapping studies [3]. In their quiescent state, HSCs reside in the space of Disse, serving as the principal storage site for vitamin A and exhibiting low fibrogenic activity, with a cytoskeleton enriched in desmin and other neural markers such as glial fibrillary acidic protein (GFAP) [4-6]. Upon activation, HSCs lose their lipid droplets, proliferate, and transform into myofibroblast-like cells. This transformation is marked by increased cell proliferation, elevated expression of α-smooth muscle actin (α-SMA), type I collagen, and heightened production of extracellular matrix (ECM) protein - all contributing to liver fibrosis [7].
While the involvement of HSCs in liver fibrosis is well-documented, the specific genes and signaling pathways regulating their activation remain incompletely understood. The transcription factor E2F1, a member of the E2F family, plays a crucial role in cell cycle regulation, particularly during the transition from the G1 to S phase and functions primarily as transcriptional activator influencing various biological activities [8].
The eEF1A1 gene encodes the eukaryotic translation elongation factor 1 alpha 1, which is essential for protein synthesis in eukaryotic cells. It facilitates the delivery of aminoacyl-tRNAs to the ribosome during elongation, ensuring accurate and efficient protein production [9, 10]. Recent studies have confirmed the roles of E2F1 and eEF1A1 in the regulating cell proliferation in hepatocellular carcinoma (HCC), a process is closely linked to HSC activation [11].
However, the precise roles of E2F1 and eEF1A1 in HSC activation and liver fibrosis remain unclear. Investigating the expression patterns and functional contributions of these genes during HSC activation is essential for uncovering potential therapeutic targets. This study addresses this critical need by examining the expression of E2F1 and eEF1A1 in HSCs activated by lipopolysaccharide (LPS), a model that mimics the inflammatory conditions associated with liver injury. The findings of this study will provide valuable insights into the molecular mechanisms underlying HSC activation and may pave the way for the development of novel therapies for liver fibrosis.
Materials and methods
Animals
Swiss albino mice aged 8 to 16 weeks, weighing 25 - 35 g, were used. All procedures complied with the guidelines of the U.S. National Institutes of Health (NIH) and were approved by the Animal Ethics Committee of the Stem Cell Institute, VNUHCM-University of Science, Vietnam (Ref. No. 230105/SCI-AEC).
Isolation of Hepatic Stellate Cells (HSCs)
In this study, HSCs were isolated based on a protocol published in 2015 [12], with some modifications as previously described [13]. In brief, following deep anesthesia by intramuscular injections of 20 mg/kg of Ilium xylazil-20 (Troy Laboratories, Australia) and 14 mg/kg of Zoletil (Virbac, France) and surgical exposure of the liver, perfusion was performed using pronase (Merck, Germany) and collagenase (Roche Diagnostics, Germany). The isolation procedure included 3 main steps: (A) In situ perfusion: The liver was perfused with enzymatic solutions (pronase and collagenase) to begin tissue dissociation. (B) In vitro digestion: The excised liver was further digested enzymatically using pronase, collagenase, and DNase I (Roche, Switzerland). (C) Density gradient centrifugation: Cells were separated using OptiPrep (Sigma-Aldrich, Germany) at a final concentration of 9.6% and centrifugation at 1,400×g for 20 min. A distinct white layer containing enriched HSCs was collected.
Cell culture
Isolated HSCs was cultured at 37 °C, 5% CO2 in DMEM (Thermo Fisher Scientific, USA) containning 15% FBS (Thermo Fisher Scientific, USA), 1X antibiotic (Thermo Fisher Scientific, USA). After 36 h, HSCs adhered to the surface and were treated with LPS for 24 h, following these experimental groups:
Control group: Culture medium (DMEM + 10% FBS + 1X antibiotic)
LPS 100 ng/mL group: Culture medium containing LPS (Thermo Fisher Scientific, USA) at 100 ng/mL.
LPS 200 ng/mL group: Culture medium containing LPS at 200 ng/mL.
Oil Red O stainning for lipid droplet evaluation
The lipid droplet content was assessed using Oil Red O staining (Sigma-Aldrich, Germany). Cells were fixed with 1% paraformaldehyde for 15 min, stained with Oil Red O (diluted 3:2 with distilled water, filtered) for 20 min at room temperature. After washing with PBS, the stained area was imaged and quantified using ImageJ software (National Institutes of Health, USA).
Immunocytochemistry (ICC)
ICC was used for semi-quantitative analysis of protein expression in culture. After fixation and PBS washes, cells were permeabilized with 0.5% Triton X100 for 10 min and blocked with PBS containing 4% goat serum and 1% BSA for 30 min at room temperature. Cells were then incubated overnight at 4 °C with the primary antibodies: Desmin (1:300, ab8592, Abcam, USA), α-SMA (1:300, ab5694, Abcam, USA), E2F1 (1:500, MA5-32476, Thermo Fisher Scientific, USA), and eEF1A1 (1:500, ab157455, Abcam, USA). After washing, the secondary antibody (1:500, ab150077, Abcam, USA) was applied for 1 h. Nuclei were counterstained with DAPI (10-minute incubation), and samples were then stored in PBS and imaged with ECLIPSE Ti2 fluorescent microscope (Nikon, Japan). The CTCF quantification was performed using Image J software (NIH, USA).
Cell proliferation assay CCK8
Cell viability was evaluated using the Cell Counting Kit-8 (CCK-8) (Abcam, USA). HSCs were cultured in 96-well plates. After PBS washes, 100 µL of CCK-8 solution (1:10 diluted in culture medium) was added and left for 1 h in an incubator. Absorbance at 450 nm was measured using Epoch microplate reader (Agilent BioTek, USA). Wells without cells were included as blanks. The number of cells was calculated using an established standard curve.
Gene expression analysis
HSCs were harvested and snap-frozen using liquid nitrogen. RNA was extracted using the ISOLATE II RNA Mini Kit (Meridian Bioscience, UK) following the manufacturer’s instructions. Briefly, lysed samples were applied to a silica spin column, treated with DNase I to remove genomic DNA, washed, and eluted in RNase-free water. RNA concentration and purity were measured using a Nanodrop spectrophotometer (Thermo Fisher Scientific, USA). For cDNA synthesis, 1,500 ng of RNA was reverse transcribed using the SensiFAST cDNA Synthesis Kit (Meridian Bioscience, UK). Quantitative PCR was performed for 40 cycles using the SensiFAST SYBR Hi-ROX Kit (Meridian Bioscience, UK) on the Light Cycler 480 (Roche, Switzerland). Relative gene expression levels were calculated using the 2⁻ΔΔCt (Livak) method. Primer sequences are listed in the Table 1.
Table 1 Primers used in qRT-PCR.
Gene |
Forward primer (5’-3’) |
Reverse primer (5’-3’) |
Product size (bp) |
Gene ID |
Gapdh |
AAGTTGTCATGGATGACC |
TCACCATCTTCCAGGAGC |
283 |
NM_001411845.1 |
E2F1 |
GCTGCAACTGCTTTCGGAG |
GATGTCTCCTGGCATGAGGTC |
261 |
NM_007891.5 |
eEF1A1 |
AATGGTGACAACATGCTGGA |
ACGAGTTGGTGGCAGGATAC |
132 |
NM_010106.2 |
α-SMA |
GCATCCACGAAACCACCTA |
CACGAGTAACAAATCAAAGC |
418 |
NM_007392.3 |
Gapdh: Glyceraldehyde 3-phosphate dehydrogenase; E2F1: E2F Transcription Factor 1; eEF1A1: Eukaryotic Translation Elongation Factor 1 Alpha 1; α-SMA: α-smooth muscle actin.
Statistical analysis
All data were shown as mean ± standard error of the mean (SEM). Statistical analysis was performed using GraphPad Prism software. One-way analysis (ANOVA) or Student’s t-test is used for comparing groups (p-value < 0.05 was considered statistically different), depending on the number of groups.
Results and discussion
Characterization of primary HSCs
After 36 h of culture (Day 0), HSC displayed a characteristic star-like morphology, with long, thin cytoplasmic extensions radiating from the cell center (Figure 1(A)). Red-stained lipid droplets are visible in the cytoplasm, confirming intracellular lipid storage - a hallmark of quiescent HSCs (Figure 1(B)). Desmin staining, used to specifically identify HSC [4], reveal a high percentage of desmin-positive cells, although the intensity varied among individual cells (Figure 1(C)). These results are consistent with previous studies that describe HSC identity and morphology during early culture stages [13].
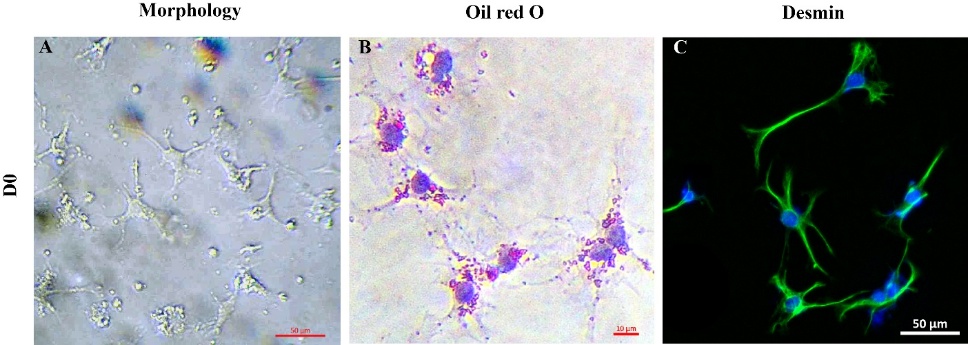
Figure 1 Identification of HSCs isolated from mouse liver after 36 h of culture: (A) Cell morphology, (B) lipid droplet content (Oil Red O), and (C) Desmin expression; ICC staining: Blue = DAPI-stained nuclei, Green = Alexa Fluor 488- stained Desmin.
Effects of LPS on HSC morphology
HSC morphology was distinctly altered in response to LPS treatment. At lower concentrations (0 and 100 ng/mL), HSCs exhibited moderate activation by Day 3, characterized by elongated and branched morphology (Figures 2(D) and 2(E)). At 200 ng/mL, more extensive spreading and elongation were observed (Figure 2(F)). By Day 7, cells treated with 200 ng/mL LPS exhibited spindle-like shapes, myofibroblast-like morphology indicative of full activation (Figure 2(I)). HSCs treated with 100 ng/ml LPS showed limited morphological changes compared to the control (Figures 2(G) - 2(H)), indicating a dose- and time-dependent effect of LPS on HSC activation.
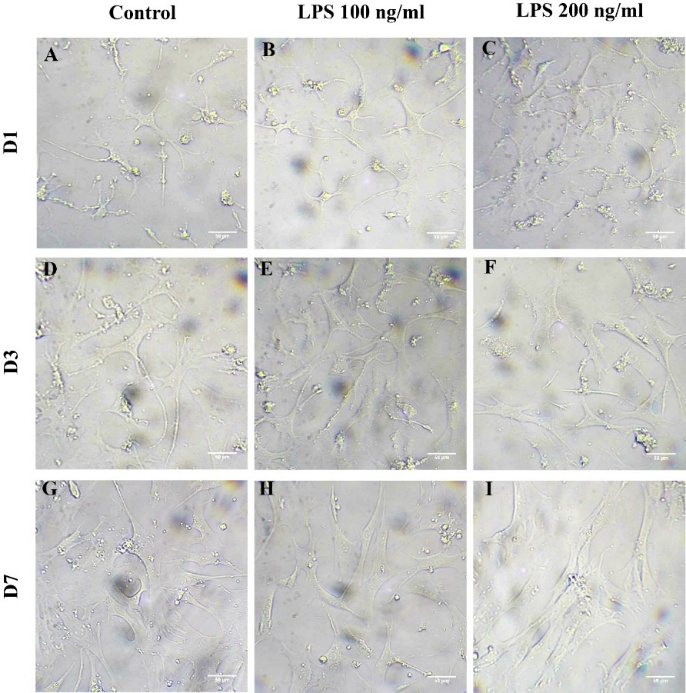
Figure 2 Morphology of HSCs after LPS treatment for 1, 3 and 7 days. Panels show representative morphology on Day 1 (A) - (C), Day 3 (D) - (F), and Day 7 (G) - (I).
Effects of LPS on lipid droplet content in HSCs
HSC activation is associated with the progressive loss of lipid droplets. Overall, Oil Red O staining showed lipid content decreased over the culture period with increasing LPS concentrations (Figure 3). Notably, a significant reduction was observed in the 200 ng/mL LPS group on Day 3 (2.17 ± 1.14%, p < 0.05) and Day 7 (0.63 ± 0.07%, p < 0.05) compared to the control group.
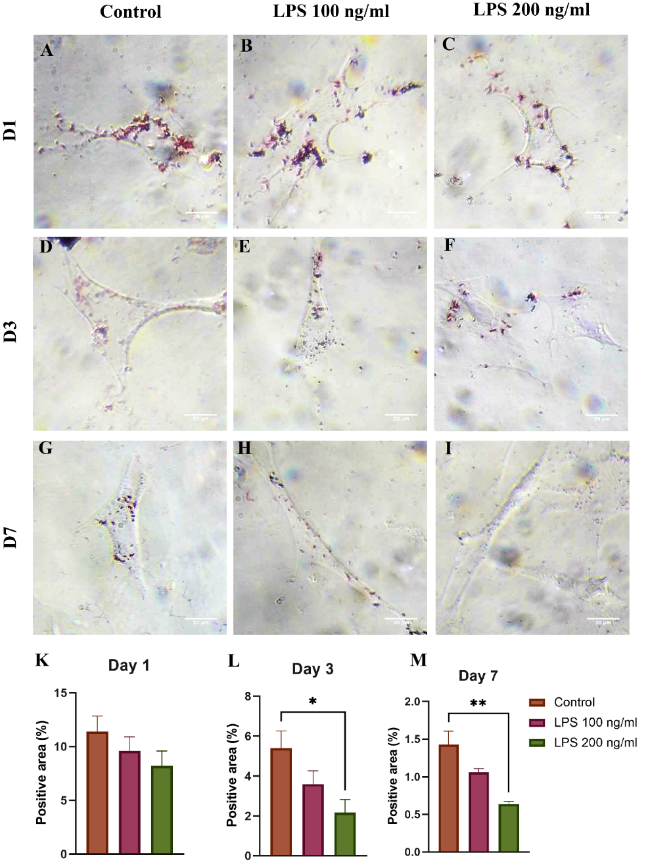
Figure 3 Oil Red O staining of lipid droplets in HSCs treated with 0, 100, and 200 ng/mL LPS on (A) - (C) day 1, (D) - (F) day 3, and (G) - (I) day 7; (K) - (M) Quantitative analysis of lipid area per cell; *p < 0.05, **p < 0.01, n = 3.
Effect off LPS on the proliferation of HSCs in culture
CCK-8 assays showed the highest proliferation rate in HSCs treated with LPS at 200 ng/mL at all time points (Figure 4). However, no significant difference was observed between the groups. This differs from a previous study by Trinh et al. [14] which reported differences using a longer (4 h) incubation period in the assay.
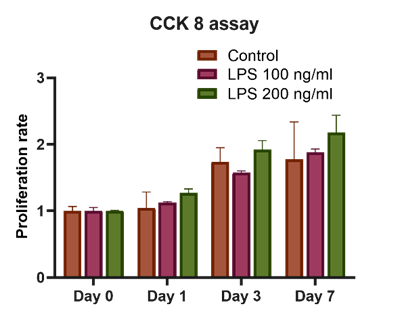
Figure 4 Cell proliferation evaluation using CCK-8 for control, 100 and 200 ng/mL LPS -treated HSCs; n = 3.
Effect of LPS on α-SMA gene expression in HSCs
The increased expression of α-SMA, a gold standard marker for primary HSC activation, was observed [14]. Our results reveal that LPS treatment significantly increased α-SMA mRNA expression in samples treated with LPS. On day 3, α-SMA mRNA levels were 1.732 ± 0.44-fold higher in 100 ng/mL group and 3.682 ± 1.40-fold higher in the 200 ng/mL LPS group compared to control (p < 0.05, Figure 5(K)).
ICC confirmed the expression of these genes at the protein level. On Days 3 and 7, α-SMA fluorescence was notably stronger in 200 ng/mL group (Figures 5(D) - 5(I)), with Day 7 showing a 2.49 ± 0.63-fold increase in corrected total cell fluorescence (CTCF) (Figures 5(M) and 5(N)), indicating sustained activation.
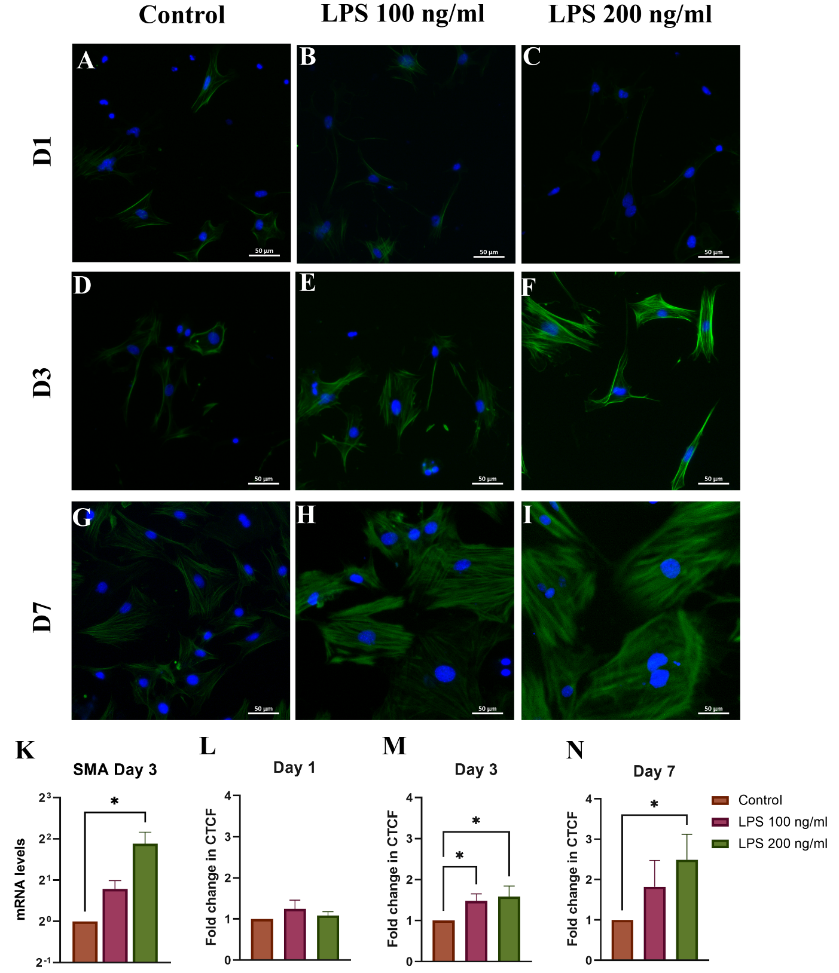
Figure 5 ICC analysis of α-SMA expression in HSCs on (A) - (C) Day 1, (D) - (F)Day 3, and (G) - (I) Day 7. (K) α-SMA mRNA on Day 3 was evaluated by quantitative reverse transcription PCR (qRT-PCR), (L-N) CTCF quatifications. ICC staining: Blue = DAPI-stained nuclei, Green = Alexa Fluor 488- stained α-SMA. *p < 0.05, n = 3.
Evaluate the expression of E2F1 and eEF1A1 in LPS-Activated HSCs
ICC showed increased E2F1 expression in LPS-treated groups at all time points. On Day 7, a significant increase in CTCF was observed in the 200 ng/mL group (1.65 ± 0.15-fold, p < 0.05) compared to the control. qRT-PCR confirmed these findings with an increase in E2F1 mRNA (5.30 ± 1.92-fold, p < 0.05) on Day 3 in the same group (Figure 6(K)).
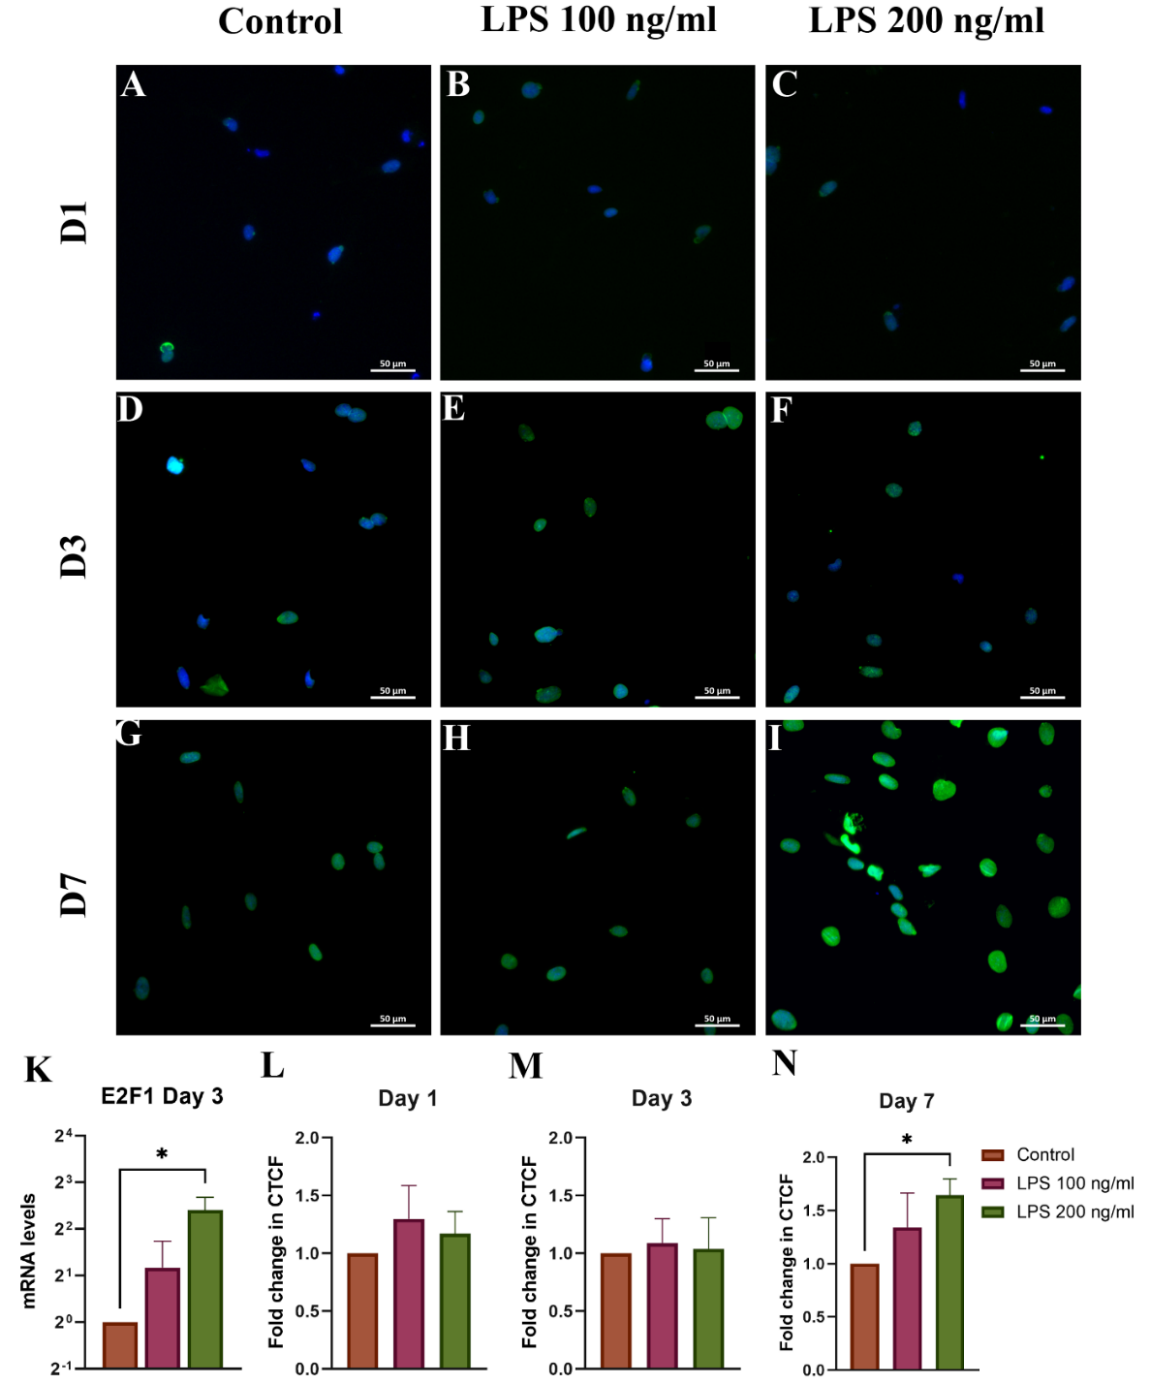
Figure 6 ICC analysis of E2F1 expression in HSCs on (A) - (C) day 1, (D) - (F) day 3, and (G) - (I) day 7; (K) E2F1 mRNA on Day 3;(L-N) CTCF quantifications. ICC staining: Blue = DAPI-stained nuclei, Green = Alexa Fluor 488- stained E2F1; *p < 0.05, n = 3.
Protein expression of eEF1A1 remained unchanged on Day 1. On Day 3, it significantly increased in both LPS-treated groups, peaking at 1.42 ± 0.26-fold in the 200 ng/mL group. Interestingly, expression declined by Day 7, with the 200 ng/mL group showing a 0.59 ± 0.11-fold reduction (Figures 7(L) - 7(N)). mRNA analysis on Day 3 revealed an increase in 200 ng/mL LPS treated group (4.73 ± 2.43-fold, p < 0.05) (Figure 7(K)), suggesting dynamic and biphasic transcriptional regulation.
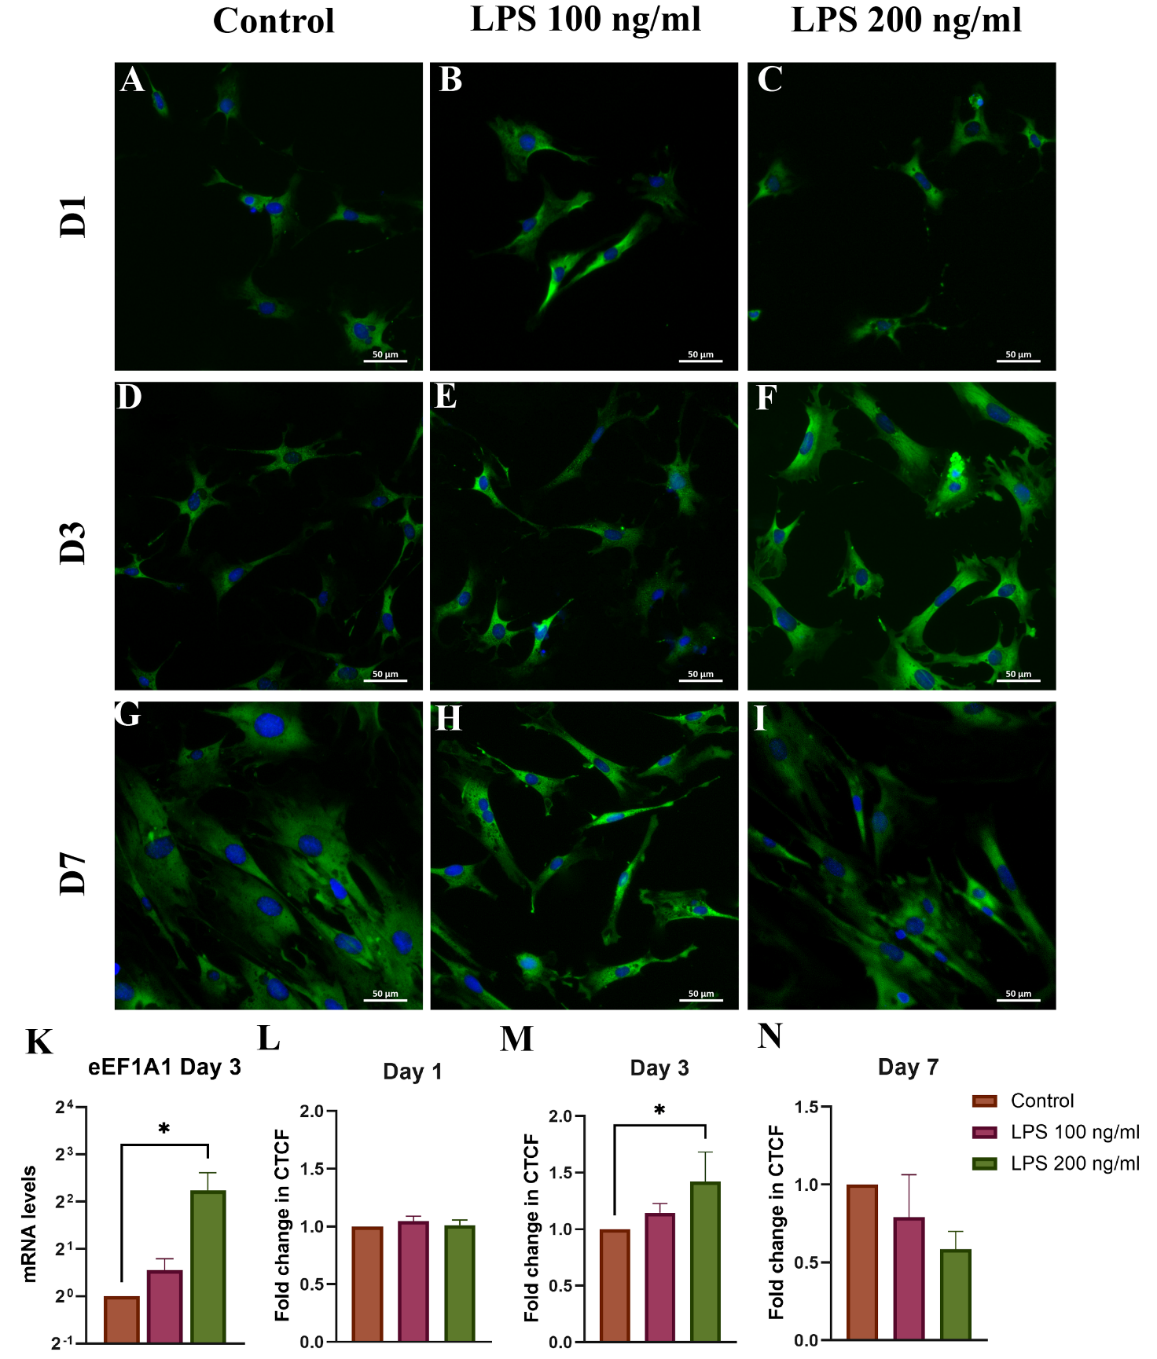
Figure 7 ICC analysis of eEF1A1 expression in HSCs on (A) - (C) day 1, (D) - (F) day 3, and (G) - (I) day 7; (K) eEF1A1 mRNA on Day 3; (L-N) CTCF quantifications. ICC staining: Blue = DAPI-stained nuclei, Green = Alexa Fluor 488- stained eEF1A1; *p < 0.05, n = 3.
Discussion
This study investigated the expression of E2F1 and eEF1A1, 2 genes associated with cell proliferation and translational regulation, in hepatic stellate cells (HSCs) activated by lipopolysaccharide (LPS). Using a combination of morphological assessment, lipid staining, immunocytochemistry, and quantitative gene expression analysis, we demonstrated that LPS induces a dose- and time-dependent activation of HSCs, accompanied by dynamic regulation of E2F1 and eEF1A1 expressions.
Consistent with prior studies [15-18], quiescent HSCs displayed star-shaped morphology with abundant lipid droplets and strong desmin expression. Following LPS exposure, morphological changes characteristic of myofibroblastic transformation - including cytoplasmic spreading, loss of lipid droplets, and increased α-SMA expression - became evident, particularly in the 200 ng/mL group by Day 7, affirming LPS as an effective stimulator of HSC activation. While LPS is not a traditional fibrogenic drug, its ability to simulate inflammatory liver injury makes it useful for in vitro investigations on HSC activation. Our findings demonstrate that LPS causes considerable morphological and molecular alterations in HSCs, especially at 200 ng/mL, which we propose as the ideal dose for further mechanistic studies.
E2F1 expression was significantly upregulated in a concentration-dependent manner following LPS treatment. While slight increases were observed as early as Day 1, maximal mRNA expression occurred on Day 3, and protein levels remained elevated through Day 7. Given that E2F1 is a canonical transcription factor governing the G1 to S phase transition, promoting DNA replication and cell cycle progression [19], our data suggest that this upregulation may drive HSC proliferation during the activation process. Previous studies have linked E2F1 to oncogenesis in hepatocellular carcinoma (HCC) [20,21], but its involvement in HSC biology has remained underexplored. Prior research has established that E2F1 regulates fibrotic progression through the Egr-1 / SHP / EID1 network in cholestatic conditions [22]. More recent evidence indicates that TGF-β signaling cooperates with E2F1 to enhance HSC activation and the transcription of profibrogenic genes [23]. Taken together, these reports support our findings, implicating E2F1 may also function upstream of transcriptional programs supporting fibrogenic activation and cellular expansion in HSCs.
The expression pattern of eEF1A1 was notably biphasic. Protein and mRNA levels peaked on Day 3 in the 200 ng/mL LPS group and declined by Day 7. This pattern may reflect a transient upregulation of translational machinery to support early phases of activation, followed by a regulatory attenuation as cells reach a more stable activated state. eEF1A1 is a multifunctional translation elongation factor traditionally associated with peptide chain elongation, but it also contributes to protein synthesis modulation, cytoskeletal organization, and cellular stress responses [24,25]. The early upregulation of eEF1A1 in our study likely enhances translational efficiency as HSCs transition from a quiescent to an activated state. Its transient upregulation may drive morphological changes and α-SMA induction necessary for the acquisition of a contractile phenotype, while concurrently supporting collagen biosynthesis. In contrast, the subsequent downregulation of eEF1A1 by Day 7 could be associated with translational stress, metabolic feedback, or compensatory regulation by other elongation factors. When compared with E2F1, which displayed sustained upregulation, the contrasting temporal dynamics of E2F1 and eEF1A1 suggest distinct but potentially complementary roles in HSC activation: E2F1 sustaining proliferative signaling, and eEF1A1 transiently enhancing biosynthetic capacity. Together, these findings underscore the coordinated interplay between transcriptional and translational control mechanisms that drive the progressive activation of HSCs.
While this study successfully links E2F1 and eEF1A1 to LPS-induced HSC activation, some caveats should be discussed. First, the direct downstream targets of E2F1 and eEF1A1 were not studied. Second, loss-of-function studies (such as siRNA-mediated knockdown) are required to identify causative roles in fibrogenesis. Third, applying these findings to in vivo fibrosis models will be critical for determining their physiological relevance and therapeutic potential.
Conclusions
This study demonstrates that E2F1 and eEF1A1 are significantly upregulated in activated hepatic stellate cells (HSCs) upon stimulation with lipopolysaccharide (LPS). Both genes exhibited peak expressions at Day 3 post-treatment, especially at the 200 ng/mL LPS concentration. While E2F1 protein levels remained elevated through Day 7, eEF1A1 declined, suggesting a transient regulatory role in early activation phases. These findings indicate that 200 ng/mL LPS is an effective concentration for studying HSC activation in vitro and that E2F1 and eEF1A1 may serve as molecular indicators or potential targets for antifibrotic therapy. Future research should explore the mechanistic pathways linking these genes to HSC activation and liver fibrosis progression.
Acknowledgements
This research is funded by the Vietnam Ministry of Science and Technology (grant number NĐT/IT/22/19). Dang Minh Thanh was funded by the Master, Ph. D. Scholarship Programme of Vingroup Innovation Foundation (VINIF), code VINIF.2023.TS.112.
Declaration of Generative AI in Scientific Writing
The authors acknowledge the use of generative AI tools (e.g., Grammarly and ChatGPT by OpenAI) in the preparation of this manuscript, specifically for language editing and grammar correction. No content generation or data interpretation was performed by AI. The authors take full responsibility for the content and conclusions of this work.
CRediT author statement
Thanh Minh Dang: Methodology; Investigation; Writing - Original Draft. Phuoc Phu Van: Investigation; Writing - Original Draft. Trinh Van Le: Conceptualization; Supervision; Writing - Review & Editing. Uyen Luu Thao Nguyen: Formal analysis; Resources; Visualization. Tu Nguyen Anh Le: Formal analysis; Visualization. Nhan Ngo The Tran: Formal analysis; Visualization. Long Thanh Le: Supervision; Validation; Formal analysis; Visualization. Nhung Hai Truong: Conceptualization; Funding acquisition; Project administration; Writing - Review & Editing.
References
Y Wang, M Wang, C Liu, M Hao, W Wang and Y Li. Global burden of liver cirrhosis 1990 - 2019 and 20 years forecast: Results from the global burden of disease study 2019. Annals of Medicine 2024; 56(1), 2328521.
EKJ Tham, DJH Tan, P Danpanichkul, CH Ng, N Syn and B Koh. The global burden of cirrhosis and other chronic liver diseases in 2021. Liver International 2025; 45(3), e70001.
HHY Kim, S Sakane, A Eguileor, RCG Weber, W Lee, X Liu, K Lam, K Ishizuka, SB Rosenthal, K Diggle, DA Brenner and T Kisseleva. The origin and fate of liver myofibroblasts. Cellular and Molecular Gastroenterology and Hepatology 2024; 17(1), 93-106.
DR Kamm and KS McCommis. Hepatic stellate cells in physiology and pathology. The Journal of Physiology 2022; 600(8), 1825-1837.
RM Wahid, NH Hassan, W Samy, AA Abdelhadi, SF Saadawy and SF Elsayed. Unraveling the hepatic stellate cells mediated mechanisms in aging’s influence on liver fibrosis. Scientific Reports 2024; 14(1), 13473.
HY Kim, SB Rosenthal, X Liu, C Miciano, X Hou and M Miller. Multi-modal analysis of human hepatic stellate cells identifies novel therapeutic targets for metabolic dysfunction-associated steatotic liver disease. Journal of Hepatolog 2025; 82(5), 882-897.
T Tsuchida and SL Friedman. Mechanisms of hepatic stellate cell activation. Nature Reviews Gastroenterology & Hepatology 2017; 14(7), 397-411.
Z Fang, M Lin, S Chen, H Liu, M Zhu, Y Hu, S Han, Y Wang, L Sun, F Zhu, C Xu and C Gong. E2F1 promotes cell cycle progression by stabilizing spindle fiber in colorectal cancer cells. Cellular & Molecular Biology Letters 2022; 27(1), 90.
A Mills and F Gago. On the need to tell apart fraternal twins eEF1A1 and eEF1A2, and their respective outfits. International Journal of Molecular Sciences 2021; 22(13), 6973.
RB Wilson, AM Kozlov, HH Tehrani, JS Twumasi-Ankrah, YJ Chen and MJ Borrelli. Elongation factor 1A1 regulates metabolic substrate preference in mammalian cells. Journal of Biological Chemistry 2024; 300(3), 105684.
R Farra, B Scaggiante, C Guerra, G Pozzato, M Grassi and F Zanconati. Dissecting the role of the elongation factor 1A isoforms in hepatocellular carcinoma cells by liposome-mediated delivery of siRNAs. International Journal of Pharmaceutics 2017; 525(2), 367-376.
I Mederacke, DH Dapito, S Affo, H Uchinami and RF Schwabe. High-yield and high-purity isolation of hepatic stellate cells from normal and fibrotic mouse livers. Nature Protocols 2015; 10(2), 305-315.
TM Dang, TV Le, HQ Do, VT Nguyen, AXL Holterman and LTT Dang. Optimization of the isolation procedure and culturing conditions for hepatic stellate cells obtained from mouse. Bioscience Reports 2021; 41(1), BSR20202514.
T Le Van, N Ho, T Dang Minh, and T Nhung. Chloroquine inhibiting the activation of primary hepatic stellate cells induced by lipopolysaccharide. Research Journal of Biotechnology 2023; 18(8), 54-61.
RV Modak and DM Zaiss. Isolation and culture of murine hepatic stellate cells. Bio-protocol 2019; 9(21), e3422-e3422.
D Knook, A Seffelaar and AJE De Leeuw. Fat-storing cells of the rat liver: Their isolation and purification. Experimental Cell Research 1982; 139(2), 468-471.
T Kisseleva, S Ganguly, R Murad, A Wang and DA Brenner. Regulation of hepatic stellate cell phenotypes in MASH. Gastroenterology 2025; 139(2), 468-471.
SK Meurer, S Weiskirchen, CG Tag and R Weiskirchen. Isolation, purification, and culture of primary murine hepatic stellate cells: An update. In: R Weiskirchen and SL Friedman (Eds.). Hepatic stellate cells: Methods and protocols. Humana, New York, 2023.
D Wang, B Wan, X Zhang, P Sun, S Lu and C Liu. Nuclear respiratory factor 1 promotes the growth of liver hepatocellular carcinoma cells via E2F1 transcriptional activation. BMC Gastroenterology 2022; 22(1), 198.
Y Yu, D Zhao, K Li, Y Cai, P Xu, R Li, J Li, X Chen, P Chen and G Cui. E2F1 mediated DDX11 transcriptional activation promotes hepatocellular carcinoma progression through PI3K/AKT/mTOR pathway. Cell Death & Disease 2020; 11(4), 1-16.
R Han, X Chen, Y Li, S Zhang, R Li and L Lu. MicroRNA-34a suppresses aggressiveness of hepatocellular carcinoma by modulating E2F1, E2F3, and Caspase-3. Cancer Management and Research 2019; 11, 2963.
Y Zhang, N Xu, J Xu, B Kong, B Copple and GL Guo. E2F1 is a novel fibrogenic gene that regulates cholestatic liver fibrosis through the Egr‐1/SHP/EID1 network. Hepatology 2014; 60(3), 919-930.
J Zhang, Y Zhao, G Pulivendala, Q Zhang, L Rui and J Gao. The non‐canonical ChREBPα activity suppresses the activation of hepatic stellate cells and liver fibrosis by antagonizing TGF‐β‐E2F1 axis. Advanced Science 2025; 12(29), e15032.
D Romaus-Sanjurjo, JM Saikia, HJ Kim, KM Tsai, GQ Le and B Zheng. Overexpressing eukaryotic elongation factor 1 alpha (eEF1A) proteins to promote corticospinal axon repair after injury. Cell Death Discovery 2022; 8(1), 390.
B Negrutskii and A El’Skaya. Eukaryotic translation elongation factor 1α: Structure, expression, functions, and possible role in aminoacyl-tRNA channeling. Progress in Nucleic Acid Research and Molecular Biology 1998; 60, 47-78.