Trends
Sci.
2026;
23(7):
12594
A Validated Ultrasound-Assisted UPLC-PDA-QDa Method for Safflower Flavonoid Glycosides: Box-Behnken Optimization and Drying-Induced Compositional Changes
Amirah Ulfah1, Muhammad Yusuf Hidayat1,2, Chusnul Hidayat1,
Widiastuti Setyaningsih1,3,* and Miguel Palma4
1Department of Food and Agricultural Product Technology, Faculty of Agricultural Technology,
Universitas Gadjah Mada, Yogyakarta 55281, Indonesia
2Department of Chemical Engineering, Politeknik Negeri Ujung Pandang, Makassar 90245, Indonesia
3Indonesia Natural Dye Institute (INDI), Grup Riset Interdisipliner Institut Pewarna Alami Indonesia,
Integrated Laboratory for Research and Testing, Universitas Gadjah Mada, Yogyakarta 55281, Indonesia
4Department of Analytical Chemistry, Faculty of Sciences, IVAGRO, University of Cadiz, Cadiz 11510, Spain
(*Corresponding author’s e-mail: [email protected])
Received: 11 November 2025, Revised: 16 December 2025, Accepted: 23 December 2025, Published: 1 March 2026
Abstract
Safflower (Carthamus tinctorius L.) is widely recognized for its therapeutic and nutritional value, primarily attributed to flavonoid glycosides with strong antioxidant activities. To establish a rapid, green, and reliable analytical approach, an ultrasound-assisted extraction (UAE) method coupled with UPLC-PDA-QDa-MS was developed, optimized, and validated. The extraction parameters, including solvent concentration, solid-to-liquid ratio, temperature, and time, were optimized using Box-Behnken design, yielding the best extraction efficiency at 50% methanol, 0.3:20 (g mL⁻¹), 30 °C, and 15 min. The method demonstrated good linearity (R² = 0.9927), satisfactory precision (CV < 11%), and accuracy (recoveries 90% - 100%), with limits of detection and quantification of 2.967 and 8.992 ppm, respectively, meeting ICH Q2 criteria. Five major flavonoid glycosides and two HSYA-derived compounds were identified, and the flavonoid glycosides were determined on a semi-quantitative basis as HSYA equivalents. Application of the validated method to safflower samples subjected to different drying treatments revealed significant compositional variations, where freeze-drying best preserved hydroxysafflor yellow A (HSYA), while hot-air drying favored other glycosides. The method provides a robust analytical tool for comparative profiling and quality control of safflower-derived products and supports green extraction and validation strategies in functional food and phytopharmaceutical research.
Keywords: Antioxidants, Carthamus tinctorius, Edible flower, Hydroxysafflor yellow A, Method development, Rapid method, Ultrasound-assisted extraction
Introduction
Carthamus tinctorius L., commonly known as safflower, is an annual herbaceous plant belonging to the family Compositae (Asteraceae) [1]. Its flowers and seeds are valued for diverse applications in the food, cosmetic, and pharmaceutical industries [2]. In Indonesia, particularly in South Sulawesi, safflower—locally referred to as Kasumba Turate—has long been used in traditional herbal remedies to alleviate ailments
such as measles, while its dried flowers are consumed as herbal tea to strengthen the immune system [3]. The ethnopharmacological significance of safflower extends globally, with its medicinal uses reported in China [4], Japan [5], Turkey [6], and other regions, highlighting its universal therapeutic relevance.
Phytochemical investigations have revealed that more than 100 compounds have been isolated from safflower, including flavonoids, quinones, and other phenolic constituents [7]. Among these, flavonoids and their O- and C-glycosides represent a predominant class of bioactive compounds [8]. Quinochalcone C-glycosides represent a unique subclass of flavonoids that are structurally characterized by a quinone-like chalcone backbone covalently linked to sugar moieties through a carbon-carbon (C-glycosidic) bond, rather than the more common oxygen-carbon (O-glycosidic) linkage. This structural feature confers greater chemical stability against hydrolysis and enhances the water solubility of these compounds. Such quinochalcone C-glycosides are considered the hallmark constituents of safflower, as they have rarely been identified in other plant species. Their characteristic extended conjugation system gives rise to strong absorption bands around 400 - 410 nm, which account for the distinct yellow-orange coloration of safflower petals. In addition to their chromophoric properties, these compounds—such as hydroxysafflor yellow A, safflor yellow B, and related derivatives.
Beyond their pigmenting role, these metabolites exhibit remarkable pharmacological properties to treat cardiovascular and cerebrovascular diseases [9,10]. Moreover, flavonoid glycosides are particularly important due to their diverse biological activities, including antioxidant [7], anti-inflammatory [11], anti-thrombotic [12], anti-cancer [13], as well as promising anti-diabetic and anti-obesity potential [14]. Consequently, accurate determination of individual flavonoid glycosides is essential to support the standardization and quality assurance of safflower-based products.
The efficiency and reliability of bioactive compound analysis, however, largely depend on the extraction technique employed. Several studies have reported procedures for extracting bioactive compounds from the safflower matrix using conventional methods. Chen et al. [11] conducted extraction by soaking in 60% ethanol to identify 16 flavonoid compounds in safflower. Meanwhile, Permana et al. [15] used percolation with three different solvents at room temperature. A water-based extraction procedure to characterize the main quinochalcone compounds in safflower during blooming period was proposed by Yan et al. [7]. These conventional methods present several drawbacks, as they are often constrained by long processing times, extensive solvent consumption, and sometimes high operational temperatures. Such limitations not only raise environmental and economic concerns but also increase the risk of thermal degradation of thermolabile compounds, leading to inconsistent yields and compromised analytical reproducibility [16]. To overcome these drawbacks, environmentally friendly technologies have gained increasing attention, with ultrasound-assisted extraction (UAE) emerging as one of the most promising green alternatives.
UAE operates at lower temperatures while improving mass transfer and solvent penetration through acoustic cavitation, which enhances cell wall disruption and facilitates the diffusion of target analytes. This approach allows rapid extraction with minimal solvent use and high reproducibility. UAE has been effectively applied to recover phenolics and anthocyanins from Clitoria ternatea [17,18], lutein from Tagetes erecta [19], flavonoids from Carthamus tinctorius L. [20], L-tryptophan from chamomile flower [21], and phenolic compounds from other edible flowers [22]. Despite its advantages, optimization of UAE for safflower flavonoid glycosides remains limited, and studies employing ultrasonic probe systems (which generate stronger and more uniform cavitation than ultrasonic baths) are particularly scarce. Furthermore, several previous research has focused merely on extraction yield or total phenolic content, without method validation to ensure analytical reliability and transferability across laboratories [20,23,24].
From an analytical perspective, chromatographic methods applied to safflower extracts have frequently been used for qualitative profiling or semi-targeted analysis, with limited validation in accordance with internationally recognized guidelines such as ICH Q2 (R1). As a result, direct comparison among studies remains challenging, and the impact of post-harvest processing, particularly drying, on individual quinochalcone-type flavonoid glycosides has not been rigorously evaluated using validated analytical workflows. Drying conditions can significantly influence moisture removal rates, enzymatic activity, and oxidative stability, thereby altering both the composition and relative abundance of flavonoid glycosides in plant materials.
Taken together, there remains a clear research gap in the development of a green, systematically optimized, and analytically validated UAE-UPLC-based method for the reliable profiling of individual flavonoid glycosides in safflower, as well as in its application to evaluate drying-induced compositional changes. Addressing this gap is essential for establishing reproducible quality control strategies and for improving comparability across studies and processing conditions.
Accordingly, the present study aims to develop, optimize, and validate an ultrasound-assisted extraction method coupled with UPLC-PDA-QDa for the quantitative profiling of major flavonoid glycosides in safflower. A Box-Behnken design integrated with response surface methodology (RSM) was employed to determine the optimal combination of solvent composition, solid-to-liquid ratio, and extraction temperature. This approach enabled the identification of the most influential parameters and determination of the optimal extraction conditions [25,26]. The validated method was further applied to assess the influence of three drying techniques (freeze-, hot-air-, and shade-drying) on the individual glycoside profiles. This comprehensive approach establishes a reliable and environmentally sustainable analytical platform for quality control, ensuring the reproducibility of safflower-based functional food and phytopharmaceutical research.
Materials and methods
Chemicals and reagents
A standard compound of hydroxysafflor yellow A (HSYA, ≥ 95% purity) was procured from PhytoLab GmbH & Co. KG (Vestenbergsgreuth, Germany). A stock solution was prepared in 100% methanol, passed through a 0.22 µm nylon syringe filter (FilterLab, Barcelona, Spain) to ensure removal of particulate matter, and subsequently stored at –18 °C in the dark until analysis to prevent photodegradation.
High-performance liquid chromatography (HPLC)-grade solvents, including methanol, acetic acid, and acetonitrile, were supplied by PanReac AppliChem ITW Reagents (Barcelona, Spain). Ultrapure water was obtained from a Milli-Q purification system (Millipore, Billerica, MA, USA). Analytical-grade reagents, namely 2,2-diphenyl-1-picrylhydrazyl (DPPH) and Folin-Ciocalteu reagent, were purchased from Sigma-Aldrich Chemical Co. (St. Louis, MO, USA), whereas sodium carbonate was obtained from PanReac AppliChem ITW Reagents (Barcelona, Spain).
Plant material and drying treatments
Fresh safflower (Carthamus tinctorius L.) flowers, harvested in December 2024, were obtained from a local farmer in Bone, South Sulawesi, Indonesia. To evaluate the effect of post-harvest processing on analyte stability, the flowers were subjected to three distinct drying techniques: freeze drying at –40 °C and 0.099 bar for 24 h using a FreeZone series freeze dryer (Labconco, Missouri, USA); hot-air drying at 50 °C for 48 h using a food dehydrator (LocknLock EJO316PIK/LBLU, Suzhou, China); and shade drying under a canopy with indirect sunlight for 48 h. The dried materials were subsequently ground into fine powder using a laboratory grinder (Ariete Universal PRO, Treviso, Italy) operated in 30 s on/off cycles until all particles passed through a 40-mesh sieve. The resulting powders were stored in hermetically sealed containers at 4 °C to prevent moisture absorption and degradation prior to analysis. For real-sample application, each dried sample was extracted in triplicate using the optimized and validated ultrasound-assisted extraction (UAE).
Determination of moisture content
The moisture content of the safflower samples was determined gravimetrically using a Memmert U15 oven (Memmert GmbH + Co. KG, Schwabach, Germany), following the AOAC International method [27] with minor modifications. Prior to analysis, empty moisture dishes were dried in the oven at 105 °C for 24 h, cooled in a desiccator for 30 min, and weighed to a constant mass. Approximately 1.0 g of each ground safflower sample was placed into the pre-dried dish and subsequently dried in the oven at 105 °C for 24 h. The samples were then cooled in a desiccator and reweighed. The drying-cooling-weighing sequence was repeated until a constant weight was obtained, indicating complete removal of free moisture. The moisture content (%, wet basis) was calculated using Eq. (1).
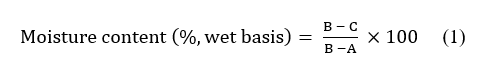
where A is the weight of the empty dish (g), B is the weight of dish with the initial sample (g), and C is the weight of the dish with the sample after drying (g).
Ultrasound-Assissted Extraction (UAE)
Ultrasound-assisted extraction (UAE) of flavonoid glycosides from safflower was conducted using an ultrasonic processor (Sonopuls HD 4200, 20 kHz, 200 W; Bandelin electronic GmbH & Co. KG, Berlin, Germany) equipped with a TS 104 titanium probe (4.5 mm diameter). The extraction temperature was precisely controlled using a Frigiterm thermostatic system (J.P. Selecta, Barcelona, Spain) to maintain consistent thermal conditions throughout the process. The extraction parameters (solvent composition, solid-to-liquid ratio, and temperature) were set according to the optimized experimental design. The total solvent volume was fixed at 20 mL, with ultrasonic power maintained at 50%, a pulse duty cycle of 1 s–1, and an extraction duration of 15 min.
Upon completion of sonication, each mixture was transferred into centrifuge tubes and centrifuged at 4,000 rpm for 10 min using a Centrifuge IP centrifuge (Selecta, Madrid, Spain) to separate solid residues. The supernatant was then diluted with deionized water to a final volume of 25 mL to ensure consistency among replicates. The resulting extracts were filtered through 0.22 µm nylon syringe filters (FilterLab, Barcelona, Spain) prior to chromatographic injection. Finally, the filtered extracts were transferred into sealed amber vials and stored at 4 °C until UPLC-PDA analysis.
Optimization of extraction parameters (Box-Behnken design)
A preliminary solvent screening was first conducted to identify the most efficient solvent for the recovery of flavonoid glycosides from safflower. Three solvents (water, methanol, and 50% methanol (v/v)) were evaluated under identical conditions using 0.5 g of ground sample and 20 mL of solvent. The extraction parameters were fixed at 30 °C, 50% ultrasonic power, a pulse duty cycle of 1 s–1, and an extraction time of 15 min. The solvent yielding the highest extraction efficiency, expressed as the total chromatographic peak area of the target compounds, was selected for subsequent optimization.
For systematic optimization, a Box-Behnken design (BBD), a three-level factorial design known for its efficiency in modelling non-linear relationships, was employed to assess the influence of key process variables on the extraction performance. Three independent variables were investigated: Solvent composition (A, % methanol in water), solid-to-liquid ratio (B, g mL–1), and extraction temperature (C, °C). Each variable was evaluated at 3 coded levels (–1, 0, +1), as summarized in Table 1, while all other conditions were kept constant as determined during solvent screening. The independent variables included in the Box-Behnken design, namely solvent composition, solid-to-liquid ratio, and extraction temperature, were selected based on preliminary screening experiments and literature evidence identifying these parameters as the primary factors governing extraction efficiency and analyte stability during ultrasound-assisted extraction [28,29]. Other experimental parameters, including ultrasonic amplitude, total solvent volume, sample particle size, and probe position, were maintained constant throughout the study. These parameters were either optimized during preliminary trials or fixed according to instrument specifications and previous validated protocols to minimize experimental variability and ensure reproducibility. By restricting the design to the most influential variables, the Box-Behnken approach enabled efficient and systematic optimization while avoiding confounding effects from secondary factors.
Table 1 Independent variables and their respective levels for the Box-Behnken design.
Variables |
Unit |
Level |
||
–1 |
0 |
+1 |
||
Solvent composition (A) |
% methanol in water |
10 |
30 |
50 |
Solid-to-liquid ratio (B) |
g mL–1 |
0.5: 20 |
0.75: 20 |
1: 20 |
Temperature (C) |
°C |
30 |
50 |
70 |
A total of 15 experimental runs, including three replicates at the center point, were conducted according to the BBD matrix to evaluate both the individual and interactive effects of the variables on the extraction yield. The response variable was defined as the total chromatographic peak area of the seven targeted flavonoid glycosides (Table 2). All experimental runs were performed in randomized order to minimize systematic bias and ensure statistical validity.
After completing the experimental runs, the data were analyzed using Minitab version 21 (Minitab Ltd., Brandon Court, UK). A quadratic model was fitted to the response variable (Y) to describe the relationships among the independent factors. The general form of the second-order polynomial equation is given in Eq. (2).
![]()
where Y denotes the dependent variable (the predicted total chromatographic peak area of flavonoid glycosides studied in safflower samples), while A, B and C represent the independent variables. The coefficient β0 is the intercept, βi are the linear terms, βij are the interaction terms, and βii are the quadratic terms of the respective variables.
Table 2 Experimental matrix and observed responses of flavonoid glycosides obtained from the Box-Behnken design.
Run |
A |
B |
C |
Response area (µV·s) |
Error* |
|
Observed |
Predicted |
|||||
1 |
–1 |
0 |
–1 |
12892135.31 |
12577859.88 |
2.50 |
2 |
1 |
0 |
–1 |
16882392.53 |
16871744.99 |
0.06 |
3 |
1 |
–1 |
0 |
17145402.07 |
16925901.25 |
1.30 |
4 |
0 |
–1 |
1 |
13403582.69 |
13308808.08 |
0.71 |
5 |
0 |
1 |
1 |
10727987.23 |
10497838.86 |
2.19 |
6 |
0 |
0 |
0 |
13483434.77 |
12969854.86 |
3.96 |
7 |
–1 |
0 |
1 |
10443645.56 |
10454293.10 |
0.10 |
8 |
0 |
0 |
0 |
12565795.98 |
12969854.86 |
3.12 |
9 |
0 |
0 |
0 |
12860333.82 |
12969854.86 |
0.84 |
10 |
–1 |
–1 |
0 |
12359779.81 |
12443906.87 |
0.68 |
11 |
0 |
1 |
–1 |
12727688.25 |
12822462.86 |
0.74 |
12 |
1 |
1 |
0 |
15717619.57 |
15633492.51 |
0.54 |
13 |
0 |
–1 |
–1 |
13495556.75 |
13725705.11 |
1.68 |
14 |
–1 |
1 |
0 |
9802603.33 |
10022104.15 |
2.19 |
15 |
1 |
0 |
1 |
15939515.31 |
16253790.74 |
1.93 |
* Error calculated with respect to the predicted value.
Analysis of variance (ANOVA) was used to evaluate the statistical significance of the model terms and the adequacy of fit. The quality of the model was assessed through the determination coefficients (R², adjusted R², and predicted R²) and the lack-of-fit test. A non-significant lack-of-fit (p > 0.05) and a high R² value indicated an adequate fit of the model to the experimental data. Confirmatory experiments were subsequently performed to validate the predicted optimum and assess reproducibility.
Assessment of extraction time
The optimal extraction time was determined by monitoring the total concentration of flavonoid glycosides at different time intervals under the previously optimized conditions of solvent composition (A), solid-to-liquid ratio (B), and temperature (C) obtained from the response surface methodology (RSM). Extractions were performed at 5, 10, 15, 20, 25 and 30 min to evaluate the temporal dynamics of analyte release and to establish the duration required to achieve maximum extraction efficiency. At each time point, aliquots of the extract were collected, processed, and analyzed using the validated UPLC-PDA-QDa method to quantify the targeted flavonoid glycosides. All experiments were conducted in triplicate to ensure reproducibility, and the results were expressed as mean ± standard deviation.
Identification of flavonoid glycosides
Identification of flavonoid glycosides in safflower extracts was performed using an ultra-performance liquid chromatography system coupled with a photodiode array detector and a single quadrupole mass spectrometer (UPLC-PDA-QDa, Waters Corporation, Milford, MA, USA). Chromatographic separation was achieved on an ACQUITY UPLC BEH C18 column (1.7 µm, 2.1×100 mm; Waters Corporation), maintained at 47 °C to ensure reproducible retention and efficient peak resolution. The mobile phase consisted of solvent A (0.1% formic acid in water) and solvent B (0.1% formic acid in acetonitrile). Gradient elution was applied according to the following program (time, %B): 0 min, 0%; 1 min, 10%; 3 min, 10%; 4 min, 10%; 4.5 min, 10%; 5 min, 30%; 7 min, 30%; 8 min, 30%; 9 min, 100%; 12 min, 100%; and 13 min, 0%. The flow rate was set at 0.6 mL min–1, with an injection volume of 10 µL. Each analytical run was completed within 13 min, followed by a 13 min re-equilibration period to restore initial column conditions. Mass spectrometric detection was performed using an electrospray ionization (ESI) source operated in the negative ionization mode. The full-scan acquisition was set in the m/z range of 50 - 1,200 to enable detection of both low- and high-molecular-weight flavonoid glycosides. Identification of individual compounds was based on their retention times, UV-visible spectral characteristics, and mass fragmentation patterns obtained under the same chromatographic conditions. Data acquisition and processing were performed using Empower 3 software (Waters Corporation, Milford, MA, USA). This chromatographic system was specifically selected to support compound identification through the combined evaluation of retention time, UV-Vis spectral features, and mass spectral information under optimized ionization conditions. The resulting retention order and spectral characteristics were subsequently used as the reference framework for quantitative analysis.
Determination of flavonoid glycosides
Quantitative determination was performed using a complementary UPLC-PDA system under conditions optimized for UV-based detection. Importantly, the retention order of the flavonoid glycosides was consistent with that obtained from the UPLC-PDA-QDa identification workflow, enabling reliable transfer of compound identity between the two chromatographic systems. Quantitative determination of flavonoid glycosides in the safflower extracts obtained from the design of experiments (DOE) was performed using an ultra-performance liquid chromatography (UPLC) system (Waters Corporation, Milford, MA, USA) equipped with a photodiode array (PDA) detector. Chromatographic separation was achieved on an ACQUITY UPLC BEH C18 column (1.7 µm, 2.1×100 mm; Waters Corporation), maintained at 47 °C to ensure consistent retention and peak resolution. The mobile phase consisted of solvent A (2% acetic acid in water) and solvent B (2% acetic acid in acetonitrile). Gradient elution was applied according to the following program (time, %B): 0 min, 0%; 1 min, 0%; 3 min, 5%; 4 min, 10%; 4.5 min, 10%; 5 min, 20%; 7 min, 20%; 8 min, 30%; 9 min, 100%; 12 min, 100%; and 13 min, 0%. After each analytical batch, the column was washed with 100% solvent B for 7 min to remove retained compounds, followed by re-equilibration prior to the next injection. The flow rate was maintained at 0.4 mL min–1, and the injection volume was 10 µL. All samples were filtered through 0.22 µm nylon syringe filters (FilterLab, Barcelona, Spain) prior to injection to ensure clarity and prevent column clogging.
Chromatographic data acquisition and processing were carried out using Empower 3 software (Waters Corporation). Spectral scanning was performed in the range of 210 - 600 nm, with quantification conducted at 408 nm, corresponding to the maximum absorbance wavelength of the target quinochalcone glycosides. The selection of this wavelength was based on the assumption that the major flavonoid glycosides exhibit comparable chromophoric characteristics and molecular weights. Peak areas of the detected compounds were used as the analytical response for method optimization.
Quantification was performed using an external calibration curve constructed with hydroxysafflor yellow A (HSYA) as the reference standard. HSYA was selected as a single external standard because the major quinochalcone glycosides exhibit similar chromophoric characteristics and strong absorbance at 408 nm. The results were expressed as milligrams of HSYA equivalents per gram of dry weight (mg HSYA eq g⁻¹ DW). Owing to the unavailability of individual reference standards for all targeted flavonoid glycosides, this approach provides comparative and semi-quantitative estimates, and potential differences in molar absorptivity and detector response among analytes should be considered.
Method validation of UAE-UPLC-PDA
The optimized analytical method for quantifying flavonoid glycosides in safflower extracts was validated in accordance with the International Council for Harmonisation (ICH) Guideline Q2 (R1) [30]. The validation covered key performance characteristics, including linearity, limit of detection (LOD), limit of quantification (LOQ), precision, accuracy, repeatability, and intermediate precision. Linearity was established by analyzing five concentration levels of the standard compound hydroxysafflor yellow A (HSYA), ranging from 5 to 30 mg L–1. Calibration curves were generated by plotting peak area against concentration, and linear regression analysis was performed to determine the correlation coefficient (R²), LOD, and LOQ. Both LOD and LOQ were calculated based on the standard deviation of the response (σ) and the slope of the calibration curve (S), using the equations LOD = 3.3σ/S and LOQ = 10σ/S, respectively. The coefficient of determination (R² = 0.9927) indicated good linearity for the UPLC-PDA-based quantification of flavonoid glycosides under the applied analytical conditions.
Precision was evaluated at two levels, repeatability (intra-day) and intermediate precision (inter-day), and expressed as the coefficient of variation (CV, %). Repeatability was assessed by performing nine independent extractions on the same day (n = 9), whereas intermediate precision was determined by conducting three extractions per day across three consecutive days (n = 3×3). The method was deemed precise when the CV values were 10% or below.
Accuracy of the ultrasound-assisted extraction (UAE) method was assessed through multiple extraction cycles and spike recovery tests to verify analyte recovery and method reliability. Extraction recovery (R, %) was determined from three consecutive extraction cycles performed under identical conditions. After each cycle, the supernatant was separated by centrifugation, filtered, and the residue re-extracted with fresh solvent. Flavonoid glycoside concentrations in each extract were quantified using the validated UPLC-PDA-QDa method, and cumulative recovery was obtained by summing the concentrations from all cycles. For spike recovery assessment, accuracy was further verified by comparing the total content of hydroxysafflor yellow A (HSYA) in spiked and unspiked samples. Known amounts of HSYA standard were added to pre-analyzed safflower extracts, and recoveries were calculated by comparing the measured concentration in the spiked sample (C_spiked) with the theoretical sum of the concentration of the unspiked sample (C_sample) and the added standard (C_added). The recovery percentage was determined according to Eq. (3).
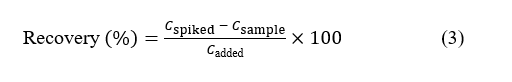
All experiments were performed in triplicate, and the results were expressed as mean ± standard deviation (SD). Recovery values within the range of 80% - 110% were considered acceptable, indicating satisfactory method accuracy and efficient analyte extraction.
Statistical analysis
Statistical analyses were performed using Minitab version 21 (Minitab Ltd., Brandon Court, UK). A Box-Behnken design (BBD) integrated with response surface methodology (RSM) was applied to evaluate the individual and interactive effects of extraction variables on flavonoid glycoside recovery. Model significance was assessed by one-way ANOVA, with differences considered significant at p < 0.05. Model adequacy was confirmed by a high coefficient of determination (R²) and a non-significant lack-of-fit test (p > 0.05). Fisher’s least significant difference (LSD) test at a 95% confidence level was used for multiple mean comparisons. All results were expressed as mean ± standard deviation (SD) from triplicate experiments.
Results and discussion
Validation of the UPLC-PDA-QDa method
The developed UPLC-PDA-QDa method was validated in accordance with the International Council for Harmonisation (ICH) guideline Q2 (R1) [30] to ensure the reliability of detection and quantification. The UPLC-PDA method demonstrated consistent performance, providing sharp and symmetrical peaks with excellent baseline stability, confirming the system’s suitability for the analysis of quinochalcone-type flavonoid glycosides. Hydroxysafflor yellow A (HSYA) was used as an external standard for calibration, given its prominence among safflower flavonoid glycosides and its structural similarity and molecular weight comparable to the other compounds detected. Quantification was conducted at 408 nm, corresponding to the maximum absorbance of HSYA and related chromophoric structures.
A calibration curve for HSYA was established over the concentration range of 5 - 30 ppm, enabling precise quantification across the tested levels. The regression equation obtained was y = 22135x - 2765.7, with a determination coefficient (R²) of 0.9927, confirming excellent linearity within the studied range. The slope of the regression line reflected adequate analytical sensitivity, ensuring a strong and proportional detector response to increasing analyte concentration. The limit of detection (LOD) and limit of quantification (LOQ) for HSYA were determined to be 2.967 ppm and 8.992 ppm, respectively, demonstrating the method’s capability to detect and accurately quantify analytes at low concentrations.
The obtained R², LOD, and LOQ values fall well within the acceptable analytical performance criteria, confirming that the UPLC-PDA method is both sensitive and reliable for the quantitative estimation of HSYA and other structurally related flavonoid glycosides in safflower extracts. These results establish the method’s suitability as a validated analytical approach for subsequent compound identification and comparative quantification under varying sample conditions.
Identification of flavonoid glycosides in safflower
In UPLC analysis, acid modifiers play an essential role in adjusting the mobile-phase pH. Formic and acetic acids are commonly used to maintain pH stability, which is critical for achieving consistent retention times and well-shaped chromatographic peaks. Formic acid, being more volatile than acetic acid, is widely applied in mass-spectrometry-based detection because it readily evaporates, minimizes non-volatile residue accumulation in the ion source, and enhances both the stability and sensitivity of electrospray ionization [31,32]. Previous studies have also shown that 0.1% formic acid yields symmetric peaks in the analysis of quinochalcone C-glycosides and flavonoid O-glycosides from Carthamus tinctorius [33]. In contrast, LC-UV employs acetic acid because of its lower UV absorbance and the absence of a requirement for volatility. Importantly, the difference between these acid modifiers does not significantly influence compound elution as long as the resulting mobile-phase pH is comparable. Moreover, variations in flow rate within the optimal range of 0.15 - 1.0 mL min–1, depending on analyte molecular weight, do not negatively affect separation performance [34].
After confirming system suitability and validating the chromatographic performance of the method, the UPLC-PDA-QDa method was subsequently applied to identify individual flavonoid glycosides in safflower extracts. The chromatogram obtained at 408 nm (Figure 1(a)) exhibited seven distinct and well-resolved peaks within a 7-min analytical run, confirming the method’s capability to achieve efficient separation of structurally related compounds. The corresponding PDA spectra and mass spectral data (Figure 1(b)) provided complementary information for compound identification based on their characteristic UV-visible absorbance and deprotonated molecular ions ([M-H]⁻).
Seven chromatographic peaks were consistently detected in safflower extracts. Among these, five flavonoid glycosides were confidently identified, namely hydroxysafflor yellow A (HSYA, m/z 611.35; RT 1.859 min), safflomin A (m/z 611.35; RT 2.841 min), saffloroside (m/z 477.31; RT 3.232 min), safflor yellow B (m/z 1061.34; RT 5.384 min), and anhydrosafflor yellow B (m/z 1043.41; RT 5.465 min). HSYA and safflomin A were distinguished based on differences in retention time, PDA absorbance characteristics, and fragmentation behaviour, despite sharing identical m/z values. Their PDA absorption maxima around 408 nm and fragmentation profiles correspond well with previously published data for safflower extracts [35-37]. These compounds share a quinochalcone-type chromophore responsible for the characteristic yellow-orange pigmentation of safflower and exhibit similar glycosidic substitution patterns.
Two additional peaks were tentatively assigned as HSYA-derived compounds (HSYA derivative 1 and HSYA derivative 2) based on comparable UV-Vis absorption features and mass spectral fragmentation patterns; however, definitive structural confirmation was not possible due to the lack of authentic reference standards and are therefore reported as tentatively identified HSYA-derived compounds. The consistent detection and reproducible retention times across replicate analyses further demonstrate the precision and stability of the chromatographic system. Collectively, the combined PDA and mass spectrometric data validated the method’s reliability for simultaneous identification and characterization of multiple flavonoid glycosides in safflower extracts.
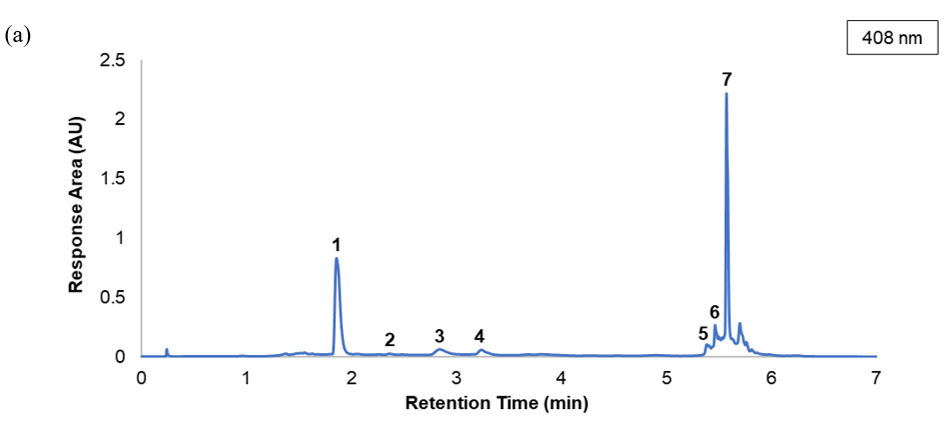
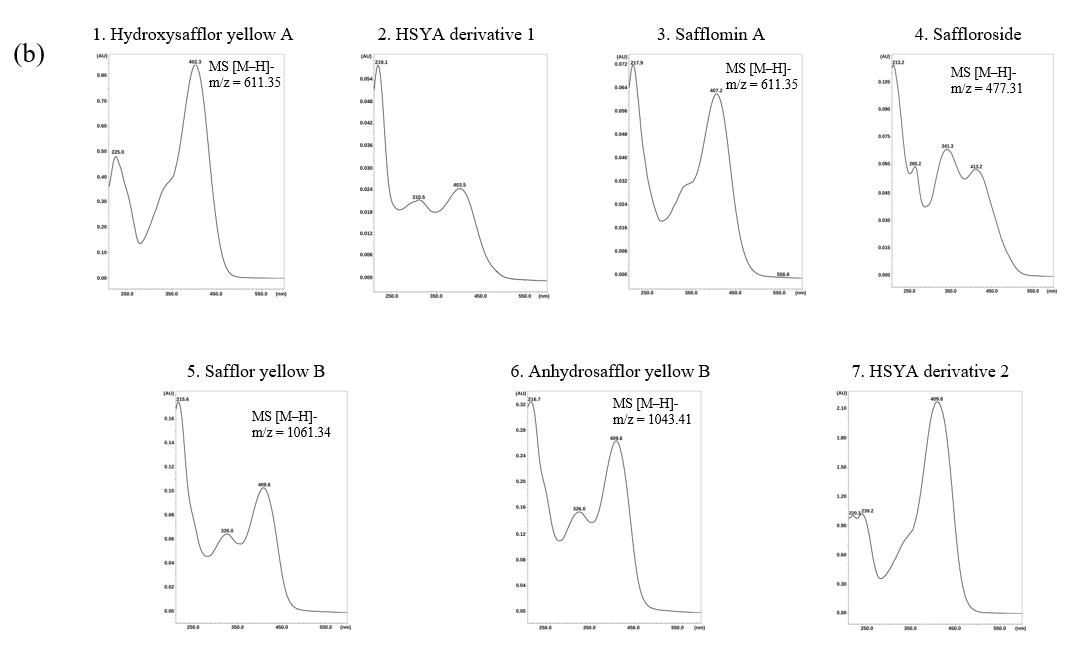
Figure 1 (a) UPLC-PDA chromatogram of safflower extract recorded at 408 nm showing seven detected chromatographic peaks under validated analytical conditions. (b) PDA absorption spectra and corresponding mass spectrometric information ([M-H]⁻) of the detected compounds. Five flavonoid glycosides were confidently identified based on retention time, PDA spectral characteristics, and mass spectrometric data, namely hydroxysafflor yellow A (HSYA, m/z 611.35), safflomin A (m/z 611.35), saffloroside (m/z 477.31), safflor yellow B (m/z 1061.34), and anhydrosafflor yellow B (m/z 1043.41). Two additional peaks (peaks 2 and 7) exhibited similar chromophoric features and fragmentation patterns to HSYA and are therefore reported as tentatively identified HSYA-derived compounds due to the absence of authentic reference standards.
Preliminary solvent screening
Selecting an appropriate extraction solvent is essential for maximizing the recovery of flavonoid glycosides from safflower prior to UAE optimization. Solubility and solvent viscosity play critical roles in mass transfer and analyte diffusion, while the wide polarity range of phenolic compounds complicates solvent selection for complete recovery [38]. In safflower, the predominant phenolics are quinochalcone C-glycosides, which are highly polar and hydrophilic, whereas other constituents may contain less water-soluble aglycone moieties and aromatic structures [9]. To address this variability, solvents with different polarities (water, methanol, and 50% methanol (v/v)) were evaluated to determine the most suitable medium for extracting all targeted flavonoid glycosides (Figure 2).
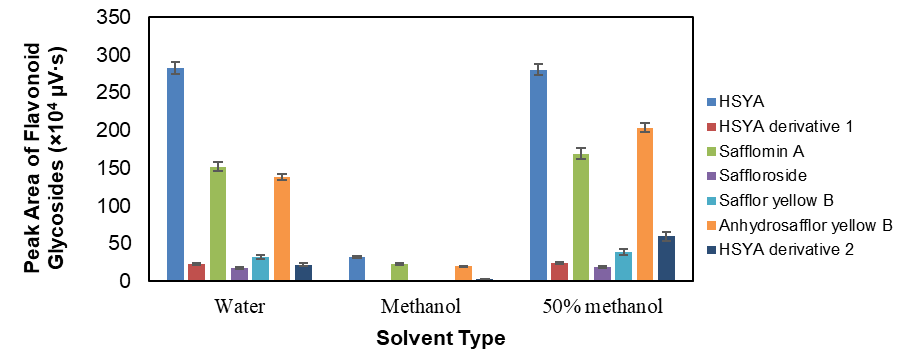
Figure 1 Effect of solvent type (water, methanol, and 50% methanol v/v) on the extraction efficiency of seven flavonoid glycosides from Carthamus tinctorius L. extracts, expressed as total chromatographic peak area (×104 µV·s). Data represent mean ± SD (n = 3).
The results demonstrated that 50% methanol provided the highest overall recovery for all seven flavonoid glycosides, significantly outperforming pure water and methanol. Hydroalcoholic mixtures are generally more efficient for moderately polar or amphiphilic compounds, as the combination of water and methanol achieves balanced polarity that enhances solubilization and improves solvent penetration into plant tissues [39]. Water predominantly extracts hydrophilic compounds through hydrogen bonding, while methanol facilitates dissolution of less polar phenolics by engaging in both carbon-oxygen and oxygen-hydrogen interactions [40]. Consequently, their combination enhances overall extraction efficiency by improving both solubility and diffusivity of analytes within the matrix [41,42]. Similar behavior has been reported for phenolic extractions from Santolina chamaecyparissus L. [43], and Crocus sativus L. [44], where hydroalcoholic mixtures outperformed single solvents.
As shown in Figure 2, 50% methanol yielded markedly higher peak areas for hydroxysafflor yellow A (HSYA) and its derivatives, as well as for safflomin A, saffloroside, and safflor yellow B, compared to pure solvents. This demonstrates that mixed solvent systems enhance the simultaneous recovery of both polar glycosides and partially hydrophobic components. Although 50% methanol exhibited the best performance in the initial screening, methanol concentration was further optimized in the subsequent response surface methodology (RSM) experiments to achieve maximal recovery of flavonoid glycosides under controlled UAE conditions.
Effect of extraction variables on flavonoid glycoside recovery
Evaluating the significance of individual extraction factors was essential to identify the variables that most strongly influenced flavonoid glycoside recovery and to guide subsequent optimization using response surface methodology (RSM). The analysis of variance (ANOVA) results is summarized in the Pareto chart of standardized effects (Figure 3). In this chart, each bar represents the magnitude of the standardized effect for each factor or interaction term. Bars crossing the reference line (t = 2.57, p < 0.05) indicate statistically significant effects on the response variable.
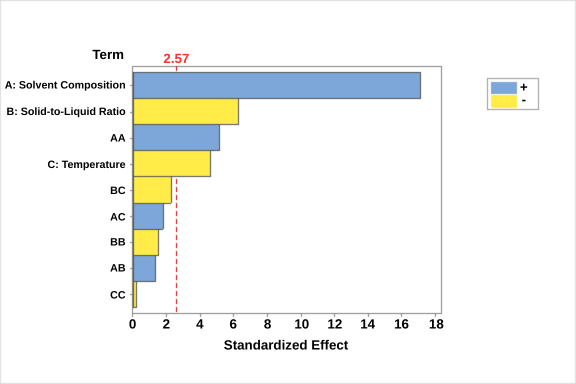
Figure 2 Pareto chart of standardized effects for the main, interaction, and quadratic terms of the ultrasound-assisted extraction (UAE) model on flavonoid glycoside recovery. Bars crossing the reference line (t = 2.57, p < 0.05) indicate statistically significant effects.
As shown in Figure 3, the main effects of solvent composition (A), solid-to-liquid ratio (B), and temperature (C), as well as the quadratic effect of solvent composition (A²), had significant influences on flavonoid glycoside extraction efficiency. Among these, solvent composition exhibited the strongest positive effect, followed by solid-to-liquid ratio and temperature, demonstrating that solvent polarity is the most critical determinant of analyte recovery under UAE conditions. The high standardized effect value for factor A aligns with the validation results, where the UPLC-PDA method showed reliable quantification across varying methanol concentrations, confirming that solvent composition governs both extraction efficiency and analytical detectability.
The significant positive effect of solvent composition suggests that increasing methanol concentration within a moderate range enhances solubilization of flavonoid glycosides, consistent with earlier findings on phenolic extraction from Clitoria ternatea [17] and Arnica montana [45]. This trend reflects the role of solvent polarity in establishing affinity between the analytes and the solvent system [46]. Since safflower phenolics comprise both hydrophilic and weakly hydrophobic quinochalcone glycosides, an intermediate methanol ratio facilitates simultaneous dissolution of these components.
In contrast, the solid-to-liquid ratio (B) displayed a negative effect, indicating that lower solid content (i.e., higher solvent volume) favors extraction yield. A similar inverse relationship has been reported for phenolic recovery from dried edible flowers [22] and flavonoids extraction from Melastoma malabathricum [47]. At low solvent volumes, high solution viscosity suppresses cavitation and restricts solvent penetration, while moderate dilution enhances mass transfer and cavitation intensity. However, excessively high solvent volume may promote excessive bubble collapse, which could degrade heat- and shear-sensitive compounds [38].
Extraction temperature (C) also exerted a negative effect at higher values, suggesting degradation of thermolabile analytes. Although mild heating (≤ 50 °C) enhances solvent diffusivity and reduces viscosity, excessive temperature can induce oxidative or structural decomposition of flavonoid glycosides [48]. Temperatures below 60 °C are thus recommended to maintain compound stability, consistent with previous reports for polyphenol extraction from Carthamus tinctorius L. [20], Clitoria ternatea [18], and Opuntia ficus-indica [L.] Mill. Flowers [49].
Optimization of UAE method
The significant factors identified from the Pareto chart analysis were further optimized using a three-factor, three-level Box-Behnken design (BBD) integrated with response surface methodology (RSM). RSM is a powerful statistical and mathematical approach that enables the modeling of linear, quadratic, and interaction effects of independent variables to identify the most favorable conditions for a desired response [50]. The model evaluated the individual and interactive effects of solvent composition (A), solid-to-liquid ratio (B), and extraction temperature (C) on the total recovery of flavonoid glycosides. The results of the experimental runs and predicted responses are summarized in Table 2. While the predictive model derived from experimental data was fitted to a second-order polynomial equation, as described in Eq. (4).
![]()
where Y represents the response of flavonoid glycosides (total area, µV.s), and A, B, and C denote solvent composition, solid-to-liquid ratio, and temperature, respectively.
The adequacy of the model was confirmed through ANOVA, which produced a non-significant lack-of-fit (p = 0.651 > 0.05) and a high coefficient of determination (R² = 0.9875). These results demonstrate that the quadratic model effectively described the experimental data and possessed high predictive reliability for flavonoid glycoside recovery. The response surface plot (Figure 4) illustrates the combined effects of the three variables, revealing that extraction yield increased with solvent composition, but decreased at higher solid-to-liquid ratio and temperatures. The gradients in the color map visually represent this interaction, with red regions indicating higher extraction responses within the experimental domain.
Beyond identifying the predicted optimum, the response surface plots provide insight into the relative influence and interaction of the extraction variables. Solvent composition exhibited the strongest positive effect on flavonoid glycoside recovery, as evidenced by the steep gradient and pronounced curvature of the response surface, indicating that moderate increases in methanol proportion substantially enhanced extraction efficiency. In contrast, the solid-to-liquid ratio showed a secondary but significant effect, where increasing solvent volume improved mass transfer up to an optimal level, beyond which the response plateaued. Extraction temperature displayed a curved response pattern, suggesting that mild heating facilitated solute diffusion, whereas higher temperatures led to reduced recovery, likely due to partial degradation of thermolabile quinochalcone glycosides. The interaction patterns among variables further supports these trends. The curvature of the response surfaces indicates the presence of an optimal extraction region rather than a simple linear relationship, reflecting the combined effects of solvent polarity, mass transfer efficiency, and analyte stability under ultrasonic conditions.
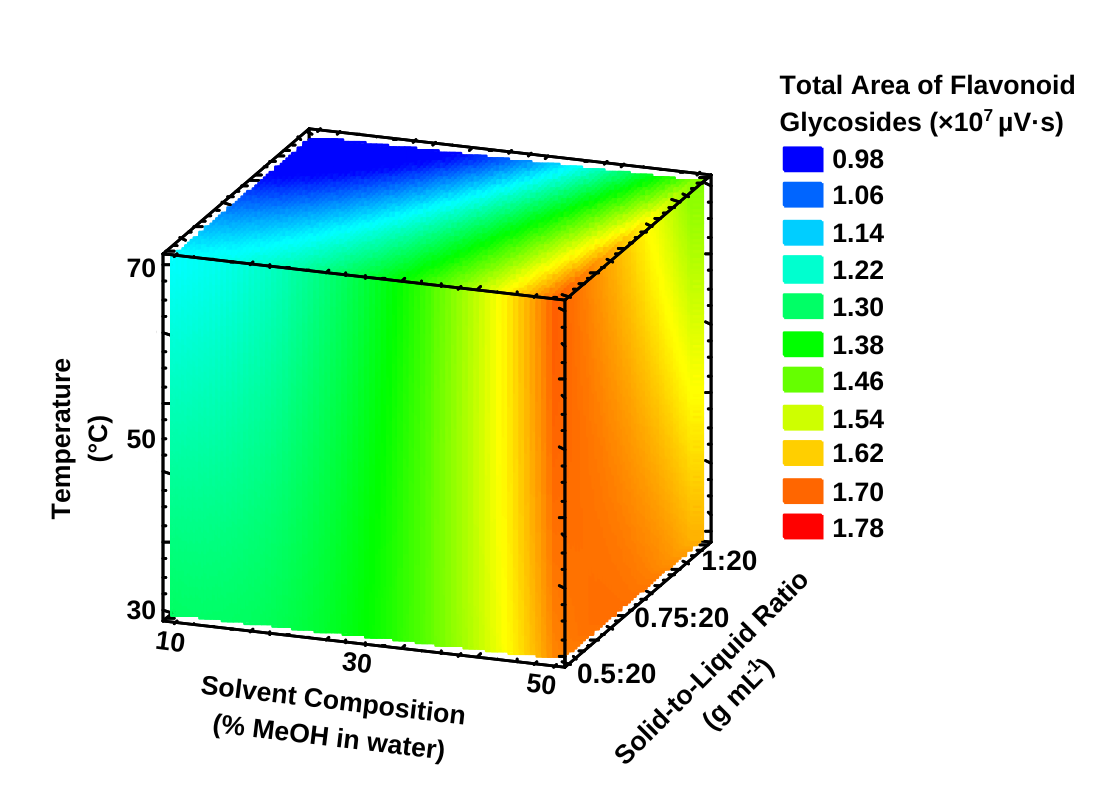
Figure 3 Response surface plot illustrating the interactive effects of solvent composition (% MeOH in water), solid-to-liquid ratio (g mL–1), and temperature (°C) on total flavonoid glycoside recovery from Carthamus tinctorius L. extracts. The color gradient represents the total peak area (×10⁷ µV·s) predicted by the RSM model.
Based on the RSM-predicted model, the initial optimal conditions for maximizing total flavonoid glycoside recovery were 50% methanol, a solid-to-liquid ratio of 0.5:20 g mL–1, and an extraction temperature of 30 °C, yielding a predicted total chromatographic area of 16,708,907 µV·s. Experimental validation conducted under these conditions produced a mean response of 15,960,070 µV·s, corresponding to a deviation of only 4.48% from the predicted value, thereby confirming the model’s reliability.
Because the predicted optimum was located at the boundary of the experimental range, an extended optimization was performed to evaluate conditions beyond the original BBD design. The refined optimum (50% methanol, 0.3:20 g mL–1, and 30 °C) yielded a higher total chromatographic area of 17,353,913 µV·s, representing an 8.73% improvement compared to the initial optimum. These findings suggest that extending the solvent-to-solid ratio beyond the designed range significantly enhanced analyte diffusion and extraction efficiency. The trend is consistent with the validated chromatographic method, which demonstrated linear detector response and robustness across variable concentrations, further supporting the reliability of both the extraction model and the analytical quantification system.
Effect of extraction time
Extraction time is a critical parameter in ultrasound-assisted extraction (UAE), as it determines the duration of cavitation exposure and diffusion between the solvent and the plant matrix. To determine the optimal duration for maximum recovery of flavonoid glycosides, extraction experiments were conducted under the RSM-optimized conditions (50% methanol, 0.3:20 g mL–1, and 30 °C) for 5, 10, 15, 20, 25 and 30 min. The total concentrations of the seven identified flavonoid glycosides were quantified to evaluate the effect of extraction time on recovery (Figure 5).
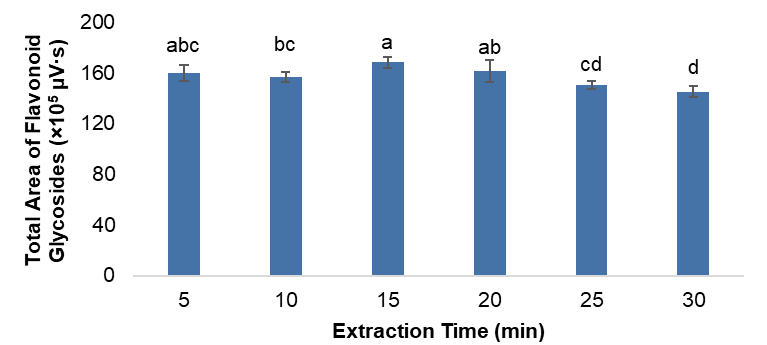
Figure 4 Effect of extraction time (5 - 30 min) on the total recovery of flavonoid glycosides from Carthamus tinctorius L. under the optimized ultrasound-assisted extraction conditions (50% methanol, 0.3:20 g mL–1, and 30 °C). Data are presented as mean ± SD (n = 3).
The results revealed a rapid increase in extraction efficiency within the first 10 - 15 min, followed by a plateau and a slight decline beyond 20 min. This pattern reflects the typical diffusion-controlled behavior in solid-liquid extraction systems, where cavitation initially disrupts cell walls and facilitates the release of intracellular compounds into the solvent. After equilibrium between the solute concentrations in the solid and liquid phases is reached, further ultrasonication produces diminishing returns or even degradation of sensitive analytes [51].
At 15 min, the total chromatographic peak area reached its maximum value, indicating the point of equilibrium for flavonoid glycoside diffusion. Extending the extraction time beyond 20 min did not significantly increase recovery and, in some cases, resulted in a slight reduction in peak intensity, likely due to oxidative degradation of quinochalcone-type glycosides such as hydroxysafflor yellow A (HSYA) and safflor yellow B. Previous studies reported similar patterns in phenolic extractions from Tagetes erecta [52], where prolonged sonication caused decomposition of heat- and shear-sensitive compounds. Extended extraction can lead to thermal degradation of heat-sensitive phenolics and promote the co-extraction or accumulation of undesirable compounds, thereby reducing extract quality [53]. The short extraction duration also aligns with the principle of green analytical chemistry, reducing solvent consumption and energy input while maintaining analytical reliability.
Method
validation
After optimization of the UAE procedure through BBD-RSM, the extraction method was validated by evaluating precision and accuracy (Table 4). Repeatability was assessed by performing nine consecutive extractions under the optimized conditions within a single day (n = 9), while intermediate precision was evaluated through three extractions per day conducted over three separate days (n = 3×3). The coefficient of variation (CV, %) was used as an indicator of precision. As summarized in Table 4, CV values for both repeatability and intermediate precision were 10% or lower which falls well within the acceptance limits established by the ICH Guideline. These findings confirm that the developed UAE method provides excellent reproducibility and operational stability for the extraction of flavonoid glycosides.
In terms of accuracy, recovery rates (R, %) were evaluated using a multi-cycle extraction approach, limited to a maximum of three cycles. The cumulative sum area from these extractions was used to estimate the overall concentration of the analytes in the samples. The recovery rates for flavonoid glycosides after the first cycle ranged from 90 to 100%, which is consistent with the acceptable limits defined by the ICH Guideline (80% - 110%). These results confirm that the developed UAE method provides reliable accuracy for the extraction of flavonoid glycosides.
To further validate the method, analytical recovery was evaluated using the standard spiking approach, in which pure HSYA standard was added to the sample extract. This approach allowed an accurate evaluation of UPLC quantification performance. The recovery of HSYA was calculated as 94.27%, which falls within the acceptable range specified by ICH Guideline (80% - 110%). Together, these approaches ensured a comprehensive assessment of both analytical performance and extraction completeness.
Table 3 Accuracy and precision of UAE in seven flavonoid glycosides.
Flavonoid glycosides |
Precision (CV, %) |
Recovery (%) |
|
Repeatability |
Intermediate precision |
||
HSYA |
2.76 |
2.35 |
98.66 ± 0.15 |
HSYA derivative 1 |
5.66 |
6.30 |
100.00 ± 0.00 |
Safflomin A |
4.13 |
2.46 |
98.63 ± 0.17 |
Saffloroside |
7.12 |
5.04 |
97.21 ± 0.52 |
Safflor yellow B |
10.15 |
8.66 |
97.44 ± 0.40 |
Anhydrosafflor yellow B |
2.87 |
2.89 |
98.71 ± 0.30 |
HSYA derivative 2 |
9.00 |
7.83 |
97.54 ± 0.02 |
Effect of drying methods on flavonoid glycoside content and composition
Drying is a common preservation technique used to extend the shelf life of perishable plant materials; however, it often induces chemical and structural changes that can alter bioactive compounds [54]. Drying significantly influenced both the moisture content and the flavonoid glycoside composition of Carthamus tinctorius L. samples extracted using the validated UAE-UPLC-PDA-QDa-MS method. Among the tested methods, freeze drying resulted in the lowest residual moisture content (5.63 ± 0.25%), followed by hot-air drying (7.51 ± 0.07%) and shade drying (8.91 ± 0.12%). The differences were statistically significant (p < 0.05). The low moisture level observed in freeze-dried samples can be attributed to the sublimation of ice crystals under reduced pressure, which efficiently removes both free and bound water [55]. In contrast, the slower dehydration rate during shade drying, coupled with possible reabsorption of atmospheric moisture, led to higher final water content [56].
Previous studies on Dendrobium officinale flower tea reported that freeze drying most effectively preserved flavonoids, maintained anthocyanin stability, and retained phenolic acids, while air drying resulted in extracts with stronger antioxidant activity [57]. Generally, increasing drying temperature leads to a reduction in total phenolic and flavonoid contents due to thermal degradation [58].
Despite its superior drying efficiency, freeze drying did not produce the highest total flavonoid glycoside recovery. The total chromatographic area, representing the combined response of the seven flavonoid glycosides, was highest in freeze-dried samples, followed sequentially by hot-air-dried and shade-dried samples. The enhanced yield in freeze-dried safflower suggests that the method effectively preserves thermolabile compounds such as hydroxysafflor yellow A (HSYA) by minimizing oxidation and enzymatic degradation. Conversely, shade drying exhibited the lowest levels of flavonoid glycosides, likely due to oxidative and enzymatic degradation occurring during the prolonged drying period. However, in fact, glycosylated flavonoids are more resistant to heat than their aglycone forms [59].
A closer examination of individual compound levels (Table 5) reveals distinct compositional trends. Freeze-dried samples contained the highest concentration of HSYA (10.86 ± 0.20 mg g–1 DW), confirming that low-temperature drying best preserves this heat-sensitive quinochalcone glycoside. HSYA degradation during hot-air drying (9.85 ± 0.09 mg g–1 DW) is consistent with its known susceptibility to heat, light, and alkaline environments [60]. By operating under low pressure and temperature, freeze drying minimizes degradation of HSYA while protecting oxidizable substances [61]. However, the hot-air-dried samples exhibited higher levels of HSYA derivatives and other related compounds, such as safflomin A (2.04 ± 0.04 mg HSYA eq g–1 DW), safflor yellow B (1.15 ± 0.02 mg HSYA eq g–1 DW), and anhydrosafflor yellow B (1.72 ± 0.01 mg HSYA eq g–1 DW), compared to their freeze- and shade-dried counterparts. This indicates that moderate heating likely facilitated structural conversions and glycosidic rearrangements, enhancing the formation of derivative compounds [62].
Table 4 Levels of individual flavonoid glycosides across different drying methods of safflower.
Flavonoid glycosides |
Drying methods |
||
Freeze drying |
Hot-air drying |
Shade drying |
|
HSYA (mg g–1 DW) |
10.86 ± 0.20 |
9.85 ± 0.09 |
10.28 ± 0.19 |
HSYA derivative 1* |
0.01 ± 0.00 |
0.02 ± 0.00 |
ND |
Safflomin A (mg HSYA eq g–1 DW) |
1.27 ± 0.03 |
2.04 ± 0.04 |
TR |
Saffloroside (mg HSYA eq g–1 DW) |
TR |
TR |
TR |
Safflor yellow B (mg HSYA eq g–1 DW) |
0.89 ± 0.02 |
1.15 ± 0.02 |
TR |
Anhydrosafflor yellow B (mg HSYA eq g–1 DW) |
1.21 ± 0.03 |
1.72 ± 0.01 |
0.86 ± 0.01 |
HSYA derivative 2* |
1.01 ± 0.00 |
1.19 ± 0.00 |
0.88 ± 0.01 |
* Flavonoid glycoside levels were expressed as relative values to HSYA. TR: Trace (the value is between LOD and LOQ). ND: Not detected (< LOD).
Despite the robustness of the optimized and validated UAE-UPLC-PDA-QDa workflow, several limitations should be acknowledged. Quantification of flavonoid glycosides was based on a single external standard (hydroxysafflor yellow A), and the reported values for other compounds are therefore expressed as HSYA equivalents. Consequently, the results should be interpreted as semi-quantitative, as differences in molar absorptivity and detector response among structurally distinct flavonoid glycosides may affect absolute concentration accuracy. These limitations define the applicability range of the method and should be considered when interpreting quantitative comparisons across different safflower samples.
Conclusions
A green, rapid, and validated ultrasound-assisted extraction (UAE) method combined with UPLC-PDA-QDa was successfully developed for the quantitative determination of flavonoid glycosides in safflower (Carthamus tinctorius L.). The method demonstrated excellent linearity, precision, and accuracy in accordance with ICH Q2 (R1) Guidelines, confirming its suitability for the reliable extraction and quantification of quinochalcone-type compounds. Optimization using Box-Behnken response surface methodology revealed that solvent composition, solid-to-liquid ratio, and temperature significantly affected extraction efficiency, with optimal conditions achieved at 50% methanol, 0.3:20 g mL–1, and 30 °C. Application of the validated method to safflower samples processed by different drying techniques showed that drying conditions strongly influence both the retention and transformation of flavonoid glycosides. Freeze drying best preserved native hydroxysafflor yellow A (HSYA), whereas hot-air drying induced partial conversion into glycosylated derivatives, maintaining relatively high total flavonoid yields. Shade drying resulted in the greatest losses due to oxidation and enzymatic degradation. These results highlight the importance of selecting appropriate post-harvest drying conditions to balance compound stability and extraction efficiency. Overall, the developed UAE-UPLC-PDA-QDa-MS method provides a robust analytical platform for assessing the impact of processing on safflower phytochemicals and can be readily applied for quality evaluation and process optimization in the production of functional food ingredients, natural colorants, and other value-added safflower-based products.
Acknowledgements
Amirah Ulfah gratefully acknowledges the Indonesian Endowment Fund for Education (LPDP), Ministry of Finance of the Republic of Indonesia, for the scholarship and financial support provided for this research (Scholarship ID: 202312110354069). Sincere appreciation is also extended to Universitas Gadjah Mada, Yogyakarta 55281, Indonesia and the University of Cádiz, Spain for their valuable collaboration and provision of research facilities that made this work possible.
Declaration of Generative AI in Scientific Writing
During the preparation of this manuscript, the authors used ChatGPT (OpenAI, USA) to assist in improving the clarity, grammar, and flow of the text. After using this tool, the authors reviewed and edited the content as necessary and take full responsibility for the final version of the manuscript.
CRediT Author Statement
Amirah Ulfah: Conceptualization, Software, Formal analysis, Investigation, Resources, Writing - Original Draft, and Funding acquisition. Muhammad Yusuf Hidayat: Data curation, Resources, Writing - Review & Editing. Chusnul Hidayat: Conceptualization, Methodology, and Writing - Review & Editing. Widiastuti Setyaningsih: Conceptualization, Methodology, Data curation, Writing - Review & Editing, Visualization, Supervision, and Project administration. Miguel Palma: Conceptualization, Methodology, Validation, Resources, Data curation, Writing - Review & Editing; and Supervision.
[1] E Delshad, M Yousefi, P Sasannezhad, H Rakhshandeh and Z Ayati. Medical uses of Carthamus tinctorius L. (safflower): A comprehensive review from traditional medicine to modern medicine. Electron Physician 2018; 10(4), 6672-6681.
[2] OK Buyukkurt, G Guclu, C Barutcular, S Selli and H Kelebek. LC-MS/MS fingerprint and simultaneous quantification of bioactive compounds in safflower petals (Carthamus tinctorius L.). Microchemical Journal 2021; 171, 106850.
[3] R Hamsidi, A Widyawaruyanti, AF Hafid, W Ekasari, MH Malaka, H Kasmawati, NI Akib, W Wahyuni and S Sabarudin. Profil fitokimia ekstrak etanol bunga kasumba turate (Carthamus tinctorius L.) yang berpotensi sebagai antimalaria. Pharmauho Jurnal Farmasi Sains dan Kesehatan 2018; 4(2), 40-42.
[4] I Kim, J Bae and BJ Kim. Carthami flos regulates gastrointestinal motility functions. Integrative Medicine Research 2017; 6(4), 404-408.
[5] T Makino, H Wakushima, T Okamoto, Y Okukubo, K Saito and Y Kano. Effects of kangen-karyu on coagulation system and platelet aggregation in mice. Biological and Pharmaceutical Bulletin 2002; 25(4), 523-525.
[6] M Abudayyak, EÖ Nath and G Özhan. Toxic potentials of ten herbs commonly used for aphrodisiac effect in Turkey. Turkish Journal of Medical Sciences 2015; 45(3), 496-506.
[7] Z Yan, R Alimu, J Wan, X Liao, S Lin, S Dai, F Chen, S Zhang, Y Tong, H Liu, R Qin and J Liu. Composition of major quinochalcone hydroxysafflor yellow A and anhydrosafflor yellow B is associated with colour of safflower (Carthamus tinctorius) during colour-transition but not with overall antioxidant capacity: A study on 144 cultivars. Food Research International 2022; 162, 112098.
[8] H Cheng, C Yang, P Ge, Y Liu, MM Zafar, B Hu, T Zhang, Z Luo, S Lu, Q Zhou, A Jaleel and M Ren. Genetic diversity, clinical uses, and phytochemical and pharmacological properties of safflower (Carthamus tinctorius L.): An important medicinal plant. Frontiers in Pharmacology 2024; 15, 1374680.
[9] I Adamska and P Biernacka. Bioactive substances in safflower flowers and their applicability in medicine and health-promoting foods. International Journal of Food Science 2021; 2021, 6657639.
[10] LL Zhang, K Tian, ZH Tang, XJ Chen, ZX Bian YT Wang and JJ Lu. Phytochemistry and pharmacology of Carthamus tinctorius L. American Journal of Chinese Medicine 2016; 44(2), 197-226.
[11] Y Chen, Q Xiang, F Peng, S Gao, L Yu, Y Tang, Z Yang, W Pu, X Xie and C Peng. The mechanism of action of safflower total flavonoids in the treatment of endometritis caused by incomplete abortion based on network pharmacology and 16S rDNA sequencing. Journal of Ethnopharmacology 2023; 315, 116639.
[12] ZJ Pu, SJ Yue, GS Zhou, H Yan, XQ Shi, ZH Zhu, SL Huang, GP Peng, YY Chen, JQ Bai, XP Wang, SL Su, YP Tang and JA Duan. The comprehensive evaluation of safflowers in different producing areas by combined analysis of color, chemical compounds, and biological activity. Molecules 2019; 24(18), 3381.
[13] K Lin, Z Qin, C Qu, X Chen, Q Jiang, M Li, Q Zheng and D Li. Hydroxyl safflower yellow B combined with doxorubicin inhibits the proliferation of human breast cancer MCF-7 cells. Oncology Letters 2021; 21(5), 426.
[14] K Yan, X Wang, H Zhu, H Pan, L Wang, H Yang, M Liu, M Jin, B Zang and F Gong. Safflower yellow improves insulin sensitivity in high-fat diet-induced obese mice by promoting peroxisome proliferator-activated receptor-γ2 expression in subcutaneous adipose tissue. Journal of Diabetes Investigation 2020; 11(6), 1457-1469.
[15] AD Permana, A Sam, ANF Marzaman, A Rahim, F Nainu, MA Bahar, RM Asri and L Chabib. Solid lipid nanoparticles cyclodextrin-decorated incorporated into gellan gum-based dry floating in situ delivery systems for controlled release of bioactive compounds of safflower (Carthamus tinctorius. L): A proof of concept study in biorelevant media. International Journal of Biological Macromolecules 2023; 237, 124084.
[16] MG Rasul. Conventional extraction methods use in medicinal plants, their advantages and disadvantages. International Journal of Basic Sciences and Applied Computing. 2018; 2(6), 10-14.
[17] S Sai-Ut, A Teksee, J Pongsetkul, S Sinthusamran and S Rawdkuen. Optimization of ultrasonic assisted ethanolic extraction for natural pigments from butterfly pea flower applied in Thai dessert using Box-Behnken approach. Food Chemistry: X 2024; 22, 101484.
[18] LG Santos and VG Martins. Optimization of the green extraction of polyphenols from the edible flower Clitoria ternatea by high-power ultrasound: A comparative study with conventional extraction techniques. Journal of Applied Research on Medicinal and Aromatic Plants 2023; 34, 100458.
[19] S Manzoor, R Rashid, BP Panda, V Sharma and M Azhar. Green extraction of lutein from marigold flower petals, process optimization and its potential to improve the oxidative stability of sunflower oil. Ultrasonics Sonochemistry 2022; 85, 105994.
[20] XH Wang and JP Wang. Effective extraction with deep eutectic solvents and enrichment by macroporous adsorption resin of flavonoids from Carthamus tinctorius L. Journal of Pharmaceutical and Biomedical Analysis 2019; 176, 112804.
[21] NMD Oktaviani, ID Larasati, AW Nugroho, W Setyaningsih and M Palma. Ultrasound-assisted extraction of L-tryptophan from chamomile flower: Method development and application for flower parts characterization and varietal difference. Trends in Sciences 2024; 21(3), 7348.
[22] A Briliantama, NMD Oktaviani, S Rahmawati, W Setyaningsih and M Palma. Optimization of ultrasound-assisted extraction (UAE) for simultaneous determination of individual phenolic compounds in 15 dried edible flowers. Horticulturae 2022; 8(12), 1216.
[23] T Bacchetti, C Morresi, L Bellachioma and G Ferretti. Antioxidant and pro-oxidant properties of Carthamus tinctorius, hydroxy safflor yellow A, and safflor yellow A. Antioxidants 2020; 9(2), 119.
[24] KY Ruan, TF Lu, J Zhou, X Liang, S Wang, YQ Xia and T Wang. Bio-derived solvent based salt-responsive system for simultaneous extraction and in-situ enrichment of polysaccharides and phenolics from Carthamus tinctorius L. flower. Separation and Purification Technology 2024; 349, 127795.
[25] SLC Ferreira, RE Bruns, HS Ferreira, GD Matos, JM David, GC Brandao, EGP da Silva, LA Portugal, PS dos Reis, AS Souza and WNL dos Santos. Box-Behnken design: An alternative for the optimization of analytical methods. Analytica Chimica Acta 2007; 597(2), 179-186.
[26] V Reungoat, C Morad and I Ioannou. Response surface methodology applied to the optimization of phenolic compound extraction from Brassica. IntechOpen, London, 2021.
[27] AOAC. Official methods of analysis. 18th ed. Association of Official Analytical Chemists (AOAC International), Maryland, 2005.
[28] S Zia, MR Khan, MA Shabbir, AA Maan, MKI Khan, M Nadeem, AA Khalil, A Din and RM Aadil. An inclusive overview of advanced thermal and nonthermal extraction techniques for bioactive compounds in food and food-related matrices. Food Reviews International 2020; 38(6), 1166-1196.
[29] K Kumar, S Srivastav and VS Sharanagat. Ultrasound assisted extraction (UAE) of bioactive compounds from fruit and vegetable processing by-products: A review. Ultrasonics Sonochemistry 2021; 70, 105325.
[30] ICH. Validation of analytical procedures: Text and methodology Q2 (R1). International Conference on Harmonisation (ICH), Geneva, Switzerland, 2005.
[31] O Núñez and P Lucci. Applications and uses of formic acid in liquid chromatography-mass spectrometry analysis. Advances in Chemistry Research 2013; 20, 16.
[32] CP Shelor, K Yoshikawa and PK Dasgupta. Automated programmable generation of broad pH range volatile ionic eluents for liquid chromatography. Analytical Chemistry 2021; 93(13), 5442-5450.
[33] W Yang, W Si, J Zhang, M Yang, H Pan, J Wu, S Qiu, C Yao, J Hou, W Wu and D Guo. Selective and comprehensive characterization of the quinochalcone C-glycoside homologs in Carthamus tinctorius L. by offline comprehensive two-dimensional liquid chromatography/LTQ Orbitrap MS coupled with versatile data mining strategies. RSC Advances 2016; 6(1), 495-506.
[34] M Gilar and UD Neue. Peak capacity in gradient reversed-phase liquid chromatography of biopolymers: Theoretical and practical implications for the separation of oligonucleotides. Journal of Chromatography A 2007; 1169(1-2), 139-150.
[35] Z Zhang, R Liu, X Pu, Y Sun and X Zhao. Evaluation of the sub-chronic toxicity of a standardized flavonoid extract of safflower in rats. Regulatory Toxicology and Pharmacology 2017; 85, 98-107.
[36] VA Kurkin. Saffloroside, a new flavonoid from flowers of Carthamus tinctorius L. Journal of Pharmacognosy and Phytochemistry 2015; 4(1), 29-31.
[37] F Mirzajani, F Bernard, SM Zeinali and R Goodarzi. Identification of hydroxy-safflor yellow A, safflor yellow B, and precarthaminin safflower using LC/ESI–MSMS. Journal of Food Measurement and Characterization 2015; 9, 332-336.
[38] QD Do, AE Angkawijaya, PL Tran-Nguyen, LH Huynh, FE Soetaredjo, S Ismadji and YH Ju. Effect of extraction solvent on total phenol content, total flavonoid content, and antioxidant activity of Limnophila aromatica. Journal of Food and Drug Analysis 2014; 22(3), 296-302.
[39] E Espada-Bellido, M Ferreiro-Gonzalez, C Carrera, M Palma, JA Alvarez, GF Barbero and J Ayuso. Extraction of antioxidants from blackberry (Rubus ulmifolius L.): Comparison between ultrasound- and microwave-assisted extraction techniques. Agronomy 2019; 9(11), 745.
[40] YY Sim, WTJ Ong and KL Nyam. Effect of various solvents on the pulsed ultrasonic assisted extraction of phenolic compounds from Hibiscus cannabinus L. leaves. Industrial Crops and Products 2019; 140, 111708.
[41] R Duraisamy, T Shuge, B Worku, AK Berekete and KM Ramasamy. Extraction, screening and spectral characterization of tannins from Acacia xanthophloea (fever tree) bark. Research Journal of Textile and Leather RJTL 2020; 1(1), 1-10.
[42] F Medini, H Fellah, R Ksouri and C Abdelly. Total phenolic, flavonoid and tannin contents and antioxidant and antimicrobial activities of organic extracts of shoots of the plant Limonium delicatulum. Journal of Taibah University for Science 2014; 8(3), 216-224.
[43] M Aourach, AV González-de-Peredo, M Vázquez-Espinosa, H Essalmani, M Palma and GF Barbero. Optimization and comparison of ultrasound and microwave-assisted extraction of phenolic compounds from cotton-lavender (Santolina chamaecyparissus L.). Agronomy 2021; 11(1), 84.
[44] C Slimani, M Fadil, C Rais, R Ullah, Z Iqbal, A Santanatoglia, G Caprioli, M Benjelloum, A Lazraq and A Bouyahya. Optimization of phenolic compounds extraction and antioxidant activity from Moroccan Crocus sativus L. by-products using predictive modeling and Box-Behnken design. Microchemical Journal 2025; 212, 113444.
[45] P Garcia-Oliveira, F Chamorro, J Simal-Gandara, MA Prieto and L Cassani. Improving phenolic compound extraction from Arnica montana flowers through multivariate optimization of heat and ultrasound-assisted methods. Sustainable Chemistry and Pharmacy 2024; 41, 101722.
[46] N Boussetta, E Soichi, JL Lanoisellé and E Vorobiev. Valorization of oilseed residues: Extraction of polyphenols from flaxseed hulls by pulsed electric fields. Industrial Crops and Products 2014; 52, 347-353.
[47] CH Lee, TH Lee, H Ya’Akob, S Wong and HB Jannet. Optimization of ultrasound-assisted extraction of total flavonoids content from the white flowering variety of Melastoma malabathricum. Jurnal Kejuruteraan 2019; 2(1), 91-102.
[48] S Zaidi, N Chaher-Bazizi, T Kaddour, Z Medjahed and N Benaida-Debbache. Optimization of ultrasound-assisted extraction of phenolic compounds from Pistacia lentiscus with the study of their antioxidant and anti-inflammatory potential. Sustainable Chemistry and Pharmacy 2024; 41, 101678.
[49] F Brahmi, F Blando, R Sellami, S Mehdi, LD Bellis, C Negro, H Haddadi-Guemghar, K Madani and L Makhlouf-Boulekbache. Optimization of the conditions for ultrasound-assisted extraction of phenolic compounds from Opuntia ficus-indica [L.] Mill. Flowers and comparison with conventional procedures. Industrial Crops and Products 2022; 184, 114977.
[50] DC Montgomery. Design and analysis of experiments eight edition. John Wiley & Sons, Inc., Hoboken, 2013.
[51] W Setyaningsih, IE Saputro, M Palma and CG Barroso. Stability of 40 phenolic compounds during ultrasound-assisted extractions (UAE). AIP Conference Proceedings 2016; 1755(1), 080009.
[52] N Oo, KA Shiekh, S Jafari, I Kijpatanasilp and K Assatarakul. Characterization of marigold flower (Tagetes erecta) extracts and microcapsules: Ultrasound-assisted extraction and subsequent microencapsulation by spray drying. Foods 2024; 13(15), 2436.
[53] F Chemat, N Rombaut, AG Sicaire, A Meullemiestre, AS Fabiano-Tixier and M Abert-Vian. Ultrasound assisted extraction of food and natural products. Mechanisms, techniques, combinations, protocols and applications. A review. Ultrasonics Sonochemistry 2017; 34, 540-560.
[54] S Kittibunchakul, P Temviriyanukul, P Chaikham and V Kemsawasd. Effects of freeze drying and convective hot-air drying on predominant bioactive compounds, antioxidant potential and safe consumption of maoberry fruits. LWT 2023; 184, 114992.
[55] D Nowak and E Jakubczyk. The freeze-drying of foods—the characteristic of the process course and the effect of its parameters on the physical properties of food materials. Foods 2020; 9(10), 1488.
[56] A Fudholi, MY Othman, MH Ruslan and K Sopian. Drying of Malaysian Capsicum annuum L . (red chili ) dried by open and solar drying. International Journal of Photoenergy 2013; 2013, 167895.
[57] YH Yang, HW Zhou and ZZ Du. Effect of drying methods on aroma, taste and antioxidant activity of Dendrobium officinale flower tea: A sensomic and metabolomic study. Food Research International 2024; 187, 114455.
[58] J Miao, J Liu, X Gao, F Lu and X Yang. Effects of different drying methods on chemical compositions, antioxidant activity and anti-α-glucosidase activity of Coreopsis tinctoria flower tea. Heliyon 2022; 8(11), 11784.
[59] H Chaaban, I Ioannou, L Chebil, M Slimane, C Gerardin, C Paris, C Charbonnel, L Chekir and M Ghoul. Effect of heat processing on thermal stability and antioxidant activity of six flavonoids. Journal of Food Processing and Preservation 2017; 41(5), 13203.
[60] F Zhao, P Wang, Y Jiao, X Zhang, D Chen and H Xu. Hydroxysafflor yellow A: A systematical review on botanical resources, physicochemical properties, drug delivery system, pharmacokinetics, and pharmacological effects. Frontiers in Pharmacology 2020; 11, 579332.
[61] KA Gaidhani, M Harwalkar, D Bhambere and PS Nirgude. Lyophilization/freeze drying - A review. World Journal of Pharmaceutical Research 2015; 4(8), 516-543.
[62] J Xiao. Recent advances on the stability of dietary polyphenols. eFood 2022; 3(3), 21.