Trends
Sci.
2026;
23(7):
12579
Green Synthesized and Characterized Silver Nanoparticle Modified Screen Printed Carbon Electrode for Cyclic Voltammetric Simultaneous Determination of Cd and Cu
Rachmin
Munadi1,
Abdul Wahid Wahab2,*,
![]() ,
Abdul Karim2
and
Fatimah Fatimah3,
,
Abdul Karim2
and
Fatimah Fatimah3,
![]()
1Department of Chemistry, Faculty of Natural and Sciences, Islamic University of Makassar,
Makassar 90245, Indonesia
2Department of Chemistry, Faculty of Natural and Science, Hasanuddin University, Makassar 90245, Indonesia
3Department of Medical Laboratory Technology, STIKES Panrita Husada, Bulukumba 90245, Indonesia
(*Corresponding author’s e-mail: [email protected])
Received: 8 November 2025, Revised: 15 December 2025, Accepted: 22 December 2025, Published: 5 March 2026
Abstract
Over the past few decades, nanoscience has gained prominence in green plant-mediated nanoparticle synthesis due to its eco-friendly, easy-to-use, and cost-effective properties. This study was conducted to synthesize silver nanoparticles using red ginger leaf extract as a capping agent and natural reducing agent, and to characterize them. We also evaluated the development of green-synthesized silver nanoparticles (AgNPs-RGL) to modify the Screen Print Carbon Electrode (SPCE) for the simultaneous cyclic voltammetric determination of Cd and Cu. The formation of AgNPs-RGL was visually confirmed by discoloration from yellow to brownish-yellow. UV-Visible analysis reveals a surface plasmon resonance band at 439.5 - 444 nm, which remains stable during the 7-day incubation period. AgNPs-RGL particles have a cubic face-centered shape, an average size of 53.6 nm, and are well distributed, with a polydispersity index of 0.278. EDX analysis confirmed silver (51.1%) as the dominant element, with several other components, including carbon, oxygen, and nitrogen. FTIR analysis confirmed the capping of AgNPs with phytochemicals from the leaf extract. AgNPs-RGL has the potential to be developed as an SPCE modifier for the simultaneous determination of Cd and Cu, providing simple, fast, accurate, and highly sensitive results using cyclic voltammetry. The limits of detection for Cu and Cd are 7.75 and 1.28 ppm, respectively. The sensitivities are 0.199 and 1.206 μAppm−1mm−2, respectively. The accuracies are 42.7% and 85.6%, respectively. These findings show that cyclic voltammetry using SPCE/AgNPs for Cu determination is more sensitive but less accurate. In contrast, Cd determination is less sensitive but more accurate.
Keywords: Electrochemical sensor, Nanomaterials, Green synthesis, SPCE, AgNPs, Cadmium, Copper
Introduction
Nanotechnology is a new field of research, especially in biotechnology. Nanoparticles are a part of nanotechnology that attracts attention because they can be produced in various sizes, shapes, and chemical compositions, and applied in many fields [1]. Metal nanoparticles are the most researched nanomaterials due to their ease of synthesis and their wide range of applications, including use as detectors, catalysts, surface coating agents, and antibacterial agents. Silver nanoparticles (AgNPs) are a type of metal nanoparticle
that has recently attracted the attention of researchers. Due to their very high extinction coefficient and optical properties, which depend on size, shape, composition, the medium dielectric constant, and the distance between particles, silver nanoparticles are among the most widely used metal nanoparticles [2].
The synthesis of nanoparticles is studied extensively by chemical and physical methods. Nanoparticle synthesis is a physically demanding and economically expensive technique. Meanwhile, chemical methods are often used to produce nanoparticles because the manufacturing process is more straightforward and can be scaled up. Still, they generate hazardous waste and require high energy consumption, thereby encouraging the development of environmentally friendly, low-cost nanoparticle synthesis methods [3]. Therefore, a technique known as green chemistry, which utilizes plant extracts as bioreductants for nanoparticle synthesis, was developed. This method can produce nanoparticles with better morphology and stability [4]. Plant extracts have been widely used to produce AgNPs, such as Abutilon indicum [5], Moringa oleifera [6], Annona muricata [7], and Ctenolepis garcinii L. [8]. In the synthesis of AgNPs, plant extracts are used to reduce Ag+ species to Ag0. Terpenoids, ketones, aldehydes, amides, and carboxylates are examples of secondary metabolites from plants involved in this process [9,10]. One plant that produces secondary metabolites is red ginger, as shown in Figure 1. Red ginger, as an exogenous antioxidant or natural antioxidant, is the most widely used and abundant type of spice in the world [11].
The red ginger plant contains several secondary metabolites in the form of flavonoids, phenolics, terpenoids, ketones, and aldehydes [12]. Biomolecules such as phenolics, terpenoids, sesquiterpenes, and flavonoids present in plant extracts act as silver nanoparticle-reducing substances [13]. Natural materials containing secondary metabolite compounds can reduce silver ions and functional groups, such as hydroxyl (-OH) and amine (-NH) groups, thereby contributing to the reduction of silver ions to AgNPs as a reducing agent [14]. The use of ginger plants as a reducing agent in the synthesis of silver nanoparticles was reported by a previous researcher [15], who used red ginger rhizome water extract to synthesize silver nanoparticles and assess their antibacterial activity. However, using parts of the red ginger plant, such as its leaves, has never been done before. Research on the synthesis of silver nanoparticles using ginger leaf water extract inhibitors has been done before. Still, the reducing agent used is another type, namely the white ginger leaf Zingiber officinale [16], not the red ginger leaf Zingiber officinale Roscoe.var rubrum. Thus, the creation of silver nanoparticles could benefit from the use of red ginger leaves (Zingiber officinale rosc.var rubrum) as a reducing agent. The silver nanoparticles that form show a color shift from clear to brownish-yellow. The stability, size, and morphology of silver nanoparticles were then assessed using a UV-Vis Spectrophotometer, Particle Size Analyzer (PSA), X Ray Diffraction (XRD), Fourier Transform-Infrared Spectroscopy (FTIR), and Scanning Electron Microscopy-Energy Dispersive X-ray Spectroscopy (SEM- EDX).
Heavy metal ions (HMIs) are highly hazardous, non-biodegradable, and thus harmful to humans and ecological systems [17]. HMIs are pervasive in natural resources such as water, food, soil, and several organisms. HMIs are known to slowly intensify and produce harmful effects in animals [18]. Furthermore, HMIs are poisonous to humans and can cause severe illnesses, such as neurogenic illnesses, cancer, and liver and kidney damage [19]. Therefore, HMI detection is crucial. Heavy metals are pollutants originating from both industrial and household waste products and have a significant impact on the sustainability of ecosystems. Heavy metals are among the waste products of industrial activities and are harmful and toxic pollutants [20]. Heavy metals produced from industrial waste, often found as pollutants in water, include cadmium and copper. Cadmium and copper are heavy metals whose benefits to organisms living in water are not yet fully understood. However, if the levels of Cd and Cu exceed a certain threshold, they can interfere with the survival of aquatic organisms and affect human health [21].
Various analytical methods, such as spectrophotometer instruments, can be used to analyze heavy metal content, but the operational costs are high. For this reason, it is necessary to develop methods that are highly accurate, sensitive, selective, and relatively inexpensive to operate - namely, sensors. Voltammetry is one of the most widely used electrochemical sensor methods today [22]. The voltammetry technique, in terms of its use, is a simple analysis method that does not require complex preparation steps, requires few reagents, and is fast in detection [23]. This makes the voltammetry technique widely used for detecting heavy metals, such as cadmium and copper [24-27], as demonstrated by Liu et al. [24].
The development of electrochemical research on heavy metal analysis has demonstrated that metal nanoparticles and metal oxides can enhance the selectivity and sensitivity of electrodes, thereby improving the detection of environmental contaminants, including heavy metals [28]. Among the metal nanoparticles widely used as matrices in sensors for heavy metal analysis are silver nanoparticles. The research conducted by Pérez-Ràfols et al. [29] used silver nanoparticles as a droplet for the determination of Cd and Pb by voltammetry. [30] used silver nanoparticles to detect Cd by differential pulse voltammetry (DPV), resulting in a sensor with a detection limit of 0.277 μM. Another study by Zhou et al. [31] used silver nanoparticle composites with 4-mercaptobenzoic acid to detect Cu2+ with an electrochemical sensor, yielding a linear range of 0.1 - 100 nM and a detection limit of 0.08 nM. Another study by Chen et al. [32] utilized silver nanoparticle composites with reduced graphene oxide (RGO) to detect Cu2+, Cd2+, and Hg2+ ions via cyclic voltammetry. Some results from this study show that silver nanoparticles can be used as supporting nanomaterials in Cd and Cu metal sensors.
Silver nanoparticles modified with electrodes exhibit excellent electrical conductivity and analyte adsorption capacity, which can improve sensitivity and selectivity, as well as exhibit enjoyable electrocatalytic activity [33] because the smaller the particle size, the larger the surface area, allowing the target to interact with the sensor faster and detect more sensitively [34]. In addition, silver nanoparticles can increase anodic peak currents by 4 times compared to ordinary electrodes, resulting in excellent selectivity, stability, and reproducibility in the measurement of analytes [35]. Silver nanoparticles added to the electrode can accelerate analyte oxidation and electron transfer, thereby improving the electrode’s electrochemical performance for analyte measurements [36].
Modifications of AgNPs have been reported to improve the performance of carbon printing electrodes [37], screen-printed carbon electrodes [29], and graphene electrodes [38] for detecting low concentrations of cadmium and copper contamination. In this study, modifications of AgNP were performed to improve the performance of the Screen-Printed Carbon Electrode (SPCE). This device has gained increasing attention in recent decades due to its portability, low production cost, and ease of use [39]. SPE is configured as a complete miniature electrochemical cell, typically consisting of 2 or 3 electrodes: A working electrode, a counter electrode, and a reference electrode [40]. SPCE is one of the most widely used SPEs, and because it can be mass-produced, it is low-cost and highly reproducible [41]. The use of SPCE in electrode modification for heavy metal analysis by voltammetry has been reported by previous researchers. The research conducted by Amare et al. [37] used AgNPs to modify a Carbon Printed Electrode (CPE/AgNPs) for the determination of Cd by Square Wave Anodic Stripping Voltametry (SWASV). Likewise, Pérez-Ràfols et al. [29] used SPCE/AgNPs for the determination of Cu by Stripping Voltage (SV). In this study, silver nanoparticles were used to modify SPCE for the determination of Cd and Cu by Cyclic Voltammetry (CV), a method previously unreported. The CV method is by far the most widely used technique, providing important physical and chemical features, such as redox reactions at the electrode surface, reaction reversibility, insights into reaction mechanisms, kinetics, and adsorption processes [42-44]. Inspired by the good properties of green synthesis silver nanoparticles, the great features of screen-printing technology, and the advantages of electrochemical sensor methods in heavy metal analysis, we report for the first time the determination of Cu and Cd by silver nanoparticle-based screen-printing electrodes by Cyclic Voltametry.
Materials and methods
The plant material used in this study is fresh red ginger leaves (Zingiber officinale Rosc. var. rubrum) collected from the botanical garden of the Makassar Traditional Health Center, Indonesia, as shown in Figure 1. Other ingredients were AgNO3 (99.8% purity), purchased from Merck; 2% acetic acid, CH3COONa·3H2O (Merck); Cd(NO3)2·4H2O (Merck); Cu(NO3)2·3H2O (Merck); Whatmann filter paper No. 42; and aluminum foil, double-distilled water (Water One). The instruments used in this investigation were analytical scales (Acculab), pH meters (Hanna Instruments HI9813-6), laboratory standard glassware (Pyrex), hot plates, magnetic stirrers, and a Freeze Dryer (Buchi 190). The Metrohm Screen Printing Carbon Electrode (DRP-C110-U75) is used in conjunction with the DropSens μStat 400 Potentiostat (DropSens, Spain), which is equipped with the DropView 8400 software for data collection and analysis.
Red ginger leaf water extract preparation
The part of the plant used for the synthesis process is the red ginger leaf (Figure 1). Red ginger leaves are harvested in quantities of up to 200 g, thoroughly washed with double-distilled water, and then dried. Once dry, finely chop, weighed to the nearest 5 g, and then brought to a boil in a 250 mL beaker with 100 mL of aquabides, weight ratio of ginger leaves: water (1:20). After that, the mixture is left to boil for 15 min to maximize the extraction process which can increase the release of bioactive compounds from within the red ginger leaves. Fifteen min is considered sufficient to extract phytochemicals from the leaves. Extraction time is too long, which can damage polyphenols and flavonoids in the leaves; if it is too short, the extraction process is suboptimal. This synthesis procedure is in accordance with that carried out by Roddu et al. [45], who synthesized silver nanoparticles from bay leaf extract. Whatman paper No. 42 is used to filter the leaf extract solution after it reaches room temperature. The leaf extract solution can be stored in the refrigerator when not in use or immediately used for the synthesis process [43].
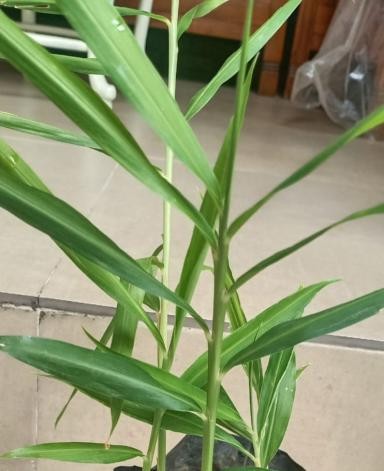
Figure 1 Red ginger leaf.
Synthesis of silver nanoparticles using red ginger leaf extract (AgNPs-RGL)
Mix up to 1 mL of red ginger leaf decoction into 90 mL of a 1 mM AgNO3 (Merck) solution (Ratio of extract: AgNO3 (1:90), stir for 2 h at room temperature, and observe the solution turn brownish-yellow. The discoloration indicates that silver nanoparticles have formed.
Characterization of AgNPs-RGL
The success of the synthesized silver nanoparticles (AgNPs-RGL) was determined by characterization using the Spektrofotometer UV Visible (Shimadzu UV-2600), Particle Size Analyzer (PSA) Horiba SZ-100, Fourier Transform Infrared (FTIR) Shimadzu 820 IPC, X Ray Diffraction (XRD) Shimadzu 7000, Scanning Electron Microscopy (SEM) Tescan Vega, and Energy-Dispersive X-ray from Oxford Instrument (EDX). AgNPs-RGL solutions are characterized using UV-Visible Spectrophotometers and PSA, while for characterization by FTIR, XRD, and SEM-EDX, the AgNPs-RGL solution is first dried in a freeze dryer at −53 °C and 0.8 Mbar [43]. Characterization used a UV-Vis spectrophotometer over 400 - 700 nm to determine whether there was absorption in the wavelength region characteristic of silver nanoparticles. In addition, UV Vis spectrophotometry was also used to assess the stability of silver nanoparticles for 7 days. Furthermore, characterization was carried out using PSA at 25° and 90° scattering angles to determine the particle size and distribution of the resulting AgNPs-RGL. Furthermore, AgNPs-RGL was analyzed by FTIR over the range of 4,000 - 500 cm−1 to identify functional groups that play an essential role in nanoparticle formation. Further characterization used XRD with Cu Kα radiation and a range of 2θ (35° to 80°), to investigate the crystallinity of AgNPs-RGL. The crystallite size of AgNPs-RGL is determined using the Debye-Scherrer Eq. (1) [44].
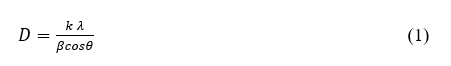
where D represents the average crystallite particle size, λ represents the X-ray wavelength of 0.154 nm, θ is the Bragg angle, β is the Maximum half-width (FWHM), and k = 0.9 represents the form factor. Furthermore, to determine the surface morphology and elemental composition of AgNPs-RGL, characterization was carried out using SEM-EDX at an Accelerating Voltage of 15 kV and a Magnification of 5000x. The process of AgNPs-RGL synthesis and characterization is schematically shown in Figure 2.
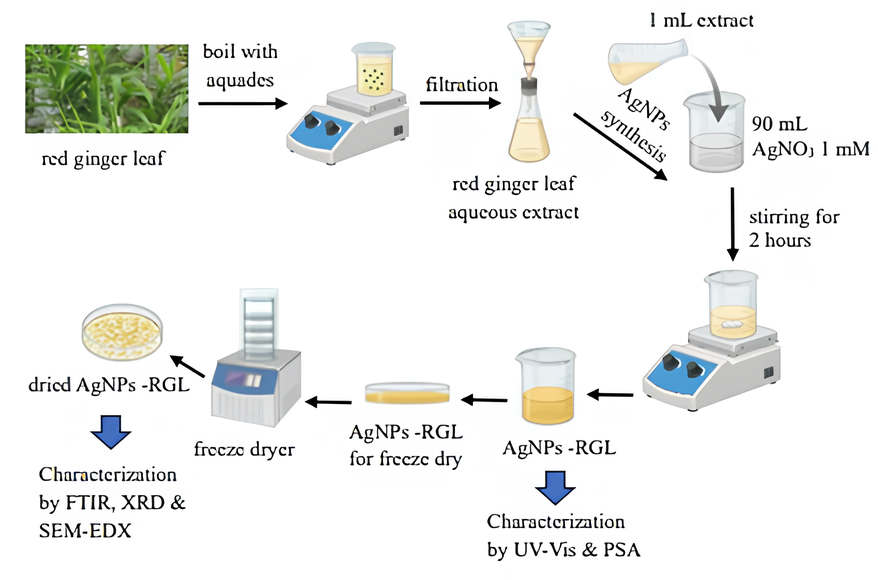
Figure 2 Schematic illustration of the synthesis and characterization of AgNPs-RGL.
Preparation of SPCE electrodes modified AgNPs-RGL (SPCE/AgNPs)
SPCE/AgNPs are used as working electrodes, prepared by the drop-casting method: 3 drops of AgNPs solution are dropped onto the SPCE surface and dried in the oven for 30 min at 50 °C. Furthermore, the electrodes are ready for analysis. Before analysis, SPCEs/AgNPs are rinsed with double-distilled water.SPCE without AgNPs is used as a bare electrode (i.e., an unmodified electrode). The modified electrodes have been rinsed with aquabidest and stored in a dry, closed container (dark vial) to maintain electrode stability. With proper storage, the electrodes will remain stable, avoiding oxidation, aggregation, and degradation of the AgNPs capping layer, thereby preserving the electrode’s catalytic performance [46].
Electrochemical measurements for Cd and Cu
Electrochemical measurements for the Cd metal sensor were performed using cyclic voltammetry (CV) with the DropSens μStat 400 Potentiostat (DropSens, Spain) and the DropView 8400 software for data collection. The electrodes used are SPCE/AgNPs (DRP-C110-U75) from Metrohm, Indonesia, which consists of a working electrode and an auxiliary electrode made of carbon, and a reference electrode of Ag/AgCl. Electrochemical treatment of SPCE/AgNPs was carried out in an acetate buffer solution of 0.1 M, pH 4.5, and a metal solution of Cd in a potential range of +0.15 to −1.1 V, while Cu was used in a potential range of +1 to −1 V, with a scan rate of 50 mV/s. CV measurement of Cd at a scan rate variation of 40 - 160 mV/s and a variation of Cd concentration at 10 - 150 ppm. Meanwhile, CV measurements on Cu were performed over a scan rate range of 60 - 160 mV/s and a Cu concentration range of 10 - 125 ppm. The calibration curve is obtained by plotting the metal concentration against the current. Sensitivity and detection limits are determined from the linear range of each electrode’s calibration curve. Measurements were also carried out on samples of artificial waste. Table 1 summarizes scientific articles on various electrodes decorated with green-synthesized silver nanoparticles for sensor assays in voltametric detection of heavy metals.
Table 1 Survey of the reviewed green synthesis of silver nanoparticles-based voltametric sensors for the detection of heavy metal ions.
No. |
Plant |
Sensor design |
Detection methode |
Analyte |
Reference |
1. |
Arbutus andrachne |
AgNPs/FA/PGE |
CV |
Hg 2+ |
[47] |
2. |
Ocimum sanctum |
AgNPs/CPE |
SWASV |
Cd2+, Pb2+ |
[37] |
3. |
Agaricus bisporus |
AgNPs-Pt |
DPV |
Hg 2+ |
[48] |
4. |
Mimosa diplotricha |
AgNPs-Pt |
DPV |
Hg 2+ |
[49] |
5. |
Curcuma longa |
AgNPs/AuE |
DPV |
Hg 2+ |
[50] |
6. |
Allium sativum |
AgNPs-Pt |
DPV |
Cd 2+ |
[30] |
7. |
Artemisia |
AgNPs/PANI/CPE |
SWV |
Pb 2+ |
[51] |
8. |
Moringa-oleifera |
AgNPs/PE |
DPV |
Cu 2+ |
[52] |
9. |
Lycopersicon-esculentum |
AgNPs-Pt |
DPV |
Cr 3+ |
[53] |
10. |
Hydrocolyte umbellata |
AgNPs/Dithizone/Chitosan |
SWASV |
Hg 2+ |
[54] |
11. |
Grape Stalk |
AgNPs/SPCNFE |
SV |
Cd2+ , Pb2+ |
[55] |
12. |
Saffron |
AgNPs/CPE |
ASV |
Cd2+, Cu2+, Pb2+ |
AgNPs: Silver nanoparticles; FA: Folic Acid; PGE: Pencil Graphite Electrode; Pt: Platinum electrode; PANI: Polyaniline; CPE: Carbon Paste Electrode; PE: Paste Electrode; AuE: Gold electrode; SWV: Square Wave Voltammetry, SWASV: Square Wave Anodic Stripping Voltammetry, CV: Cyclic Voltammetry; DPV: Differential Pulse Voltammetry, SV: Stripping Voltammetry, ASV: Anodic Stripping Voltammetry, SPCNFE: Screen Printed Carbon Nano Fiber Electrode.
Solution preparation
Acetate buffer solution 0.1 M pH 4.5 is prepared by mixing the appropriate volume of equi-molar solution (0.1 M) CH3COONa and CH3COOH in deionized water and adjusted pH to 4.5 using HCl and NaOH solution 0.1 M. Cd 1,000 ppm parent solution is made by carefully weighing 2.74 g of Cd (NO3)2·4H2O and then dissolved with aquabides and then diluted to a volume of 1 L. Next, dilutions are carried out to obtain standard solutions at 10, 25, 50, 75, 100, 125 and 150 ppm in 0.1 M acetate buffer, pH 4.5. A 1,000ppm parent solution is prepared by carefully weighing 3.81 g of Cu(NO3)2.3H2O, dissolving it in double-distilled water, and then diluting to 1 L. Next, dilutions are carried out to obtain standard solutions at 10, 25, 50, 75, 100, 125 and 150 ppm in 0.1 M acetate buffer, pH 4.5. All solutions are prepared using aquaabides (WaterOne).
Sample preparation and analysis
Sample that used in this study are artificial sample, where Cd samples are prepared by adding a standard Cd solution at 10 - 125 ppm in an acetate buffer (0.1 M, pH 4.5) into the river water and the concentration of Cd is measured by cyclic voltammetry using SPCE/AgNPs and Atomic Absorption Spectrophotometer (AAS), to compare measurement results and determine the accuracy of the sensor Cd. The same procedure is also done for the Cu sensor.
Results and discussion
Characterization of AgNPs-RGL
Silver nanoparticles are synthesized by mixing red ginger water extract with 1 mM AgNO3 solution. AgNO3 dissociates in water to produce Ag+. Bioactive compounds, which have been obtained from phytochemical screening results, show that red ginger leaf extract contains flavonoid compounds, tannins, steroids, and saponins [57], which play a role in the process of reducing Ag+ ions to Ag0. Several previous studies have also reported that bioactive compounds contained in plants can be lowering agents in the formation of silver nanoparticles [58-63]. Bioactive compounds from red ginger leaf water extract that have -OH groups, such as flavonoids, tannins, steroids, and saponins, undergo oxidation by releasing electrons, reducing the Ag+ in 1 mM AgNO3 solution to Ag0. The successful formation of silver nanoparticles is indicated by a color change from yellow to brownish-yellow. This color change has also been confirmed in previous studies on the biosynthesis of silver nanoparticles [64-68].
AgNPs-RGL is growing steadily, and the bioactive compounds in the extract will prevent aggregation by maintaining the size of the silver nanoparticles formed. The content of bioactive compounds, such as phenolic compounds, flavonoids, tannins, steroids, and saponins, in red ginger leaf extract, apart from being a reducing agent, also acts as a capping agent, maintaining the stability of the silver nanoparticles formed [69-72]. In addition to secondary metabolites such as phenolics, terpenoids, and flavonoids, biomolecules with aldehyde functional groups, carboxylic acids, and amides also act as reducing and stabilizing agents for nanoparticles [73].
Preliminary observations indicating the success of the synthesized nanoparticles are evident from the color change of the AgNPs-RGL solution from yellow to brownish-yellow, as shown in Figure 3(d). This discoloration is a characteristic of silver nanoparticles [74]. The discoloration of this solution is caused by the excitation effect of Surface Plasmon Resonance (SPR) on the surface of silver nanoparticles [75]. In addition to the color change of the solution, the success of the AgNPs-RGL synthesis process can be confirmed by characterization results obtained using a UV-Vis Spectrophotometer, PSA, FTIR, XRD, and SEM-EDX.
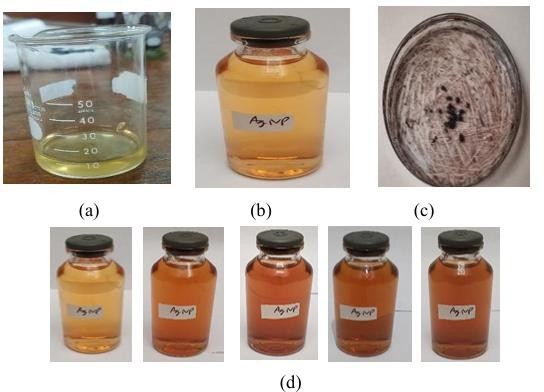
Figure 3 Figure (a) Red ginger leaf extract; (b) AgNPs-RGL Solution; (c) Dry AgNPs-RGL. (d) Discoloration of AgNPs-RGL for 7 Days (Days 1 to 7, consecutively).
UV-Visible spectroscopy characterization
Characterization with a UV-Visible spectrophotometer was performed on red ginger leaf extracts (Figure 3(a)) and AgNPs-RGL (Figure 3(b)) with a wavelength range of 300 - 700 nm. The appearance of a maximum in the 400 - 450 nm region indicates the presence of silver nanoparticles [76]. The results of UV Vis AgNPs-RGL analysis on the first day showed a maximum absorbance at 439.5 nm (0.096). Meanwhile, the maximum absorption of red ginger leaf extract occurs at 326.50 nm. Furthermore, to determine the stability and effect of incubation time on the SPR value and the size of the nanoparticles produced, the nanoparticles were measured by absorption from the first day to the seventh day. The results of SPR intensity and position measurements were influenced by the properties of the nanoparticles (size and shape), the distance between particles, the adsorbed functional groups on the nanoparticle surfaces, and the dielectric constant [77,78].
Table 2 shows the shift in the wavelength of AgNPs-RGL over 1 - 7 days of incubation, from 439.5 to 444 nm, showing that the resulting AgNPs-RGL have good stability because the wavelength shift from day 1 to day 7 is not significant and is still in the wavelength region of silver nanoparticles (400 - 450 nm). According to Sirajuddin [79], the stability of nanoparticles can be determined by insignificant wavelength shifts, which remain within the typical characteristics of silver nanoparticles. The SPR peak shift also indicates a change in the size of the silver nanoparticles [80]. The absorption bands of the resulting silver nanoparticles shifted to longer wavelengths (bathochromic shifts) during the incubation period, indicating that as the incubation time increased, the nanoparticle size also increased. The absorbance value also increased from day 1 to day 7, from 0.096 to 0.146. The increased absorbance with increasing incubation period indicates an increase in the number of AgNPs-RGL formed [81]. The UV-Vis spectra of silver nanoparticle solutions incubated for 1 to 7 days are shown in Figure 4.
Table 2 Wavelength displacement and change in the intensity of the absorptionance of AgNPs solutions with incubation time.

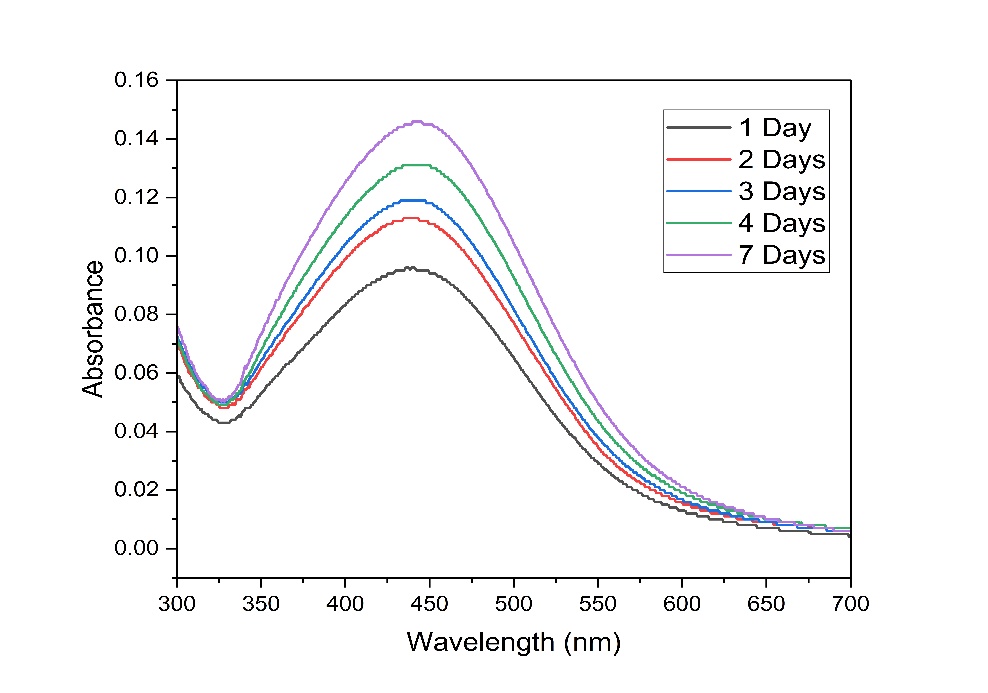
Figure 4 UV Vis spectrum of silver nanoparticle solution with incubation time from 1 day to 7 days.
Fourier Transform-Infrared (FTIR) characterization
Fourier Transform-Infrared (FTIR) assays were performed on dry AgNPs-RGL as a result of freeze-drying using a freeze dryer, as shown in Figure 3(c). The FTIR findings for red ginger leaf extract and silver nanoparticles are shown in Figure 5, where the absorption band in red ginger leaf extract is also present in the AgNPs-RGL absorption band, indicating that the nanoparticles formed still contain red ginger leaf extract, shows that the compounds in red ginger leaf extract are absorbed on the surface of the silver nanoparticles which can stabilize the nanoparticles so that they do not merge into larger particles. The functional groups C-N, -CHO, and -OH are essential for bioreduction processes using plant extracts [82,83]. Dominant absorption was observed at 3,383.14, 2,924.09, 2,392.66, 1,623.64, 1,384.89, 1,049.28 and 526.57 cm−1 in the FTIR spectrum generated by AgNPs-RGL. The −OH stretching vibrations in phenols, alcohols, and flavonoids are indicated by an absorption band of 3,383.14 cm−1 [84]. The absorption band at 2,924.09 cm−1 indicates the presence of -CH3 stretching vibrations, peaks at 2,392.66 cm−1 are considered to be stretches O=C=O (CO2) absorbed from the atmosphere [85], 1,623.64 cm−1 indicates aliphatic -C=C- stretch vibrations, 1,384.89 cm−1 as functional group flexural vibrations -OH [86], peaks at 1,049.28 cm−1 indicate stretching -CO [87] and peaks at 526.57 cm−1 due to C-Cl stretching alkyl halide vibrations [88,89].
The FTIR spectrum of red ginger leaf extract showed intense absorption at 3,356.14, 2,920.23, 2,353.16, 1,653.00, 1,058.92 and 526.57 cm−1. According to these findings, the FTIR band of red ginger leaf extract shifted slightly upon formation of silver nanoparticles. The shift in the spectral peak suggests that the functional group of the leaf extract is essential for binding to silver nanoparticles [90]. Silver nanoparticles can bind functional groups in plant extracts, stabilizing them and preventing aggregation [89]. The shift in all peaks indicates that red ginger leaf extract can serve as a reducing agent for the synthesis of AgNPs-RGL.
Particle size analyzers characterization
The mean size and size distribution of AgNPs-RGL were analyzed using a Particle Size Analyzer (PSA). PSA analysis can also assess the homogeneity of silver nanoparticles, as measured by the Polydispersity Index (PI). The results of the AgNPs-RGL PSA test show that the average particle size of AgNPs-RGL is 53.6 nm, with a polydispersity index value of 0.278, as shown in Figure 6(a). The study found that the resulting AgNPs met the criteria for nanoscale particles (<100 nm). At the same time, the value of the polydispersity index of AgNPs-RGL was close to 0 (zero), indicating that the distribution of the resulting nanoparticles was stable and well distributed, so that the resulting nanoparticles had good particle size distribution and physical stability [91,92]. Figure 6(b) shows the size distribution of AgNPs- RGL, where the resulting silver nanoparticles are in the diameter range of 39.58 - 105.1 nm. The highest percentage of AgNPs-RGL particle sizes is in the 41 - 60 nm diameter range.
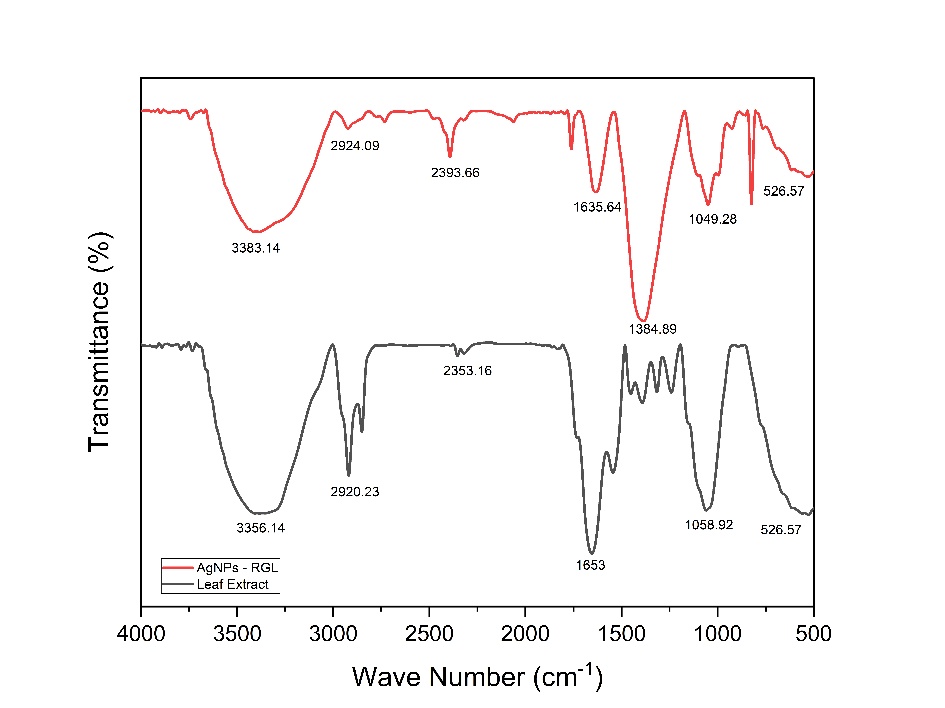
Figure 5 FTIR spectrum of red ginger leaf extract and AgNPs-RGL.
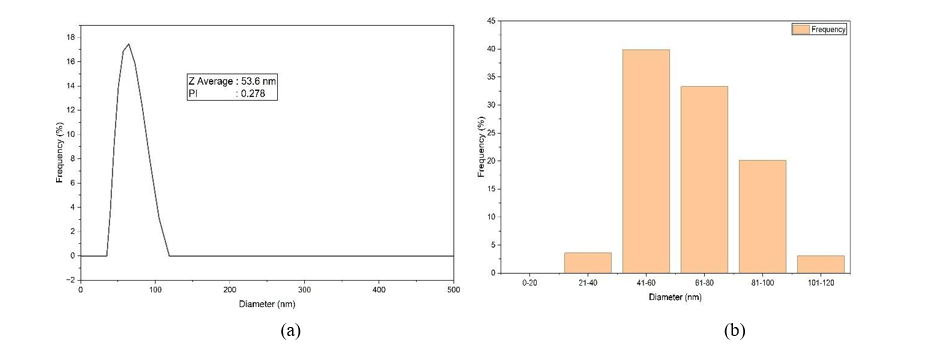
Figure 6 (a) AgNPs-RGL measurement results with PSA; (b) AgNPs-RGL size distribution chart.
X-ray diffraction characterization (XRD)
The results of the x-ray diffraction (XRD) analysis are shown in Figure 7, which presents the AgNPs-RGL diffraction pattern. This pattern provides evidence of the successful synthesis of silver nanoparticles, determines crystallinity, and confirms the amount of AgNPs-RGL produced. The peaks of the AgNPs-RGL diffraction pattern are shown in Figure 7 at 38.799°, 44.028°, 64.402°, and 77.493°, coinciding with grid planes 111, 200, 220, and 311, respectively. The resulting diffraction pattern was then contrasted with the standard data of Diffraction Pattern No. 04-0783, namely the Joint Committee on Powder Diffraction Standards (JCPDS) [90]. The results indicate that silver nanoparticles possess a Face-Centered Cubic (FCC) crystallite structure, with a slight shift in the diffraction peak position attributed to strain [93]. The average crystallite size of AgNPs-RGL was determined using the Debye-Scherrer equation [83] in Eq. (1), yielding an average size of 49.96 nm, as shown in Table 3.
Table 3 Diffractionogram data and crystallite size AgNPs-RGL.
JCPDS 2θ Standard Peak 04-0783 |
2 I This research |
d (Å) |
HKL |
FWHM |
Intensity |
crystallite size (nm) |
38.116 |
37.799 |
2.31911 |
111 |
0.18200 |
36 |
50.37 |
44.277 |
44.028 |
2.05505 |
200 |
0.18400 |
91 |
50.69 |
64.426 77.472 |
64.402 77.493 |
1.44551 1.23076 |
220 311 |
0.20000 0.23240 |
85 71 |
51.04 47.71 |
|
|
Average crystallite size |
|
|
49.96 |
|
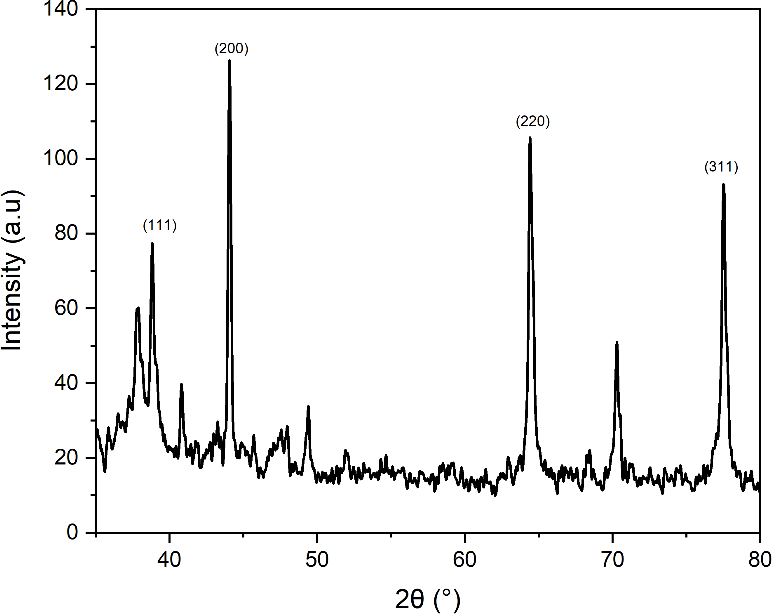
Figure 7 AgNPs-RGL diffraction pattern.
Electron microscopy - energy dispersive x-ray spectroscopy (SEM-EDX)
Figure 8(a) shows the surface morphology of AgNPs-RGL at a size of 5 μm and 5,000× magnification, confirming that AgNPs-RGL are spherical and randomly dispersed. This study reveals that the crystallite skeleton of AgNPs-RGL exhibits a cubic face-centered structure. These results are a consequence of an earlier discovery, which established the cubic structure of silver nanoparticles centered on the face [87,88,94-97]. The EDX spectrum displaying the AgNPs-RGL array of elements is shown in Figure 8(b). Similar to the previous report, which also revealed a typical silver signal at 3 keV [84,88]. The absorption properties of the metal silver are responsible for this signal response [95]. With a weight percentage of 51.1%, silver metals dominate the composition of AgNPs-RGL elements, as shown in Figure 8(b). Meanwhile, other components contained in AgNPs-RGL are 0 (21.1%), N (14.4%), C (10%), K (2.9%), Si (0.2%), Mg, Al, and Na (0.1%). The reasonably high composition of silver suggests that red ginger leaf extract has the potential to contribute to the synthesis of silver nanoparticles. Based on the results of characterization using UV-Vis, PSA, FTIR, XRD, SEM, and EDX, it is shown that AgNPs-RGL has the potential to be used in SPCE modification for the simultaneous determination of Cd and Cu by cyclic voltammetry.
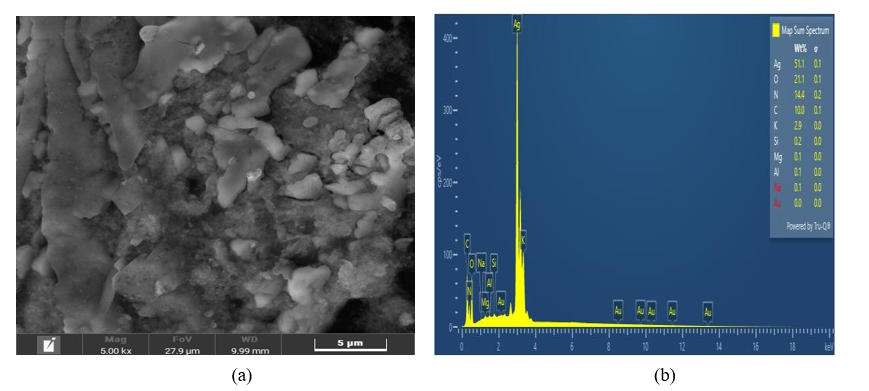
Figure 8 (a) Surface morphology of AgNPs-RGL (b) Spectrum EDX of AgNPs-RGL.
Electrochemical measurements using SPCE/AgNPs
The Cycliv Voltammetry (CV) responses to SPCE/AgNPs and SPCE (bare electrode) are shown in Figure 9. CV measurements were performed in 0.1 M acetate buffer, pH 4.5, at a scan rate of 50 mV/s over a potential range of +1 to −1 V. The anodic peak of SPCE was observed at a current of 10.16 μA. In comparison, the peak of SPCE/AgNPs was observed at a current of 13.51 μA, indicating a higher current response to SPCE/AgNPs compared to SPCE, because the surface area of the modified electrode with AgNPs is much larger than the surface area of the unmodified electrode, so that it can increase the current due to the increase in electron transfer [29,98,99].
Figure 10 shows the CV response of SPCE and SPCE/AgNPs electrodes in a 125 ppm solution of Cd and Cu, with a scan rate of 50 mV/s. Figure 10(a) shows the response of the SPCE electrode to the 125 ppm Cd with a very weak oxidation peak intensity with a current of 1.19 μA, while the SPCE/AgNPs electrode shows a very sharp peak with a current of 34.39 μA. Figure 10(b) shows the response of the SPCE electrode to 125 ppm Cu, with a low oxidation peak intensity (51.07 μA), whereas SPCE/AgNPs electrodes show a very high oxidation peak (109.8 μA).
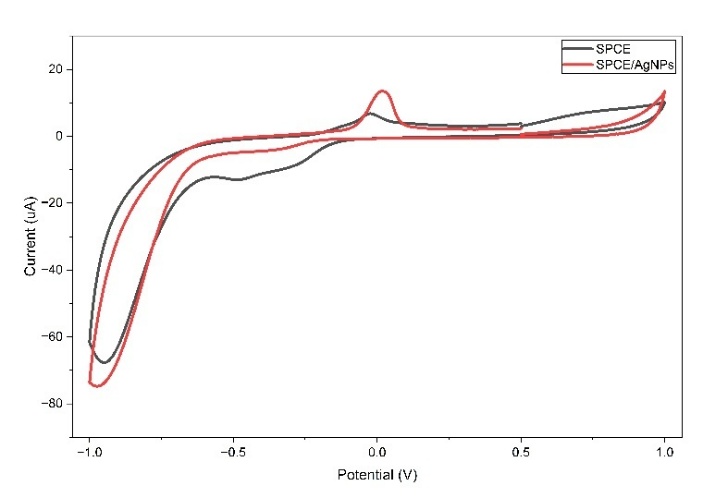
Figure 9 Cyclic voltammograms of SPCE and SPCE/AgNPs at a scan rate of 50 mV/s in an acetate buffer 0.1 M, pH 4.5.
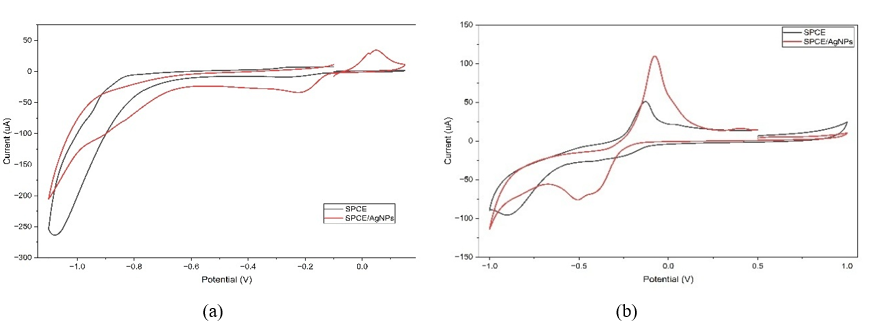 Figure
10 Cyclic voltammograms of (a) Cd 125 ppm, (b) Cu 125 ppm at a
scan rate of 50 mV/s.
Figure
10 Cyclic voltammograms of (a) Cd 125 ppm, (b) Cu 125 ppm at a
scan rate of 50 mV/s.
The properties of AgNPs induce this increase in electrochemical peak currents. Because AgNPs are well-known metal nanoparticles with high conductivity, they can amplify electrochemical signals to clarify current peaks [100]. These results also show that SPCE/AgNPs exhibit vigorous electrocatalytic activity for the oxidation of Cd and Cu. According to Shi et al. [101], the increase in the peak current of metal oxidation on electrodes modified with silver nanoparticles is attributed to the electrocatalytic properties of silver nanoparticles, which enhance conductivity and expand the electrode surface.
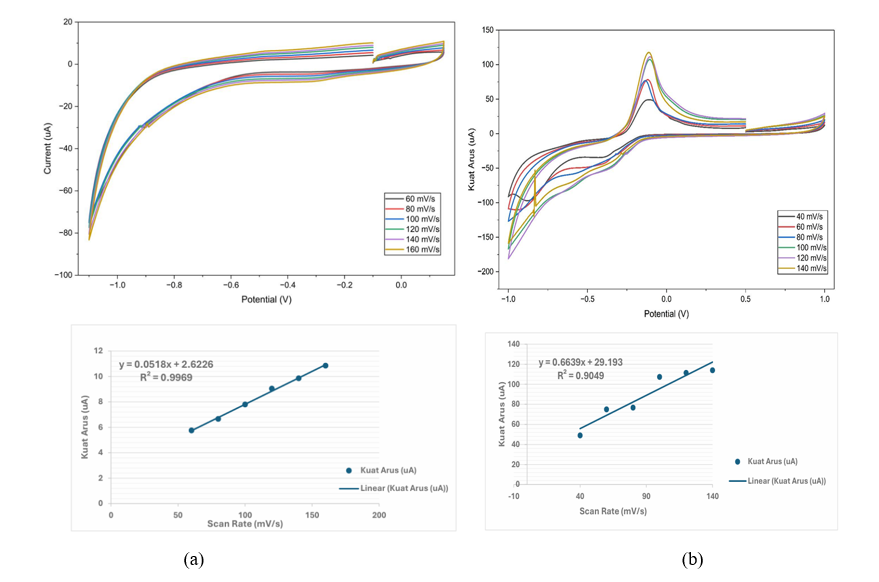
Figure 11 Cyclic voltammograms and linear plot of Cd 125 ppm at scan rate of 60 - 160 mV/s; (b) Cyclic voltammograms and linear plot of Cu 125 ppm at scan rate of 40 - 140 mV/s.
The effect of scan rate on SPCE/AgNPs is determined using CV at a scan rate of 60 -160 mV/s and a scan rate of 40 - 140 mV/s with an interval of 20 mV/s in Cd and Cu solutions of 125 ppm can be seen in Figure 11 which shows the peak of oxidation that has shifted in a positive direction with an increase in the scan rate. The results of these observations indicate that the reactions of Cd and Cu with the electrodes exhibit controlled diffusion, consistent with previous research [26,101,102]. Figure 11 also shows the correlation between the peak current (μA) and the square root of the scan rate (mV/s) 1/2 in the electrodes. Based on Figure 11, a linear relationship between the peak current (μA) and the square root of the scan rate (mV/s) 1/2 is observed, indicating that the reaction rate on the electrode surface is affected by how fast the electron transfer process or reaction occurs on the surface of the electrode modified with silver nanoparticles. The linear plot shows that the modified electrodes exhibit R2 values of 0.9969 for Cd and 0.9049 for Cu.
Figure 12 shows the CV response and linear plot of the SPCE/AgNPs electrodes at various concentrations of Cd, 10 - 150 ppm, and Cu, 10 - 125 ppm, at a scan rate of 50 mV/s. The increase in current can be seen as an increase in the concentration of Cd and Cu. The current at the resulting anodic peak is directly proportional to the concentrations of the standard solutions of Cd and Cu achieved, resulting from the transfer of electrons from the sample (metal solution) to the electrode surface [101,103,104]. The resulting linear plot exhibits a linear relationship within the Cd concentration range of 10 - 150 ppm, yielding a linear regression equation of y(μA) = 0.1569x + 16.755 (R² = 0.928). Meanwhile, the linear plot in the Cu concentration range of 10 - 125 ppm yields a linear regression equation: y(μA) = 0.9468x – 10.992 (R² = 0.974). The data for concentration, current strength, and response time obtained for SPCE/AgNPs are shown in Table 4.
Table 4 Data on concentration, current strength, and response time on SPCE/AgNPs.
Concentration (ppm) |
Current strength (μA) |
Response time(s) |
||
Cd |
Cu |
Cd |
Cu |
|
10 ppm |
18.5333 |
4.2875 |
7.52 |
36.5 |
25 ppm |
21.8362 |
15.64167 |
7.55 |
40.0 |
50 ppm |
22.3421 |
25.99583 |
7.23 |
42.1 |
75 ppm |
27.0292 |
53.35417 |
6.54 |
40.5 |
100 ppm |
36.7250 |
89.47083 |
5.52 |
40.2 |
125 ppm |
34.3958 |
109.80417 |
5.58 |
40.1 |
150 ppm |
40.3875 |
- |
6.02 |
- |
Measurement Range |
1 - 150 ppm |
1 - 125 ppm |
|
|
Linear regression |
y = 0.1569x + 16.755 |
y = 0.9468x – 10.992 |
|
|
Time range |
|
|
5.52 - 7.55 |
36.5 - 42.1 |
In this study, the response time of modified electrodes was determined to assess the electrode’s sensitivity; the shorter the response time to the analyte, the better the electrode [105]. Table 3 shows the SPCE/AgNPs response time data at a scan rate of 50 mV/s, where the response time for Cd metal analysis ranges from 5.52 to 7.55 s, while the response time for Cu analysis ranges from 36.5 to 42.1 s. The current response time to Cd concentrations is shorter than that to Cu, indicating that electrodes are more sensitive to Cd than to Cu.
The detection limit and sensitivity of the modified electrodes are also determined. The following equation [106] was used to determine LOD in this study: LOD = 3 SD/s, where SD is the standard deviation of the blank peak current (6 runs), SD = 0.4052, and s is the slope of the corresponding calibration equation. The detection limit was calculated from the blank solution (electrolyte) and the standard curve relating metal concentration to the electrode’s current. The results of the calculation of the Cd detection limit are 7.75 ppm (0.0689 mM). Meanwhile, the calculated Cu detection limit is 1.28 ppm (0.0201 mM). Based on the results, SPCE/AgNPs can detect Cd at 7.75 ppm (0.0689 mM) and Cu at 1.28 ppm (0.0201 mM).
The high LOD in this analysis indicates that the sensor is unable to produce a signal sufficiently different from the noise at the trace level, so its performance is less than ideal for trace analysis applications [107], can be caused by several factors, including that CV is less sensitive to heavy metal detection at very low levels, compared to stripping techniques such as ASV or SWASV. The limit of detection (LOD) for Cd and Cu analysis by cyclic voltammetry is generally high due to the CV’s low intrinsic sensitivity, especially at trace concentrations. CV does not include a preconcentration stage, so the redox current is tiny and can be easily masked by capacitive current [108]. In SPCE/AgNPs, the peak current produced is relatively small, especially in Cd, making it difficult to distinguish the analyte signal from the noise. Low currents can result from less efficient electron transfer at the electrode surface, a limited active surface area, or electrode modifications that do not form optimal active sites [109]. When the signal current is low, the difference between the signal and baseline becomes small, which ultimately increases the LOD.
Additionally, high baseline noise is another significant factor contributing to increased LOD [110]. Factors such as electrode surface fouling by sample matrix components, instability of the voltammogram baseline, and interference from other compounds can also contribute to increased signal variation [108]. Low sensitivity also contributes to high LOD values. The low sensitivity is reflected in the slight slope of the calibration curve, indicating that changes in analyte concentration result in only a subtle change in current [111]. Additionally, the potential for fouling by biomolecules or organic components can compromise the electrode’s performance. Fouling can inhibit the analyte’s access to the electrode surface, leading to decreased current and increased signal variability [112]. Therefore, although the electrode can measure metals at moderate concentrations, its performance is not yet ideal for trace-level applications and requires further optimization, such as increasing surface modification or utilizing a more sensitive voltammetric stripping technique. Table 5 summarizes scientific articles on silver nanoparticles synthesized by the green method for electrode modification in the determination of Cd and Cu by cyclic voltammetry.
Table 5 Survey of the reviewed silver nanoparticles synthesized by the green method for electrode modification in the determination of Cd and Cu by cyclic voltammetry.
No. |
Sensor design |
Detection methode |
Analyte |
Linear range |
LOD |
Reference |
1. |
AgNPs/CPE |
SWASV |
Cd2+ |
5 - 160 ppm |
0.0891 ppm |
[37] |
2. |
AgNPs-Pt |
DPV |
Cd 2+ |
- |
0.277 μM |
[30] |
3. |
AgNPs/PE |
DPV |
Cu 2+ |
- |
0.530 μM |
[52] |
4. |
AgNPs/SPCNFE |
SV |
Cd2+ |
1.1 - 100.1 µg/L |
2.8 µg/L |
[55] |
5. |
AgNPs/CPE |
ASV |
Cd2+ Cu2+ |
0 - 100 µg/L |
0.38 μg/L, 0.42 μg/L |
[56] |
AgNPs: Silver nanoparticles; Pt: Platinum Electrode; CPE: Carbon Paste Electrode; PE: Paste Electrode; SWASV: Square Wave Anodic Stripping Voltammetry, DPV: Differential Pulse Voltammetry, SV: Stripping Voltammetry, ASV: Anodic Stripping Voltammetry, SPCNFE: Screen Printed Carbon Nano Fiber Electrode.
The sensitivity test is determined by dividing the slope of the linearity curve by the working electrode surface area [55]. Sensitivity tests are conducted to assess a sensor’s sensitivity to analytics. The sensitivity test results for SPCE/AgNPs electrodes for Cd metal analysis were 0.199 µAppm−1mm−2. Meanwhile, the sensitivity value for Cu metal analysis is known to be 1.206 µAppm−1mm−2. These results indicated that modified electrodes are more sensitive to Cu than to Cd. The electrode’s sensitivity is inversely proportional to particle size. The smaller the particle size (up to the optimal size), the higher the electrode’s sensitivity [103]. AgNPs are nanoscale particles with a larger active surface area, enabling the adsorption of more metal ions (Cd2+/Cu2+) and providing more active sites for reactions, resulting in a linear increase in peak currents and high sensitivity [103,113-115]. In addition, with a large surface area, AgNPs can facilitate the oxidation of electroactive species at electrodes by increasing mass transport rates and enabling rapid electron transfer, thereby enhancing electrode sensitivity [103,114,116,117].
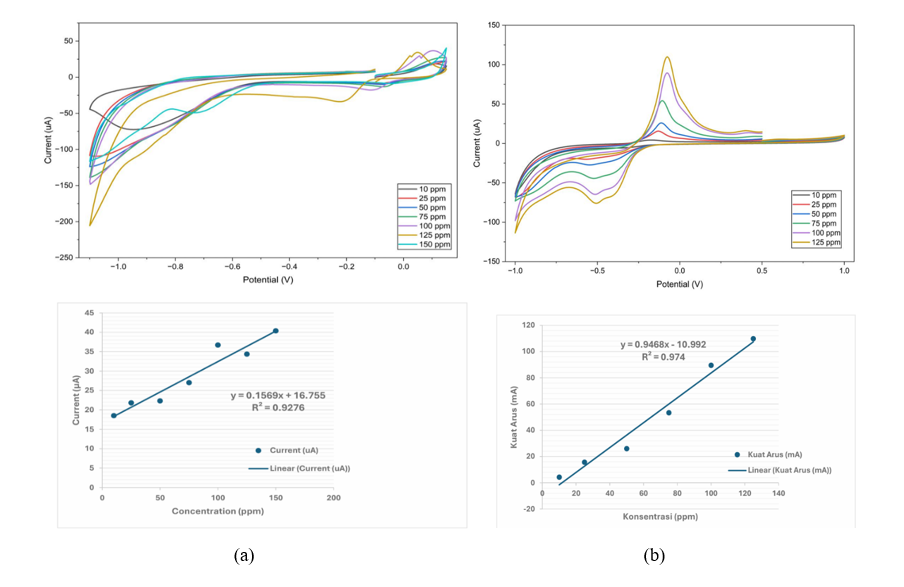
Figure 12 Cyclic voltammograms and linear plot of (a) Cd solution 10 - 150 ppm, (b) Cu solution 10 - 125 ppm at a scan rate of 50 mV/s.
Simultaneous determination of Cd and Cu
Testing of the sample was conducted to determine the modified electrodes’ ability to act as sensors for Cd and Cu. Figure 13 shows the CV response of SPCE/AgNPs electrodes to samples in measuring Cd and Cu concentrations. From the measurement results, the concentrations of Cd and Cu were 42.82 and 30.82 ppm, respectively. The results of this measurement were compared with those from Atomic Absorption Spectrophotometer (AAS) measurements, which showed Cd concentrations of 50 ppm and Cu concentrations of 72.22 ppm. The measurement results using SPCE/AgNPs electrodes were close to those obtained with the AAS instrument, with analysis accuracies of 85.6% for Cd and 42.7% for Cu.
The results of this study show that the accuracy of Cd analysis is higher than that of Cu, even though Cu sensitivity is greater, because the value of the determination coefficient (R2) of the metal Cd based on the linear plot of the relationship between the peak current (Ip) and the square root of the scan rate (ν1/2) is greater (0.9969) than Cu (0.9049). These results show that the Cd redox mechanism at the electrode surface is more stable and consistent under the same solution conditions. Cd does not form many complexes at pH 4.5 and does not cause the formation of an oxide layer that can degrade the ability of the electrodes. The Cd⁰ deposits formed during the reduction process are also relatively easily oxidized again without leaving significant residues on the surface of the electrode. This level of stability then contributes to better Cd measurements, even though the sensitivity is lower. This finding aligns with previous research, which has shown that Cd generally exhibits better signal reproducibility than Cu across various types of modified electrodes [118].
Conversely, although the accuracy of Cu is lower than that of Cd, the sensitivity of the electrode to Cu ions is higher than that of Cd, associated with the value of the slope of the calibration curve in the measurement of Cu (0.6639) being greater than that of Cd (0.0518). Cu generally produces higher peak currents in voltammetric techniques because it exhibits faster electron-transfer kinetics and a tendency to interact more strongly with the surfaces of carbon-based or nanomaterial-modified electrodes [119]. Such a high current response enhances sensitivity.
However, the high peak current does not automatically guarantee high accuracy. Cu has relatively low accuracy because it forms complexes easily with various ligands in aqueous media, including acetate ions at pH 4.5, resulting in diverse chemical speciation. This form of speciation can shift the peak position and reduce the stability of the current. Although selectivity assays did not identify the interferant, the high affinity of Cu for matrix components is sufficient to explain the instability of the response. Additionally, Cu tends to form oxide layers, such as Cu₂O or CuO, on the electrode surface during the oxidation-reduction process, which causes surface fouling and ultimately reduces signal reproducibility. This effect often appears even at low interferent concentrations, so it remains relevant even if a selectivity test was not performed in this study. High sensitivity also means increased response to noise, baseline fluctuations, and electrochemical interference from the matrix, all of which contribute to signal instability [120]. Thus, a more responsive Cu signal is more susceptible to slight variations in measurement conditions, leading to lower accuracy.
The relationship between electrode sensitivity and electron transfer kinetics was further studied by examining the influence of the scan rate. The effect of scan rate variation on Cd and Cu analysis is shown in Figures 11(a) - 11(b). The results obtained revealed that the kinetics of the electrochemical reaction on the electrode surface were affected by the controlled diffusion process [33]. The peak oxidation of SPCE/AgNPs shifted to more positive potentials as the scan rate increased, causing the accumulation of ions near the electrode surface before the redox reaction was complete. This shift indicates that the heavy metal oxidation reaction at the electrode surface is quasi-reversible, as the electrochemical reaction is not fully reversible due to kinetic limitations. These results are consistent with previous research, which has found that in quasi-reversible reactions, the electron transfer velocity is sufficiently high to allow the redox reaction to proceed. However, there are still limitations in electron-transfer kinetics that affect the overall response. The linear relationship between the peak current (ip) and the square root of the scan rate (ν1/2) indicates that the redox reaction is diffusion-controlled, with the analyte diffusing towards the electrode surface [120]. Thus, these findings simultaneously confirm that higher sensitivity does not necessarily correlate directly with accuracy, as accuracy is strongly influenced by signal stability and electrode surface conditions during measurements.
In cyclic voltammetry using SPCE electrodes modified with AgNPs, the simultaneous presence of Cd and Cu leads to competitive adsorption and deposition on the electrode surface. When the 2 ions are present together, they compete for the active sites on AgNPs, resulting in decreased peak currents for each ion and a shift in the peak potential. This phenomenon has been widely observed in multimetallic detection, where Cu tends to exhibit a higher deposition affinity, thereby inhibiting Cd deposition on modified carbon surfaces [120].
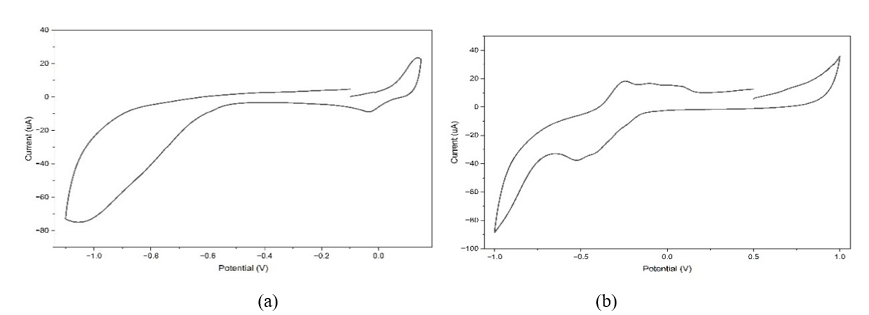
Figure 13 Cyclic voltammograms of samples at a scan rate of 50 mV/s for (a) Cd, (b) Cu.
Conclusions
This study demonstrates the successful synthesis and characterization of silver nanoparticles using a green, easy-to-perform, environmentally friendly, and cost-effective method that employs red ginger leaf extract as both a capping agent and a natural reducing agent. Silver nanoparticles obtained by green synthesis (AgNPs-RGL) were used to modify SPCE for the simultaneous determination of Cd and Cu in river water by cyclic voltammetry. The results of UV-Vis, PSA, FTIR, XRD, and SEM-EDX spectroscopy confirmed the successful synthesis of AgNPs-RGL. The formation of AgNPs-RGL was visually confirmed by a color change and validated by UV-Vis analysis, which showed a surface plasmon resonance band at 439.5 nm, and was stable during the 7-day incubation period. The AgNPs-RGL particles analyzed by PSA have an average size of 53.6 nm and a well-distributed polydispersity index of 0.278. XRD and SEM-EDX analysis revealed the FCC-shaped AgNPs-RGL and identified silver as the dominant element, along with several other elements, including carbon, oxygen, and nitrogen. FTIR analysis confirmed the capping of AgNPs with phytochemicals from the leaf extract, thereby stabilizing their dispersion in aqueous media. AgNPs-RGL has the potential to be developed as an SPCE modifier for the simultaneous determination of Cd and Cu by cyclic voltammetry, owing to its large surface area and higher catalytic activity, resulting in good performance. The SPCE/AgNPs-RGL for Cu analysis offers better sensitivity, detection limits, and stability than Cd, but results in lower accuracy, with 42.7% and 85.6% for Cu and Cd, respectively. These findings show that the cyclic voltammetry method using SPCE/AgNPs-RGL is more sensitive but less accurate, whereas SPCE/AgNPs-RGL is less sensitive but more accurate.
Acknowledgments
For their assistance in this study, we are grateful to the Indonesia Endowment Funds for Education (LPDP) and the Indonesia Center for Educational Financial Services (PUSLAPDIK).
Declaration of Generative AI in Scientific Writing
The authors acknowledge the use of Grammarly in the preparation of this manuscript to improve language and grammar. AI performed no content generation or data interpretation. The authors take full responsibility for the content and conclusions of this work.
CRediT Author Statement
Rachmin Munadi: Conducted experiments, Synthesized nanomaterials, Analysis of the results, and Writing the original manuscript; Abdul Wahid Wahab: Provided advice, Suggestions and Revision of the manuscript; Abdul Karim: Supervision, Investigation, Conceptualization; Fatimah Fatimah: Methodology, and Revision of the manuscript.
References
DL Fedlheim and CA Foss. Metal nanoparticles: Synthesis, characterization, and applications. CRC Press, Florida, United States, 2001.
A Moores and F Goettmann. The plasmon band in noble metal nanoparticles: An introduction to theory and applications. New Journal of Chemistry 2006; 30(8), 1121-1132.
S Anil Kumar, MK Abyaneh, SW Gosavi, SK Kulkarni, R Pasricha, A Ahmad and MI Khan. Nitrate reductase-mediated synthesis of silver nanoparticles from AgNO3. Biotechnology Letters 2007; 29(3), 439-445.
A Lagashetty, S Ganiger and S Reddy. Synthesis, characterization and antibacterial study of Ag-Au Bi-metallic nanocomposite by bioreduction using piper betle leaf extract. Heliyon 2019; 5(12), e02794.
UC Jayaram and A Gurusamy. Biosynthesis and characterization of silver nanoparticles using leaf extract of Abutilon indicum. Global Journal of Biotechnology & Biochemistry 2018; 13(1), 7-11.
MR Bindhu, M Umadevi, GA Esmail, NA Al-Dhabi and MV Arasu. Green synthesis and characterization of silver nanoparticles from Moringa oleifera flower and assessment of antimicrobial and sensing properties. Journal of Photochemistry and Photobiology B: Biology 2020; 205, 111836.
MS Jabir, YM Saleh, GM Sulaiman, NY Yaseen, UI Sahib, YH Dewir, MS Alwahibi and DA Soliman. Green synthesis of silver nanoparticles using Annona muricata extract as an inducer of apoptosis in cancer cells and inhibitor for nlrp3 inflammasome via enhanced autophagy. Nanomaterials 2021; 11(2), 384.
M Narayan, S Divya, D Natarajan, S Senthil-Nathan, S Kandasamy, A Chinnathambi, TA Alahmadi and A Pugazhendhi. Green synthesis of silver nanoparticles from aqueous extract of Ctenolepis garcini L. and assess their possible biological applications. Process Biochemistry 2021; 107, 91-99.
SS Shankar, A Rai, A Ahmad and M Sastry. Rapid synthesis of Au, Ag, and bimetallic Au core-Ag shell nanoparticles using neem (Azadirachta Indica) leaf broth. Journal of Colloid and Interface Science 2004; 275, 496-502.
SD Solomon, M Bahadory, AV Jeyarajasingam, SA Rutkowsky, C Boritz and L Mulfinger. Synthesis and study of silver nanoparticles. Journal of Chemical Education, 84(2), 322-325.
NH Ashiri. 2016, Activity test and identification of antibacterial chemical compounds of ethanol extract of bidara leaves (Ziziphus Spina-Christi L.) against some pathogenic bacteria. Master Thesis. Alauddin State Islamic University, Makassar, Indonesia.
L Natta, K Orapin, N Krittika and B Pantip. Essential oil from 5 Zingiberaceae for anti- foodborne bacteria. International Food Research Journal 2008; 15(3), 337-346.
SV Otari, RM Patil, SJ Ghosh and SH Pawar. Green phytosynthesis of silver nanoparticles using aqueous extract of Manilkara zapota (L.) seeds and its inhibitory action against Candida species. Materials Letter 2014; 116, 367-369.
Y Masakke, Sulfikar and M Rasyid. Biosynthesis of silver nanoparticles using methanol extract of mangosteen leaves (Garcinia mangostana L.). Jurnal Sainsmat 2015; 4(1), 28-41.
Y Haryani, EM Putri and FK Ganis. 2016, Biosynthesis of silver nanoparticles using red ginger rhizome extract (Zingiber officinale) and antibacterial activity test. Master Thesis. University of Riau, Riau, Indonesia.
Y Wang, C Arunachalam, N Omaima and AA Sulaiman. Green synthesis and chemical characterization of a novel anti-human pancreatic cancer supplement by silver nanoparticles containing Zingiber officinale leaf aqueous extract. Arabian Journal of Chemistry 2021; 14(4), 103081.
C Yan, Z Qu, J Wang, L Cao and Q Han. Microalgal bioremediation of heavy metal pollution in water: Recent advances, challenges, and prospects. Chemosphere 2022; 286, 131870.
X Liu, Y Yao, Y Ying and J Ping. Recent advances in nanomaterial-enabled screen-printed electrochemical sensors for heavy metal detection. Trends in Analytical Chemistry. 2019; 115, 187-202.
Z Liu, Y Fei, H Shi, L Mo and J Qi. Prediction of high-risk areas of soil heavy metal pollution with multiple factors on a large scale in industrial agglomeration areas. Science of the Total Environment 2022; 808, 151874.
MJ Mohammadi, F Kiani, M Farhadi, S Ghanbari, D Jalili and L Mirzaei. Evaluation of carcinogenic risk from heavy metal exposure through rice consumption in Southwestern Iran. Toxicology Reports 2024; 12, 578-583.
Z Ali, N Sher, I Muhammad and MM Almutairi. The combined effect of cadmium and copper induces bioaccumulation, toxicity, and disrupts the antioxidant enzymatic activities of goldfish (Carassius auratus). Toxicology Reports 2025; 14, 101972.
H Beitollahi, MA Khalilzadeh, S Tajik, M Safaei, K Zhang, HW Jang and M Shokouhimehr. Recent advances in applications of voltammetric sensors modified with ferrocene and its derivatives. ACS Omega 2020; 5(5), 2049-2059.
S Ulandari, D Iswantini and WT Wahyuni. Voltammetric detection of uric acid at screen-printed electrode: A Review. Jurnal Akta Kimia Indonesia 2021; 14(2), 29-42.
Y Liu, D Zhang, J Ding, K Hayat, X Yang, X Zhan, Y Lu and P Zhou. Label-free and sensitive determination of cadmium ions using a Ti-modified Co3O4-based electrochemical aptasensor. Biosensors 2020; 10(12), 195.
S Singh, A Numan, HH Somaily, MMA Dawsari, MHS Alqarni, A Alam and PA Kumar. A novel, eco-friendly multi-walled carbon nanotubes functionalized copper metal-organic framework for ultrasensitive potentiometric detection of cadmium ions. Journal of Environmental Chemical Engineering 2021; 9(6), 106534.
KM Abd-Elsabur, M Abd-Elsabour, FH Assaf and IMA Hasan. Electrochemical estimation of Cd and Cu ions simultaneously using a modified MgO/Fe2O3 nanocomposite/Carbon Paste Electrode. Electrocatalysis 2023; 14, 875-890.
AM Biasi, EA Takara, ML Scala-Benuzzi, AM Valverde and NN Gómez. Modification of electrodes with polymer nanocomposites: Application to the simultaneous determination of Zn(II), Cd(II), and Cu(II) in water samples. Analytica Chimica Acta 2023; 1273, 341499.
A Numan, AAS Gill, S Rafique, M Guduri, Y Zhan, B Maddiboyina, L Li, S Singh and NN Dang. Rationally engineered nanosensors: A novel strategy for the detection of heavy metal ions in the environment. Journal of Hazardous Materials 2021; 409, 124493.
C Pérez-Ràfols, JB Arrieta, N Serrano, JM Díaz-Cruz, C Ariño, J De Pablo and M Esteban. Ag nanoparticles drop-casting modification of screen-printed electrodes for the simultaneous voltammetric determination of Cu(II) and Pb(II). Sensors 2017; 17(6), 1458.
A Aravind, M Sebastian and B Mathew. Green silver nanoparticles as a multifunctional sensor for toxic Cd(II) ions. New Journal of Chemistry 2018; 42, 15022-15031.
M Zhou, L Han, D Deng, Z Zhang, H He, L Zhang and L Luo. 4-mercaptobenzoic acid modified silver nanoparticles-enhanced electrochemical sensor for highly sensitive detection of Cu2+. Sensors and Actuators B: Chemical 2019; 288, 45-54.
Y Chen, H Li, C Fang, L Ai, J Chen, J Su, Q Zhang and Q Fu. Facile synthesis of reduced graphene oxide/silver nanoparticles composites and their application for detecting heavy metal ions. Journal of Alloys and Compounds 2019; 791, 117-124.
PS Nayak, SS Ramamurthy and JKK Kumar. Green synthesis of silver nanoparticles-decorated reduced graphene oxide nanocomposite as an electrocatalytic platform for the simultaneous detection of dopamine and uric acid. Materials Chemistry and Physics 2020; 252, 123302.
N Joudeh and D Linke. Nanoparticle classification, physicochemical properties, characterization, and applications: A comprehensive review for biologists. Journal of Nanobiotechnology 2022; 20, 262.
K Ghanbari, M Moloudi and S Bonyadi. Modified glassy carbon electrode with silver nanoparticles/polyaniline/reduced graphene oxide nanocomposite for the simultaneous determination of biocompounds in biological fluids. Journal of Electrochemical Science and Technology 2019; 10(4), 361-372.
I Ivanisevic. The role of silver nanoparticles in electrochemical sensors for aquatic environmental analysis. Sensors 2023; 23(7), 3692.
M Amare, A Worku, A Kassa and W Hilluf. Green synthesized silver nanoparticle modified carbon paste electrode for SWAS voltammetric simultaneous determination of Cd(II) and Pb(II) in Bahir Dar Textile discharged effluent. Heliyon 2020; 6(7), e04401.
A Nourbakhsh, M Rahimnejad, M Asghary and H Younesi. Simultaneous electro-determination of trace copper, lead, and cadmium in tap water by using silver nanoparticles and graphene nanoplates as a nanocomposite modified graphite electrode. Microchemical Journal 2022; 176, 107137.
G Paimard, E Ghasali and M Baeza. Screen-printed electrodes: Fabrication, modification, and biosensing applications. Chemosensors 2023; 11(2), 113.
A Economou. Screen-printed electrodes modified with “green” metals for electrochemical stripping analysis of toxic elements. Sensors 2010; 10(9), 8160-8178.
R Manikandan, Y Jang-Hee and CC Seung. Emerging Trends in nanostructured materials-coated screen printed electrodes for the electrochemical detection of hazardous heavy metals in environmental matrices. Chemosphere 2023; 333, 140231.
RD Crapnell, CE Banks and DA Brownson. Electroanalytical Overview: Screen-printed electrochemical sensing platforms. ChemElectroChem 2024; 11, e202400370.
K Liu, Q Wang and S Miah. Mercury (II) sensor based on nanosilver/chitosan modified screen-printed carbonelectrode. Inorganic Chemistry Communications 2025; 163, 113639.
P Taba, NY Parmitha and S Kasim. The synthesis of silver nanoparticles uses bay leaf extract (Syzygium polyanthum) as a bioreducer and tests its activity as an antioxidant. Indonesian Journal of Chemical Research 2019; 7(2), 65-72.
AK Roddu. 2021, Synthesis of gold and silver nanoparticles using bioreductor of okra leaf extract (Abelmoschus esculentus (L.) Moench) and its application in the design of blood sugar sensors. Ph. D. Dissertation. Hasanuddin University, Makassar, Indonesia.
S Choudhary and S Yadav. Silver nanoparticle-modified electrodes for electrochemical sensing: Stability and performance considerations. Sensors and Actuators B: Chemical 2020; 309, 127753.
E Eksin, A Erdem, T Fafal and B Kıvçak. Eco-friendly sensors developed by herbal-based silver nanoparticles for electrochemical detection of Mercury (II) ion. Electroanalysis 2019; 31, 1-9.
M Sebastian, A Aravind and B Mathew. Green silver-nanoparticle-based dual sensor for toxic Hg(II) ions. Nanotechnology 2018; 29, 355502.
MS Punnoose, D Bijimol, T Abraham, NJ Plathanam and B Mathew. Green synthesized unmodified silver nanoparticles as reproducible dual sensor for mercuric ions and catalyst to abate environmental pollutants. Bionanoscience 2021; 11, 739-754.
JM George and B Mathew. Curcuma longa rhizome extract-mediated unmodified silver nanoparticles as a multisensing probe for Hg(II) ions. Materials Research Express 2019; 6, 1150h5.
AA Ganash and RA Alghamdi. Fabrication of a novel polyaniline/green-synthesized, silver-nanoparticle-modified carbon paste electrode for electrochemical sensing of lead ions. Journal of the Chinese Chemical Society 2021; 68, 2312-2325.
M Sebastian, A Aravind and B Mathew. Green silver nanoparticles based multi-technique sensor for environmental hazardous Cu(II) ion. Bionanoscience 2019; 9, 373-385.
A Aravind, M Sebastian and B Mathew. Green silver nanoparticles as a multifunctional sensor for toxic Cd(II) ions. New Journal of Chemistry 2018; 42, 15022-15031.
Yulirohyami, P Gani, I Fatimah, D Siswantaa and M Mudasir. Green synthesis of AgNPs-dithizone@chitosan for highly selective and reusable electrochemical sensors of Hg2+. Microchemical Journal 2025; 199, 114015.
JB Arrieta, A Ferré, C Pérez-Ràfols, N Fontàs and J Poch. Green synthesis of Ag nanoparticles using grape stalk waste extract for the modification of screen-printed electrodes. Nanomaterials 2018; 8(6), 1055.
S Girousi, V Keramari, I Paraschi, S Karastogianni and EE Golia. Development of a carbon paste electrode modified with saffron-conjugated silver nanoparticles for the simultaneous determination of Cd, Pb, Zn, Cu, and Cl in soils and plants. Chemosensors 2025; 13(3), 91.
R Munadi and Hutpriyanto. Identification of secondary metabolite compounds and antioxidant activity test of red ginger leaf extract (Zingiber officinale rosc. Var. Rubrum). Chemica: Scientific Journal of Chemistry and Chemistry Education 2023; 24(2), 83-93.
S Ceylan, E Yilmaz, M Yilmaz and M Soylak. Green synthesis of silver nanoparticles using plant extracts and their application in heavy metal sensing. Journal of Molecular Structure 2021; 1234, 130118.
E Gecer, G Akgül, D Yıldırım and N Yıldız. Electrochemical determination of heavy metals using modified carbon electrodes: A review. Electrochimica Acta 2022; 403, 139689.
JR Guimarães, FA Silva, MS Souza and AC Pereira. Silver nanoparticle-modified electrodes for electrochemical detection of Cd and Cu. Sensors and Actuators B: Chemical 2020; 313, 128021.
JM Hawar, MK Mohammed and HH Abdullah. Plant-mediated synthesis of silver nanoparticles and their analytical applications. Materials Today: Proceedings 2022; 65, 120-126.
H Jabbar, M Khan and S Rehman. Green-synthesized AgNPs for electrochemical sensing of heavy metals: A comprehensive review. Journal of Environmental Chemical Engineering 2020; 8(6), 104519.
SN Shah, R Ali, UA Khan and AZ Naqvi. Advances in silver nanoparticle-based electrochemical sensors for environmental monitoring. Analytical Methods 2020; 12, 5400-5412.
Fatimah, W Wahab and A Karim. Synthesis of silver nanoparticles using beluntas leaf (Pluchea Indica L.) extract. Indonesia Chimica Acta 2019; 12(1), 7-12.
R Handoko, L Pratama and N Sari. Electrochemical performance of silver nanoparticle-modified electrodes for heavy metal detection. Journal of Electroanalytical Science 2022; 18(4), 112-120.
A Hermanto, B Widodo and D Kurniawan. Green-synthesized AgNPs from plant extracts for enhanced voltammetric analysis. Materials Chemistry Research 2024; 9(2), 55-67.
T Kebede, H Alemu and G Dessie. Electrochemical sensing of cadmium and copper using nanoparticle-modified carbon electrodes. Sensors and Actuators B: Chemical 2021; 345, 130350.
J Willian, L Pereira and F Costa. Advances in AgNP-modified screen-printed electrodes for environmental metal analysis. Analytical Chemistry Research 2023; 36, 100512.
I Khan, K Saeed and I Khan. Nanoparticles: Properties, applications and toxicities. Arabian Journal of Chemistry 2019; 12(7), 908-931.
F Eker, E Akdaşçi, H Duman, M Bechelany and S Karav. Green synthesis of silver nanoparticles using plant extracts: A comprehensive review of physicochemical properties and multifunctional applications. International Journal of Molecular Sciences 2025; 26(13), 6222.
A Almuqrin, CJ Seneviratne, LJ Walsh and S Zafar. Tailored synthesis and profiling of capped silver and selenium nanoparticles for topical applications in paediatric dentistry. Dentistry Journal 2025; 13(10), 456.
MT Hamid, NN Hussein, GM Sulaiman and HA Mohammed. Antibacterial and antibiofilm properties of silver nanoparticles synthesized using Carthamus tinctorius extract against various multidrug-resistant bacterial strains. Discover Applied Science 2025; 7, 548.
J Kesharwani, KY Yoon, J Hwang and M Rai. Phytofabrication of silver nanoparticles by leaf extract of Datura metel: Hypothetical mechanism involved in synthesis. Journal of Bionanoscience 2009; 3(1), 39-44.
S Behboodi, F Baghbani-Arani, S Abdalan and SAS Shandiz. Green engineered biomolecular enclosed silver nanoparticles made from cichorium intybus extract: In vitro assessment of apoptosis properties of human breast cancer cells (MCF-7). Research on Biological Trace Elements 2019; 187(2), 392-402.
ZM Ayad, OMS Ibrahim and LW Omar. Biosynthesis and characterization of silver nanoparticles by Silybum marianum (Silymarin) fruit extract. Advances in Animal Science and Veterinary Medicine 2019; 7(2), 122-130.
A Syaifuddin, Salmiati, T Hadibarata, MR Salim, ABH Kueh and AA Sari. Synthesis of pure green silver nanoparticles using Carica papaya, Manihot esculenta, and Morinda citrifolia: Synthesis and evaluation of antibacterial. Bioprocess and Biosystem Engineering 2017; 40, 1349-1361.
N Saha, P Trivedi and SD Gupta. Optimization of surface plasmon resonance-based silver nanoparticles of rhizome extract of Curculio orchioides Gaertn and its antioxidant potential. Journal of Cluster Science 2016; 27, 1871-1885.
PJ Ogren. Using the asymmetric stretch band of atmospheric CO2 to obtain the C=O bond length. Journal of Chemical Education 2022; 79(1), 79-82.
M Sirajuddin. 2022, Synthesis of silver nanoparticles using nutmeg seed essential oil (Myristica fragrans houtt) and its application as an inhibitor of moss growth in rocks. Master Thesis. Islamic University of Indonesia, Yogyakarta, Indonesia.
K Jemal, BV Sandeep and S Pola. Synthesis, characterization and evaluation of antibacterial activity of Allophylus serratus leaves and silver nanoparticle-mediated leaf derivative callus extract. Journal of Nanomaterials 2017; 3, 1-11.
BL Bogale, TB Adamu, MA Kebede, MT Ayana, WW Kebede and T Fetene. Green and facile synthesis of silver nanoparticles (AgNPs) using Rhamnus prinoides (Gesho) leaf extract for antibacterial, antioxidant and photocatalytic activities. Next Nanotechnology 2025; 7, 100163.
VS Suvith and D Philip. Catalytic degradation of blue methylene using gold and silver nanoparticles biosynthesis. Spectrochimica Acta Part A: Molecular and Biomolecular Spectroscopy 2014; 118, 526-532.
K Jeeva, M Thiyagarajan, V Elangovan, N Geetha and P Venkatachalam. Caesalpinia coriaria leaf extract-mediated biosynthesis of silver nanoparticles and their antibacterial activity against clinically isolated pathogens. Industrial Crops and Products 2014; 52, 714-720.
M Sharifi-Rad, HS Elshafie and P Pohl. Green synthesis of silver nanoparticles (AgNPs) by Lallemantia royleana leaf extract: Its bio-pharmaceutical and catalytic properties. Journal of Photochemistry and Photobiology A: Chemistry 2024; 446, 115318.
Y Tkachenko and P Nieldzelski. FT-IR as a method for qualitative assessment of solid materials — pitfalls from atmospheric CO₂ and H₂O. Molecules 2022; 27(24), 8846.
EN Gecer, R Erenler, C Temiz, N Genc and I Yildiz. Green synthesis of silver nanoparticles from echinacea purpurea (l.) moench with antioxidant profile. Particle Science and Technology 2022; 40(6), 730-740.
MT Yassin, FO Al-Otibi, AAF Mostafa and AA Al-Askar. Facile green synthesis of silver nanoparticles using aqueous leaf extract of Origanum majorana with potential bioactivity against multidrug-resistant bacterial strains. Crystals 2022; 12(5), 603.
A Sharma, A Sagar, J Rana and R Rani. Green synthesis of silver nanoparticles and their antibacterial activity using fungus Talaromyces purpureogenus isolated from Taxus baccata Linn. Micro & Nano Systems Letters 2022; 10, 12.
AW Alshameri, M Owais, I Altaf and S Farheen. Rumex nervosus mediated green synthesis of silver nanoparticles and evaluation of its in vitro antibacterial and cytotoxic activity. OpenNano 2022; 8, 100084.
S Singla, A Jana, R Thakur, C Kumari, S Goyal and J Pradhan. Green synthesis of silver nanoparticles using Oxalis Griffithii extract and assessing their antimicrobial activity. OpenNano 2022; 8, 100047.
R Plesnicute. Eco-Friendly synthesis of silver nanoparticles with significant antimicrobial activity Sustainability 2025; 17(12), 5321.
JC Martínez-Espinosa, MA Ramírez-Morales and R Carrera-Cerritos. Silver nanoparticles synthesized using eichhornia crassipes extract from yuriria lagoon, and the perspective for application as antimicrobial agent. Crystals 2022; 12(6), 814.
C Vishwasrao, B Momin and L Ananthanarayan. Green synthesis of silver nanoparticles using sapota fruit waste and evaluation of their antimicrobial activity. Waste and Biomass Valorization 2019; 10, 1631-1641.
FK Alsammarraie, W Wang, P Zhou, A Mustapha and M Lin. Green synthesis of silver nanoparticles using turmeric extracts and investigation of their antibacterial activities. Colloids and Surface B Biointerfaces 2018; 1(171), 398-405.
A Al Mashud, Moinuzzaman, S Hossain, S Ahmed, G Ahsan, A Reza, RBA Ratul, H Uddin, A Momin and MHAM Jamal. Green synthesis of silver nanoparticles using Cinnamomum tamala (Tejpata) leaf and their potential application to control multidrug resistant pseudomonas aeruginosa isolated from hospital drainage water. Heliyon 2022; 8, e09920.
H Basalius, A Mani, A Michael, SM Mary, M Lenin, P Chelliah, MR Siddiqui, SM Wabaidur and MA Islam. Green synthesis of nanosilver using syzygium samarangense flower extract for multifaceted applications in biomedical and photocatalytic degradation of methylene blue. Applied Nanoscience 2023; 13, 3735-3747.
FE Ettadili, M Azriouil, B Chhaibi, FZ Ouatmane, OTAlaoui, F Laghrib, A Farahi, M Bakasse, S Lahrich and MAEL Mhammedi. Green synthesis of silver nanoparticles using Phoenix dactylifera seed extract and their electrochemical activity in ornidazole reduction. Food Chemistry Advances 2022; 1, 100146.
G Aragay and A Merkoçi. Application of nanomaterials in electrochemical detection of heavy metals. Electrochimica Acta 2012; 84, 49-61.
T Han, J Jin, C Wang, Y Sun, Y Zhang and Y Liu. Ag nanoparticles-modified 3D graphene foam for binder-free electrodes of electrochemical sensors. Nanomaterials 2017; 7(2), 40.
JW Seo, KJ Kim, JY Kim, J Jo, W Al-Harthi and WC Jeong. Silver nanoparticle modified electrode covered by graphene oxide for the enhanced electrochemical detection of dopamine. Sensors 2017; 17(12), 2771.
Y Shi, S Zhang, H Zhou, Y Dong, G Liu, W Ye, R He and G Zhao. Recent developments in heavy metals detection: Modified electrodes, pretreatment methods, prediction models and algorithms. Metals 2025; 15(1), 80.
A Abbas and HMA Amin. Review article silver nanoparticles modified electrodes for electroanalysis: An updated review and a perspective. Microchemical Journal 2022; 174, 107166.
DS Ben Ali, F Krid, AS Saadi, M Nacef and ML Chelaghmia. Simultaneous electrochemical detection of Cd²⁺ and Pb²⁺ using a green silver nanoparticle/polyaniline-modified carbon paste electrode. RSC Advances 2025; 15(36), 29654-29665.
Y Cheng, H Li, C Fang, L Ai, J Chen, J Su and Q Fu. Facile synthesis of reduced graphene oxide/silver nanoparticles composites and their application for detecting heavy metal ions. Journal of Alloy and Compounds 2019;788,123-132.
H Darmokoesoemo, M Khasanah, L Kustyarini, Y Kadmi, H Elmsellem and HS Kusuma. Development of electrode carbon paste/molecularly imprinted polymer (MIP) with methacrylic acid as monomer to analyze glucose by potentiometry. Results in Physics 2017; 7, 2201-2207.
R Tahaei, H Shayani-Jam and MR Yaftian. Voltammetric determination of trace copper (II), cadmium (II), and lead (II) using a Schiff base modified glassy carbon working electrode. Monatshefte für Chemie 2021; 152, 51-59.
DC Harris. Quantitative chemical analysis. 9th ed. W. H. Freeman and Company, New York, 2015.
J Wang. Analytical electrochemistry. 3rd ed. Wiley, New Jersey, United States, 2006.
AJ Bard and LR Faulkner. Electrochemical methods: Fundamentals and applications. 2nd ed. Wiley, New Jersey, United States, 2001.
A Shrivastava and VB Gupta. Methods for the determination of limit of detection and limit of quantitation. Chronicles of Young Scientists 2011; 2(1), 21-25.
Y Li, H Zhang and J Wang. Nanostructured electrode materials for electrochemical detection of heavy metals. Electrochimica Acta 2019; 296, 1100-1112.
A Dzhan. Stability and surface behavior of silver nanoparticles under ambient storage conditions. Journal of Nanomaterials Research 2012; 14(3), 215-224.
P Blaubaum. Silver nanoparticle-modified electrodes for heavy-metal electrochemical sensing: A review. Journal of Electrochemical Analysis 2020; 45(3), 215-229.
A Jiménez, MBG García, DH Santos and PF Bolado. Screen-printed electrodes modified with metal nanoparticles for small molecule sensing. Biosensors 2020; 10(2), 9.
M Rubino, L Rossi and A Bianchi. Enhancement of metal-ion preconcentration and sensitivity in screen-printed electrodes using ultrasmall metal nanoparticles. Journal of Electroanalytical Science 2023; 128(4), 345-356.
N Mphuthi, LM Sikwhivhilu, SS Ray and B Ntsendwana. Electrooxidation of dopamine using MoS2-Ag conductive ink on screen-printed electrodes for electrochemical sensing. Frontiers in Sensors 2025; 6, 1650004
AE Kartika, H Setiyanto, RV Manurung, SNA Jenie and V Saraswaty. Silver nanoparticles coupled with graphene nanoplatelets modified screen-printed carbon electrodes for rhodamine b detection in food products. ACS Omega 2021; 6(47), 31477-31484.
S Chatziathanasiou, K Papageorgiou and A Economou. Electrochemical sensors for heavy metal ions: A comprehensive review. Journal of Electroanalytical Chemistry 2024; 957, 117563.
MB Gholivand and A Pourhossein. Simultaneous determination of copper and cadmium in environmental water and tea samples by adsorptive stripping voltammetry. Talanta 2012; 93, 129-135.
KC Honeychurch. Voltammetric analysis of metals using carbon-based electrodes: A review. Sensors 2023; 23(2), 1-35.