Trends
Sci. 2026; 23(7): 12671
Rapid and Eco-Friendly Quantification of Phenolic Compounds in Roselle Powder Using ATR-FTIR Coupled with Chemometric Modeling
Zahva Shivany Imanul Kamil1, Jalanidi Ilmi Renaka1, Intan Dewi Larasati1,
Angga Hermawan2, Teti Estiasih3,4, Hamidie Ronald Daniel Ray5, Miguel Palma6,
Chutha Takahashi Yupanqui7 and Widiastuti Setyaningsih1,*
1Department of Food and Agricultural Product Technology, Faculty of Agricultural Technology,
Universitas Gadjah Mada, Yogyakarta 55281, Indonesia
2Research Center for Nanotechnology System, National Research and Innovation Agency of Indonesia,
South Tangerang 15314, Indonesia
3Department of Food Science and Technology, Faculty of Agricultural Technology, Universitas Brawijaya,
East Java 65145, Indonesia
4Center for Local Food Development Studies, Universitas Brawijaya, Malang, 65145, Indonesia
5Department of Sport Science, Faculty of Sport and Health Education, Universitas Pendidikan Indonesia,
Bandung 40154, Indonesia
6Department of Analytical Chemistry, Faculty of Science, IVANGRO, University of Cadiz,
Campus de Excelencia Internacional Agroalimentario (CeiA3), Campus del Rio San Pedro, Cadiz 11510, Spain
7Interdisciplinary Graduate School of Nutraceutical and Functional Food, Prince of Songkla University,
Songkhla 90112, Thailand
(*Corresponding author’s e-mail: [email protected])
Received: 16 November 2025, Revised: 20 December 2025, Accepted: 27 December 2025, Published: 10 March 2026
Abstract
Phenolic compounds are key contributors to the nutritional, functional, and commercial quality of roselle (Hibiscus sabdariffa L.) calyces; however, their routine quantification commonly relies on chromatographic methods that are time-consuming, solvent-intensive, and impractical for rapid quality control. This study aimed to develop a rapid and eco-friendly analytical approach for quantifying chlorogenic acid, caffeic acid, and rutin in roselle powder using attenuated total reflectance Fourier-transform infrared (ATR-FTIR) spectroscopy combined with chemometric modeling. Fifty samples representing different cultivars, drying methods, and geographical origins were analyzed. Elastic net classification achieved high accuracies for cultivar (96%) and geographical origin (92%), and moderate discrimination of drying methods (80%). Quantitative prediction using partial least squares regression showed excellent performance for chlorogenic acid (R2P = 0.9108), while caffeic acid and rutin showed moderate predictive ability (R2P = 0.5357 and 0.6490, respectively). External validation yielded prediction deviations generally below 10%. These results demonstrate that ATR-FTIR coupled with chemometrics provides a rapid, solvent-free, and reliable platform for phenolic profiling, with strong potential for sustainable quality control and process optimization in roselle-based food products.
Keywords: ATR-FTIR spectroscopy, Chemometrics, Green analytical chemistry, Phenolic compounds, Roselle powder analysis
List of abbreviations
ANOVA Analysis of Variance
ATR-FTIR Attenuated Total Reflectance Fourier-Transform Infrared Spectroscopy
CV Coefficient of Variation
DTGS Deuterated Triglycine Sulfate
DMRT Duncan’s Multiple Range Test
eNet Elastic Net
FTIR Fourier-Transform Infrared Spectroscopy
HPLC-PDA High-Performance Liquid Chromatography with Photodiode Array Detection
ICH International Council for Harmonisation
LOD Limit of Detection
LOQ Limit of Quantification
LOOCV Leave-One-Out Cross-Validation
MAE Microwave-Assisted Extraction
MSC Multiplicative Scatter Correction
PLSR Partial Least Squares Regression
R²C Coefficient of Determination for Calibration
R²CV Coefficient of Determination for Cross-Validation
R²P Coefficient of Determination for Prediction
RE Relative Error
REabs Absolute Relative Error
RMSEC Root Mean Square Error of Calibration
RMSECV Root Mean Square Error of Cross-Validation
RMSEP Root Mean Square Error of Prediction
SG Savitzky-Golay
SNV Standard Normal Variate
SVM Support Vector Machine
Introduction
Roselle (Hibiscus sabdariffa L.), a member of the Malvaceae family originally native to India and Malaysia, is widely recognized for its high content of bioactive phenolic constituents and its extensive medicinal and nutritional applications [1,2]. The Asia-Pacific region currently dominates global roselle production, accounting for approximately 53% of total output and 49% of global consumption. Roselle is extensively cultivated in tropical and subtropical regions, particularly in Southeast Asia, Africa, and parts of Latin America, where it has long been utilized as a food ingredient, herbal beverage, and traditional medicinal plant. The growing demand for plant-based bioactive ingredients has driven the increasing use of roselle in herbal teas, functional beverages, natural food colorants, nutraceutical products, and traditional medicinal preparations. The food and beverage industry represents the largest market segment, contributing about 58% of global roselle demand, followed by pharmaceutical applications at approximately 27% [3].
In food systems, roselle calyces are widely incorporated into beverages, jams, syrups, sauces, and fermented products, while in pharmaceutical and cosmetic sectors, roselle extracts are highly valued for their antioxidant, antimicrobial, and anti-inflammatory properties [4].
From a compositional perspective, roselle calyces are rich in flavonoids and phenolic acids, which are major contributors to the plant’s antioxidant capacity and health-promoting effects [1,2]. The characteristic red to purple coloration of roselle calyces is primarily attributed to anthocyanins, notably delphinidin-3-sambubioside and cyanidin-3-sambubioside. In addition to anthocyanins, roselle calyces contain substantial levels of antioxidants, amino acids, minerals, and vitamin C. Beyond the calyces, roselle leaves are commonly consumed as vegetables in several African countries due to their high mineral content, including phosphorus, calcium, magnesium, and potassium, whereas roselle seeds are often discarded as processing by-products despite their potential nutritional and functional value [4]. Moreover, other phenolic compounds such as chlorogenic acid, caffeic acid, and rutin play pivotal roles in determining the functional quality, antioxidant activity, and therapeutic potential of roselle-based products [5, 6]. The chemical composition of roselle is profoundly influenced by geographical origin, cultivar, harvest time, and postharvest handling such as drying. These factors contribute to substantial variability in phenolic composition and, consequently, affect the bioactivity of roselle-derived materials [1,7]. Therefore, accurate quantification of phenolics is crucial to ensure reliable quality evaluation and traceability of roselle products in both research and industrial contexts.
Currently, conventional phenolic analysis relies mainly on chromatographic techniques, particularly high-performance liquid chromatography coupled with photodiode array detection (HPLC-PDA), which is regarded as the gold standard for its high selectivity and sensitivity [8,9]. However, chromatographic analysis is often labor-intensive, destructive, and solvent-intensive, with long analysis times, potential baseline drift, and challenges in peak separation, especially in complex herbal matrices. These limitations hinder large-scale or real-time quality monitoring, emphasizing the need for methods that are rapid, cost-efficient, and environmentally sustainable.
Fourier-transform infrared (FTIR) spectroscopy has emerged as a powerful analytical tool capable of rapidly characterizing functional groups and molecular structures through vibrational fingerprints. The technique is reagent-free and suitable for high-throughput analysis, making it attractive for the food and pharmaceutical industries [10,11]. However, overlapping absorption bands, matrix effects, and baseline variability often limit its direct quantitative interpretation, necessitating the integration of chemometric modeling. Among multivariate approaches, partial least squares regression (PLSR) has proven effective for extracting chemically relevant information from complex spectral data and predicting analyte concentrations when appropriately calibrated, [12-14]. Despite these advantages, the accuracy and robustness of FTIR-based models strongly depend on optimized spectral preprocessing strategies, such as baseline correction, scatter correction, and derivative filtering, which must be tailored to the spectral behavior of each target compound [15].
As demand increases for rapid and environmentally sustainable analytical methods in the food and natural product industries, there remains a gap in developing data-driven, high-throughput workflows capable of accurately quantifying multiple phenolic compounds in complex plant matrices [16,17]. Accordingly, this study aimed to develop a rapid and eco-friendly analytical framework for the simultaneous classification and quantification of major phenolic compounds in roselle powder using ATR-FTIR spectroscopy coupled with chemometric modeling. Specifically, the study focused on optimizing spectral preprocessing, constructing and validating PLSR prediction models, and benchmarking their performance against HPLC–PDA reference data. The key strength of this work lies in the implementation of compound-specific preprocessing strategies within an ATR-FTIR-PLSR framework, enabling accurate, solvent-free, and robust phenolic quantification with minimal sample preparation.
Materials and methods
Chemical and reagents
Analytical- and chromatographic-grade reagents were used throughout the study. Standard compounds of chlorogenic acid, caffeic acid, and rutin (purity > 98%) were obtained from Sigma-Aldrich (St. Louis, MO, USA). HPLC-grade methanol (purity ≥ 99.9%) and glacial acetic acid (purity ≥ 99.8%) were purchased from Merck (Darmstadt, Germany). Injection-grade water (Aqua Pro; meets USP/EP Water for Injection specifications) was supplied by PT Ikapharmindo Putramas (Jakarta, Indonesia), while laboratory-grade distilled water was obtained from CV Progo Mulyo (Yogyakarta, Indonesia). Methanol and distilled water were used for sample extraction, whereas methanol, Aqua Pro injection, and acetic acid were used for mobile-phase preparation in HPLC-PDA analysis. All chemicals were used as received without further purification.
Sampling and sample preparation
A total of 50 dried roselle (Hibiscus sabdariffa L.) samples, representing both red and purple calyces, were collected from various regions across Java Island, Indonesia, including Banten, Jakarta, West Java, Central Java, Yogyakarta, and East Java. The samples were sourced from local producers and online marketplaces to capture variations in geographical origin and postharvest practices. Sampling locations are illustrated in Figure 1, and detailed sample information (covering geographical origin, cultivar, and drying method) is listed in Table 1.
Upon arrival, the moisture content of each sample was measured and standardized to 5%. Samples with moisture content exceeding 5% were further dried to comply with the Indonesian National Standard for dried roselle (SNI 3836:2013; < 5%) [18]. All samples were subsequently ground and sieved using a 40-mesh screen to ensure homogeneity.
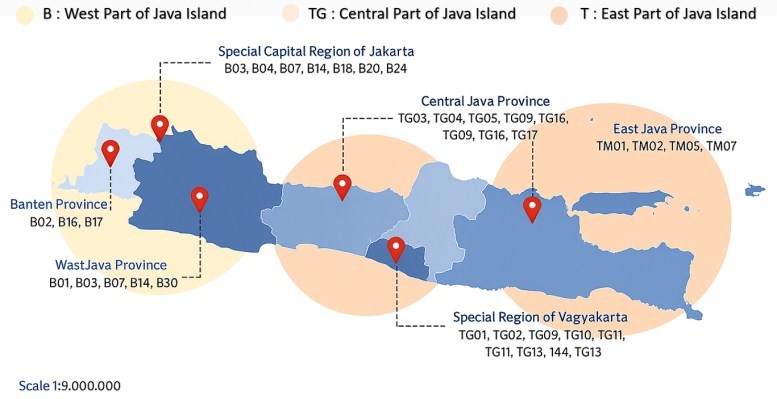
Figure 1 Sampling illustration at the cultivation sites of roselle powder across six provinces in Java Island, Indonesia, indicating the geographical distribution of collected samples.
After preparation, the samples were stored in airtight aluminum foil pouches containing silica desiccants and kept at 4 °C until analysis. All analyses were performed within a maximum storage period of 2 - 4 weeks to minimize potential degradation of phenolic compounds during storage. Before ATR-FTIR spectral acquisition and HPLC-PDA analysis, samples were equilibrated to room temperature for approximately 30 min after removal from storage to ensure consistent analytical conditions and reduce moisture-related variability.
Table 1 Geographical origins, roselle types, and drying methods of roselle (Hibiscus sabdariffa L.) powder samples collected from six provinces in Java Island, Indonesia.
Code Province/City |
Types of roselle |
Drying methods |
|
Jakarta (Special Capital Region) |
|
|
|
B03 |
West Jakarta |
Red |
Dehydrator drying |
B04 |
West Jakarta |
Purple |
Dehydrator drying |
B14 |
West Jakarta |
Purple |
Sun drying |
B18 |
East Jakarta |
Red |
Unknown |
B20 |
West Jakarta |
Red |
Sun drying |
B21 |
West Jakarta |
Purple |
Sun drying |
B22 |
North Jakarta |
Red |
Sun drying |
B23 |
North Jakarta |
Red |
Unknown |
B24 |
North Jakarta |
Red |
Unknown |
B25 |
North Jakarta |
Red |
Oven drying |
Banten |
|
|
|
B02 |
Tangerang |
Red |
Sun drying |
B16 |
Tangerang |
Purple |
Sun drying |
B17 |
Tangerang |
Red |
Sun drying |
West Java |
|
|
|
B01 |
Bogor |
Red |
Hybrid drying (Sun + Dehydrator) |
B05 |
Bandung |
Red |
Sun drying |
B06 |
Bekasi |
Red |
Oven drying |
B08 |
Cirebon |
Red |
Sun drying |
B09 |
West Bandung |
Red |
Sun drying |
B10 |
West Bandung |
Purple |
Sun drying |
B11 |
Depok |
Red |
Sun drying |
B12 |
Bekasi |
Red |
Sun drying |
B13 |
Bekasi |
Purple |
Sun drying |
B15 |
Bogor |
Red |
Sun drying |
B19 |
Bekasi |
Purple |
Sun drying |
B26 |
Bekasi |
Red |
Sun drying |
Central Java |
|
|
|
TG03 |
Surakarta |
Red |
Oven drying |
TG04 |
Sragen |
Red |
Sun drying |
TG05 |
Blora |
Red |
Sun drying |
TG06 |
Blora |
Purple |
Sun drying |
TG07 |
Sragen |
Purple |
Hybrid drying (Sun + Dehydrator) |
TG08 |
Sragen |
Red |
Hybrid drying (Sun + Dehydrator) |
TG16 |
Semarang |
Red |
Unknown |
Yogyakarta (Special Region) |
|
|
|
TG01 Kulon Progo |
Red |
Sun drying |
|
TG02 Yogyakarta City |
Purple |
Unknown |
|
TG09 Yogyakarta City |
Red |
Sun drying |
|
TG10 Yogyakarta City |
Red |
Sun drying |
|
TG11 |
Yogyakarta City |
Purple |
Sun drying |
TG12 |
Yogyakarta City |
Red |
Sun drying |
TG13 |
Yogyakarta City |
Red |
Sun drying |
TG14 |
Yogyakarta City |
Red |
Sun drying |
TG15 |
Yogyakarta City |
Purple |
Sun drying |
TG17 |
Sleman |
Purple |
Unknown |
East Java |
|
|
|
TM01 |
Malang |
Red |
Unknown |
TM02 |
Pasuruan |
Red |
Unknown |
TM03 |
Surabaya |
Red |
Dehydrator drying |
TM04 |
Surabaya |
Purple |
Dehydrator drying |
TM05 |
Sidoarjo |
Red |
Sun drying |
TM06 |
Surabaya |
Red |
Sun drying |
TM07 |
Surabaya |
Red |
Unknown |
FTIR spectroscopy
Spectral acquisition was performed using a Nicolet iS10 ATR-FTIR spectrometer (Thermo Fisher Scientific, Wisconsin, USA) equipped with a deuterated triglycine sulfate (DTGS) detector. Both background and sample spectra were recorded at a resolution of 8 cm⁻1 with 64 scans per sample over the range of 4,000 - 600 cm⁻1. The roselle powder was placed on a diamond ATR crystal under uniform pressure to ensure optimal contact. The crystal was cleaned with ethanol after each run, and background scans were routinely collected to correct atmospheric variations. Each sample was analyzed in triplicate to enhance reproducibility, enabling near real-time prediction of chemical profiles within 1 - 2 min per sample.
Microwave-assisted extraction (MAE)
Microwave-assisted extraction (MAE) was performed using a Milestone Ethos E microwave extraction system (Milestone Srl., Bergamo, Italy). This system features a stainless-steel microwave cavity coated with multilayer PTFE, dual magnetron emission with a rotating diffuser and built-in temperature and pressure safety interlocks. MAE was performed under conditions optimized in a previous study by Fathimah et al. [19]. Approximately 0.5 g of dried, homogenized roselle calyx powder was extracted using 59 %(v/v) methanol in water at a 20:1 solvent-to-sample ratio (v/w) and held at 68 °C for 15 min. Extractions were performed in duplicate to assess reproducibility. After extraction, samples were rapidly cooled, filtered through 0.45 µm nylon filters, and stored at 4 °C prior to further analysis.
HPLC performance for analysis of phenolic compounds
Analysis of phenolic compounds was performed using high-performance liquid chromatography coupled with a photodiode array detector (HPLC-DAD; Shimadzu Corp., Kyoto, Japan). Separation was achieved on a C18 reversed phase column (5 µm, 4.6×150 mm2) maintained at 30 °C. The mobile phase consisted of solvent A (2% acetic acid, 5% methanol, 93% water) and solvent B (2% acetic acid, 88% methanol, 10% water). The gradient elution was programmed as 0 min, 20% B; 15 min, 100% B; 18 min, 100% B, with a 1 mL min⁻1 flow rate and 2 µL injection volume. Full UV spectra (190 - 600 nm) were recorded for compound characterization, and quantification was performed at 260 nm for flavonoids and 320 nm for hydroxycinnamic acids. Compound identification was based on UV spectral characteristics and retention times, with comparison to available reference standards. External calibration curves were prepared in 2 validated concentration ranges: 0.1 - 5 µg mL⁻1 (low range) and 10 - 100 µg mL⁻1 (high range). The method met ICH Q2(R1) validation requirements as summarized in Table 2.
Table 2 Analytical performance parameters for phenolic compounds.
Validation parameter |
Chlorogenic |
Caffeic acid |
Rutin |
Linear equation |
|
|
|
High range |
𝑦 = 68208𝑥 + 50729 |
𝑦 = 120209𝑥 + 143618 |
𝑦 = 105570𝑥 + 71165 |
Low range |
𝑦 = 63984𝑥 + 4407 |
𝑦 = 117452𝑥 + 1487 |
𝑦 = 114985𝑥 + 6996 |
R² |
|
|
|
High range |
0.999 |
0.999 |
0.999 |
Low range |
0.996 |
0.998 |
0.994 |
Limits |
|
|
|
LOD (µg mL⁻1) |
0.38 |
0.24 |
0.48 |
LOQ (µg mL⁻1) |
1.14 |
0.72 |
1.45 |
Repeatability |
|
|
|
Retention time |
0.10 |
0.41 |
0.05 |
Area |
0.21 |
0.25 |
0.76 |
Intermediate Precision |
|
|
|
Retention time |
0.91 |
0.30 |
0.05 |
Area |
1.53 |
0.05 |
1.87 |
Chemometric statistics
Prior to chemometric modeling, raw ATR-FTIR spectral data were preprocessed to enhance signal quality and minimize irrelevant variations (Figure 2). Spectral acquisition for each sample was performed twice independently, and the averaged spectra were used for model development to ensure reproducibility and minimize instrumental noise. The full dataset of 50 samples was divided into 2 subsets: 75% (n = 38×2) for model calibration and 25% (n = 12×2) for external validation. This ratio was selected to provide a sufficiently large calibration base while maintaining an independent dataset for unbiased performance evaluation.
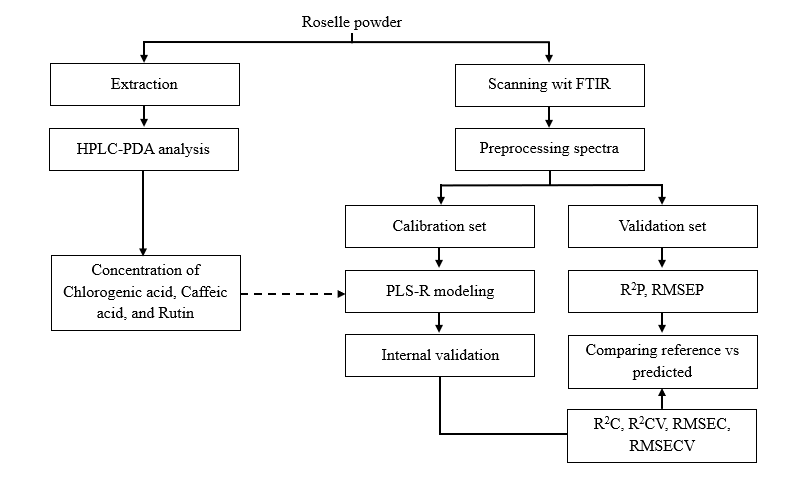
Figure 2 Research workflow for developing the ATR-FTIR chemometric model for quantifying phenolic compounds in roselle powder.
Several preprocessing and pretreatment combinations were evaluated to determine the optimal spectral conditioning strategy prior to chemometric analysis. The preprocessing methods tested included baseline correction, smoothing, multiplicative scatter correction (MSC), standard normal variate (SNV), and Savitzky-Golay first- and second-derivative transformations.
For classification tasks, Elastic Net (eNet) modeling was employed to discriminate roselle samples based on cultivar type, geographical origin, and drying treatment using their ATR-FTIR spectral fingerprints. The eNet algorithm was selected because it effectively manages multicollinearity and performs variable selection in high dimensional spectral datasets by combining the advantages of Lasso (L1) and Ridge (L2) regularization.
For quantitative analysis, partial least squares regression (PLSR) models were constructed to relate FTIR spectral matrices (X) to HPLC-PDA reference concentrations (Y) of chlorogenic acid, caffeic acid, and rutin. Different preprocessing pipelines were assessed for each analyte, including baseline correction, smoothing, multiplicative scatter correction (MSC), standard normal variate (SNV), and Savitzky-Golay first- and second-derivative transformations, to identify the optimal preprocessing pipeline for each analyte.
Model performance was assessed using the coefficients of determination for calibration (R²C), cross-validation (R²CV), and external prediction (R²P), together with the corresponding root mean square errors of calibration (RMSEC), cross-validation (RMSECV), and prediction (RMSEP). Internal model robustness was evaluated using leave-one-out cross-validation (LOOCV) and 10-fold cross-validation, while external validation was conducted using the independent validation dataset. In accordance with established chemometric criteria, models exhibiting R² values greater than 0.90 were interpreted as demonstrating excellent calibration and predictive capability.
External validation and real-sample application
External validation was performed using the independent 25% validation set (n = 12) to assess the predictive reliability of the optimized PLSR and eNet models. Predicted concentrations were compared with the corresponding HPLC-PDA reference values to evaluate accuracy, bias, and generalizability. In addition, commercial roselle powder samples not included in the calibration set were analyzed to confirm real-world applicability. The validated ATR-FTIR–chemometric workflow was then used to predict chlorogenic acid, caffeic acid, and rutin contents in these samples, demonstrating the feasibility of this approach for rapid, cost-efficient, and environmentally sustainable phenolic quantification in complex plant-based matrices.
Univariate statistics
Univariate statistical analysis was conducted to evaluate differences in phenolic compound concentrations among roselle samples grouped by cultivar type, geographical origin, and drying method. Statistical analysis was performed using IBM SPSS Statistics software (version 25, IBM Corp., Armonk, NY, USA).
Differences among group means were assessed using one-way analysis of variance (ANOVA). When significant effects were detected, Duncan’s multiple range test (DMRT) was applied as a post-hoc procedure to identify statistically significant pairwise differences. A significance level of p < 0.05 was adopted for all univariate analyses. Results are reported as mean ± standard deviation, and different superscript letters in tables indicate statistically significant differences among groups.
Results and discussion
Identification and quantification of phenolic compounds by HPLC-DAD
The chromatographic method successfully separated and identified the three target phenolic compounds (chlorogenic acid, caffeic acid, and rutin) in roselle powder samples (Figure 3). Compound identification was established by a combined assessment of retention time, full UV-Visible spectral profiles recorded by the photodiode array detector (190 - 600 nm), and spectral similarity with authentic reference standards. For quantification, chromatograms were monitored at 320 nm for hydroxycinnamic acids (Figure 3(a)) and 260 nm for the flavonol glycoside rutin (Figure 3(b)). These wavelengths correspond to the absorbance maxima (λmax) of the respective phenolic classes, providing optimal signal intensity and minimizing quantification errors associated with baseline noise and spectral overlap. This wavelength selection is consistent with previous studies by Setyaningsih et al. [20] on phenolic profiling in roselle and other plant matrices, where hydroxycinnamic acids and flavonoids shown maximum absorbance in the UV region.
The analytical performance of the HPLC-PDA method was evaluated through linearity, limits, and precision parameters, as summarized in Table 2. Calibration curves for chlorogenic acid, caffeic acid, and rutin demonstrated excellent linearity across both high- and low-concentration ranges, with coefficients of determination (R² = 0.994 – 0.999). The limits of detection (LOD) and quantification (LOQ) ranged from 0.24 - 0.48 and 0.72 - 1.45 µg mL⁻1, respectively, indicating that the HPLC method suitable for determining the levels of phenolic compounds in roselle matrices. The method also validated with high precision as retention time variations ≤ 0.91 min and area variations ≤ 1.87%.
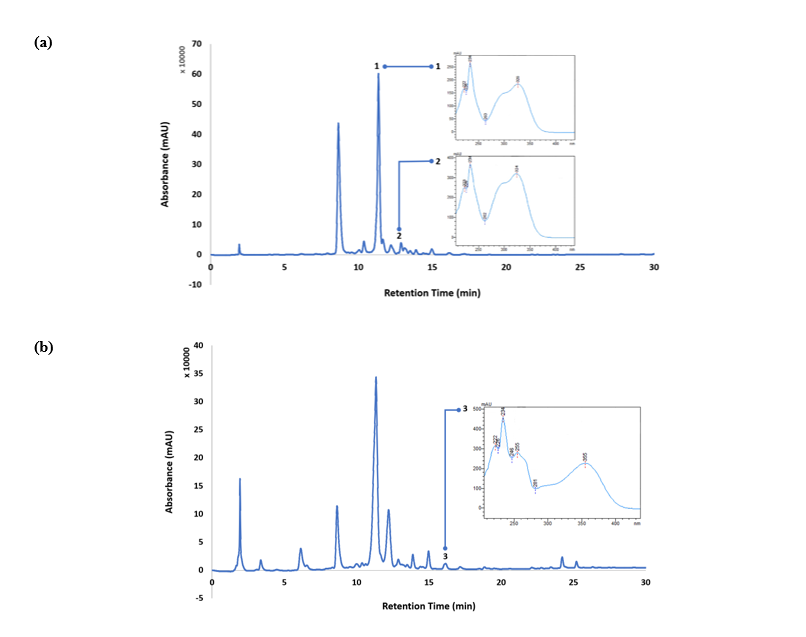
Figure 3 UV-Visible spectra and HPLC-PDA chromatographic profiles of phenolic compounds identified in Hibiscus sabdariffa L. extracts: (a) detection at 320 nm for (1) chlorogenic acid and (2) caffeic acid; (b) detection at 260 nm for (3) rutin.
Mean concentrations of the studied phenolic compounds across six provinces in Java are summarized in Table 3, while the complete dataset for all 50 samples is presented in Table S1. The wide range of values demonstrates significant variation in phenolic accumulation influenced by environmental and genetic factors. The quantitative results showed marked variations in the concentrations of chlorogenic acid, caffeic acid, and rutin among the analyzed samples, emphasizing the strong influence of cultivar and geographical origin on roselle’s phenolic composition. Chlorogenic acid (498.57 - 5,274.88 µg g⁻1) was consistently the predominant phenolic compound, followed by rutin (15.27 - 254.67 µg g⁻1) and caffeic acid (2.00 - 182.63 µg g⁻1). The predominance of chlorogenic acid in roselle has also been reported in previous studies, where hydroxycinnamic acid were identified as the major contributors to roselle’s antioxidant activity. The presence of rutin and caffeic acid further confirms the multifunctional bioactivity of roselle, particularly its antioxidant and anti-inflammatory properties [21].
These HPLC-PDA quantitative result provide a robust reference dataset for the development and validation of ATR-FTIR-based chemometric models in this study. Moreover, the wide natural variability of phenolic contents among samples is advantageous for constructing predictive multivariate calibration models with good generalization ability.
Table 3 Concentrations of phenolic compounds in dried roselle powders from different geographical origins.
Geographical origin |
Phenolic compounds (µg g⁻1) |
|
|
Chlorogenic acid |
Caffeic acid |
Rutin |
|
Banten Province |
1,592.00 ± 952.61a |
28.27 ± 20.74a |
44.92 ± 23.37 a |
West Java Province |
1,984.71 ± 716.47ab |
56.96 ± 43.18a |
77.53 ± 60.26 a |
Special Capital Region of Jakarta |
2,587.22 ± 1234.34b |
32.37 ± 11.48a |
47.95 ± 16.06 a |
Central Java Province |
2,683.31 ± 1081.52b |
37.04 ± 10.27 a |
59.66 ± 24.02 a |
Special Region of Yogyakarta |
2,703.54 ± 1115.81b |
37.98 ± 17.95 a |
61.62 ± 46.29 a |
East Java Province |
2,449.94 ± 1269.30ab |
39.92 ± 23.78 a |
80.76 ± 51.05 a |
Overall mean |
2,400.44 ± 1100.81 |
40.86 ± 26.93 |
63.84 ± 43.85 |
Different superscript letters (a-b) within the same column indicate significant differences among geographical origins at p < 0.05 (1-way ANOVA, DMRT). Values are presented as mean ± standard deviation.
Note: Complete dataset of 50 samples is provided in Table S1.
The highest chlorogenic acid contents were detected in samples from Central Java and the Special Region of Yogyakarta (≈ 2,700 µg g⁻1), while East Java exhibited the highest rutin concentration (≈ 81 µg g⁻1). Conversely, West Java samples contained the greatest caffeic acid levels (~57 µg g⁻1). These interregional differences indicate that geographical origin and cultivar characteristics jointly influence the phenylpropanoid biosynthetic pathway in roselle, consistent with previous findings linking phenolic variability to agroclimatic conditions [22]. Reports by Sanou et al. [7] and Lyu et al. [23] similarly demonstrated that agroclimatic conditions strongly modulate the biosynthesis and accumulation of hydroxycinnamic acids and flavonols in roselle.
The observed diversity in phenolic distribution underscores the complexity of plant secondary metabolism under varying ecological and genetic contexts. Such variation poses both a challenge and an opportunity for developing predictive models. Accordingly, this HPLC-PDA dataset provides a robust calibration benchmark for subsequent FTIR–chemometric modeling using partial least squares regression (PLSR), enabling rapid and accurate quantification of phenolics in heterogeneous roselle matrices.
Variation across cultivars and drying methods
Distinct differences between red and purple cultivars were observed (Table 4). Purple roselle contained significantly higher concentrations of chlorogenic acid (3,161.53 ± 1,025.94 µg g⁻1) than the red cultivar (2,104.47 ± 985.97 µg g⁻1; p < 0.05). Conversely, red roselle exhibited greater caffeic acid (43.91 ± 30.10 µg g⁻1) and rutin (71.64 ± 48.00 µg g⁻1) contents compared with the purple type (33.01 ± 13.67 µg g⁻1 and 43.76 ± 20.24 µg g⁻1, respectively). These results indicate cultivar-specific regulation of the phenylpropanoid and flavonoid biosynthetic pathways, wherein purple calyces appear to channel carbon flux predominantly toward hydroxycinnamate ester biosynthesis (e.g., chlorogenic acid), whereas red calyces favor the accumulation of free phenolic acids and flavonol glycosides. These results are consistent with previous reports linking color phenotype to differential activation of phenolic pathways in roselle cultivars [24].
Table 4 Distribution of chlorogenic acid, caffeic acid, and rutin in roselle powders grouped by cultivar type and drying method.
Variables |
|
Phenolic compounds (µg g⁻1) |
|
Chlorogenic acid |
Caffeic acid |
Rutin |
|
Cultivar type |
|
|
|
Red |
2,104.47 ± 985.97a |
43.91 ± 30.10a |
71.64 ± 48.00a |
Purple |
3,161.53 ± 1,025.94b |
33.01 ± 13.67b |
43.76 ± 20.24b |
Drying Method |
|
|
|
Sun and Dehydrator |
2,809.75 ± 1,346.44a |
49.68 ± 15.77a |
75.02 ± 26.65a |
Sun |
2,198.52 ± 894.53a |
42.70 ± 31.55a |
64.06 ± 51.04a |
Dehydrator |
2,929.65 ± 1,185.73a |
30.64 ± 21.59a |
57.73 ± 37.90a |
Oven |
2,760.32 ± 1,747.10a |
33.10 ± 10.49a |
54.93 ± 4.44a |
Unknown |
2,604.38 ± 1,321.50a |
38.72 ± 15.46a |
64.99 ± 30.83a |
Overall mean |
2,400.44 ± 1,100.81a |
40.86 ± 26.93a |
63.84 ± 43.85a |
Different superscript letters (a-b) within the same column indicate significant differences among cultivar types and drying methods at p < 0.05 (1-way ANOVA, DMRT). Values are presented as mean ± standard deviation.
The drying method exerted no statistically significant effect on the accumulation of the 3 studied phenolic compounds in roselle calyces (Table 4). Samples processed using the combined sun-and-dehydrator method, as well as those dried exclusively under sunlight, by mechanical dehydration, or by oven drying, exhibited comparable concentrations of chlorogenic acid (2,809.75 ± 1,346.44 µg g⁻1), caffeic acid (49.68 ± 15.77 µg g⁻1), and rutin (75.02 ± 26.65 µg g⁻1). The absence of significant differences (p > 0.05) indicates that the phenolic composition of roselle remains largely unaffected by the drying technique applied. This finding suggests that mild postharvest drying temperatures (< 70 °C) generally preserve the structural integrity and stability of phenolic constituents, corroborating earlier reports that hydroxycinnamic acids and flavonol glycosides are resistant to thermal degradation under moderate processing conditions [25,26].
The results align with previous findings showing that hydroxycinnamic acids and flavonol glycosides are structurally resilient under moderate heat exposure, owing to their conjugated aromatic systems that resist thermal oxidation and isomerization [25]. Similar thermal stability patterns have been reported in other phenolic-rich matrices such as Camellia sinensis leaves and Moringa oleifera, where total phenolic content remained largely unchanged at drying temperatures below 80 °C [27].
The overall HPLC-PDA results indicate that phenolic composition in roselle powder is primarily governed by cultivar- and origin-dependent biochemical variation, while drying method exerts minimal influence under the mild temperature conditions applied. This chemical stability provides a robust foundation for subsequent spectral modeling, as the HPLC dataset offers well-validated reference values against which the predictive performance of FTIR-based chemometric models can be reliably assessed. Accordingly, the following section examines how these compositional patterns are reflected in the ATR-FTIR spectral fingerprints and their suitability for multivariate discrimination and phenolic quantification.
FTIR spectral characteristics of roselle powder
The ATR-FTIR spectra of roselle powder samples exhibited distinct and reproducible vibrational features within the mid-infrared region (4,000 - 600 cm⁻1), reflecting the diverse functional groups present in the matrix of dried roselle calyces (Figure 4). The overlaid spectra revealed consistent absorption band patterns across all samples, suggesting high chemical similarity among the powders regardless of their origin or drying treatment.
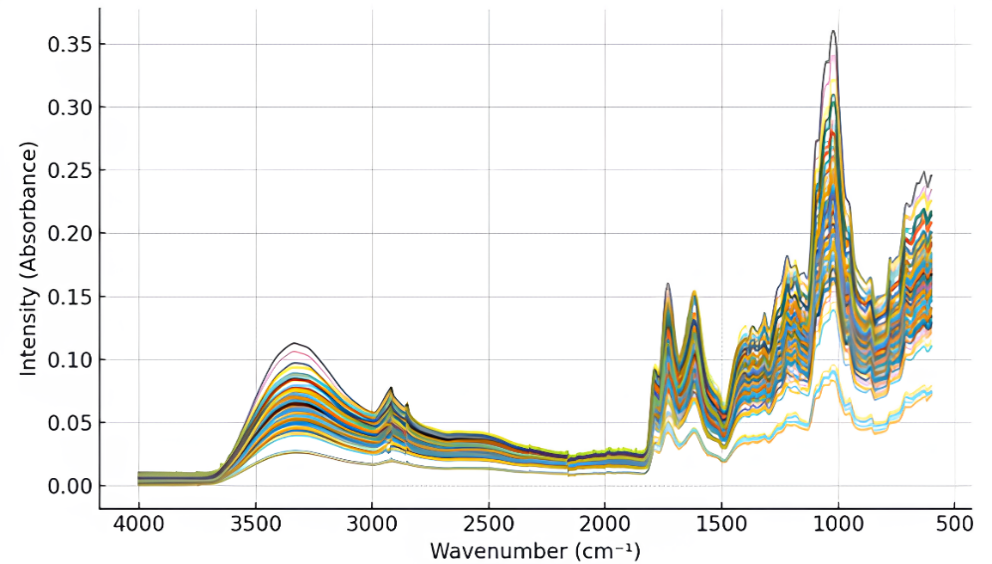
Figure 4 Overlaid ATR-FTIR spectra of roselle powder samples (4,000 - 600 cm⁻1).
Broad absorption between 3,600 - 3,200 cm⁻1 was attributed to O–H stretching vibrations of hydroxyl groups in phenolics, anthocyanins, and residual moisture. Similar broad O–H signals around 3,400 - 3,300 cm−1 were also documented by Rohani et al. [28]; Wongsa et al. [29], who reported dominant O–H stretching bands ~3,375 - 3,320 cm−1 associated with polymeric phenolic hydroxyl groups.
Prominent bands in the 1,700 - 1,600 cm⁻1 region corresponded to C=O stretching of hydroxycinnamic acids (e.g., chlorogenic and caffeic acids) and conjugated carbonyls in anthocyanins. This observation aligns with Rohani et al. [28], who reported C=O stretching at ~1,741 and ~1,791 cm⁻1, and is further supported by Wongsa et al. [29], who noted carbonyl-associated vibrations typical of phenolic and organic compounds in similar plant matrices.
The peaks around 1,600 - 1,500 cm⁻1 indicated aromatic C=C stretching typical of flavonoid skeletons, while bands between 1,200 - 1,000 cm⁻1 were associated with C–O and C–O–C vibrations of glycosidic linkages. Despite overlapping features, the fingerprint region below 1,000 cm⁻1 retained diagnostically rich information related to anthocyanin backbones and phenolic glycosides [30-32]. Comparable assignments were reported by Rohani et al. [28], who detected polysaccharide-, nucleic acid-, and amine-related vibrations in this region, and by Wongsa et al. [29], who emphasized the diagnostic importance of the 1,400 - 900 cm−1 fingerprint zone due to the presence of C-H, C-O, C-N, and P-O functional group vibrations.
The overall spectral profiles showed only minor intensity variations in specific regions but no significant shifts in wavenumber, confirming that the fundamental molecular structures remained unaffected by the drying conditions applied. This spectral consistency corroborates the HPLC-PDA results, which demonstrated that phenolic composition was stable under mild drying temperatures (< 70 °C). The subtle intensity differences detected in the fingerprint region are more likely associated with inherent cultivar or geographical variations rather than processing-induced changes.
Furthermore, the reproducibility and chemical representativeness of the ATR-FTIR spectra establish their suitability for subsequent chemometric modeling. The clear presence of functional groups corresponding to phenolic acids and flavonoids provides a robust spectral basis for correlating FTIR absorbance data with quantitative HPLC-derived phenolic concentrations. This analytical approach is consistent with findings from Rohani et al. [28], who demonstrated the utility of FTIR functional group mapping for compound identification in roselle, further supporting the integration of chemometric algorithm. Accordingly, chemometric algorithms such as Elastic Net and Partial Least Squares Regression (PLSR) were subsequently applied to the FTIR dataset to develop rapid, solvent-free prediction models for major phenolic compounds in roselle powders.
Chemometric modeling for phenolic quantification
Chemometric modeling was applied to evaluate the capability of ATR-FTIR spectroscopy for both qualitative classification and quantitative prediction of phenolic compounds in dried roselle powders. The integration of FTIR with multivariate modeling aimed to deliver a rapid, solvent-free analytical platform comparable in reliability to conventional HPLC-PDA analysis.
Classification performance
Elastic Net (ENet) and Support Vector Machine (SVM) models were developed to classify roselle samples according to cultivar type, geographical origin, and drying method (Figures 5(a) - 5(c)). Both algorithms were combined with standard normal variate (SNV) and Savitzky-Golay first-derivative preprocessing to correct baseline variation and enhance subtle spectral features associated with phenolic and carbohydrate vibrations.
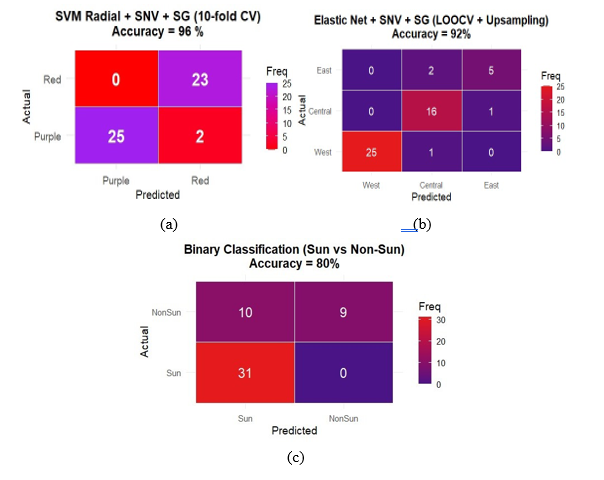
Figure 5 Confusion matrices of SVM and Elastic Net models for roselle classification: (a) types; (b) geographical origin; (c) drying method.
For cultivar discrimination, the SVM model with a radial basis kernel achieved 96% accuracy under 10-fold cross-validation (Figure 5(a)). The model correctly identified 23 red and 25 purple samples with only two misclassifications, confirming that the FTIR spectra captured distinct molecular fingerprints linked to pigment and phenolic composition. The discriminant regions were 1,700 - 1,600 cm⁻1 (C=O stretching of hydroxycinnamic acids and anthocyanins) and 1,200 - 1,000 cm⁻1 (C–O–C vibrations of glycosidic linkages). These findings corroborate HPLC-PDA results showing cultivar-specific composition of hydroxycinnamate and flavonol.
Classification by geographical origin using the ENet model with LOOCV and up sampling yielded 92% accuracy (Figure 5(b)). Up sampling reduced bias from class imbalance and improved model generalization. The model highlighted wavenumber intervals near 1,700 - 1,600 and 1,100 cm⁻1 as the most influential, reflecting regional variation in soil nutrients and sunlight exposure that modulate phenolic and carbohydrate accumulation. The high predictive success indicates that FTIR-chemometric analysis can sensitively distinguish geographical provenance of roselle powders, an essential parameter for authenticity and traceability.
The binary classification of drying methods (sun vs non-sun drying) achieved a moderate 80% accuracy using ENet (Figure 5(c)). Although partial overlap occurred between classes, the model captured subtle spectral intensity shifts associated with moisture content, oxidation, and Maillard-related transformations during drying. These results suggest that even without clear class separation, FTIR–chemometric modeling can detect minute physicochemical differences resulting from postharvest processing.
The superior performance of Elastic Net in this context stems from its ability to handle high-dimensional and collinear FTIR data, where the number of variables (p) far exceeds the number of samples (n). By combining L1 (Lasso) and L2 (Ridge) regularization, ENet performs automatic variable selection while retaining groups of correlated predictors, generating a stable and interpretable model [33,34]. This property is critical for spectroscopic datasets, where chemically related absorption bands tend to covary.
The identified spectral variables correspond to known vibrational modes of hydroxycinnamic acids and flavonol glycosides, reinforcing the chemical interpretability of the classification models. Moreover, the high accuracies obtained for cultivar and origin classifications validate the sensitivity and reproducibility of FTIR spectra as a fingerprinting tool for complex phenolic matrices. The comparatively lower accuracy for drying classification reflects the chemical stability of phenolic structures under mild temperatures (< 70 °C), as confirmed by the HPLC-PDA quantification and ATR-FTIR stability discussion. These results demonstrate that FTIR coupled with Elastic Net or SVM modeling provides a reliable and sustainable analytical framework for discriminating roselle samples based on genotype, provenance, and processing history. The strong classification performance further supports the use of the FTIR dataset for subsequent quantitative regression modeling (PLSR and ENet-PLS) to predict individual phenolic concentrations.
Quantitative modeling of phenolic compounds
Partial Least Squares Regression (PLSR) was used to develop quantitative calibration models relating ATR-FTIR spectra to HPLC-derived concentrations of chlorogenic acid, caffeic acid, and rutin. Multiple preprocessing strategies including Standard Normal Variate (SNV), Multiplicative Scatter Correction (MSC), baseline correction, and Savitzky-Golay derivative were evaluated to reduce spectral noise and improve linearity. Model quality was assessed using coefficients of determination for calibration (R²C), cross-validation (R²CV), and external prediction (R²P), together with RMSEC, RMSECV, and RMSEP (Table 5). Following established vibrational-spectroscopy conventions, models with R² ≥ 0.90 were interpreted as exhibiting excellent calibration performance, while external prediction served as the primary criterion for assessing practical utility.
Table 5 Performance of PLSR models for predicting chlorogenic acid, caffeic acid, and rutin using different preprocessing and pretreatment combinations in roselle calyces.
Parameter |
Preprocessing |
Pretreatment |
Calibration |
Cross-validation |
|
Prediction |
|||
R2C |
RMSEC |
R2CV |
RMSECV |
R2P |
RMSEP |
||||
Chlorogenic acid |
- |
1st derivative + SNV |
0.9108 |
391.7600 |
0.6940 |
772.2398 |
0.9108 |
391.7604 |
|
|
Baseline |
|
0.7930 |
456.1375 |
0.6284 |
610.4952 |
0.5349 |
918.8662 |
|
|
Baseline |
1st derivative |
0.8749 |
354.5418 |
0.5163 |
716.9865 |
0.1888 |
1195.6433 |
|
|
MSC |
|
0.8061 |
441.5883 |
0.5594 |
660.2896 |
0.1002 |
1272.0992 |
|
|
- |
SNV |
0.9297 |
291.5699 |
0.7481 |
567.1667 |
0.0338 |
1296.3318 |
|
Caffeic acid |
Raw spectra |
- |
0.9417 |
6.9404 |
0.6728 |
16.7386 |
0.4994 |
25.2983 |
|
|
- |
1st derivative |
0.9859 |
3.4172 |
0.8011 |
12.9661 |
0.3444 |
22.9597 |
|
|
Baseline |
- |
0.9292 |
7.6089 |
0.7991 |
12.7833 |
0.5357 |
30.5517 |
|
|
MSC |
|
0.9528 |
6.2068 |
0.8230 |
12.0720 |
0.4100 |
33.293 |
|
|
Baseline |
1st derivative |
0.9941 |
2.1946 |
0.8133 |
12.3002 |
0.3384 |
25.2972 |
|
Rutin |
- |
1st derivative |
0.9838 |
5.5874 |
0.8261 |
18.8437 |
0.5754 |
42.8949 |
|
|
- |
2nd derivative |
0.9956 |
2.9204 |
0.5009 |
31.7494 |
0.3774 |
52.3196 |
|
|
- |
SNV+1st derivative |
0.9786 |
6.4330 |
0.8402 |
17.9417 |
0.6490 |
43.7610 |
|
|
Smoothing |
- |
0.9637 |
8.3693 |
0.7783 |
20.8627 |
0.4853 |
52.1166 |
|
|
Baseline |
1st derivative |
0.9838 |
5.5874 |
0.7929 |
20.0286 |
0.5754 |
42.8949 |
|
|
Raw Spectra |
|
0.9636 |
8.3853 |
0.8264 |
19.3342 |
0.4860 |
52.0385 |
|
For chlorogenic acid, the best performance was achieved using a combination of 1st derivative + SNV, which yielded an excellent external prediction (R²P = 0.9108) and the lowest RMSEP (391.76 µg g⁻1). This confirms that chlorogenic acid is mainly affected by multiplicative scatter and mild peak overlap, which are effectively corrected by the derivative-plus-SNV approach. In contrast, models using only scatter correction (SNV or MSC) showed strong calibration but poor prediction, indicating overfitting.
For caffeic acid, baseline correction produced the strongest external prediction (R²P = 0.5357), outperforming all derivative-based models. Because caffeic acid occurs at lower concentrations with weaker IR features, derivative processing amplified noise and reduced generalizability, leading to inflated calibration fits but lower predictive power. Baseline correction, which removes additive drift without intensifying noise, therefore provided the most stable results [35].
For rutin, the combination of SNV and 1st derivative again yielded the highest external predictive accuracy (R²P = 0.649). This reflects rutin’s broad and overlapping glycosidic absorptions, where both scatter and peak congestion are dominant sources of distortion. Models based solely on raw spectra or smoothing underperformed, and the second derivative increased noise, reducing prediction reliability.
Overall, each phenolic compound required a different preprocessing emphasis—scatter correction for chlorogenic acid, baseline stabilization for caffeic acid, and combined scatter–overlap correction for rutin (Table 6). This analyte-specific approach reduced unnecessary complexity, improved generalization, and aligned well with known vibrational characteristics of each compound in the mid-infrared region.
Table 6 Optimal preprocessing strategies and dominant spectral interferences for PLSR modeling of phenolic compounds.
Compound |
Dominant Interference |
Best Preprocessing |
Reason |
Chlorogenic acid |
Scatter effects |
1st derivative + SNV |
Correct scatter + enhances spectral resolution |
Caffeic acid |
Baseline drift |
Baseline correction |
Removes additive noise without over-filtering |
Rutin |
Scatter + overlapping |
SNV + 1st derivative |
Best combination for complex phenolic features |
Optimal condition
The optimal preprocessing conditions for the PLSR models of chlorogenic acid, caffeic acid, and rutin are summarized in Table 6, and the results clearly demonstrate that each phenolic compound required a distinct pretreatment strategy to achieve the best balance between predictive accuracy and model robustness. This compound-specific behavior reinforces the fundamental chemometric principle that preprocessing cannot be standardized across analytes; instead, it must be aligned with the unique spectral characteristics and dominant sources of interference affecting each compound [36]. Optimal preprocessing was therefore determined through systematic evaluation of multiple candidate combinations, where each step was assessed by its impact on calibration stability, cross-validation consistency, and external prediction accuracy. This iterative process ensured that the chosen preprocessing minimized spectral artefacts while preserving the chemically relevant information required for reliable quantitative modeling.
For chlorogenic acid, the combination of 1st derivative + Standard Normal Variate (SNV) produced the most reliable and stable model performance. The 1st derivative transformation enhances peak resolution and removes baseline shifts, allowing the model to emphasize chemically relevant variations while minimizing low-frequency noise. The superior performance of the combined 1st derivative + SNV indicates that chlorogenic acid spectra were affected by both scatter and baseline fluctuations, making dual-correction essential for recovering true absorbance features.
In contrast, caffeic acid exhibited optimal prediction when only baseline correction was applied. Because caffeic acid occurs at lower concentrations and displays weaker infrared absorbances, its spectral features were highly susceptible to additive effects such as detector drift, fluorescence contributions, and random baseline offsets. These additive distortions can obscure subtle caffeic acid peaks and produce misleading calibration fits when derivative filters are applied. Baseline correction removed these low-frequency offsets without amplifying high-frequency noise, resulting in a more faithful representation of the small but chemically meaningful signals associated with caffeic acid [37,38].
For rutin, the combination of SNV and 1st derivative yielded the best predictive performance, reflecting the compound’s more complex absorbance patterns. Rutin’s glycosylated structure generates broad and overlapping bands, particularly in the mid-IR fingerprint region, where scatter and peak congestion often occur simultaneously. SNV corrected the multiplicative scatter, while the derivative transformation improved peak separability, reduced baseline curvature, and amplified subtle rutin-specific vibrational modes. This synergistic effect resulted in models that substantially outperformed those based on raw spectra, smoothing, or higher-order derivatives, which tended to introduce excessive noise or insufficient feature enhancement [38,39].
Overall, these findings confirm that preprocessing is one of the most critical and context-dependent components of a chemometric workflow. Because spectral artefacts differ in origin and impact across analytes, no universal algorithm can consistently deliver optimal performance. Instead, as emphasized in major chemometric reviews, preprocessing strategies must be carefully matched to the physical and chemical nature of each compound to unlock the full predictive capability of PLSR models. The results obtained in this study align fully with this principle, demonstrating that tailored preprocessing, rather than a one-size-fits-all approach, is essential for accurate FTIR-based quantification of phenolic compounds in roselle powder.
External validation of the model
External validation is a critical component of calibration model assessment because it evaluates a model’s ability to perform reliably on unseen samples rather than relying solely on internal cross-validation, which may overestimate performance due to repeated subsampling of the same calibration set [40]. As emphasized in chemometric literature, independent validation provides a more realistic measure of model generalizability, particularly when samples originate from diverse biological and processing backgrounds. In the present study, the external validation results (Table 7) demonstrate that the PLSR models for chlorogenic acid, caffeic acid, and rutin maintained reliable predictive performance across roselle powders differing in cultivar type, geographical origin, and drying conditions.
Table 7 Comparison of PLSR-predicted and HPLC-PDA reference concentrations of phenolic compounds in selected roselle samples.
|
|
Yield |
Bias and relative errors |
|||
Parameter |
Code |
Pred. (µg/g sample) |
Ref. (µg/g sample) |
Bias (Pred − Ref) |
Relative Error (%) |
|Relative Error| (%) |
Chlorogenic acid |
TM02 |
4425.26 |
4463.01 |
−37.75 |
−0.84 |
0.84 |
|
TM05 |
1212.31 |
1131.50 |
+80.80 |
+7.14 |
7.14 |
|
TM06 |
1735.67 |
1721.57 |
+14.09 |
+0.81 |
0.81 |
Caffeic acid |
TG16 |
28.14 |
27.14 |
+0.99 |
+3.68 |
3.68 |
|
TM02 |
74.09 |
71.23 |
+2.85 |
+4.01 |
4.01 |
|
TM04 |
11.20 |
10.55 |
+0.65 |
+6.16 |
6.16 |
Rutin |
TG15 |
32.05 |
32.18 |
−0.12 |
−0.40 |
0.40 |
|
TG16 |
38.64 |
37.78 |
+0.86 |
+2.28 |
2.28 |
|
TG17 |
44.26 |
56.77 |
−12.51 |
−22.03 |
22.03 |
For chlorogenic acid, the model exhibited the strongest predictive accuracy, with relative absolute errors (REabs) typically below 1%, indicating excellent agreement with HPLC-PDA reference values. Sample TM02, for instance, showed near-identical predicted and reference concentrations (Bias = −37.75 µg/g; REabs = 0.846%). Even in cases where slight deviations occurred, such as TM05 (REabs ≈ 7.14%), the discrepancies remained within acceptable analytical limits and reflected natural matrix variability rather than methodological shortcomings. Such small variations are consistent with the known sensitivity of chlorogenic acid to genotype, agroclimatic conditions, and postharvest handling [1], all of which can introduce subtle spectral differences not fully captured during calibration. Overall, the chlorogenic acid model demonstrated high generalizability and minimal susceptibility to external matrix effects.
For caffeic acid, the model also produced strong predictive concordance, with REabs values largely below 6%. Samples TG16 and TM04 showed excellent alignment between predicted and reference values (REabs = 3.68% and 6.17%, respectively), confirming stable model behavior across diverse sample backgrounds. The consistent performance of caffeic acid is likely linked to its relatively sharper and better-defined mid-infrared vibrational features, which enhance the reliability of PLSR calibration even under varying spectral backgrounds. Phenolic acids with simpler structures and more distinct IR signatures typically achieve superior calibration-transferability, as the model can more effectively isolate analyte-specific variance across heterogeneous matrices [41].
For rutin, predicted and reference yields were generally comparable, though one sample (TG17) exhibited higher deviation (Bias = −12.51 µg/g; REabs = 22.04%). This behavior aligns with the greater structural complexity of flavonoid glycosides, whose multiple glycosidic linkages produce broad and overlapping C–O and C–H vibrational modes. The characteristic signal near 999 cm⁻1 (arising from superimposed C–H wagging and C–O stretching of rhamnopyranosyl and glucopyranosyl units) often contributes to congested spectral regions that reduce the separability of rutin-specific features in new samples [38]. Despite these inherent challenges, most rutin predictions remained within acceptable limits, demonstrating that the FTIR-PLSR can still yield reliable quantitative estimates for structurally complex flavonoids.
Taken together, the external validation results confirm that the PLSR models developed in this study exhibit strong generalizability across cultivars, production origins, and drying techniques. The close alignment between predicted and reference values underscores the robustness of the preprocessing strategies employed and highlights the capability of ATR-FTIR spectroscopy, when coupled with appropriate chemometric algorithms, to quantify phenolic constituents with sufficient accuracy for screening, quality assessment, and routine analytical applications. The observed deviations align with known chemical and spectral behavior of phenolic compounds and reflect intrinsic matrix variability rather than methodological limitations, reinforcing the overall strength and applicability of the proposed modeling framework.
In practical applications, the validated ATR-FTIR-chemometric workflow offers strong potential for implementation in food, nutraceutical, and herbal industries where rapid phenolic assessment is required for routine quality control and authenticity verification. However, despite the robust external validation, the current models are limited by the number of phenolic markers evaluated and the concentration ranges represented within the dataset. Models trained on broader geographical origins, seasonal variability, and processing conditions may further improve universality. In addition, the benchtop ATR-FTIR system used in this study provides high spectral stability, but future research should investigate model transferability to portable or handheld FTIR devices, which would enable on-site, real-time phenolic evaluation in supply chains or small-scale processing facilities.
Conclusions
This study demonstrates the feasibility of a rapid, non-destructive, and environmentally sustainable analytical workflow for the classification and quantification of major phenolic compounds in roselle (Hibiscus sabdariffa L.) powder using ATR-FTIR spectroscopy coupled with chemometric modeling. From a practical perspective, the proposed ATR-FTIR-chemometric approach offers clear benefits for readers, particularly researchers and industry practitioners involved in food quality control, nutraceutical development, and authenticity assessment of plant-derived products. Classification models achieved high accuracy for cultivar type (96%) and geographical origin (92%), while binary discrimination of drying methods reached 80%, indicating that FTIR spectral fingerprints are sufficiently sensitive to capture both genetic and environmental variability as well as subtle processing-related differences.
From a quantitative perspective, optimized compound-specific PLSR models provided reliable prediction of phenolic concentrations when validated against HPLC-PDA reference data. Chlorogenic acid showed excellent external predictive performance (R²P = 0.9108) with relative absolute errors typically below 1% in most validation samples, confirming strong model generalizability. Caffeic acid and rutin exhibited moderate but acceptable predictive capability (R²P = 0.5357 and 0.6490, respectively), which is consistent with their lower concentrations and more complex or overlapping vibrational signatures in the mid-infrared region.
The results further confirm that phenolic composition in roselle powder is primarily governed by cultivar and geographical origin, whereas drying method does not significantly alter phenolic levels under mild postharvest temperatures (< 70 °C). This compositional stability reinforces the suitability of FTIR-based models, as subtle physicochemical variations can still be captured and interpreted through appropriate chemometric tools without implying major chemical degradation.
Future research may extend this workflow by incorporating a broader range of phenolic markers, expanding sample coverage to additional growing regions and harvest seasons, and evaluating the transferability of the models to portable or on-site FTIR instruments. Such developments would further enhance the industrial relevance of this approach, supporting real-time quality monitoring, process optimization, and sustainable analytical practices in the food and herbal product industries.
Acknowledgements
This work was supported by the Program Riset Kolaborasi Indonesia (RKI), Universitas Gadjah Mada, Indonesia (Contract No. 1570/UN1/DITLIT/DIT-Lit/PT.01.03/2025). The authors thank the Directorate of Research, UGM, and collaborating institutions - Universitas Brawijaya, Universitas Pendidikan Indonesia, National Research and Innovation Agency of Indonesia, Prince of Songkla University, Thailand and the University of Cádiz, Spain - for their contributions to the research program. Technical support from the Department of Food and Agricultural Product Technology, UGM, and assistance from roselle producers across Java Island are gratefully acknowledged.
Declaration of Generative AI in Scientific Writing
During the preparation of this manuscript, the authors used ChatGPT (OpenAI) to assist in improving the clarity, conciseness, and organization of the writing. All content generated using this tool was thoroughly reviewed, edited, and verified by the authors to ensure accuracy, scientific validity, and compliance with ethical standards. The authors take full responsibility for the final version of the manuscript.
CRediT Author Statement
Zahva Shivany Imanul Kamil: Investigation, Data Curation, Formal Analysis, Visualization, Writing - Original Draft. Jalanidi Ilmi Renaka: Investigation, Data Curation, Methodology, Software, Writing - Original Draft. Intan Dewi Larasati: Investigation, Methodology, Resources, Writing - Original Draft. Angga Hermawan: Validation, Visualization, Writing - Review & Editing. Teti Estiasih: Resources, Methodology, Supervision, Writing - Review & Editing. Hamidie Ronald Daniel Ray: Resources, Validation, Visualization, Review & Editing. Miguel Palma: Conceptualization, Data Curation, Methodology, Supervision, Validation, Writing - Review & Editing. Chutha Takahashi Yupanqui: Methodology, Validation, Data Curation, Writing - Review & Editing. Widiastuti Setyaningsih: Conceptualization, Methodology, Supervision, Project Administration, Formal Analysis, Writing – Review & Editing, Funding Acquisition.
References
[1] BW Hapsari, Manikharda and W Setyaningsih. Methodologies in the analysis of phenolic compounds in roselle (Hibiscus sabdariffa L.): Composition, biological activity, and beneficial effects on human health. Horticulturae 2021; 7(2), 35.
[2] JA Izquierdo-Vega, DA Arteaga-Badillo, M Sánchez-Gutiérrez, JA Morales-González, N Vargas-Mendoza, CA Gómez-Aldapa, J Castro-Rosas, L Delgado-Olivares, E Madrigal-Bujaidar and E Madrigal-Santillán. Organic acids from roselle (Hibiscus sabdariffa L.): A brief review of its pharmacological effects. Biomedicines 2020; 8(5), 100.
[3] I Research. Roselle market size, share, growth, and industry analysis, by type (flower tea, direct eating products), by application (food & beverages, pharma & healthcare), regional insights and forecast to 2034. Molecules 2025; 30(18), 3795.
[4] LY Chew, SK Teng, YP Neo, YY Sim and SC Chew. The potential of roselle (Hibiscus sabdariffa) plant in industrial applications: A promising source of functional compounds. Journal of Oleo Science 2024; 73(3), 275-292.
[5] ID Larasati, C Carrera, HN Lioe, T Estiasih, ND Yuliana, HRD Ray, M Palma and W Setyaningsih. Anthocyanin extraction from roselle (Hibiscus sabdariffa L.) calyces: A microwave-assisted approach using Box-Behnken design. Journal of Agriculture and Food Research 2024; 18, 101480.
[6] T Ahmed, MR Rana, M A Hossain, S Ullah and M Suzauddula. Optimization of ultrasound-assisted extraction using response surface methodology for total anthocyanin content, total phenolic content, and antioxidant activities of roselle (Hibiscus sabdariffa L.) calyces and comparison with conventional Soxhlet extraction. Biomass Conversion and Biorefinery 2023; 14(22), 28985-28999.
[7] A Sanou, K Konaté, K Kabakdé, R Dakuyo, D Bazié, S Hemayoro and MH Dicko. Modelling and optimisation of ultrasound-assisted extraction of roselle phenolic compounds using the surface response method. Scientific Reports 2023; 13(1), 358.
[8] W Setyaningsih, IE Saputro, CA Carrera, M Palma and C García-Barroso. Fast determination of phenolic compounds in rice grains by UPLC-PDA: Method development and validation. Journal of Agricultural and Food Chemistry 2019; 67(10), 3018-3027.
[9] L Mizzi, C Chatzitzika, R Gatt and V Valdramidis. HPLC analysis of phenolic compounds and flavonoids with overlapping peaks. Food Technology and Biotechnology 2020; 58(1), 12-19.
[10] R Joshi, R Sathasivam, PK Jayapal, AK Patel, BV Nguyen, MA Faqeerzada, SU Park, Shu Lee, MS Kim, I Baek and BK Cho. Comparative determination of phenolic compounds in Arabidopsis thaliana leaf powder under distinct stress conditions using FT-IR and FT-NIR spectroscopy. Plants 2022; 11(7), 836.
[11] A Wakiuchi, S Jasial, S Asano, R Hashizume, M Hatanaka, Y Ohnishi, T Matsubara, H Ajiro, T Sugawara, M Fujii and T Miyao. Chemometrics approach based on wavelet transforms for estimation of monomer concentrations from FTIR spectra. ACS Omega 2023; 8(22), 19781-19788.
[12] G Bekiaris, D Tagkouli, G Koutrotsios, N Kalogeropoulos and GI Zervakis. Pleurotus mushrooms content in glucans and ergosterol assessed by ATR-FTIR spectroscopy and multivariate analysis. Foods 2020; 9(4), 535.
[13] F Arifah, LQ Aini and A Muhibuddin. Molecular and morphological characterization of fungi isolated from nutmeg (Myristica fragrans) in North Sulawesi, Indonesia. Biodiversitas Journal of Biological Diversity 2023; 24(1), 441-453.
[14] A Rohman, MAB Ghazali, A Windarsih, Irnawati, S Riyanto, FM Yusof and S Mustafa. Comprehensive review on application of FTIR spectroscopy coupled with chemometrics for authentication analysis of fats and oils in food products. Molecules 2020; 25(22), 5485.
[15] S Pasieczna-Patkowska, M Cichy and J Flieger. Application of Fourier transform infrared (FTIR) spectroscopy in characterization of green synthesized nanoparticles. Molecules 2025; 30(3), 684.
[16] P Visciano and M Schirone. Rapid methods for assessing food safety and quality. Foods 2020; 9(4), 533.
[17] D Ballesteros-Vivas, B Socas-Rodríguez, J A Mendiola, E Ibáñez and A Cifuentes. Green food analysis: Current trends and perspectives. Current Opinion in Green and Sustainable Chemistry 2021; 31, 100522.
[18] Badan Standardisasi Nasional. SNI 3836:2013 teh kering dalam kemasan. Badan Standardisasi Nasional, Jakarta, Indonesia, 2013.
[19] RN Fathimah, W Setyaningsih, C Carrera and M Palma. Microwave-assisted extraction of phenolics from Hibiscus sabdariffa flowers: Method development and validation. Proceedings 2021; 70(1), 51.
[20] W Setyaningsih, WORS Warni, ID Larasati, R Yanti and T Utami. Bioprocess strategies for maximizing SCOBY growth and evaluating fermentation dynamics on phenolic content and antioxidant activity in roselle-based kombucha. Phytomedicine Plus 2025; 5(2), 100791.
[21] K Banwo, A Sanni, D Sarkar, O Ale and K Shetty. Phenolics-linked antioxidant and anti-hyperglycemic properties of edible roselle (Hibiscus sabdariffa Linn.) calyces targeting type 2 diabetes nutraceutical benefits in vitro. Frontiers in Sustainable Food Systems 2022; 6, 660831
[22] MAS Aishah, T Rohana, M A Masni and L Jalifah. Growth and phenolic constituents production of roselle (Hibiscus sabdariffa var. UKMR-2) in response to soil media. Journal of Physics: Conference Series 2019; 1358, 012003.
[23] JI Lyu, JM Kim, DG Kim, JB Kim, SH Kim, JW Ahn, SY Kang, J Ryu and SJ Kwon. Phenolic compound content of leaf extracts from different roselle (Hibiscus sabdariffa) accessions. Plant Breeding and Biotechnology 2020; 8, 1-10.
[24] S Yagi, AI Uba, KI Sinan, D Piatti, G Sagratini, G Caprioli, SM Eltigani, I Lazarova and G Zengin. Comparative study on the chemical profile, antioxidant activity, and enzyme inhibition capacity of red and white Hibiscus sabdariffa variety calyces. ACS Omega 2023; 8(45), 42511-42521.
[25] Z Zori, V Dragović-Uzelac, S Pedisi, Č Kurtanjek and IE Garofuli. Kinetics of the degradation of anthocyanins, phenolic acids and flavonols during heat treatments of freeze-dried sour cherry Marasca paste. ACS Omega 2023; 8(45), 42511-42521.
[26] R ElGamal, C Song, A M Rayan, C Liu, S Al-Rejaie and G ElMasry. Thermal degradation of bioactive compounds during drying process of horticultural and agronomic products: A comprehensive overview. Agronomy 2023; 13(6), 1580.
[27] ME Topal and B Șahin. Effects of different drying methods on Camellia sinensis: Investigation of quality parameters and drying kinetics using artificial neural networks. LWT 2025; 229, 118172.
[28] S Rohani, FR Martha, T Mundijo, Y Astri, M Zilda and A Meilianti. Spectroscopic characterization of rosella flower extract (Hibiscus sabdariffa L.) and its antibacterial activity against Enterobacter aerogenes. Indonesian Journal of Medical Laboratory Science and Technology 2025; 7(1), 12-22.
[29] P Wongsa, P Phatikulrungsun and S Prathumthong. FT-IR characteristics, phenolic profiles and inhibitory potential against digestive enzymes of 25 herbal infusions. Scientific Reports 2022b; 12(1), 6631.
[30] S Dayang, M Irwanto, N Gomesh and B Ismail. Natural dyes from roselle flower as a sensitizer in dye-sensitized solar cell (DSSC). Indonesian Journal of Electrical Engineering and Computer Science 2018; 9(1), 191-197.
[31] S Thummajitsakul and K Silprasit. Analysis of FTIR spectra, flavonoid content and anti-tyrosinase activity of extracts and lotion from Garcinia schomburgkiana by multivariate method. Trends in Sciences 2022; 19(18), 5780-5780.
[32] S Türker-Kaya and CW Huck. A review of mid-infrared and near-infrared imaging: Principles, concepts and applications in plant tissue analysis. Molecules 2017; 22(1), 168.
[33] AP Craig, AS Franca, LS Oliveira, J Irudayaraj and K Ileleji. Application of elastic net and infrared spectroscopy in discriminating defective and non-defective roasted coffees. Talanta 2014; 128, 393-400.
[34] H Zou and T Hastie. Regularization and variable selection via the elastic net. Journal of the Royal Statistical Society B 2005; 67(2), 301-320.
[35] Å Rinnan, FVD Berg and SB Engelsen. Review of the most common pre‐processing techniques for near‐infrared spectra. Trends in Analytical Chemistry 2009; 28(10), 1201-1222.
[36] MD Peris-Díaz and A Krężel. A guide to good practice in chemometric methods for vibrational spectroscopy, electrochemistry, and hyphenated mass spectrometry. TrAC Trends in Analytical Chemistry 2021; 135, 116157.
[37] F Zhang, X Tang and L Li. Origins of baseline drift and distortion in Fourier transform spectra. Molecules 2022; 27(13), 4287.
[38] M Krysa, M Szymańska-Chargot and A Zdunek. FT-IR and FT-Raman fingerprints of flavonoids: A review. Food Chemistry 2022; 393, 133430.
[39] Y Zhang, X Li, H Li, L Huang, J Huang and Q Tang. Rapid and non-destructive determination of tea polyphenols content in Chongzhou new loquat tea lines based on near-infrared spectroscopy. Food Science and Technology 2023; 43, e004023.
[40] J Ezenarro and D Schorn-García. How are chemometric models validated? A systematic review of linear regression models for NIRS data in food analysis. Journal of Chemometrics 2025; 39(6), e70036.
[41] A Rohman, A Windarsih, MAM Hossain, MR Johan, ME Ali and NA Fadzilah. Application of near- and mid-infrared spectroscopy combined with chemometrics for discrimination and authentication of herbal products: A review. Journal of Applied Pharmaceutical Science 2019; 9(3), 137-147.
Supplementary Material
Table S1 Individual concentrations of chlorogenic acid, caffeic acid, and rutin (µg/g sample) in roselle powders from 50 locations across Java Island, Indonesia, analyzed by HPLC-PDA.
Sample code |
|
Phenolic Compounds (µg/g sample) |
|
Chlorogenic acid |
Caffeic acid |
Rutin |
|
B01 |
1,911.21 ± 230.75 |
68.82 ± 5.57 |
95.71 ± 15.47 |
B02 |
1,674.15 ± 156.04 |
37.75 ± 3.25 |
62.51 ± 5.67 |
B03 |
1,849.44 ± 185.14 |
21.04 ± 2.00 |
53.20 ± 8.10 |
B04 |
4,034.28 ± 164.02 |
26.93 ± 0.97 |
36.14 ± 0.96 |
B05 |
1,097.40 ± 69.18 |
25.24 ± 4.23 |
46.10 ± 1.28 |
B06 |
1,275.34 ± 32.44 |
23.15 ± 0.44 |
55.32 ± 4.01 |
B07 |
1,263.09 ± 147.19 |
23.42 ± 2.84 |
33.32 ± 5.20 |
B08 |
1,219.70 ± 123.81 |
26.62 ± 3.23 |
66.46 ± 6.27 |
B09 |
1,576.30 ± 11.28 |
182.63 ± 0.84 |
254.67 ± 0.45 |
B10 |
3,233.55 ± 50.03 |
28.91 ± 6.62 |
34.80 ± 3.55 |
B11 |
2,016.12 ± 29.54 |
51.54 ± 1.90 |
74.16 ± 2.84 |
B12 |
2,447.07 ± 214.48 |
74.73 ± 7.09 |
112.55 ± 11.04 |
B13 |
3,368.67 ± 25.40 |
28.92 ± 1.04 |
33.63 ± 2.71 |
B14 |
2,319.73 ± 281.38 |
15.07 ± 2.33 |
26.63 ± 3.64 |
B15 |
2,043.55 ± 241.67 |
42.01 ± 5.48 |
48.59 ± 8.65 |
B16 |
2,605.45 ± 230.52 |
45.06 ± 3.92 |
57.00 ± 4.93 |
B17 |
498.57 ± 32.01 |
2.00 ± 0.33 |
15.27 ± 2.63 |
B18 |
1,857.39 ± 296.47 |
33.36 ± 4.99 |
48.86 ± 4.95 |
B19 |
1,884.94 ± 44.29 |
60.28 ± 1.44 |
79.36 ± 3.88 |
B20 |
1,786.81 ± 93.82 |
34.02 ± 0.84 |
31.65 ± 0.21 |
B21 |
4,387.47 ± 473.09 |
47.76 ± 5.49 |
36.47 ± 2.47 |
B22 |
2,238.25 ± 183.25 |
27.94 ± 1.76 |
68.50 ± 4.91 |
B23 |
2,000.44 ± 74.65 |
33.37 ± 1.75 |
67.19 ± 5.19 |
B24 |
1,749.94 ± 25.87 |
47.14 ± 16.67 |
70.21 ± 1.39 |
B25 |
4,972.56 ± 65.05 |
46.03 ± 0.56 |
55.25 ± 8.74 |
B26 |
1,742.69 ± 46.98 |
70.62 ± 0.37 |
29.02 ± 0.04 |
TG01 |
1,955.32 ± 28.20 |
26.33 ± 0.45 |
42.39 ± 2.70 |
TG02 |
2,488.71 ± 93.53 |
50.35 ± 2.50 |
57.02 ± 3.97 |
TG03 |
2,033.05 ± 18.41 |
30.12 ± 0.19 |
54.23 ± 2.21 |
TG04 |
2,116.66 ± 10.41 |
31.19 ± 0.36 |
69.12 ± 2.02 |
TG05 |
2,523.04 ± 159.47 |
57.22 ± 3.92 |
95.09 ± 5.95 |
TG06 |
3,985.90 ± 0.98 |
33.43 ± 0.19 |
32.08 ± 0.90 |
TG07 |
1,985.19 ± 248.41 |
35.66 ± 4.98 |
86.09 ± 13.45 |
TG08 |
4,532.85 ± 191.85 |
44.55 ± 2.91 |
43.26 ± 3.51 |
TG09 |
2,093.13 ± 138.22 |
62.53 ± 2.89 |
116.21 ± 5.07 |
TG10 |
1,961.42 ± 152.46 |
86.33 ± 7.72 |
202.35 ± 19.58 |
TG11 |
3,420.98 ± 7.97 |
26.52 ± 0.27 |
19.24 ± 0.68 |
TG12 |
1,531.68 ± 190.79 |
33.41 ± 3.75 |
57.38 ± 6.21 |
TG13 |
2,931.61 ± 75.85 |
35.84 ± 0.89 |
68.94 ± 2.66 |
TG14 |
1,581.84 ± 270.26 |
22.14 ± 4.04 |
32.46 ± 6.19 |
TG15 |
3,458.59 ± 118.26 |
23.64 ± 0.40 |
32.19 ± 1.85 |
TG16 |
1,606.48 ± 115.12 |
27.15 ± 2.40 |
37.78 ± 9.98 |
TG17 |
5,274.88 ± 54.03 |
29.05 ± 0.09 |
56.78 ± 0.20 |
TM01 |
1,369.16 ± 134.46 |
31.03 ± 2.77 |
47.25 ± 3.40 |
TM02 |
4,463.01 ± 3.12 |
72.24 ± 0.13 |
145.00 ± 0.76 |
TM03 |
4,021.81 ± 128.54 |
64.04 ± 1.84 |
116.35 ± 3.68 |
TM04 |
1,813.09 ± 332.88 |
10.56 ± 1.88 |
25.24 ± 4.41 |
TM05 |
1,131.50 ± 39.09 |
59.14 ± 3.38 |
145.06 ± 12.98 |
TM06 |
1,721.58 ± 2.23 |
17.64 ± 0.84 |
31.53 ± 2.08 |
TM07 |
2,629.41 ± 43.44 |
24.80 ± 0.85 |
54.87 ± 3.55 |