Trends
Sci.
2026;
23(7):
12496
Anthocyanin Identification in Miana Leaf (Coleus scutellarioides L. Benth) Extracts Using Different Solvents and Maceration Times for Application as a Poultry Feed Additive
Miftahul
Jannah1,
![]() ,
Armita Harahap2,
,
Armita Harahap2,
![]() ,
Valdy Filando Sardi2,
,
Valdy Filando Sardi2,
![]() ,
Yose Rizal3,
,
Yose Rizal3,
Friardi
Ismed4,
![]() and Maria Endo Mahata3,*,
and Maria Endo Mahata3,*,
![]()
1Doctoral Program, Faculty of Animal Science, Universitas Andalas, Limau Manis Campus,
West Sumatra 25163, Indonesia
2Doctoral Program, Faculty of Pharmacy, Universitas Andalas, Limau Manis Campus, West Sumatra 25163, Indonesia
3Department of Animal Nutrition, Faculty of Animal Science, Universitas Andalas, Limau Manis Campus,
West Sumatra 25163, Indonesia
4Department of Pharmacy, Faculty of Pharmacy, Universitas Andalas, Limau Manis Campus,
West Sumatra 25163, Indonesia
(*Corresponding author’s e-mail: [email protected])
Received: 1 November 2025, Revised: 25 November 2025, Accepted: 10 December 2025, Published: 10 February 2026
Abstract
This study aims to identify the type of solvents and their maceration durations for the extraction of anthocyanins from Coleus scutellarioides L. Benth (C. scutellarioides) leaves using the maceration method. It also aims to characterize the anthocyanin profile, which could be utilized as a potential feed additive to reduce cholesterol levels in poultry meat. The study employed a completely randomized design with 2 factors. The first factor (A) was solvent: Aquadest, aquadest + 0.5% citric acid, and 70% ethanol. The second factor (B) was maceration durations: 6, 12, 24, and 48 h for C. scutellarioides leaves. Measured variables included color measurement, extract yield, total anthocyanin content (TAC), thin layer chromatography (TLC) extract-yield profile, and identification of anthocyanins by LC-MS/MS. Statistical analysis showed a significant interaction effect (p < 0.05) between solvent type and maceration duration on color measurement, extract yield, and TAC of C. scutellarioides extract. The TLC profile of C. scutellarioides extract using the citroborate reagent revealed 7 distinct spots with aquadest, 8 with aquadest with 0.5% citric acid, and 8 with 70% ethanol as solvents. Based on the highest TAC value obtained for each solvent type and maceration duration, LC-MS/MS analysis was conducted. The results identified 4 different anthocyanin compounds in the aquadest extract, 6 in the aquadest with 0.5% citric acid extract, and 5 in the 70% ethanol extract. It can be concluded that the optimal solvent type and maceration duration for anthocyanin extraction from C. scutellarioides are aquadest with 0.5% citric acid for 12 h. Under these conditions, 6 distinct anthocyanins were identified: cyanidin-3-glucoside, cyanidin 3-O-(p-coumaroyl) glucoside-5-O-malonyglucoside I, cyanidin-3-O-glucuronide, pelargonidin-3-glucuronide, cyanidin, and pelargonidin, with a total phenolic content of 72.14 mg GAE/g extract. Three of these (cyanidin-3-glucoside, cyanidin, and pelargonidin) have been reported to inhibit cholesterol synthesis.
Keywords: Coleus scutellarioides L. Benth, Feed additive, Anthocyanin, Cholesterol, Poultry, Solvent, Duration maceration
Introduction
Poultry meat, particularly broiler chicken, is expected to contribute around 43% of total global meat protein consumption by 2033 [1]. This increase in consumption is considered to be particularly pronounced in middle-income countries like Indonesia, where broiler meat already accounts for approximately 60% of the total national meats demand [2]. This highlights the crucial role of broiler meat as an affordable and accessible source of animal protein for the population. However, with rising demand, concerns have been raised about the increased fat and cholesterol content in broiler meat, which is higher compared to indigenous chicken meat. According to research by Ganeco et al. [3], the fat content in broiler chicken thigh meat was recorded at 7.53%, compared to only 2.76% in indigenous chicken thigh meat [4]. Additionally, the cholesterol content in broiler thigh meat reached 92.22 mg/100 g, while indigenous chicken was recorded at 85 mg/100 g [5]. This is a major concern, especially for individuals with lipid metabolism issues such as hyperlipidemia and coronary heart disease [3].
For this reason, modifying poultry feed is one of solutions that can be considered. One approach that can be applied is the use of feed additives, which are compounds or additional ingredients provided to feed or drink to improve poultry health and the quality of the meat produced. Some natural compounds, such as anthocyanins found in plants like C. scutellarioides leaves, have emerged as promising candidates [6].
Anthocyanins found in the leaves of C. scutellarioides, particularly the cyanidin type [7], and pelargonidin 3-rutinoside and cyanidin-3-glycoside [8], are known to have the potential to lower cholesterol levels in the body [9]. Anthocyanins are also reported to activate AMP-activated protein kinase (AMPK), which inhibits the HMG-CoA reductase enzyme, thereby halting cholesterol synthesis [10-12] Previous research showed that supplementation with 400 mg/kg of Hisbiscus sabdrifah flower anthocyanin's extract in feed reduced serum triglyceride levels by 8.7% (from 1.26 to 1.15 mmol/L) in broilers [13]. Additionally, the administration of C. scutellarioides leaves powder as feed for broilers successfully reduced total cholesterol, triglyceride, and LDL levels, while increasing HDL levels in broiler serum, without causing negative side effects on the physiological development [6,14]. However, most of these studies are still limited, particularly to obtain C. scutellarioides leaves extracts using different solvents and extraction duration. So further research is needed to study regarding color measurement of anthocyanin, extract yield, TAC, profile TLC, and identify the total anthocyanin content of C. scutellarioides leaves as a feed additive for lowering cholesterol of poultry meat.
Previous studies have shown that the type of solvent and extraction time significantly influence anthocyanin and color stability [15]. Solvent polarity affects pigment solubility and stability, thereby determining extract yield and anthocyanin concentration [16]. Meanwhile, longer maceration durations may enhance pigment diffusion but also increase degradation due to oxidation and light exposure [17]. Hence, optimizing both solvent type and maceration duration is crucial to achieve high pigment recovery, color measurement, and a distinct anthocyanin profile.
This study is important to determine the appropriate solvent type and maceration duration for anthocyanin extraction using the maceration method, as well as to identify the anthocyanin profile of C. scutellarioides leaves as a feed additive administered through drinking water to reduce cholesterol levels in poultry meat. This effort is expected to contribute to addressing human health concerns and promoting the sustainability of the poultry industry.
Materials and methods
Material
The C. scutellarioides leaves used in this study were cultivated by local farmers in Alahan Panjang, Solok Regency, West Sumatra, Indonesia. The plant materials were identified at the Herbarium Laboratory of Andalas University (ANDA), Department of Biology, Faculty of Mathematics and Natural Sciences, Universitas Andalas, under voucher specimen number 899/K-ID/ANDA/XII/2024.
Preparation of extract anthocyanin from C. scutellarioides leaves
Preparation of an anthocyanin extract from C. scutellarioides leaves was carried out according to the method [18] with modifications. First, the leaves were air-dried at 35 °C. Then, 250 g dried of leaves was ground into powder. Next, 10 g of the powder was extracted by maceration with 3 types of solvents: Aquadest (pH 6.93), aquadest + 0.5% citric acid (pH 2.16), and 70% ethanol (pH 6.65) using a 1:10 (w/v) ratio, for 6, 12, 24, and 48 h at 4 °C. After extraction, the mixture was filtered using Whatman No. 1 paper, and the filtrate was measured for color the extracts from aquadest and aquadest + 0.5% citric acid were then dried with a freeze dryer (Buchi® Lyovapor L-300). The ethanol extract was first evaporated using a rotary evaporator (Buchi® Revator R-210) and then dried in a freeze dryer. All dried extracts were stored a −4 °C for further analysis. The preparation an extract yield in Figure 1.
Experimental design
This study was conducted using a completely randomized design (CRD) arranged in a 3×4 factorial pattern with 2 replications. Factor A consisted of 3 types of solvents (aquadest, aquadest + 0.5% citric acid, and 70% ethanol), while Factor B consisted of 4 maceration durations (6, 12, 24, and 48 h).
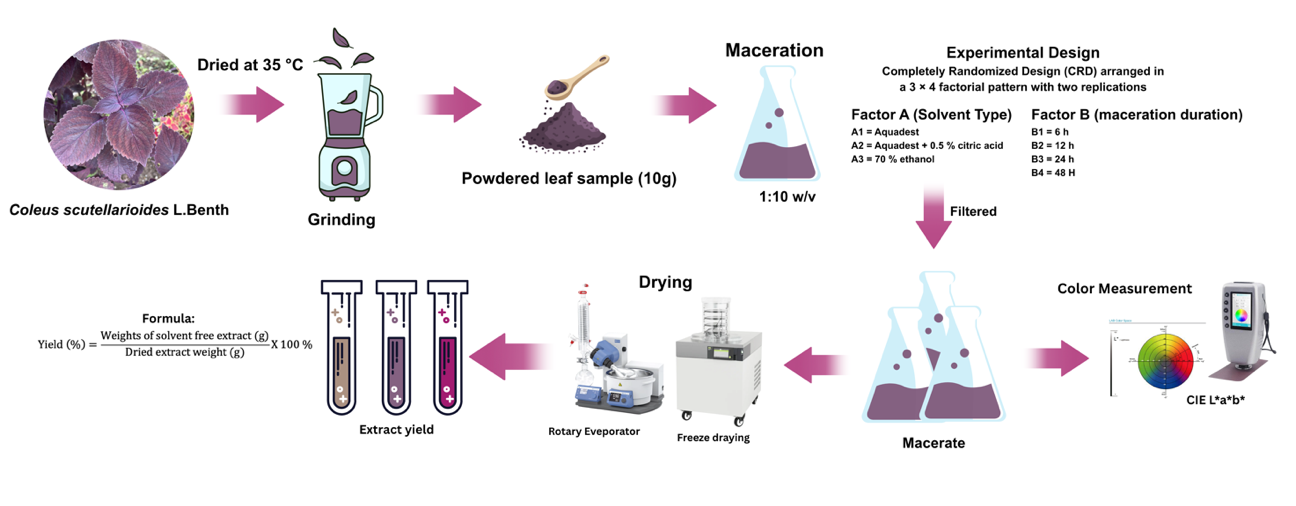
Figure 1 Flow diagram the process of anthocyanin extraction from C. scutellarioides leaves and extract yield.
Measurement
Color measurement
The color measurement of the C. scutellarioides leaves extract anthocyanin extract was measured by the modified method [19], with a Minolta CR 400 colorimeter, on the CIE Lab color scale (L*, a*, b*). The anthocyanin color intensity was read using the colorimeter, and the average value of the anthocyanin filtrate for each flower, along with the standard deviation, was calculated. The total color change (ΔE) for each sample was calculated using the formula below:
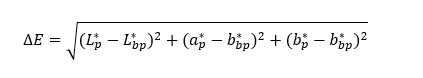
Explanation: ΔE = Total color change; L * = Lightness; a * = Negative values indicate green, while positive values indicate red; b * = Negative values indicate blue, while positive values indicate yellow; p = Blank; bp = Sample extract.
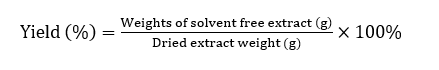
Extract yield
The extract yield (%) of the C. scutellarioides leaves extract was calculated using the formula described Gonfa et al. [20] as follows:
Total anthocyanin content (TAC)
The total anthocyanin content of C. scutellarioides leaves extract was analyzed using the pH differential method as described by Lee et al. [21], with measurements performed using a SmartReader UV-Vis Microplate Absorbance Reader (96-well plate, 15 V). 10 mg of anthocyanin extract from C. scutellarioides leaves were diluted into 2 different buffer solutions, namely potassium chloride buffer (0.025 M KCl) with pH 1.0 and sodium acetate buffer (0.4 M CH3COONa) with pH 4.5. The pH of these buffer solutions was calibrated to 1.0 and 4.5, respectively. After homogenizing, each solution was incubated for 15 - 30 min at room temperature, in the dark, and then the absorbance was measured using the Microplate Reader at 2 wavelengths: 510 and 700 nm.

The total anthocyanin content of the extract was calculated as cyanidin-3-glucoside monomer, based on the following formula as below [21]:
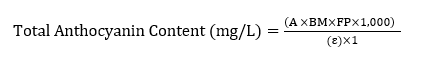
Explanation: A = Absorbance of solutions A and B; BM = Molecular weight of cyanidin-3-glucoside (448.8); FP = Dilution factor (0.004); ɛ = Molar absorptivity of cyanidin-3-glucoside (26.900); 1 = Cuvette path length (cm)
Profile of thin layer chromatography (TLC)
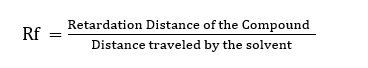
Thin-layer chromatography (TLC) was performed according to the method described by Sampath and Vasanthi [22], with slight modifications. The C. scutellarioides leaves extract was dissolved in 96% methanol to a final concentration of 2 mg/mL. A single drop of the solution was carefully spotted onto an aluminum-backed silica gel GF254 plate (10×12 cm2), positioned 1 cm from the bottom edge. The plate was then air-dried and placed in a chromatography chamber pre-saturated with the eluent. The eluent system used for anthocyanin separation consisted of ethyl acetate, acetic acid, formic acid, and water in a ratio of 60:6:6:15 (v/v/v/v). The developed chromatogram was visualized under UV light at 254 and 365 nm, followed by spraying with a citroborate reagent to identify compound classes. Yellow, blue, and green fluorescent spots indicated the presence of flavonoids in the extract. The visible spots were marked, and the migration distances were measured to calculate the retardation factor (Rf) values using the following formula:
Analysis of anthocyanin compounds by LC-MS/MS
The analysis of anthocyanin compounds in C. scutellarioides leaves extract was performed using LC-MS/MS at the Forensic Laboratory Center (Puslabfor), Bogor. The procedure followed the method described by Ismed et al. [23], utilizing an ACQUITY UPLC H-Class system (Waters, USA) coupled with a Xevo G2-S QTof mass spectrometer (Waters, USA). Compound separation was achieved on a C18 column (1.8 μm, 2.1×100 mm2) maintained at 50 °C. The mobile phase consisted of 2 solvents: Water with 5 mM ammonium formate (phase A) and acetonitrile with 0.05% formic acid (phase B). The flow rate was set at 0.2 mL/min, employing a gradient elution program over 23 min. A 5 μL sample was injected after filtration through a 0.2 μm membrane filter. Mass spectrometric detection was conducted in positive electrospray ionization mode (ESI⁺) with a mass range of 50 - 1,200 m/z. The source and desolvation temperatures were maintained at 100 and 350 °C, respectively, with a cone gas flow rate of 0 L/h and a desolvation gas flow rate of 793 L/h. The collision energy was varied from 4 to 60 eV.
Determination of total phenolic contents (TPC)
The total phenolic content of the extracts from C. scutellarioides was determined by using the Folin-Ciocalteu assay [24] with minor modifications. Gallic acid standard solutions were prepared at concentrations of 0, 20, 40, 60, 80, and 100 µg/mL to construct the calibration curve, and each concentration was prepared in duplicate. The extract samples were analyzed in 2 independent replicates and 3 time at a concentration of 1,000 µg/mL. An aliquot of 0.1 mL of the sample solution was mixed with 0.5 mL of 10% (v/v) Folin-Ciocalteu reagent and allowed to stand for 3 min. Subsequently, 0.4 mL of 7.5 %(w/v) Na2CO3 solution was added. The reaction mixture was incubated at room temperature for 60 min, after which the absorbance was measured at 765 nm using a UV-Vis spectrophotometer. All measurements were performed twice and carried out in 3 different times. The mean absorbance values of the standards were used to construct the calibration curve and generate the regression equation. Curve linearity was assessed using the coefficient of determination (R²). The phenolic content of each sample was calculated from the regression equation and expressed as milligrams of gallic acid equivalent per gram of dry extract (mg GAE/g). The total phenolic content can be calculated using the formula:
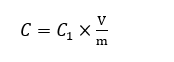
where C = total phenolic content in mg/g, in GAE (Gallic acid equivalent), C1 = concentration of Gallic acid established from the calibration curve in mg/mL, V = volume of extract in mL, and m = the weight of the plant extract in g.
Data analysis
Statistical analysis of the data on color parameters, extract yield, and total anthocyanin content was conduted using analysis of variance (ANOVA) based on a completely randomized design (CRD) with in a 3×4 factorial arrangement. To identify differences among treatment means, Duncan’s Multiple Range Test (DMRT) [25] was used. Subsequently, anthocyanin profiles from LC-MS/MS analysis were processed and visualized as tables, chromatograms, and spectra using MassLynx software (Version 4.1) [26].
Results and discussion
Color measurement
The results of the color analysis of C. scutellarioides leaves extract are presented in Table 1. There was a significant interaction (p < 0.05) between the type of solvent and maceration duration on the L*, a*, b*, and ΔE values of the C. scutellarioides leaves extract.
Table 1 Effect of solvent type and maceration duration on the color measurement of C. scutellarioides leaves.
Color Measurement |
||||||
Treatment |
L* |
a* |
b* |
ΔE |
||
A1 |
B1 |
19.79 0.07ab |
4.94 0.06cd |
8.34 0.34ef |
23.28 0.03fgh |
|
B2 |
19.66 0.01bc |
4.57 0.04e |
8.47 0.18e |
23.42 0.06f |
||
B3 |
13.69 0.05h |
3.84 0.05f |
9.73 0.20d |
29.44 0.10c |
||
B4 |
19.59 0.06c |
4.83 0.23cde |
8.03 0.29f |
23.38 0.00fg |
||
A2 |
B1 |
14.08 0.10f |
6.46 0.22a |
10.74 0.04bc |
29.59 0.08bc |
|
B2 |
14.55 0.01e |
6.12 0.13a |
11.19 0.05a |
29.25 0.01d |
||
B3 |
13.87 0.05g |
6.24 0.07a |
10.43 0.18c |
29.67 0.00b |
||
B4 |
14.94 0.21d |
5.75 0.11b |
10.89 0.01ab |
28.74 0.18e |
||
A3 |
B1 |
13.28 0.02i |
5.10 0.04c |
9.74 0.01d |
29.90 0.02a |
|
B2 |
13.16 0.07i |
5.05 0.37cd |
9.84 0.08d |
30.05 0.07a |
||
B3 |
19.80 0.03ab |
4.48 0.06e |
8.33 0.04ef |
23.23 0.02gh |
||
B4 |
19.94 0.02a |
4.72 0.08de |
8.56 0.09e |
23.19 0.04h |
||
Means followed by different lowercase superscript letters (a, b, c, d, e, f, g, h, and i) differ significantly (p < 0.05).
A1 = aquadest; A2 = aquadest + 0.5% citric acid; A3 = 70% ethanol; B1 = 6 h; B2 = 12 h; B3 = 24 h; B4 = 48 h
Based on the color intensity results presented in Table 1, the interaction between solvent type and maceration duration significantly affected the L* (lightness) value of C. scutellarioides leaves extracts. The highest L* values were recorded in treatments A1B1, A3B3, and A3B4, whereas the lowest values were observed in A3B1 and A3B2. These results indicate that the brightness of C. scutellarioides leaves extract was highest when using aquadest with a 6 h maceration or 70% ethanol with 24 and 48 h maceration durations. Conversely, lower brightness levels were obtained when using 70% ethanol with 6- and 12-hour maceration durations.
The highest a* (redness) values were observed in treatments A2B1, A2B2, and A2B3, whereas the lowest a* value was recorded in A1B3. These results indicate that the red intensity of C. scutellarioides leaves extract was best preserved when using aquadest + 0.5% citric acid as the solvent with maceration durations of 6, 12, and 24 h. In contrast, the redness tended to decrease when aquadest was used with a 24-hour maceration
The highest b* (yellowness) values of C. scutellarioides leaves extract were observed in treatments A2B2 and A2B4, whereas the lowest values were recorded in A1B1, A1B4, and A3B3. These results indicate that the yellow hue of C. scutellarioides leaves extract decreased when using aquadest with 6- and 48-hour maceration durations, as well as 70% ethanol with 24-hour maceration. In contrast, the yellowness was better preserved when using aquadest + 0.5% citric acid with 12- and 48-hour maceration durations.
The greatest color change (ΔE) of C. scutellarioides leaves extract was observed in treatments A3B1 and A3B2, whereas the lowest ΔE values were recorded in A1B1, A3B3, and A3B4. The color measurement results of this study are consistent with the findings of Koley et al. [26], who reported that lightness (L*) decreases as anthocyanin content increases, while redness (a*) varies in correlation with total anthocyanin content depending on the color line. Specific anthocyanins, such as Pg3G5G and Cy3G5G, were found to positively correlate with redness along certain color lines, making this model useful for linking pigment composition to color attributes. In Paeonia suffruticosa, the CIELAB color system, particularly the yellowness (b*), plays an important role in classifying flower colors and shows a strong correlation with anthocyanin content [27]. Similarly, the total color difference (ΔE) has been employed as a reliable parameter to assess perceptible color variations in polymer films enriched with red cabbage anthocyanins [28].
Extract yield
The extract yield of C. scutellarioides leaves is presented in Table 2. Statistical analysis indicated that there was no significant interaction (p > 0.05) between the type of solvent and maceration duration on the extract yield. However, both the type of solvent and the maceration duration had a significant effect (p < 0.05) on the yield of C. scutellarioides leaves extract.
Table 2 Effect of solvent type and extraction time on the extract yield of C. scutellarioides leaves (%).
Extract yield (%) |
|||||
Solvent (A) |
Maceration Time (B) |
Average |
|||
B1 |
B2 |
B3 |
B4 |
|
|
A1 |
20.06 2.65 |
23.17 0.62 |
23.31 1.55 |
24.13 2.50 |
22.67 1.79b |
A2 |
24.72 2.66 |
26.22 0.29 |
25.27 1.61 |
29.43 0.63 |
26.41 2.10a |
A3 |
20.96 1.08 |
22.89 0.65 |
22.82 0.71 |
24.75 1.39 |
22.85 1.55b |
Average |
21.91 2.48d |
24.10 1.85b |
23.80 1.30bc |
26.10 2.90a |
|
A1 = aquadest; A2 = aquadest + 0.5% sitrat acid; A3 = 70% ethanol; B1 = 6 h; B2 = 12 h; B3 = 24 h; B4 = 48 h
As shown in Table 2, the highest extract yield of C. scutellarioides leaves was obtained using aquadest + 0.5% citric acid (A2), with a yield of 26.41 ± 2.10%. This indicates that the addition of citric acid enhances the ability of the aqueous solvent to extract bioactive compounds from C. scutellarioides leaves. These results are in agreement with Kavela et al. [29], who reported that citric acid can improve the extraction efficiency of polyphenolic compounds, including anthocyanins, by facilitating the breakdown of plant cell walls. Citric acid increases the solubility of bioactive compounds under acidic conditions, thereby enhancing extraction efficiency. Previous studies have demonstrated similar effects: Pramitasari and JLim [30] found that the addition of 3% citric acid during anthocyanin extraction from Hibiscus sabdariffa petals yielded optimal extraction efficiency and enhanced antioxidant capacity. Similarly, Kang et al. [31] reported that the use of 1% citric acid in subcritical-water extraction (SWE) of blueberries (Vaccinium corymbosum) and chokeberries (Aronia melanocarpa) increased anthocyanin extraction efficiency by stabilizing the compounds and improving their solubility, while Yumas et al. [32] showed that citric acid improved the stability of anthocyanin extracts from cocoa powder without causing skin irritation. Additionally, Pratiwi and Y Hendrika [33] demonstrated that 0.05% citric acid in turmeric extraction could decontaminate cells, facilitate pigment release, and increase yield. In contrast, aquadest (A1) yielded lower extract values, likely due to their limited ability to extract certain bioactive compounds from the leaves.
Maceration for 48 h resulted in a higher extract yield of 26.10 ± 2.90%, suggesting that longer maceration durations allow solvents to dissolve bioactive compounds more effectively. However, the potential degradation of sensitive compounds should be considered. These findings are consistent with those reported by Nawaz et al. [34], who noted that more polar solvents can extract higher amounts of compounds, but may also increase the risk of degradation of thermolabile or sensitive bioactive compounds. A maceration duration that is too short results in low extraction efficiency because the solvent has not had sufficient time to penetrate the cell matrix optimally [35].
Total anthocyanin content (TAC)
The total anthocyanin content (TAC) of C. scutellarioides leaves extract is presented in Table 3. Statistical analysis revealed a significant interaction (p < 0.05) between solvent type and maceration duration on the TAC of C. scutellarioides leaves extract.
Table 3 Effect of solvent type and maceration duration on the total anthocyanin content of C. scutellarioides Leaves Extract (mg/L).
Total anthocyanin content (mg/L) |
|||||
Solvent (A) |
Maceration Duration (B) |
Average |
|||
B1 |
B2 |
B3 |
B4 |
|
|
A1 |
0.00 0.00i |
63.34 5.90ef |
47.08 1.52g |
98.64 7.93d |
52.33 40.94c |
A2 |
176.41 8.94b |
292.95 7.08a |
172.83 7.59bc |
162.58 0.84c |
201.19 61.45a |
A3 |
18.49 8.60h |
95.30 0.84d |
70.61 1.69e |
53.91 7.76fg |
59.58 32.24b |
Average |
64.97 96.96d |
150.53 124.37a |
96.93 66.75c |
105.04 54.61b |
|
A1 = aquadest; A2 = aquadest + 0.5% citric acid; A3 = 70% ethanol; B1 = 6 h; B2 = 12 h; B3 = 24 h; B4 = 48 h
The results of the total anthocyanin content (TAC) analysis of C. scutellarioides leaves extracts are presented in Table 3, indicating that both solvent type and maceration duration significantly influenced the amount of anthocyanins extracted. In this study, the extract obtained using aquadest + 0.5% citric acid as the solvent with a 12-hour maceration duration exhibited the highest TAC value (292.95 ± 7.08 mg/L) compared to other solvent types and maceration durations. This suggests that anthocyanins in C. scutellarioides leaves are more stable and more readily dissolved in water containing 0.5% citric acid, as the acidic condition (pH 2.16) aligns with the intrinsic stability of anthocyanins, which are known to be more stable under acidic conditions. In contrast, aquadest (pH 6.93) and 70% ethanol (pH 6.5) provide less favorable conditions for anthocyanin stability, resulting in lower TAC values. These findings are consistent with Nizori and Sihombing [36], who reported that citric acid acts as a chelating agent that helps maintain the stability of bioactive compounds during extraction. Similarly, Deineka et al. [37] noted that while pure water can extract anthocyanins, its efficiency is lower than that of solvents containing stabilizing additives such as citric acid. The present results also correspond with studies by other researchers who emphasized that acidified solvents enhance anthocyanin retention by inhibiting oxidation, preventing pigment degradation, and strengthening copigmentation interactions [38]. For example, previous investigations on blueberry (Vaccinium corymbosum), and chokeberry (Aronia melanocarpa) consistently shown that citric acid enhances both extraction efficiency and anthocyanin stability through mechanisms involving pH adjustment, metal chelation, hydrogen bonding, and cell-wall weakening [39].
Compared with these studies, the current findings reinforce the broader consensus that solvent acidity is a critical determinant in anthocyanin stability and recovery. The use of aquadest supplemented with 0.5% citric acid appears particularly effective for C. scutellarioides leaves, indicating that even modest acidification can substantially improve extraction outcomes relative to neutral or weakly polar solvents. The enhanced TAC under acidic maceration conditions also agrees with the well-established anthocyanin stability model, which describes superior pigment preservation within the pH range of 2 - 3, and and the stability of anthocyanins was relatively poor under neutral and alkaline conditions [40,41].
Profile thin layer chromatography (TLC)
The TLC patterns of C. scutellarioides leaves extracts prepared using different solvents and maceration durations are shown in Figure 2. The figure displays the TLC spot profiles for all extracts, and the Rf values represent the distance traveled by each compound relative to the solvent front. Table 4 presents the Rf values of the various samples (A1B1, A1B2, A1B3, A1B4, A2B1, A2B2, A2B3, A2B4, A3B1, A3B2, A3B3, and A3B4). Samples A1B1 to A1B4 exhibited similar Rf values (0.20 - 0.95), indicating the presence of nearly identical compounds. Samples A2B1 to A2B4 showed similar Rf patterns, with an additional value of 0.29, suggesting the presence of an extra component. In contrast, samples A3B1 to A3B4 displayed lower Rf values (0.16 - 0.95), indicating either greater affinity for the solvent or different interactions among the compounds in the extract.
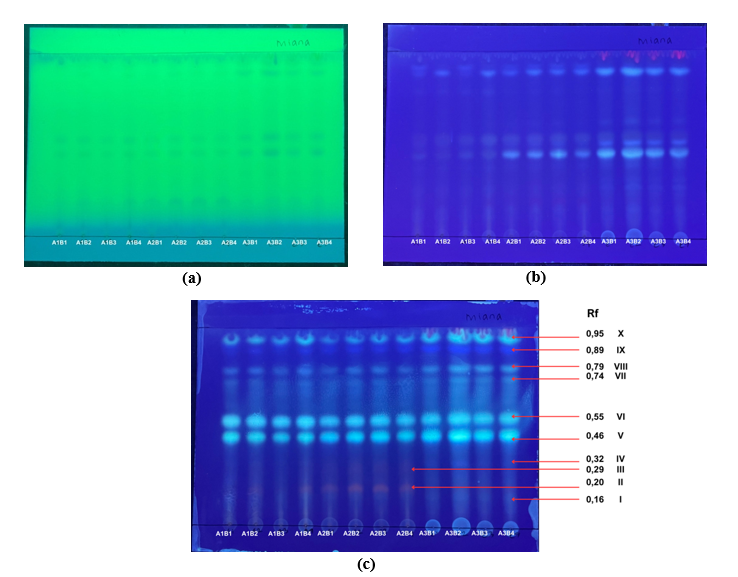
Figure 2 TLC profiling of C. scutellarioides leaf extracts obtained using different solvent systems and extraction durations. Samples include aquadest at 6 h (A1B1), 12 h (A1B2), 24 h (A1B3), and 48 h (A1B4); aquadest + 0.5% citric acid at 6 h (A2B1), 12 h (A2B2), 24 h (A2B3), and 48 h (A2B4); and 70% ethanol at 6 h (A3B1), 12 h (A3B2), 24 h (A3B3), and 48 h (A3B4). Chromatographic patterns are visualized under UV 254 nm (a), UV 365 nm (b), and UV 365 nm after visualization with citroborate reagent (c).
Table 4 Rf Values of the TLC profile of C. scutellarioides leaves extract.
Treatment |
|
Rf Value |
||||||||
I |
II |
III |
IV |
V |
VI |
VII |
VIII |
IX |
X |
|
A1B1 |
- |
0.20 |
- |
- |
0.46 |
0.55 |
0.74 |
0.79 |
0.89 |
0.95 |
A1B2 |
- |
0.20 |
- |
- |
0.46 |
0.55 |
0.74 |
0.79 |
0.89 |
0.95 |
A1B3 |
- |
0.20 |
- |
- |
0.46 |
0.55 |
0.74 |
0.79 |
0.89 |
0.95 |
A1B4 |
- |
0.20 |
- |
- |
0.46 |
0.55 |
0.74 |
0.79 |
0.89 |
0.95 |
A2B1 |
- |
0.20 |
0.29 |
- |
0.46 |
0.55 |
0.74 |
0.79 |
0.89 |
0.95 |
A2B2 |
- |
0.20 |
0.29 |
- |
0.46 |
0.55 |
0.74 |
0.79 |
0.89 |
0.95 |
A2B3 |
- |
0.20 |
0.29 |
- |
0.46 |
0.55 |
0.74 |
0.79 |
0.89 |
0.95 |
A2B4 |
- |
0.20 |
0.29 |
- |
0.46 |
0.55 |
0.74 |
0.79 |
0.89 |
0.95 |
A3B1 |
0.16 |
- |
- |
0.32 |
0.46 |
0.55 |
0.74 |
0.79 |
0.89 |
0.95 |
A3B2 |
0.16 |
- |
- |
0.32 |
0.46 |
0.55 |
0.74 |
0.79 |
0.89 |
0.95 |
A3B3 |
0.16 |
- |
- |
0.32 |
0.46 |
0.55 |
0.74 |
0.79 |
0.89 |
0.95 |
A3B4 |
0.16 |
- |
- |
0.32 |
0.46 |
0.55 |
0.74 |
0.79 |
0.89 |
0.95 |
Samples of C. scutellarioides were extracted using 3 solvent systems: Aquadest at 6 h (A1B1), 12 h (A1B2), 24 h (A1B3), and 48 h (A1B4); aquadest + 0.5% citric acid at 6 h (A2B1), 12 h (A2B2), 24 h (A2B3), and 48 h (A2B4); and 70% ethanol at 6 h (A3B1), 12 h (A3B2), 24 h (A3B3), and 48 h (A3B4).
The chromatographic profile of compounds extracted from C. scutellarioides leaves under different solvent types and maceration durations is presented in Figures 2(a) - 2(c). Under UV light at 254 nm (Figure 2(a)), faint spots were observed, indicating weak fluorescence of the compounds. At 365 nm (Figure 2(b)), several bluish to purplish fluorescent bands appeared, confirming the presence of active compounds. Variations in band intensity and distribution among samples suggest that solvent composition and maceration duration significantly influenced the separation pattern. Visualization with citroborate reagent (Figure 2(c)) enhanced the clarity and intensity of the bands. The citroborate reagent reacts with hydroxyl groups in the compound structures to form borate complexes, thereby enhancing fluorescence and facilitating spot identification. Based on the chromatographic results, ten main bands (Rf values ranging from 0.16 to 0.95) were detected, representing different compound fractions in the C. scutellarioides leaves extract.
The thin layer chromatography (TLC) profiles of C. scutellarioides leaves extracts obtained using different solvents and maceration durations exhibited distinct patterns, as shown in Figure 2 and Table 4. The TLC profiles visualized with citroborate reagent revealed 7 spots for aquadest, 8 spots for aquadest + 0.5% citric acid, and 8 spots for 70% ethanol as solvents. The Rf values derived from these profiles provide insight into the interactions between compounds and solvents, with higher Rf values indicating greater mobility of the compounds relative to the solvent front.
In samples using aquadest as the solvent (A1B1 to A1B4), the observed Rf values (0.20 - 0.95) indicate that the extracted compounds are nearly identical across all maceration durations (6, 12, 24 and 48 h). In samples using aquadest + 0.5% citric acid (A2B1 to A2B4), the Rf patterns were similar to those of A1B1 to A1B4, but with an additional Rf value of 0.29, suggesting the presence of extra components in the extract. Meanwhile, samples using 70% ethanol (A3B1 to A3B4) exhibited lower Rf values (0.16 - 0.95) compared to aquadest and aquadest + 0.5% citric acid, although the Rf patterns still indicated the presence of nearly identical compounds, with slight variations at each maceration duration. These results suggest that while longer maceration times can increase the number of extracted compounds, the types of compounds remain relatively consistent, exhibiting similar separation patterns. This is in agreement with Zahiruddin et al. [42], who stated that plant materials or extracts displaying the same TLC pattern are likely to possess similar biological activity.
Analysis of anthocyanin compounds by LC-MS/MS
Based on the LC-MS/MS profiles, the leaves extracts of C. scutellarioides contain multiple anthocyanin peaks that were analyzed and compared with previously published data. LC-MS/MS analysis of the extract using aquadest as the solvent (Figure 3) identified 4 anthocyanins: cyanidin-3-O-glucuronide (A), pelargonidin-3-glucuronide (B), cyanidin (C), and pelargonidin (D). In the extract prepared with aquadest + 0.5% citric acid (Figure 4), 6 anthocyanins were detected: Cyanidin-3-glucoside (A), cyanidin 3-O-(p-coumaroyl) glucoside-5-O-malonyglucoside I (B), cyanidin-3-O-glucuronide (C), pelargonidin-3-glucuronide (D), cyanidin (E), and pelargonidin (F). Meanwhile, in the 70% ethanol extract (Figure 5), 5 anthocyanins were identified: Cyanidin-3-glucoside (A), cyanidin-3-O-glucuronide (B), pelargonidin-3-glucuronide (C), cyanidin (D), and pelargonidin (E). Each compound was confirmed in the corresponding LC chromatogram and MS/MS spectrum. The chemical structures of the anthocyanins identified in the C. scutellarioides leaves extracts are presented in Table 5.
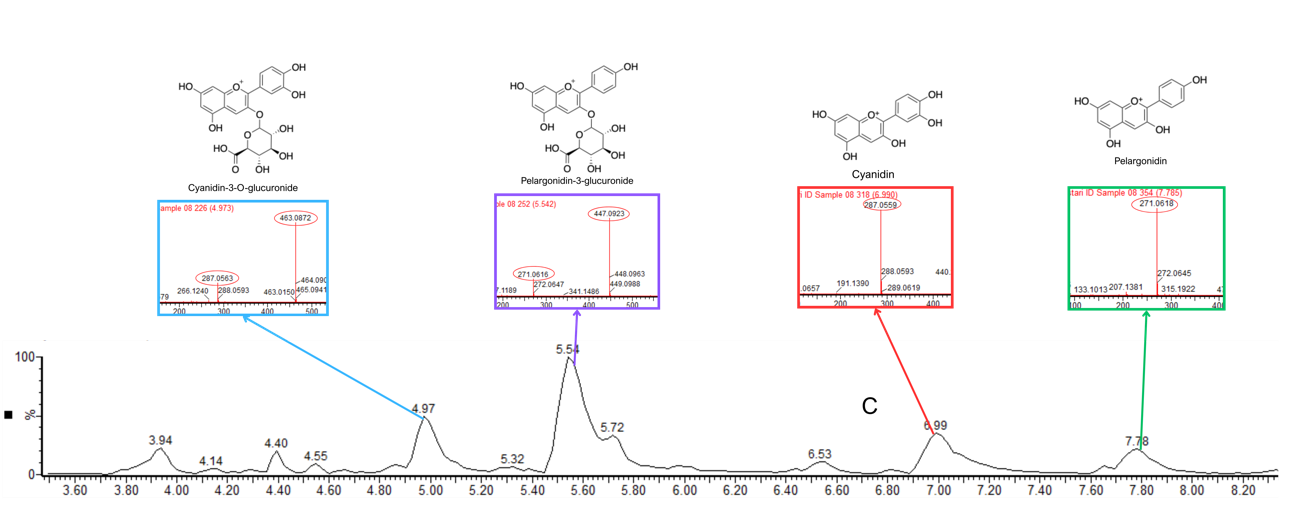
Figure 3 LC chromatogram and MS/MS spectra of C. scutellarioides leaves extract using aquades. Identified compounds: Cyanidin-3-O-glucuronide, pelargonidin-3-glucuronide, cyanidin, and pelargonidin.
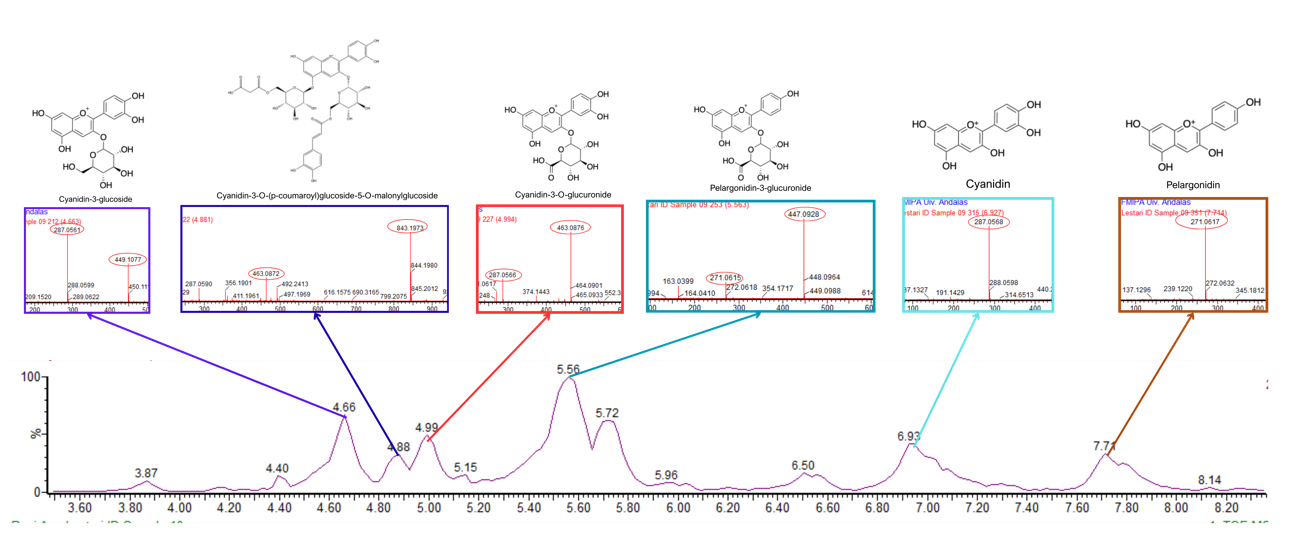
Figure 4 LC chromatogram and MS/MS spectra of C. scutellarioides leaves extract using aquadest + 0.5% citric acid. Identified compounds: cyanidin-3-glucoside, cyanidin 3-O-(p-coumaroyl) glucoside-5-O-malonyglucoside I, cyanidin-3-O-glucuronide, pelargonidin-3-glucuronide, cyanidin, and pelargonidin.
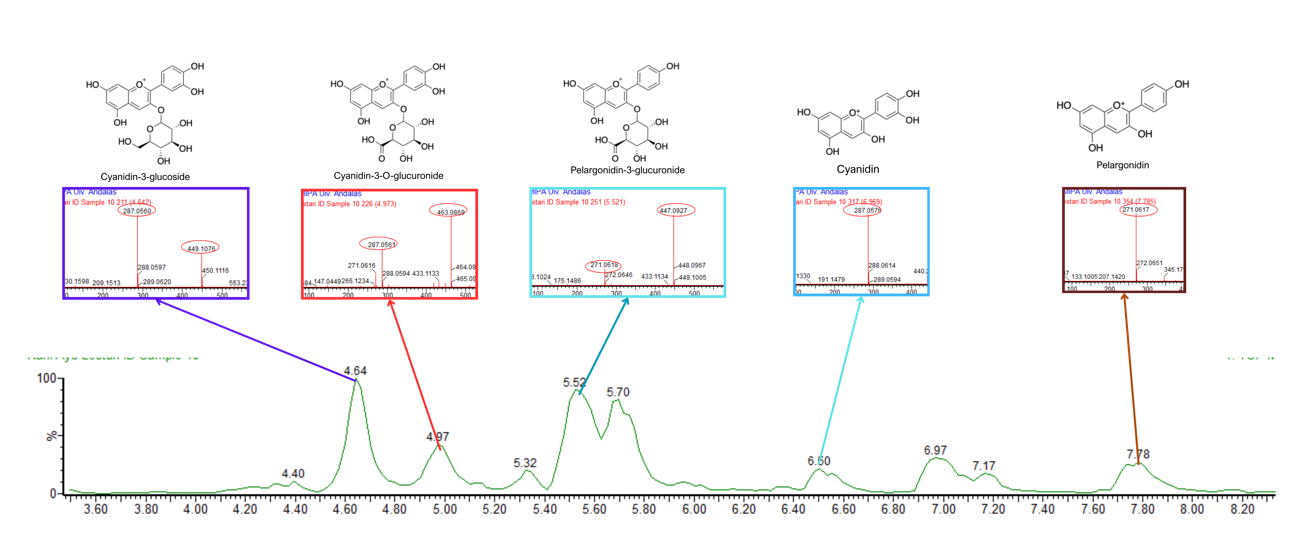
Figure 5 LC chromatogram and MS/MS spectra of C. scutellarioides leaves extract using 70% ethanol. Identified compounds: Cyanidin-3-glucoside, cyanidin-3-O-glucuronide, pelargonidin-3-glucuronide, cyanidin, and pelargonidin.
Table 5 List of structure anthocyanins tentatively identified in C. scutellarioides leaves extract using LC-MS/MS.
Solvent |
RT (min) |
[M+H]+, m/z |
Molecular Formula |
Mass error (ppm) |
Fragmens Ion |
Area (max) |
Compound |
Reference |
Aquadest |
4.97 |
463.0872 |
[C21H19O12]+ |
−0.5 |
287.0563 |
42,696.02 |
Cyanidin-3-O-glucuronide
|
[43] |
5.54 |
447.0923 |
[C21H19O11]+ |
−0.4 |
271.0616 |
120,432.16 |
Pelargonidin-3-glucuronide
|
[44] |
|
6.99 |
287.0559 |
[C15H11O6]+ |
0.3 |
ND |
42,263.25 |
Cyanidin
|
[45] |
|
7.78 |
271.0618 |
[C15H11O5]+ |
1.2 |
ND |
24,907.14 |
Pelargonidin
|
[44] |
|
Aquadest + citric acid 0,5% |
4.66 |
449.1077 |
[C21H21O11]+ |
−0.7 |
287.0561 |
14,126.50 |
Cyanidin-3-glucoside
|
[43,46] |
4.88 |
843.1973 |
[C39H39O21]+ |
−1.1 |
463.0872; 287.0590; |
4,014.43 |
Cyanidin-3-O-(p-coumaroyl)glucoside-5-O-malonylglucoside
|
[45] |
|
4.99 |
463.0876 |
[C21H19O12]+ |
−0.8 |
287.0566 |
8,172.91 |
Cyanidin-3-O-glucuronide
|
[43] |
|
5.56 |
447.0927 |
[C21H19O11]+ |
0 |
447.0928; 271.0615 |
35,527.46 |
Pelargonidin-3-glucuronide
|
[44] |
|
6.93 |
287.0568 |
[C15H11O6]+ |
1.2 |
ND |
18,803.85 |
Cyanidin
|
[49] |
|
7.71 |
271.0621 |
[C15H11O5]+ |
1.1 |
ND |
11,852.56 |
Pelargonidin
|
[44] |
|
Ethanol 70% |
4.64 |
449.1062 |
[C21H21O11]+ |
−0.8 |
287.0563 |
104,245.35 |
Cyanidin-3-glucoside
|
[43,46] |
4.97 |
463.0869 |
[C21H19O12]+ |
−0.8 |
287.0566 |
44,354.98 |
cyanidin-3-O-glucuronide
|
[43] |
|
5.52 |
447.0927 |
[C21H19O11]+ |
0 |
447.0924; 433.1125; 271.0616 |
127,573.34 |
Pelargonidin-3-glucuronide
|
[44] |
|
6.96 |
287.0576 |
[C15H11O6]+ |
1.9 |
ND |
51,579.70 |
Cyanidin
|
[45] |
|
7.78 |
271.0617 |
[C15H11O5]+ |
1.1 |
ND |
49,438.88 |
Pelargonidin
|
[44] |
The LC-MS/MS analysis revealed that leaves extracts of C. scutellarioides obtained using different solvents contained multiple anthocyanin compounds, each confirmed by corresponding LC chromatogram patterns and MS/MS spectra. In the aquadest extract, cyanidin-3-O-glucuronide was detected at a retention time of 4.97 min with m/z 463.0872 and fragmentation at m/z 287.0563, with a maximum peak area of 42,696.02, consistent with [43]. Pelargonidin-3-O-glucuronide was identified at 5.54 min with m/z 447.0923 and fragmentation at m/z 271.0616, with a maximum peak area of 120,432.16, in agreement with Banaszewski et al. [44]. Cyanidin was observed at 6.99 min with m/z 287.0559 without detectable fragmentation, and it showed a maximum peak area measuring 42,263.25, as reported by Lou et al. [45], while pelargonidin appeared at 7.78 min with m/z 271.0618, and it displayed a maximum peak area of 24,907.14, also without fragmentation [44].
In the extract using aquadest + 0.5% citric acid, cyanidin-3-glucoside was detected at 4.66 min with m/z 449.1077, fragmentation at m/z 287.0561, and it displayed a maximum peak area of 14,126.50 [43]. Cyanidin-3-glucoside has been reported to lower cholesterol levels primarily by inhibiting the activity of HMG-CoA reductase, the key enzyme involved in cholesterol biosynthesis [47]). Cyanidin-3-O-(p-coumaroyl) glucoside-5-O-malonylglucoside at 4.88 min with m/z 843.1973, yielding a peak area that reached 4,014.43 [45]. Cyanidin-3-O-glucuronide was also observed at 4.99 min with m/z 463.0876, fragmentation at m/z 287.0566 and achieved a maximum area of 8,172.91 [43]. Pelargonidin-3-O-glucuronide was detected at a retention time of 5.56 min, characterized by an m/z value of 447.0927 and a fragment ion at m/z 271.0615, yielding a peak area of 35,527.46, which is consistent with findings in Banaszewski et al. [44]. Cyanidin eluted at 6.93 min with an m/z of 287.0568 and no observable fragment ions, producing a peak area of 18,803.85 in accordance with Lou et al. [45]. In addition, pelargonidin was recorded at 7.71 min with an m/z of 271.0621, showing a peak area of 11,852.56 and no fragmentation, as similarly noted in Banaszewski et al. [44].
In the 70% ethanol extract, cyanidin-3-glucoside was detected at 4.64 min with m/z 449.1062 and fragmentation at m/z 287.0563 and it displayed a maximum peak area of 104245.35 [43,46], while cyanidin-3-O-glucuronide appeared at 4.97 min with m/z 463.0869, fragmentation at m/z 287.0566 with a maximum peak area of 44,354.98 [43]. Pelargonidin-3-O-glucuronide was identified at 5.52 min with m/z 447.0927, fragment ions at m/z 447.0924, 433.1125, and 271.0616 and it displayed a maximum peak area of 127,573.34, consistent with Banaszewski et al. [44]. Cyanidin was observed at 6.96 min with m/z 287.0576 without detectable fragmentation, and it showed a maximum peak area measuring 51,579.70, as reported by Lou et al. [45], while pelargonidin appeared at 7.78 min with m/z 271.0617, and it displayed a maximum peak area of 49438.88, also without fragmentation [44].
Extraction using aquadest acidified with 0.5% citric acid yielded 6 anthocyanin compounds - cyanidin-3-glucoside, cyanidin-3-O-(p-coumaroyl) glucoside-5-O-malonylglucoside, cyanidin-3-O-glucuronide, pelargonidin-3-O-glucuronide, cyanidin, and pelargonidin - representing the most comprehensive profile compared with extracts obtained using aquadest or 70% ethanol. The acidic environment generated by citric acid stabilizes the flavylium cation structure, thereby preventing its conversion into the unstable carbinol pseudobase and chalcone forms, and slowing degradation through hydrolytic and oxidative pathways [48]. This stabilization allows glycosylated, glucuronidated, and acylated anthocyanins to remain detectable, despite their high susceptibility to degradation under neutral pH conditions [49].
Compared with aquadest, which predominantly produced glucuronidated forms and aglycones due to extensive glycoside hydrolysis, and 70% ethanol, which achieved the highest overall abundance but extracted only 5 anthocyanins, the use of 0.5% citric acid proved most effective in preserving structural diversity. These findings highlight the critical role of acidic conditions in maintaining the integrity of complex anthocyanins, including acylated derivatives that are particularly unstable under conventional extraction environments [50].
This study identified a greater diversity of anthocyanins in C. scutellarioides leaves compared to previous reports, which only detected cyanidin [7] and pelargonidin-3-rutinoside and cyanidin-3-glycoside [8]. Among the anthocyanins identified, cyanidin-3-O-β-glucoside has been reported to enhance the activity of cholesterol 7α-hydroxylase, also known as cytochrome P450 family 7 subfamily A member 1 (CYP7A1), thereby promoting the conversion of total serum cholesterol into bile salts in the liver of mice. This leads to increased bile salt concentration in the intestines and a reduction in blood cholesterol levels, effectively alleviating hypercholesterolemia [9]. Cyanidin identified in C. scutellarioides may exhibit similar bioactive potential. Supporting this, a study in obese C57BL/6 mice fed a high-fat diet supplemented with Cornelian cherry (Cornus mas) containing anthocyanins (1 g/kg diet) for 8 weeks showed a 24% reduction in body weight, decreased hepatic lipid accumulation, and a significant decrease in hepatic triacylglycerol concentrations, independent of food intake [51]. Anthocyanins have been widely reported to regulate cholesterol biosynthesis through the inhibition of 3-hydroxy-3-methylglutaryl coenzyme A reductase (HMG-CoA reductase), the rate-limiting enzyme in cholesterol production [52]. The present findings are in line with Fatchiyah et al. [47], who demonstrated that cyanidin-3-O-glucoside from black rice disrupts the interaction between HMG-CoA and HMG-CoA reductase, thereby reducing the catalytic efficiency of the enzyme. Beyond direct enzyme inhibition, anthocyanins also activate AMP-activated protein kinase (AMPK), a central regulator of cellular energy metabolism. AMPK activation induces the phosphorylation and subsequent suppression of HMG-CoA reductase, limiting mevalonate formation and attenuating the early steps of cholesterol synthesis. Collectively, these complementary mechanisms contribute to a reduction in endogenous cholesterol production and support the potential of anthocyanins as natural modulators that may lower total circulating cholesterol [10-12].
Total phenolic content (TPC)
The total phenolic content (TPC) of C. scutellarioides leaf extract, which contains 6 identified anthocyanins, was determined using aquadest enriched with 0.5% citric acid. The detailed results are presented in Table 6.
Table 6 Total Phenolic Content (TPC) of C. scutellarioides leaf extract containing 6 anthocyanins.
Solvent |
TPC (mg GAE/g extract) |
SD |
Aquadest + citric acid 0.5% |
72.14 |
3.25 |
The analysis of total phenolic content (TPC) in the leaf extract of C. scutellarioides yielded a value of 72.14 mg GAE/g extract with a standard deviation (SD) of 3.25. This high TPC value confirms C. scutellarioides as a rich source of polyphenolic compounds. Furthermore, this phenolic content is closely associated with the presence of 6 anthocyanins (cyanidin-3-glucoside, cyanidin-3-O-(p-coumaroyl) glucoside-5-O-malonylglucoside, cyanidin-3-O-glucuronide, pelargonidin-3-O-glucuronide, cyanidin, and pelargonidin) identified in the C. scutellarioides extract by LC-MS/MS, which is consistent with [53], who reported that anthocyanins belong to the polyphenol family and are thus related to elevated total phenolic content.
Anthocyanins are pigments that are highly sensitive to changes in pH; therefore, the use of water containing 0.5% citric acid is critical during the extraction process. The addition of citric acid creates an acidic environment that stabilizes the anthocyanin structure (flavylium cation) and effectively enhances the extraction of polar components, which is reflected in the high TPC value [53]. Similarly, the supplementation of phenolic compounds as feed additives has been shown to exert beneficial effects on lipid oxidation in livestock [54]. In broiler chickens, dietary inclusion of Thymus vulgaris extract at 0.2% - 0.6% resulted in substantial reductions in plasma total cholesterol (TC) by 36% - 40% and LDL-C by 63% - 70% [55]. Furthermore, broilers fed polyphenol-rich grape seed at 10% - 40 g/kg exhibited approximately 10% lower total lipids, reduced triglyceride levels, and a decrease of about 22% in serum cholesterol [56]. Bioflavonoids such as genistein and hesperidin have also been reported to improve fatty acid profiles and lipid metabolism in broilers [57].
Mechanistically, the cholesterol-lowering effect of polyphenols is attributed to their high content of phenolic compounds, which inhibit cholesterol oxidation and thereby reduce lipid deposition within blood vessels. Additionally, polyphenols protect unsaturated fatty acids from oxidative damage, leading to reduced cholesterol accumulation in the serum and contributing to a more balanced regulation of lipid influx and efflux in the circulatory system. Collectively, these actions underpin the anticholesterolemic properties of polyphenols [58].
Conclusions
It can be concluded that the optimal conditions for anthocyanin extraction from C. scutellarioides leaves are the use of distilled water acidified with 0.5% citric acid as the solvent and a maceration time of 12 h. Under these conditions, 6 anthocyanin compounds were identified, namely cyanidin-3-glucoside, cyanidin 3-O-(p-coumaroyl) glucoside-5-O-malonylglucoside I, cyanidin-3-O-glucuronide, pelargonidin-3-O-glucuronide, cyanidin, and pelargonidin, with a total phenolic content of 72.14 mg GAE/g extract. Among in the extract, cyanidin-3-glucoside, cyanidin, and pelargonidin have previously been reported to inhibit HMG-CoA reductase activity and thereby reduce cholesterol synthesis. Subsequent research will investigate the HMG-CoA reductase inhibitory activity of C. scutellarioides leaf extract and characterize its physicochemical stability, particularly with respect to pH and temperature, to support its application via drinking water as a feed additive for lowering cholesterol levels in poultry.
Acknowledgements
This research was supported by the PMDSU grant program from the Ministry of Research, Technology, and Higher Education, Indonesia, in 2025 (master contract No. 060/C3/DT.05.00.PL/2025 and subsidiary contract number 67/UN16.19/PT.01.03/PL/2025). The authors express their sincere gratitude for the financial support. We also thank all laboratory staff and technicians for their valuable assistance in implementing this research. We would also like to express my sincere gratitude to Professor Kaeko Murota, Associate Professor Akira Nakatsuka, and Ms. Yukine Moda of Shimane University, Japan, for their valuable support and assistance throughout the PMDSU PKPI and PKP research program, particularly in the polyphenol analysis of C. scutellarioides leaf samples conducted at the laboratory of the Faculty of Life and Environmental Science, Shimane University.
Declaration of generative AI in scientific writing
The authors employed AI-based editing tools (Grammarly and ChatGPT by Open AI) solely to improve the clarity and grammatical precision of the text. No part of the scientific content or data analysis was generated by these systems. All final content and findings remain the sole responsibility of the authors.
CRediT author statement
M Jannah: Writing – original draft; Methodology; Data curation; Formal analysis; Validation. A Harahap: Methodology; Data curation; Formal analysis. V F Sardi: Methodology; Data curation; Formal analysis. Y Rizal: Writing – review and editing; Validation; Supervision. M E Mahata: Writing – review and editing; unding acquisition; Validation; Supervision. F Ismed: Writing – review and editing; Validation; Supervision.
References
[1] Organisation for Economic Co-operation and Development and Food and Agriculture Organization. OECD-FAO agricultural outlook 2024-2033, Available at: https://doi.org/10.1787/4c5d2cfb-en, accessed July 2025.
[2] Directorate General of Livestock and Animal Health. Livestock and animal health statistics 2024, Available at: https://ditjenpkh.pertanian.go.id/berita/2033-#!, accessed July 2025.
[3] AG Ganeco, MM Boiago, JLM Mello, RA De Souza, FB Ferrari, PA De Souza and H Borba. Lipid assessment, cholesterol and fatty acid profile of meat from broilers raised in four different rearing systems. Anais da Academia Brasileira de Ciências 2020; 92(S1), e20190649.
[4] WT Ismoyowati and T Widyastuti. Fat and cholesterol contents of breast and thigh meat in various local poultry species. Animal Production 2003; 5(2), 79-82.
[5] MT Abdulwahid, DA Alobaidi and MF Hamood. Evaluation of some biochemical quality and bacterial load of local and imported chicken meat. International Journal of Science and Nature 2017; 8(2), 257-260.
[6] M E Mahata, M Weni, Y Gusnanda, T Ohnuma and Y Rizal. The effects of dietary inclusion of miana plant flour (Plectranthus scutellarioides (L.) R. Br.) on serum lipid profile and organ weights of broiler chickens. World’s Veterinary Journal 2022; 12(1), 43-50.
[7] AC Ayu, M Ida, M Moelyono and SG Fakhriati. Total anthocyanin content and identification of anthocyanidin from Plectranthus scutellarioides (L.) R. Br. leaves. Research Journal of Chemistry and Environment 2018; 22(1), 11-17.
[8] H Yuniar. 2013, Extraction and antioxidant test of anthocyanin compounds from Coleus scutellarioides (L.) Benth. leaves and their application in beverages. Undergraduate Thesis. Universitas Andalas, Sumatera Barat, Indonesia.
[9] D Wang, M Xia, S Gao, D Li, Y Zhang, T Jin and W Ling. Cyanidin-3-O-β-glucoside upregulates hepatic cholesterol 7α-hydroxylase expression and reduces hypercholesterolemia in mice. Molecular Nutrition & Food Research 2012; 56(4), 610-621.
[10] M Takikawa, S Inoue, F Horio and T Tsuda. Dietary anthocyanin-rich bilberry extract ameliorates hyperglycemia and insulin sensitivity via activation of AMP-activated protein kinase in diabetic mice. The Journal of Nutrition 2010; 140(3), 527-533.
[11] J M Lecerf and M De Lorgeril. Dietary cholesterol: From physiology to cardiovascular risk. British Journal of Nutrition 2011; 106(1), 6-14.
[12] H Guo, G Liu, R Zhong, Y Wang, D Wang and M Xia. Cyanidin-3-O-β-glucoside regulates fatty acid metabolism via an AMP-activated protein kinase-dependent signaling pathway in human HepG2 cells. Lipids in Health and Disease 2012; 11, 1-13.
[13] SA Amer, HS Al-Khalaifah, A Gouda, A Osman, NIA Goda, HA Mohammed, MIM Darwish, AM Hassan and SKA Mohamed. Potential effects of anthocyanin-rich roselle (Hibiscus sabdariffa L.) extract on the growth, intestinal histomorphology, blood biochemical parameters, and immune status of broiler chickens. Antioxidants 2022; 11(3), 544.
[14] ME Mahata, DO Putri, Arif, T Ohnuma and Y Rizal. The performance of broiler chickens fed on miana plant flour (Plectranthus scutellarioides L.) R. Br. Journal of World’s Poultry Research 2021; 11(3), 332-337.
[15] M Damdindorj, M Byambaa, O Munkhjargal and B Barkhuu. Stability of anthocyanin extracts from tall currant (Ribes altissimum) fruits. Mongolian Journal of Agricultural Sciences 2020; 30(2), 13-19.
[16] T Taghavi, H Patel and R Rafie. Extraction solvents affect anthocyanin yield, color, and profile of strawberries. Plants 2023; 12(8), 1833.
[17] LF Casassa and JF Harbertson. Extraction, evolution, and sensory impact of phenolic compounds during red wine maceration. Annual Review of Food Science and Technology 2014; 5, 83-109.
[18] S Singh, OF Nwabor, DM Syukri and SP Voravuthikunchai. Chitosan-poly(vinyl alcohol) intelligent films fortified with anthocyanins isolated from Clitoria ternatea and Carissa carandas for monitoring beverage freshness. International Journal of Biological Macromolecules 2021; 182, 1015-1025.
[19] S Polat, G Guclu, H Kelebek, M Keskin and S Selli. Comparative elucidation of colour, volatile and phenolic profiles of black carrot (Daucus carota L.) pomace and powders prepared by five different drying methods. Food Chemistry 2022; 369, 130941.
[20] T Gonfa, S Teketle and T Kiros. Effect of extraction solvent on qualitative and quantitative analysis of major phyto-constituents and in-vitro antioxidant activity evaluation of Cadaba rotundifolia Forssk leaf extracts. Cogent Food & Agriculture 2020; 6(1), 1853867.
[21] J Lee, RW Durst, RE Wrolstad, KW Barnes, T Eisele, MM Giusti, J Haché, H Hofsommer, S Koswig, DA Krueger, S Kupina, SK Martin, BK Martinsen, TC Miller, F Paquette, A Ryabkova, G Skrede, U Trenn and JD Wightman. Determination of total monomeric anthocyanin pigment content of fruit juices, beverages, natural colorants, and wines by the pH differential method: collaborative study. Journal of AOAC International 2005; 88(5), 1269-1278.
[22] M Sampath and M Vasanthi. Isolation and structural elucidation of flavonoids from Polyalthia longifolia (Sonn.) Thwaites and evaluation of antibacterial, antioxidant and anticancer potential. International Journal of Pharmacy and Pharmaceutical Sciences 2013; 5(1), 336-341.
[23] F Ismed, WN Desti, N Arifa, R Rustini and DP Putra. TLC-bioautographic and LC-MS/MS detection of antimicrobial compounds from four semipolar extracts of Cladonia species. Advances in Health Sciences Research 2021; 42, 49-59.
[24] N Siddiqui, A Rauf, A Latif and Z Mahmood. Spectrophotometric determination of the total phenolic content, spectral and fluorescence study of the herbal Unani drug Gul-e-Zoofa (Nepeta bracteata Benth). Journal of Taibah University Medical Sciences 2017; 12(4), 360-363.
[25] RGD Steel and JH Torrie. Prinsip dan prosedur statistika (Edisi ke-4) (in Indonesian). Penerbit Gramedia Pustaka Utama, Jakarta, Indonesia, 1995.
[26] TK Koley, Z Khan, D Oulkar, BK Singh, A Maurya, B Singh and K Banerjee. High resolution LC-MS characterization of phenolic compounds and the evaluation of antioxidant properties of a tropical purple radish genotype. Arabian Journal of Chemistry 2020; 13(1), 1355-1366.
[27] Y Zhang, Y Zhang, X Duan, X Liu, S Yuan, J Han and Y Cheng. Anthocyanins in tree peony (Paeonia suffruticosa) and their relationship with flower color. Horticultural Science and Technology 2020; 38(6), 776-784.
[28] HNH Che, N Khairuddin and II Muhamad. Preparation and characterization of starch-based pH indicator films for anthocyanin release. Food Research 2024; 8(S3), 110-116.
[29] ETA Kavela, L Szalóki-Dorkó and M Máté. The efficiency of selected green solvents and parameters for polyphenol extraction from chokeberry (Aronia melanocarpa (Michx)) pomace. Foods 2023; 12(19), 3639.
[30] R Pramitasari and J Lim. Karakterisasi sifat fisikokimia ekstrak dan bubuk hasil pengeringan beku antosianin kelopak bunga telang (Clitoria ternatea L.) (in Indonesian). Agro Bali Agricultural Journal 2022; 5(2), 304-312.
[31] HJ Kang, MJ Ko and MS Chung. Anthocyanin structure and pH dependent extraction characteristics from blueberries (Vaccinium corymbosum) and chokeberries (Aronia melanocarpa) in subcritical water state. Foods 2021; 10(3), 527.
[32] M Yumas, J Loppies and A Barra. Stabilitas dan efektivitas antioksidan zat warna antosianin tepung kakao tanpa fermentasi (Theobroma cacao L.) secara in vivo (in Indonesian). Jurnal Industri Hasil Perkebunan 2020; 15(1), 61-68.
[33] D Pratiwi and Y Hendrika. Antioxidant activity from spray gel formulation combination from ethyl acetate fraction turmeric rhizome and collagen from catfish (Pangasius hypopthalmus). Journal of Pharmacy and Science 2022; 6(1), 51-58.
[34] H Nawaz, MA Shad, N Rehman, H Andaleeb and N Ullah. Effect of solvent polarity on extraction yield and antioxidant properties of phytochemicals from bean (Phaseolus vulgaris) seeds. Brazilian Journal of Pharmaceutical Sciences 2020; 56, e17129.
[35] NE Masota, G Vogg, E Heller and U Holzgrabe. Comparison of extraction efficiency and selectivity between low-temperature pressurized microwave-assisted extraction and prolonged maceration. Archiv der Pharmazie 2020; 353(10), 2000147.
[36] A Nizori and N Sihombing. Karakteristik ekstrak kulit buah naga merah (Hylocereus polyrhizus) dengan penambahan berbagai konsentrasi asam sitrat sebagai pewarna alami makanan (in Indonesian). Jurnal Teknologi Industri Pertanian 2020; 30(2), 228-233.
[37] VI Deineka, EY Oleinits and YY Kul’chenko. Control of the selectivity of separation and the determination of anthocyanins of fruits of Vaccinium family plants using acetonitrile-formic acid-water eluents. Journal of Analytical Chemistry 2020; 75, 1443-1450.
[38] S Joshi, J Appukuttan, J Chandrapala and M Majzoobi. Impact of conventional and advanced techniques on stability of natural food colourants. Foods 2025; 14(18), 3187.
[39] HJ Kang, MJ Ko and MS Chung. Anthocyanin structure and pH dependent extraction characteristics from blueberries (Vaccinium corymbosum) and chokeberries (Aronia melanocarpa) in subcritical water state. Foods 2021; 10(3), 527.
[40] S Oancea. A review of the current knowledge of thermal stability of anthocyanins and approaches to their stabilization to heat. Antioxidants 2021; 10(9), 1337.
[41] X Zhao, X Zhang, X Chen, S Zhang and F He. Phenolics in wines II: Progress in research on copigmentation and bioactivities. Food Science 2019; 40(17), 284-294.
[42] S Zahiruddin, A Parveen, W Khan, R Parveen and S Ahmad. TLC-based metabolite profiling and bioactivity-based scientific validation for use of water extracts in AYUSH formulations. Evidence-Based Complementary and Alternative Medicine 2021; 2021, 2847440.
[43] A Dávila-Lara, M Reichelt, D Wang, H Vogel and A Mithöfer. Proof of anthocyanins in the carnivorous plant genus Nepenthes. FEBS Open Bio 2021; 11(9), 2576-2585.
[44] K Banaszewski, E Park, I Edirisinghe, JC Cappozzo and BM Burton-Freeman. A pilot study to investigate bioavailability of strawberry anthocyanins and characterize postprandial plasma polyphenols absorption patterns by Q-TOF LC/MS in humans. Journal of Berry Research 2013; 3(2), 113-126.
[45] Q Lou, L Wang, H Liu and Y Liu. Anthocyanin profiles in flowers of grape hyacinth. Molecules 2017; 22(5), 688.
[46] MH Ikhsan, AWR Akili, A Hardianto, J Latip and T Herlina. Optimization of ultrasound-assisted extraction of anthocyanin from Erythrina crista-galli flowers. Trends in Sciences 2025; 22(7), 10076.
[47] F Fatchiyah, HN Meidinna and E Suyanto. The cyanidin-3-O-glucoside of black rice inhibits the interaction of HMG-CoA and HMG-CoA reductase: Three- and two-dimension structure. Journal of Physics: Conference Series 2020; 1665(1), 012005.
[48] H Cao, O Saroglu, A Karadag, Z Diaconeasa, G Zoccatelli, CA Conte‐Junior, GA Gonzalez-Aguilar, J Ou, W Bai, CM Zamarioli, LAP de Freitas, A Shpigelman, PH Campelo, E Capanoglu, CL Hii, SM Jafari, Y Qi, P Liao, M Wang, L Zou, P Bourke, J Simal-Gandara and J Xiao. Available technologies on improving the stability of polyphenols in food processing. Food Frontiers 2021; 2(2), 109-139.
[49] B Enaru, G Drețcanu, TD Pop, A Stǎnilǎ and Z Diaconeasa. Anthocyanins: Factors affecting their stability and degradation. Antioxidants 2021; 10(12), 1967.
[49] H Ayvaz, T Cabaroglu, A Akyildiz, CU Pala, R Temizkan, E Ağçam, Z Ayvaz, A Durazzo, M Lucarini, R Direito and Z Diaconeasa. Anthocyanins: Metabolic digestion, bioavailability, therapeutic effects, current pharmaceutical/industrial use, and innovation potential. Antioxidants 2022; 12(1), 48.
[50] B Jayaprakasam, LK Olson, RE Schutzki, MH Tai and MG Nair. Amelioration of obesity and glucose intolerance in high-fat-fed C57BL/6 mice by anthocyanins and ursolic acid in Cornelian cherry (Cornus mas). Journal of Agricultural and Food Chemistry 2006; 54(1), 243-248.
[52] XF Qi, L Zheng, KJ Lee, DH Kim, CS Kim, DQ Cai, Z Wu, JW Qin, YH Yu and SK Kim. HMG-CoA reductase inhibitors induce apoptosis of lymphoma cells by promoting ROS generation and regulating Akt, Erk and p38 signals via suppression of mevalonate pathway. Cell Death & Disease 2013; 4(2), e518-e518.
[53] MH Grace, Xiong J, Esposito D, Ehlenfeldt M, Lila MA. Simultaneous LC–MS quantification of anthocyanins and non-anthocyanin phenolics from blueberries with widely divergent profiles and biological activities. Food Chemistry 2019; 277, 336–346.
[54] R Zengin, Y Uğur, S Erdoğan, Ç Yavuz, H Hatterman-Valenti and O Kaya. Phytochemical and antioxidant variability in some black mulberry, chokeberry, and elderberry cultivars in relation to cultivar, plant part, and extraction solvent. Horticulturae 2025; 11(5), 455.
[55] NV Valenzuela-Grijalva, A Pinelli-Saavedra, A Muhlia-Almazan, D Dominguez-Diaz and H Gonzalez-Rios. Dietary inclusion effects of phytochemicals as growth promoters in animal production. Journal of Animal Science and Technology 2017; 59, 8.
[56] R Abdulkarimi, M Daneshyar and A Aghazadeh. Thyme (Thymus vulgaris) extract consumption darkens liver, lowers blood cholesterol, proportional liver and abdominal fat weights in broiler chickens. Italian Journal of Animal Science 2011; 10(2), e20.
[57] SH Abu Hafsa and SA Ibrahim. Effect of dietary polyphenol-rich grape seed on growth performance, antioxidant capacity and ileal microflora in broiler chicks. Journal of Animal Physiology and Animal Nutrition 2018; 102(1), 268-275.
[58] AA Kamboh and WY Zhu. Effect of increasing levels of bioflavonoids in broiler feed on plasma anti-oxidative potential, lipid metabolites, and fatty acid composition of meat. Poultry Science 2013; 92(2), 454-461.
[59] Z Yan, Y Zhong, Y Duan, Q Chen and F Li. Antioxidant mechanism of tea polyphenols and its impact on health benefits. Animal Nutrition 2020; 6(2), 115-123.