Trends
Sci.
2026; 23(7): 12762
Evaluation of Extraction Techniques, Chemical Composition, Antioxidant Properties, Computational Modelling, and Biological Insights of the Novel Truffle Species (Tirmania Nivea) for Enhanced Human Health Benefits
Soaad Haiba Haib1, Harpreet Kaur2, Fatma Ezzahra Ben Mohamed3,4,
Faheem Abdul Karim Benkhyal5, Gassoumi Bouzid6, Mustapha Belaidi7,
Sahbi Ayachi8, Mounir Ben El Hadj Rhouma4, Ebrahem Salem Bogandora1,
Saleh Mumien Bufarwa9, Juvenal Rodriguez-Resendiz10, Rafael Rojas-Galvan10
and Eduardo Alberto López-Maldonado11,*
1Agricultural Research Centre, El-Beida 89055, Libya
2Department of Physics, Chandigarh University, Gharuan Mohali 140413, India
3Department of Physics, Faculty of Science, Albaha University, Albaha 65779, Saudi Arabia
4Université de Monastir, Institut Préparatoire aux Études des Ingénieurs de Monastir,
Laboratoire d’Études des Milieux Ionisés et Réactifs (EMIR), Monastir 5000, Tunisia
5Department of Food Science and Technology, Faculty of Agriculture, Omar Al-Mukhtar University,
El-Beida P.O. Box 991, Libya
6Laboratoire Interfaces et Matériaux Avancés (LIMA), Faculté des Sciences, Université de Monastir,
Avenue de L’Environnement, Monastir 5019, Tunisia
7Department of Chemistry, Ahmed Zabana University, Relizane 48000, Algeria
8Laboratory Physic-Chemistry of Materials (LR01ES19), Faculty of Sciences, University of Monastir,
Avenue of the Environment, 5019 Monastir, Tunisia
9Department of Chemistry, Faculty of Science, Omar Al-Mukhtar University, El-Beida P.O. Box 991, Libya
10Facultad de Ingenieria, Universidad Autonoma de Queretaro, Santiago de Queretaro 76010, Mexico
11Faculty of Chemical Sciences and Engineering, Autonomous University of Baja California,
Baja California 22424, Mexico
(*Corresponding author’s e-mail: [email protected])
Received: 23 November 2025, Revised: 24 December 2025, Accepted: 31 December 2025, Published: 15 March 2026
Abstract
This study investigates the chemical composition, antioxidant properties, and theoretical insights into the antioxidant activity of Libyan truffle T. nivea, using extracts from petroleum ether, chloroform, and methanol. The truffles contained 12.64% protein, 6.56% fat, 5.91% fiber, and 2.58% ash, indicating their significant nutritional profile. The methanol extract showed the highest antioxidant activity with 106 mg of total phenolics (GAE/100g) and 71 mg of flavonoids (QE/100 g), resulting in 86.30% inhibition in the DPPH• assay at 1,000 μg/mL and 96.9% inhibition in the β-carotene bleaching assay at 10 µg/mL. The chloroform extract exhibited 74.88% DPPH• inhibition at 1,000 μg/mL and 85.1% inhibition at 0.5 µg/mL in the β-carotene assay, while the petroleum ether extract showed 69.09% inhibition at 1000 μg/mL in DPPH• and lower activity in β-carotene bleaching. Theoretical calculations using Density Functional Theory (DFT) revealed that phenolic compounds such as quercetin and rosmarinic acid, which possess lower energy gaps (Eg), exhibited stronger reactivity and higher antioxidant potential. For example, quercetin (Eg = 4.034 eV) and rosmarinic acid (Eg = 3.50 eV) exhibited significant biological activity due to their smaller energy gaps, indicating higher reactivity toward free radicals. In contrast, compounds such as caffeic acid (Eg = 4.148 eV) and benzoic acid (Eg = 5.76 eV) showed larger energy gaps, leading to lower reactivity and antioxidant effects. The results also indicated that hydroxyl-rich compounds, such as pyrogallol and gallic acid, had high electron density and superior antioxidant performance. Molecular docking simulations demonstrated strong binding of phenolic compounds like rosmarinic acid (‒16.15 kcal/mol) and quercetin (‒15.14 kcal/mol) with xanthine oxidase, suggesting their potential as potent antioxidants. These findings highlight the potential of T. nivea truffles, particularly the methanol extract, as a rich source of natural antioxidants with substantial nutritional and therapeutic benefits.
Keywords: Libyan truffle, T. nivea, Chemical composition, β-Carotene bleaching assay, Antioxidant potential, Molecular docking
Introduction
Truffles are hypogeous ascomycetous fungi that have long attracted attention due to their ecological specialization, nutritional value, and bioactive potential [1]. Taxonomically, truffles belong mainly to the families Tuberaceae and Terfeziaceae within the class Ascomycetes [2]. While early historical records documented their use as food, contemporary research has shifted focus toward their chemical composition, biological activities, and potential applications in functional foods and natural therapeutics [3,4]. Desert truffles of the genera Tirmania and Terfezia (Terfeziaceae) are particularly adapted to arid and semi-arid environments, where they grow in obligate mycorrhizal associations with specific annual desert plants [5]. These symbiotic interactions play a crucial role in nutrient acquisition and are strongly influenced by environmental factors such as soil composition, temperature, and water availability [6,7]. As a result, desert truffles represent a unique biological system in which extreme ecological conditions may directly affect metabolic pathways and secondary metabolite biosynthesis [5,8]. In recent years, increasing attention has been devoted to the nutritional and phytochemical properties of truffles [4,9,10]. Several studies have demonstrated that truffles possess appreciable protein content, essential amino acids, dietary fiber, and a wide range of minerals and vitamins, while exhibiting low lipid levels [11,12]. Beyond their nutritional profile, truffles are recognized as rich sources of bioactive compounds, including phenolic acids, flavonoids, sterols, vitamins (A, C and E), polysaccharides, peptides, and terpenoid derivatives [11,13,14]. These constituents have To evaluate with diverse biological activities, notably antioxidant, anti-inflammatory, antidiabetic, hepatoprotective, immunomodulatory, anticancer, and neuroprotective effects, positioning truffles as promising natural resources for health-related applications [15,16]. Among desert truffles, T. nivea has been investigated in several regional studies, mainly from Tunisia and Algeria, where its chemical composition and antioxidant potential have been partially characterized [17-19]. However, the biochemical properties of Libyan T. nivea remain insufficiently explored, despite the country hosting vast desert ecosystems with distinctive climatic conditions [2]. The Libyan Sahara is characterized by extreme temperatures, intense solar radiation, low annual precipitation, and unique soil mineral profiles [20]. Such environmental pressures are known to modulate fungal metabolism and may result in qualitative and quantitative differences in phenolic profiles, sterol composition, and antioxidant capacity when compared with T. nivea from neighboring regions [21]. To date, it remains unclear whether these harsh desert conditions impart specific chemical or functional traits to Libyan T. nivea, representing a clear and relevant knowledge gap [5]. Therefore, the present study aims to provide a comprehensive chemical and antioxidant characterization of T. nivea collected from the Libyan Sahara Desert. Proximate composition parameters, including proteins, crude fats, carbohydrates, moisture, and ash content, were determined alongside key bioactive constituents such as total phenolics, flavonoids, anthocyanins, sterols, and essential vitamins. To ensure broad metabolite coverage, extraction was performed using solvents of different polarities (petroleum ether, chloroform, and methanol). Antioxidant activity was evaluated using complementary in vitro assays, namely the β-carotene bleaching method and the DPPH free radical scavenging assay, providing a reliable assessment of radical inhibition potential. In addition to experimental analyses, computational modelling was incorporated as an integral component of this study. Density functional theory (DFT) calculations were employed to investigate electronic properties, charge distribution, and reactive sites of selected phenolic compounds, which are directly related to their antioxidant behavior. Furthermore, quantum theory of atoms in molecules (QTAIM) and non-covalent interaction (NCI) analyses were used to elucidate intermolecular interactions that cannot be directly captured through biochemical assays. Molecular docking simulations against xanthine oxidase were conducted to explore potential enzyme-ligand interactions, offering mechanistic insights into the molecular basis of the observed antioxidant activity. By integrating chemical profiling, antioxidant evaluation, and advanced in silico approaches, this study provides the first integrated investigation of Libyan T. nivea. The findings contribute to a deeper understanding of how desert environmental conditions influence truffle chemistry and support the potential of Libyan desert truffles as valuable natural sources of antioxidant compounds within the context of natural product chemistry and functional food research.
Scheme 1 Libyan Truffle T. nivea.
Materials and methods
Chemicals and reagents
All chemicals and reagents used in this study were of analytical or HPLC grade and were used without further purification. Methanol (≥ 99.8%, HPLC grade), chloroform (≥ 99%, ACS reagent grade), petroleum ether (ACS reagent grade, 96.3%), β-carotene (≥ 93%, UV assay), linoleic acid (≥ 98%), and DPPH (≥ 99.9%, COA certified) were obtained from Sigma-Aldrich (St. Louis, MO, USA). Folin-Ciocalteu reagent, gallic acid, and quercetin were also purchased from Sigma-Aldrich and used for phenolic and flavonoid quantification.
Raw material
Fresh fruiting bodies of Tirmania nivea (truffle) were collected from the Al-Hamada Al-Hamra region in southwest Libya over a period of two consecutive years, from 2023 to 2025, during the peak fruiting seasons. The total weight of the collected samples was 4 kg (Scheme 1). Each batch was assigned a unique voucher specimen number (TN-2023-01, TN-2024-02, TN-2025-03) and deposited at the Herbarium of the Faculty of Agriculture, Omar Al-Mukhtar University, Libya for future reference. Taxonomic identification was confirmed by Faheem Abdul Karim Benkhyal, based on morphological characteristics and comparison with authenticated herbarium specimens. All samples were transported to the laboratory under cool conditions and stored at 4 °C for a short period prior to processing. This extended collection period ensures representation of seasonal and annual variation in truffle composition.
Sample preparation
Samples were washed under running water to remove soil and debris, then freeze-dried at −47 °C under 0.05 mbar using a Christ Alpha 1 - 4 LD Plus freeze-dryer (Germany). Dried samples were ground to a fine powder and stored in polyethylene containers at −20 °C until analysis.
Basic composition
The moisture content was determined by placing a known weight of the homogeneous sample in a moisture dish and drying it in an oven at 105 °C. The sample was weighed at regular intervals until a constant weight was achieved. The moisture content percentage was then calculated following the method outlined by the method 930.15 [22]. The crude protein content was determined using the Kjeldahl method, which involves wet digestion with concentrated sulfuric acid and digestion tablets, followed by distillation. The distillate was titrated with a standard HCl solution to determine the nitrogen content in the sample. The crude protein percentage was calculated using the conversion factor of 6.25, as described by AOAC (2008) [23]. Crude fat content was estimated by extracting fat using hexane as a solvent in a Soxhlet apparatus. The solvent was then evaporated using a rotary evaporator, and the flask was dried in an oven for 2 h. After cooling, the flask was reweighed, and the difference between the initial and final weights was used to determine the fat content in the sample, according to method 920.212 [24]. Total ash content was determined by incinerating a known weight of the sample initially on an electric heater and completing the ashing process in a muffle furnace at 550 °C for 3 h. After the ashing process was completed, the ash weight was recorded, and the total ash percentage was calculated based on the method described by AOAC methodology [25]. The crude fiber content was estimated by first extracting fat from the sample using an organic solvent (petroleum ether), followed by acid and alkaline digestion. The sample was then dried, weighed, and ashed at 550 °C using a muffle furnace. The percentage of crude fiber in the sample was calculated according to the method outlined by AOAC [26]. Carbohydrate content was calculated by difference using the following Eq. (1);
![]()
Anthocyanin extraction
Ethanol was used for the extraction process according to Giusti and Wrolstad [27], with clearly defined extraction conditions to enhance reproducibility. Ethanol (50%) was used as the extraction solvent. A 3-gram portion of powdered dried truffle was extracted at 40 °C for 20 - 25 min per cycle, applying three consecutive extraction cycles. The combined extracts were pooled for further analysis.
Determination of anthocyanin content
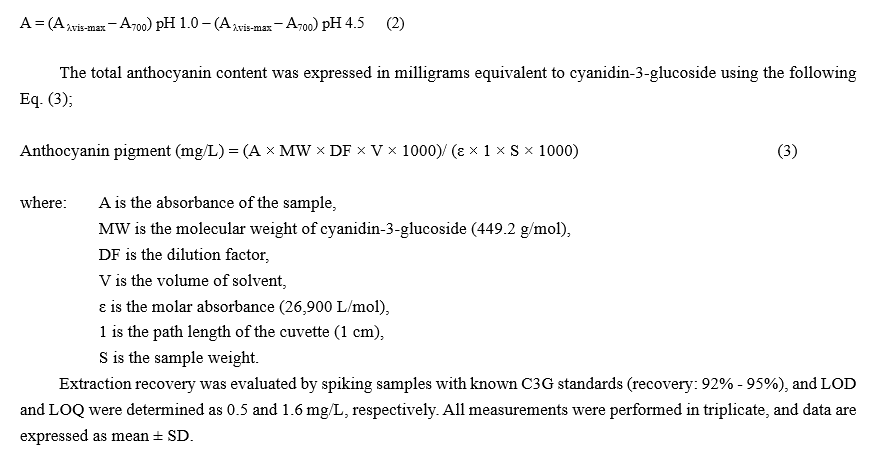
Total anthocyanins were quantified using the differential pH method [28], 1 mL of extract was mixed with 3 mL of potassium chloride buffer (pH 1.0) and separately with 3 mL of sodium acetate buffer (pH 4.5), shaken, and incubated for 30 min at room temperature. Absorbance was measured at 535 and 700 nm using a UV-Vis spectrophotometer (Thermo Scientific Genesys10S). Anthocyanin content was expressed as cyanidin-3-glucoside equivalents, considering the dilution factor, solvent volume, molar absorptivity, and sample weight.
The absorbance of the diluted sample (A) was calculated as follows Eq. (2);
Determination of total phenolic content
The total phenolic content of the truffle extract was measured using the Folin-Ciocalteu method [3]. with specific modifications in reagent volumes and incubation time. A 100 µL aliquot of the extract was mixed with 200 µL of the Folin-Ciocalteu reagent (Sigma Aldrich) and allowed to stand for 5 min at room temperature. Subsequently, 9.2 mL of distilled water was added, followed by 500 µL of a sodium carbonate solution (Na₂CO₃, Sigma Aldrich 7.5 %w/v). The mixture was vortexed thoroughly and incubated in the dark at ambient temperature (25 ± 2 °C) for 40 min. The absorbance of the resulting blue complex was measured at 750 nm against a reagent blank using a UV-Vis spectrophotometer. Gallic acid (≥ 99%, Sigma Aldrich) was used as the reference standard, with concentrations ranging from 30 to 80 µg/mL. The total phenolic content was calculated from the linear regression equation of the gallic acid calibration curve (R² = 0.998) and expressed as milligrams of gallic acid equivalents per gram of dry sample weight (mg GAE/g dw). All measurements were performed in triplicate. Recovery experiments were conducted by spiking samples with gallic acid standards (recovery: 94% - 97%). Limit of Detection (LOD) and Limit of Quantification (LOQ) were determined as 0.8 and 2.5 mg/L, respectively.
Determination of total flavonoid content
The total flavonoid content was quantified using the aluminum chloride colorimetric assay [29], with modifications in reagent volumes and incubation duration. Briefly, 250 µL of the extract was mixed with 1.25 mL of deionized water in a test tube. To this mixture, 75 µL of a sodium nitrite (NaNO₂; 5 %w/v) solution was added. After 5 min, 150 µL of a freshly prepared aluminum chloride hexahydrate (AlCl₃·6H₂O; 10 %w/v) solution was added. The mixture was allowed to stand for 6 min at room temperature, followed by the addition of 0.5 mL of sodium hydroxide (NaOH; 1 M) and 2.75 mL of deionized water. The final mixture was vortexed immediately, and the absorbance of the developed pink color was measured at 510 nm against a prepared blank. A standard curve was constructed using quercetin (concentration range: 60 - 160 µg/mL). The total flavonoid content was calculated from the quercetin calibration curve (R² = 0.998) and expressed as milligrams of quercetin equivalents per gram of dry sample weight (mg QE/g dw). All analyses were carried out in triplicate. Recovery experiments were conducted by spiking samples with known quercetin standards, yielding 93% - 96% recovery. Limit of Detection (LOD) and Limit of Quantification (LOQ) were determined as 0.6 and 2.0 mg/L, respectively. Results are expressed as mg quercetin equivalents per gram of dry weight (mg QE/g dw) ± SD.
Composition and determination of phenolics and flavonoids in T. nivea truffle
Phenolics and flavonoids in the freeze-dried truffle were separated using High-Performance Liquid Chromatography (HPLC) with an Agilent 1,260 Infinity HPLC system (USA), equipped with a Quaternary Pump. The separation was performed using an Akinetex® 5µm Evo C18 column (100×4.6 mm) at an operating temperature of 30 °C. A gradient mixture of solvents with decreasing polarity was used for the separation: (A) water containing 0.2% phosphoric acid, (B) methanol, and (C) acetonitrile. The injected sample volume was 20 µL, and the detection was performed using a VWD detector at a wavelength of 284 nm. A set of standard phenolic and flavonoid compounds was used for the identification and quantification.
Separation and estimation of sterols in truffle
Sterols were separated using HPLC (Agilent 1,260 Infinity) on a C18 column (100×4.6 mm) with a mobile phase of methanol: Acetonitrile (30:70), flow rate 0.6 mL/min, and column temperature 35 °C. Detection was performed at 205 nm using a UV detector. Calibration and recovery studies were performed to ensure reproducibility.
Estimation of vitamins C, A, and E
Vitamins C, A and E, as well as phenolic, flavonoid, and sterol contents, in the T. nivea truffle sample were determined at the Food Safety and Quality Control Laboratory, Faculty of Agriculture, Cairo University, Egypt.
Vitamin A estimation
Vitamin A in the non-saponifiable portion was estimated by reacting it with 50% trichloroacetic acid, and the resulting blue color absorbance was measured at 620 nm. A standard curve was used with concentrations ranging from 0.5 to 5 µg/mL. Vitamin A was quantified as retinol [30].
Vitamin C estimation
Vitamin C content in the freeze-dried truffle sample was determined using the oxalic acid method [31]. Five grams of the sample were extracted with 100 mL of oxalic acid and ethylene diamine tetra-acetic acid (EDTA) solution. The extract was filtered and centrifuged. Then, 5 mL of the clear solution was placed in a glass vial, to which 0.5 mL of meta-phosphoric acid and acetic acid solution was added, followed by 1 mL of sulfuric acid (5 %v/v). Finally, 2 mL of ammonium molybdate solution was added, and the mixture was left for 15 min. Absorbance was measured at a wavelength of 760 nm against the blank using a spectrophotometer.
Vitamin E estimation
Vitamin E (α-tocopherol) was estimated using the Fe(III) bathophenanthroline method [32]. A 0.2 - 0.4 mL aliquot of tocopherol was dissolved in diethyl ether, and 4 mL of petroleum ether-ethanol solution, along with 1 mL of bathophenanthroline solution, were added and mixed well. Then, 0.5 mL of FeCl₃ solution was added dropwise, followed by 0.5 mL of phosphoric acid after 15 s. The absorbance was measured at 534 nm.
Analysis of truffle components using organic solvents and their antioxidant effects
The components of the truffle were extracted using organic solvents with graded polarity, namely petroleum ether, chloroform, and methanol, through a direct method. The phenolic content was 72, 55 and 106 mg gallic acid equivalent per 100 g of extract, respectively. The flavonoid content was 39, 43 and 71 mg quercetin equivalent per 100 g of extract, respectively. All extracts demonstrated antioxidant activity at varying degrees against DPPH• and LOO• radicals, as evaluated by the β-carotene bleaching assay. The methanolic extract showed superior antioxidant effects compared to the other 2 extracts. Preparation of crude extracts from the T. nivea fungus: The components of the dried truffle were partitioned using organic solvents with graded polarity (petroleum ether, chloroform, methanol) through the direct method, as shown in Figure 1.
Direct extraction method
Petroleum ether (40 - 60), chloroform, and methanol were used as solvents to extract the components of the dried truffle, each separately. A 100-gram sample of powdered dried truffle was weighed, and solvent (petroleum ether, chloroform, or methanol) was added in batches. The mixture was homogenized in a blender, and the resulting extract for each solvent was filtered through anhydrous sodium sulfate, except for the methanol extract. The solvent was then evaporated at 40 °C using a rotary evaporator, and the yield for each extract was weighed.
Beta-carotene bleaching assay
A 0.01 g sample of beta-carotene was dissolved in 10 mL of chloroform and mixed in a glass container [33]. To this, 0.04 g of linoleic acid and 0.4 g of Tween 20 were added and well mixed. The chloroform was then evaporated using a rotary evaporator at 40 °C for 10 min. Subsequently, 100 mL of oxygenated water was slowly added while vigorously shaking to form the emulsion. A precise volume of 4.5 mL of the emulsion was transferred into clean, dry test tubes with caps. Varying concentrations of the extract (0.5, 2.5, 5 and 10 mg/mL) were added to each test tube, and a standard BHA solution (up to 2 mg/mL) was used for comparison. The test tubes were shaken thoroughly using an electric shaker. The absorbance of each sample was measured at a wavelength of 470 nm, alongside a control sample (containing all components except beta-carotene). The test tubes were then placed in a water bath at 50 °C, and absorbance was measured at 15-minute intervals for a total duration of 120 min. The inhibition percentage was calculated using the following Eq. (4);

where R = ln(a/b)t, a is the absorbance at the start of the experiment (time = 0), b is the absorbance at the end of the experiment (120 min), and t is the time at the end of the experiment.
Free radical scavenging activity using the DPPH (2,2-Diphenyl-1-picrylhydrazyl) assay
Radical scavenging activity of the methanolic truffle extract against DPPH radicals was assessed according to the method described by Sudha et al. with some modifications [3]. A volume of 100 µL of the extract was added to 1.9 mL of a 0.1 mM methanolic solution of DPPH radical. The mixture was vigorously shaken and allowed to stand in the dark for 30 min. The absorbance was then measured at 517 nm using a UV-Vis spectrophotometer. BHT (2 µg/mL) was used as a comparison. The antioxidant activity was expressed as the percentage of DPPH radical inhibition.
Statistical analysis
Statistical analysis was performed using a One-way Analysis of Variance (ANOVA) based on a Completely Randomized Design (CRD) [34]. All measurements were conducted in three independent replicates (n = 3), and the results are expressed as mean ± standard deviation (SD). Significant differences between treatment means were determined using the Least Significant Difference (LSD) test at a probability level of p < 0.05, according to the procedure described by [35].
Computational modeling
The ligands under were investigated using DFT/B3LYP-D3/6-311G(d,p) method with the Gaussian09 package, and a GaussView 6.0 as a visualization package. Additionally, the TD-DFT method computational approach was applied to determine the frontier molecular orbitals, namely the highest occupied molecular orbital (HOMO) and the lowest unoccupied molecular orbital (LUMO) [36,37]. The HOMO/ LUMO energies levels and the band gap were used to gain a deeper insight into the reactive regions of the compounds, particularly concerning electrophilic and nucleophilic attacks [38]. The QTAIM topological parameters were generated using the Multiwfn package, while the Non-Covalent Interactions (NCI) plot was generated with the VMD package [39].
Molecular docking
Molecular docking simulations were conducted using the Molecular Operating Environment (MOE) software, version 2022.02. The X-ray crystal structure of the target enzyme, xanthine oxidase (PDB ID: 1FIQ, with a resolution of 1.99 Å), was retrieved from the RCSB Protein Data Bank (https://www.rcsb.org) [36,40,41]. Protein preparation was performed using the QuickPrep module within MOE. This process involved the following sequential steps: Removal of all water molecules and any co-crystallized ligands, addition of hydrogen atoms and assignment of partial atomic charges employing the AMBER10: EHT force field, and final energy minimization of the modified structure. The three-dimensional structures of all phenolic compounds (ligands) were obtained from the PubChem database. Ligand preparation was executed using MOEʼs Ligand Preparation module, which included: Adjustment of protonation states for ionizable functional groups to reflect physiological pH conditions (pH 7.4), energy minimization using the MMFF94x force field, and definition of rotatable bonds to allow for conformational flexibility during docking. A blind docking strategy was employed, wherein a large, all-encompassing grid box was defined to cover the entire solvent-accessible surface of the protein. This approach enables an unbiased search for potential binding sites across all surface pockets and cavities. Docking calculations were performed using the Triangle Matcher placement method, with initial pose ranking based on the London dG scoring function. The top 30 poses generated for each ligand were subsequently refined and re-scored using the GBVI/WSA dG scoring function. The GBVI/WSA dG function served as the primary metric for estimating binding affinity, with results expressed as binding free energy in kcal/mol (more negative values indicate stronger predicted binding). To ensure robust conformational sampling and result reliability, 10 independent docking runs were performed for each ligand, utilizing different random seeds in each run. The final pose selected for detailed interaction analysis for each compound was the one exhibiting the most favorable (lowest) GBVI/WSA dG score. Visualization and analysis of the final protein-ligand complexes, including identification of hydrogen bonds and π-interactions, were performed using the molecular visualization and analysis tools integrated within the MOE suite.
Results and discussion
Total analysis
As shown in Table 1, the results revealed that the fruiting body of T. nivea truffle grown in Libya contains 77. 00% moisture, 29.00% protein, 8.30% fat, 1.62% ash, and 5.26% fiber on a dry weight basis. The carbohydrate content, calculated by difference, was 55.82%. The truffle primarily consists of carbohydrates, followed by protein and fat. These findings align with the composition of the Tunisian T. nivea truffle, which contained 57.83 g of carbohydrates, 28.81% protein, and 77.63% moisture, while the ash content was higher at 5.06 g/100 g on a dry weight basis [42]. In contrast, the Algerian T. nivea truffle had lower moisture content (68%) and higher ash content (5.50%), while its protein (11.97%) and fat (21.5) contents were lower [43]. The macronutrient profile of T. nivea indicates a carbohydrate-dominant composition with appreciable protein contribution, which may reflect adaptive metabolic strategies of desert truffles, including polysaccharide accumulation for stress tolerance and nitrogenous compounds contributing to nutritional value. The compositional differences observed between Libyan specimens and those reported from Tunisia and Algeria likely arise from environmental and edaphic variability, highlighting the influence of geographical ecology on truffle biochemistry [2]. These findings are scientifically relevant as they emphasize the need for region-specific nutritional characterization rather than generalized assumptions. Nevertheless, the present assessment is limited to proximate analysis and does not resolve specific polysaccharide or amino acid profiles; thus, broader biochemical characterization and seasonal evaluation are warranted to better understand the biological and nutritional implications.
Table 1 The approximate analysis of T. Nivea truffle.
% Moisture |
% Protein |
% Fat |
% Ash |
% Fiber |
% Carbohydrates |
77 ± 1.66 |
29 ± 0.66 |
8.3 ± 0.11 |
1.62 ± 0.06 |
5.26 ± 0.14 |
55.82 ± 0.00 |
Estimation of total phenolics in freeze-dried truffle
The results obtained for the total phenolic content, expressed as gallic acid equivalents (Figure 1), indicated that the total phenolic content was 160.06 mg gallic acid equivalent mg/100 g of sample. This value is higher than that of T. nivea truffles grown in Saudi Arabia, which contained 132.8 mg /100 g of sample [44]. In comparison, European Tuber species had a total phenolic content ranging from 1.20 to 1.80 mg/g, suggesting that the Libyan truffle has a higher phenolic content than the European truffles [45].
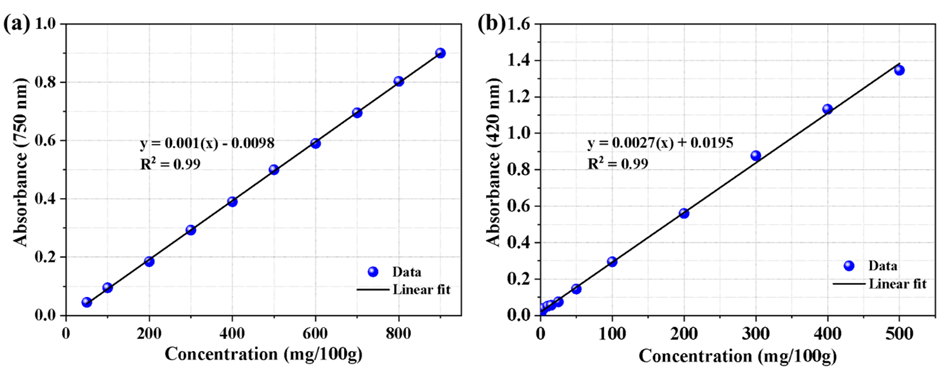
Figure 1 The standard curve for the determination of phenols (a) and flavonoids (b) in dried truffles Estimation of total flavonoids.
The results indicated that T. nivea truffle contained a total flavonoid content of 64 mg rutin equivalent per 100 g of sample (Figure 1). In comparison, the study conducted by AL-Laith et al. (2010) found that the flavonoid content was 293 mg quercetin equivalent per 100 g of Libyan T. [46].
Estimation of anthocyanins
Anthocyanins were estimated using the pH differential method, with a content of 0.188 mg/g, calculated on the basis of Cyanidin-3-glucoside. When comparing the results obtained with other studies, the anthocyanin content in the Libyan truffle was higher than that in the Algerian T. nivea (0.09 mg.g−1 dry weight) and T. pinoyi truffles (0.06 mg.g−1 dry weight) [43]. However, the results were closer to those found in Saudi Arabian truffles (0.15 mg/g dry weight), but lower than the anthocyanin content in Tunisian T. nivea truffles (0.291 mg/g dry weight). Additionally, the Libyan T. nivea truffle had a lower anthocyanin content compared to T. boudieri truffles from Tunisia (0.345 mg.g−1). In general, the differences in total phenolic, flavonoid, and anthocyanin content can be attributed to variations in season, geographical areas, climate, harvest time, and their effects on the components of the same truffle species. Additionally, different truffle varieties and their relationship with the host organism may also play a role.
Identification and estimation of some phenolic compounds in freeze-dried truffle
The identification and estimation of some phenolic compounds in the truffle were conducted, and this study is the first of its kind, as it has not been previously investigated. The results from high-performance liquid chromatography (HPLC) analysis (Figure S1) revealed that the Libyan truffle contains nine phenolic compounds. The results, as shown in Table 2, indicate that the truffle contains various phenolic compounds, including Pyrogallol, P-hydroxy benzoic acid, P-coumaric acid, benzoic acid, O-coumaric acid, Quercitin, rosemarinic acid, caffeic acid, and gallic acid (Figure 2).
Table 2 Showing phenolics and flavonoids separated by High-Performance Liquid Chromatography (HPLC).
|
(mg/100g) Quantity |
Detention time (min) |
Pyrogallol |
8.11018 |
2.951 |
Gallic acid |
4.07021 |
3.697 |
P-hydroxy benzoic acid |
28.10838 |
7.598 |
Caffeic acid |
9.12564e-1 |
10.262 |
P-coumaric acid |
7.33920e-1 |
13.108 |
Benzoic acid |
19.15436 |
14.302 |
O-coumaric acid |
2.27041e-1 |
17.374 |
Quercitin |
10.22747 |
21.180 |
Rosemarinic acid |
6.24402 |
21.806 |
Among these, P-hydroxy benzoic acid was found in the highest amount, followed by benzoic acid, quercitin, and caffeic acid (mg/100 g dry weight). On the other hand, O-coumaric acid was present in the smallest quantity. These findings are consistent with several studies reporting the presence of similar compounds in other truffle species, especially P-hydroxy benzoic acid. However, this compound was not found in Iranian T. nivea, although it was detected in T. claveryi and T. pinoyi, as well as in some Tuber species growing in China. Additionally, the Libyan truffle contained higher amounts of gallic acid compared to the same species grown in Iran [11].
Figure 2 Chemical structures of phenols and flavonoids found in Libyan truffle.
Vitamin E estimation
The results showed that the Libyan T. nivea truffle contained 66.7 µg.g−1 of α-Tocopherol. This result is in agreement with numerous studies that indicate the general presence of Vitamin E in truffles [47]. It is noteworthy that the presence of Vitamin E among the constituents of the truffle contributes to its antioxidant properties.
Vitamin A estimation
The estimation of Vitamin A in the T. nivea truffle under study showed a content of 70.53 International Units per gram. Several studies have reported the presence of Vitamin A and carotenoids in truffles. For instance, a study on the Libyan T. claveryi truffle found a Vitamin A content of 1.93 mg.100 g−1. The presence of Vitamin A and carotenoids enhances the antioxidant capacity of truffles.
Vitamin C estimation
The results for Vitamin C estimation in the T. nivea truffle showed a content of 22.51 mg.100 g−1. Vitamin C is an essential water-soluble vitamin and, apart from its nutritional importance, it exhibits antioxidant effects. Comparing the results, the Libyan truffle contained nearly double the Vitamin C content found in T. nivea from Tunisia, which had 10.63 mg/100 g. In comparison with other truffle species, T. boudieri contained 12.20 mg/100 g, and the European truffles T. pseudohimalaynse, T. subglobosum, and T. latisporum contained 4.59, 4.61 and 4.63 mg/100 g, respectively. As reported by Al-Laith, Vitamin C content in T. nivea varies in different regions, with values of 11.4 mg/100 g in Bahrain, 10.9 mg.100 g−1 in Iran, 5.9 mg.100 g−1 in Morocco, and 10.3 mg/100 g in Saudi Arabia. The results suggest that the Libyan truffle contains double the amount of Vitamin C compared to other T. nivea varieties, possibly due to differences in soil and climatic conditions. The high content of Vitamins A, C and E in Libyan T. nivea likely contributes significantly to its antioxidant potential, with mechanistic implications for scavenging reactive oxygen species and protecting cellular components from oxidative damage [48]. The elevated Vitamin C levels, nearly double those reported in Tunisian and other regional truffles, may result from environmental and edaphic factors, such as soil mineral composition, UV exposure, and arid climate stress, which are known to influence carotenoid and ascorbate biosynthesis in fungi. These findings underscore the nutritional and functional value of Libyan T. nivea as a potential source of natural antioxidants [49]. Nevertheless, these estimations are limited to total vitamin content without assessing bioavailability, stability under processing, or synergistic interactions with other antioxidants; thus, further studies including bioaccessibility and in vivo antioxidant assays are warranted to substantiate these functional implications [50].
Quantitative and qualitative estimation of Sterols in dried truffle
The results, shown in Figure S2 and Table 3, indicated that the T. nivea truffle contains ergosterol (6377.22 mg/kg), stigmasterol (2260.55 mg/kg), β-sitosterol (243.7 mg/kg), and squalene (22.70 mg/kg) in dry weight. The highest amount was ergosterol, which is a precursor to Vitamin D2.
Table 3 Shows the types and quantities of sterols separated.
|
Ergosterol |
Stigmasterol |
B.Sitosterol |
Squaline |
|
4.700 |
6.850 |
7.733 |
10.583 |
|
6377.223 |
2260.55 |
243.71 |
This compound is also found in other truffle species such as T. melanosporum, T. aestivum, and T. indicum, with contents of 1.90, 1.86, and 1.37 mg.g−1 dry weight, respectively [51]. Besides its various effects, ergosterol is also known for its antioxidant properties [52]. These results are consistent with a study by Dahham et al. which found stigmasterol, β-sitosterol, and squalene in the Iraqi T. claveryi truffle [47]. Additionally, a study by Alshawash (2022) showed that β-sitosterol exhibited a weak antioxidant effect in scavenging free radicals, with an IC50 of 100 µg.mL−1 for the DPPH• compound [53].
Partitioning of truffle components using graded organic solvents
Dried truffle components were partitioned using graded organic solvents: Petroleum ether, chloroform, and methanol, through the direct method (Scheme S1). This process aimed to identify the extract with the highest antioxidant activity. Total phenolic and total flavonoid contents were determined, and the antioxidant activity of each extract was evaluated using the DPPH• assay and the β-carotene bleaching test.
Petroleum ether extract
The obtained results indicated that the yield of the petroleum ether extract was 4 g per 100 g of dried truffle. The total phenolic content, expressed as gallic acid equivalents, was quantified as 72 mg gallic acid equivalent per 100 g of dry weight. Meanwhile, the total flavonoid content, expressed as quercetin equivalents (Figure 3), was 39 mg quercetin equivalent per 100 g of dry weight.
Antioxidant activity of petroleum ether extract using the DPPH• assay
The results obtained, as shown in Table 2 and Figure 5, indicated that the extract exhibited antioxidant activity through its ability to scavenge DPPH• radicals. Three concentrations were tested: 1,000, 500 and 200 µg.mL−1, and the extract was compared with BHT at a concentration of 200 µg/mL. It was observed that the antioxidant activity increased with concentration, with the highest inhibition percentage recorded at 1,000 µg.mL−1, reaching 69.09%. The effects at these concentrations were generally lower than the standard, which exhibited an inhibition percentage of 92.7%. Overall, the antioxidant activity of the petroleum ether extract of truffles can be attributed to the presence of significant compounds known for their antioxidant effects. These compounds are likely to be found in the petroleum ether extract, including vitamins E and A, carotenoids, as well as triterpenes and sterols, which were identified in the analyses of the dried truffles. The truffles were found to contain vitamin E, vitamin A, ergosterol, stigmasterol, and β-sitosterol. Moreover, these compounds may exhibit synergistic effects, as some of the compounds involved are known to show this property. Finally, it is also possible that various polyphenolic compounds are present in this extract, which could contribute to its antioxidant activity.
Antioxidant activity of Petroleum ether extract using the β-carotene bleaching assay
Although the DPPH• assay is one of the most commonly used methods to assess the antioxidant activity of plant-derived compounds (such as those from truffles), it is important to note that these radicals are non-lipid in origin and may differ from those formed from lipid substances [54]. Therefore, the β-carotene bleaching assay was chosen. In this assay, oxidation of linoleic acid in the system leads to the formation of peroxy radicals (LOO•), which attack the chromophore structure of β-carotene. This results in the loss of β-caroteneʼs color, which serves as an indicator of oxidation. Moreover, future experiments will focus on selecting the most effective extracts as antioxidants in an O/W emulsion system. This assay also involves an emulsion system consisting of linoleic acid, an emulsifier, and water, which contains oxygen [55]. Therefore, it may provide a more accurate representation of the antioxidant activity of the extracts, particularly those that may function within an emulsion system. The results shown in Table 4 and Figure 5 indicated that the petroleum ether extract exhibited scavenging activity against LOO• radicals. The activity was similar between the concentrations of 2.5 and 5 mg.mL−1, while the most significant effect was observed at a concentration of 10 mg.mL−1. The weakest antioxidant activity was found at the concentration of 0.5 mg/mL. This trend was also evident when compared to the standard BHA and the control (without any extract). The inhibition percentage of LOO• radicals by the petroleum ether extract is presented in Table 7, where the inhibition values for the concentrations of 10, 5, 2.5 and 0.5 mg.mL−1 were 50.5%, 62.6%, 75.01% and 87.2%, respectively, while the inhibition percentage for the standard was 98.05%. Overall, the petroleum ether extract demonstrated antioxidant activity, which may be attributed to the presence of certain compounds with known antioxidant effects, as previously mentioned.
Table 4 Shows the effect of petroleum ether extract on the β-carotene bleaching.
Time (min) |
Blank |
0.5 |
2.5 |
5 |
10 |
BHA |
0 |
0.430 ± 0.001 |
0.419 ± 0.001 |
0.420 ± 0.001 |
0.415 ± 0.001 |
0.420 ± 0.001 |
0.440 ± 0.001 |
15 |
0.209 ± 0.001 |
0.300 ± 0.001 |
0.320 ± 0.001 |
0.300 ± 0.001 |
0.401 ± 0.001 |
0.400 ± 0.00 |
30 |
0.120 ± 0.001 |
0.210 ± 0.001 |
0.275 ± 0.002 |
0.285 ± 0.002 |
0.375 ± 0.002 |
0.400 ± 0.00 |
45 |
0.106 ± 0.001 |
0.200 ± 0.001 |
0.240 ± 0.001 |
0.275 ± 0.001 |
0.363 ± 0.001 |
0.400 ± 0.00 |
60 |
0.100 ± 0.001 |
0.199 ± 0.001 |
0.235 ± 0.002 |
0.260 ± 0.001 |
0.350 ± 0.001 |
0.400 ± 0.00 |
75 |
0.090 ± 0.001 |
0.150 ± 0.001 |
0.220 ± 0.001 |
0.240 ± 0.00 |
0.315 ± 0.002 |
0.400 ± 0.00 |
90 |
0.080 ± 0.001 |
0.143 ± 0.001 |
0.215 ± 0.002 |
0.225 ± 0.002 |
0.300 ± 0.00 |
0.400 ± 0.00 |
105 |
0.050 ± 0.001 |
0.130 ± 0.001 |
0.200 ± 0.001 |
0.220 ± 0.001 |
0.275 ± 0.001 |
0.400 ± 0.00 |
Table 5 Shows the effect of chloroform extract on the β-carotene bleaching.
Time(min) |
Blank |
0.5 |
2.5 |
5 |
10 |
BHA |
0 |
0.430 ± 0.001 |
0.415 ± 0.001 |
0.420 ± 0.001 |
0.415 ± 0.001 |
0.420 ± 0.001 |
0.440 ± 0.001 |
15 |
0.200 ± 0.001 |
0.300 ± 0.001 |
0.325 ± 0.001 |
0.350 ± 0.01 |
0.401 ± 0.001 |
0.400 ± 0.00 |
30 |
0.124 ± 0.001 |
0.220 ± 0.001 |
0.280 ± 0.001 |
0.290 ± 0.001 |
0.380 ± 0.001 |
0.400 ± 0.00 |
45 |
0.120 ± 0.001 |
0.210 ± 0.001 |
0.250 ± 0.001 |
0.275 ± 0.002 |
0.365 ± 0.002 |
0.400 ± 0.00 |
60 |
0.114 ± 0.001 |
0.201 ± 0.001 |
0.240 ± 0.001 |
0.263 ± 0.001 |
0.350 ± 0.001 |
0.400 ± 0.00 |
75 |
0.101 ± 0.001 |
0.190 ± 0.001 |
0.225 ± 0.002 |
0.240 ± 0.001 |
0.315 ± 0.002 |
0.400 ± 0.00 |
90 |
0.100 ± 0.001 |
0.175 ± 0.001 |
0.215 ± 0.001 |
0.225 ± 0.002 |
0.300 ± 0.001 |
0.400 ± 0.00 |
105 |
0.070 ± 0.001 |
0.150 ± 0.001 |
0.200 ± 0.001 |
0.215 ± 0.001 |
0.270 ± 0.001 |
0.400 ± 0.00 |
Table 6 Shows the effect of methanol extract on the β-carotene bleaching.
Time(min) |
Blank |
0.5 |
2.5 |
5 |
10 |
BHA |
0 |
0.433 ± 0.001 |
0.415 ± 0.002 |
0.425 ± 0.002 |
0.420 ± 0.001 |
0.420 ± 0.001 |
0.440 ± 0.001 |
15 |
0.203 ± 0.001 |
0.300 ± 0.003 |
0.310 ± 0.001 |
0.312 ± 0.001 |
0.390 ± 0.002 |
0.400 ± 0.000 |
30 |
0.129 ± 0.001 |
0.201 ± 0.001 |
0.220 ± 0.001 |
0.261 ± 0.001 |
0.386 ± 0.002 |
0.400 ± 0.000 |
45 |
0.124 ± 0.001 |
0.175 ± 0.002 |
0.207 ± 0.001 |
0.220 ± 0.001 |
0.370 ± 0.001 |
0.400 ± 0.000 |
60 |
0.114 ± 0.001 |
0.150 ± 0.002 |
0.190 ± 0.001 |
0.211 ± 0.001 |
0.350 ± 0.001 |
0.400 ± 0.000 |
75 |
0.101 ± 0.001 |
0.132 ± 0.001 |
0.178 ± 0.001 |
0.209 ± 0.001 |
0.335 ± 0.002 |
0.400 ± 0.000 |
90 |
0.100 ± 0.001 |
0.115 ± 0.002 |
0.156 ± 0.002 |
0.199 ± 0.001 |
0.300 ± 0.003 |
0.400 ± 0.000 |
105 |
0.080 ± 0.001 |
0.101 ± 0.001 |
0.142 ± 0.001 |
0.190 ± 0.001 |
0.293 ± 0.001 |
0.400 ± 0.000 |
Chloroform extract
The components of the dried truffle were extracted using chloroform as a solvent, due to its moderate polarity, with the aim of obtaining compounds that might exhibit antioxidant effects. The results showed that the yield obtained was 9 g. 100 g−1 of dried truffle, which was higher than the yield obtained from petroleum ether extract. This extract contained total phenols, measured as gallic acid equivalents, with a value of 55 mg gallic acid equivalent per 100 g. It also contained flavonoids, measured as quercetin equivalents (Figure 3), with a value of 43 mg quercetin equivalent per 100 g. The results indicate that most of the total phenols are flavonoids. When comparing the obtained results for total phenols, they were lower than those of the T. nivea truffle grown in Tunisia, which had 132 mg.100 g−1 of extract. However, the flavonoid content was similar, with 61 mg per 100 g of extract [56].
Antioxidant activity of Chloroform extract using the β-carotene bleaching assay
The results shown in Table 4 and Figure 5 indicated that the chloroform extract exhibited antioxidant activity through the scavenging of peroxy radicals (LOO•) generated by the oxidation of linoleic acid. The antioxidant effect increased with concentration, with the weakest effect observed at the lowest concentration of 0.5 mg/mL. The concentrations of 2.5 and 5 mg.mL−1 showed similar effects, with a slight preference for the higher concentration. The results further revealed that the optimal effect was observed at 5 mg/mL, although it was lower than that of the standard antioxidant BHT. The inhibition percentages for the concentrations of 10, 5, 2.5 and 0.5 mg/mL were 42.8%, 57.3%, 71.5% and 85.1%, respectively, while the inhibition percentage for the standard BHA was 98.01%. In general, the inhibition percentages for the chloroform extract were lower than those obtained for the petroleum ether extract.
Antioxidant activity of Chloroform extract using the DPPH• assay
The results presented in Table 2 and Figure 5 demonstrated that the chloroform extract exhibited antioxidant activity for all tested concentrations (200, 500, 1,000 µg.mL−1), with inhibition percentages of 56.16%, 72.6% and 74.88%, respectively. In comparison, the inhibition percentage of the BHT compound was 92.69%. This activity could be attributed to the presence of moderately polar compounds, such as some terpenes, sterols, carotenoids to a lesser extent, and certain phenolic compounds, particularly P-hydroxybenzoic acid, which was identified among the phenolic compounds isolated in this study [57]. Additionally, several studies have reported antioxidant effects in other types of truffles, such as T. claveryi, T. abiensis, and T. nivea [58]. The results also indicated that the 1,000 and 500 µg/mL concentrations exhibited similar antioxidant effects, with inhibition percentages of 74.88% and 72.6%, respectively, suggesting that using the lower concentration could be more economically viable [59].
Antioxidant activity of Chloroform extract using β-carotene colorimetry
The results obtained, as shown in Table 5 and Figure 3, indicate that the chloroform extract exhibits antioxidant activity by scavenging peroxy radicals (LOO•) generated from the oxidation of linoleic acid. This effect increased with higher concentrations, with the lowest concentration of 0.5 mg/mL showing the weakest effect. On the other hand, the concentrations of 2.5 and 5 mg/mL were similar, with a slight preference for the higher concentration. The results further reveal that the highest antioxidant effect was observed at the 5 mg.mL−1 concentration, though it was still lower than that of the standard antioxidant BHT. It is noteworthy that the inhibition percentages for the concentrations of 10, 5, 2.5, and 0.5 mg/mL were 42.8%, 57.3%, 71.5% and 85.1%, respectively. In comparison, the inhibition percentage for the standard BHA was 98.01%, which, in general, was lower than the inhibition percentage obtained for the petroleum ether extract.
Methanol extract
The extraction yield of 18 %(w/w) obtained with methanol was significantly higher than those achieved with the less polar solvents, petroleum ether and chloroform. Methanol, a highly polar protic solvent, exhibits superior efficiency in extracting a broad spectrum of mid- to high-polarity bioactive constituents from the truffle matrix. These include key target compounds such as aromatic phenolics, flavonoids, tannins, glycosides, and alkaloids, which contain multiple hydroxyl, carboxyl, and other polar functional groups that favorably interact with methanol via hydrogen bonding and dipole-dipole interactions. Consequently, the methanol extract not only yielded a greater mass of crude material but also contained the highest concentrations of total phenolics (106 mg GAE/100 g extract) and flavonoids (71 mg QE/100 g extract), as quantified in this study (Figure 3), The lower yields from petroleum ether and chloroform reflect their affinity for non-polar compounds like lipids, waxes, and some terpenoids, which constitute a smaller fraction of the truffleʼs targeted bioactive profile. It is noteworthy that the total phenolic content reported here for T. nivea (106 mg GAE/100 g) differs from values reported in other regions, such as 171 mg GAE/100 g in Algerian samples [60]. This variability is commonly observed in natural products and can be attributed to extrinsic factors including geographical origin, soil composition, climatic conditions, truffle maturity at harvest, and post-harvest handling, all of which influence the biosynthetic profile of secondary metabolites [61].
Antioxidant activity of methanol extract using the DPPH• assay
The results obtained indicated that the methanol extract exhibited antioxidant activity, demonstrated by its ability to scavenge DPPH• radicals (Table 2 and Figure 5). The antioxidant effect increased with higher concentrations, as the inhibition percentage rose from 62.10% to 86.3%. The concentration of 1,000 µg/mL was comparable to that of the standard BHT at 200 µg/mL. This effect can be attributed to the presence of phenolic compounds, particularly phenolic acids, which were quantified in the study. The truffles studied contained Pyrogallol, p-hydroxybenzoic acid, p-coumaric acid, benzoic acid, o-coumaric acid, quercetin, rosmarinic acid, caffeic acid, and gallic acid. These compounds possess antioxidant activity by donating hydrogen or electrons to DPPH• radicals. Furthermore, the methanol extract may contain vitamin C, which was found to be 22.51 mg per 100 g of dried material in the truffles, in addition to several other compounds such as tannins, flavonoids, and anthocyanins. Numerous studies have indicated that these compounds have antioxidant effects, and they may contribute individually or through their synergistic (enhancing) antioxidant effects [62].
Antioxidant activity of methanol extract using β-carotene colorimetry
The results obtained, as shown in Table 6 and Figure 3, indicated that the methanol extract exhibited strong antioxidant activity at a concentration of 10 mg/mL and the weakest effect at a concentration of 0.5 mg.mL−1. At the lower concentration, the formation of peroxy radicals (LOO•) was high, which led to the bleaching of β-carotene, similar to the control group with no treatment. However, the antioxidant effect increased with higher concentrations, particularly at 2.5 and 5 mg/mL. This increase in activity may be attributed to the presence of phenolic compounds and flavonoids. The various concentrations of the methanol extract resulted in different inhibition percentages, which increased with the concentration. The inhibition percentages for the concentrations of 10, 5, 2.5 and 0.5 mg/mL were 96.9%, 92.3%, 89.1% and 72.01%, respectively. A comparison of the antioxidant activities of the three extracts (petroleum ether, chloroform, and methanol) presented in Table 2 shows that all three extracts exhibited antioxidant effects, although to varying degrees. The methanol extract demonstrated the strongest antioxidant activity. This can be attributed to the higher levels of phenolic compounds and flavonoids in this extract, as well as the presence of other antioxidant-active compounds, such as vitamin C [63].
Table 7 DPPH free radical inhibition rates of Petroleum ether, Chloroform, and Methanol extracts compared to BHT.
Concentration (μg/mL) |
Petroleum ether |
Chloroform |
Methanol |
Inhibition rate (%) |
|||
200 |
59.5 |
56.16 |
62.10 |
500 |
63.6 |
72.6 |
74.88 |
1000 |
69.09 |
74.88 |
86.30 |
BHT (200) |
92.72 |
92.69 |
92.71 |
Importantly, all tested concentrations of the extracts (200 - 1000 µg/mL) exhibited more than 50% DPPH• radical scavenging activity (Table 7), indicating that none of the inhibition curves crossed the 50% threshold within the tested range. Therefore, an exact IC₅₀ value could not be mathematically interpolated; however, the data clearly demonstrate that the IC₅₀ values for all extracts are lower than 200 µg/mL. Among the investigated extracts, the methanol extract showed the greatest antioxidant potency, followed by the chloroform and petroleum ether extracts, which is consistent with their respective phenolic and flavonoid contents and supports the strong contribution of phenolic constituents to the observed activity.
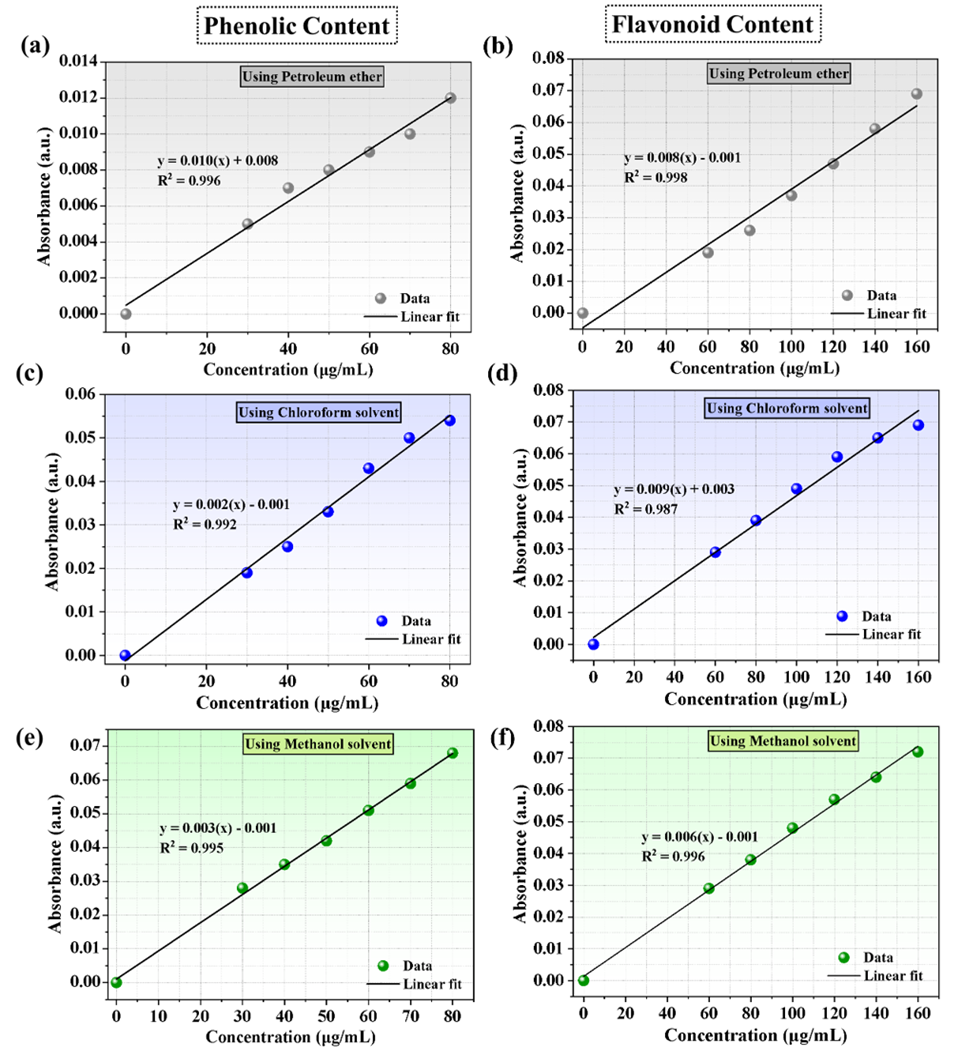
Figure 3 The standard curve for the determination of phenolic and flavonoid content: (a) - (b) In Petroleum ether, (c) - (d) In chloroform, and (e) - (f) In methanol extract.
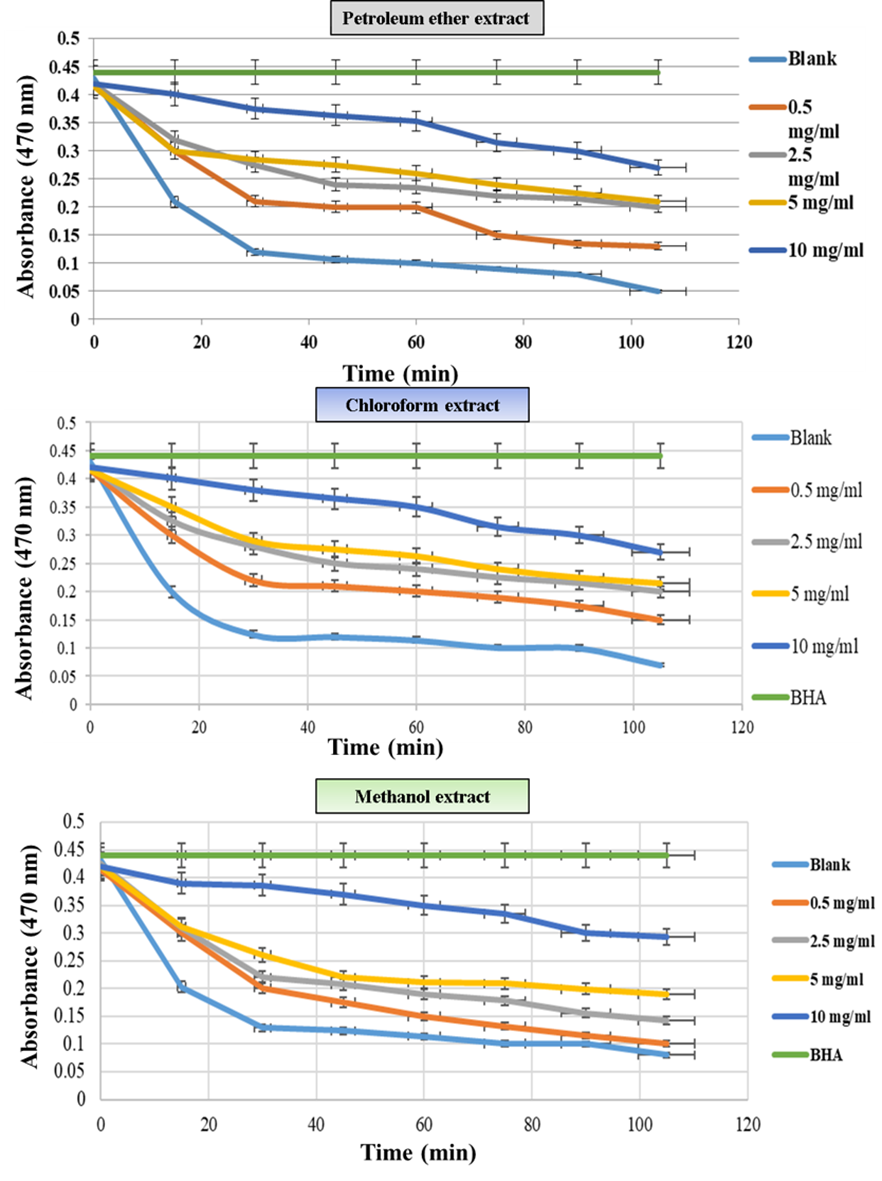
Figure 4 Effect of Petroleum ether, Chloroform, and Methanol extract on the inhibition of free radicals (LOO•) from Linoleic acid using the β-carotene bleaching assay.
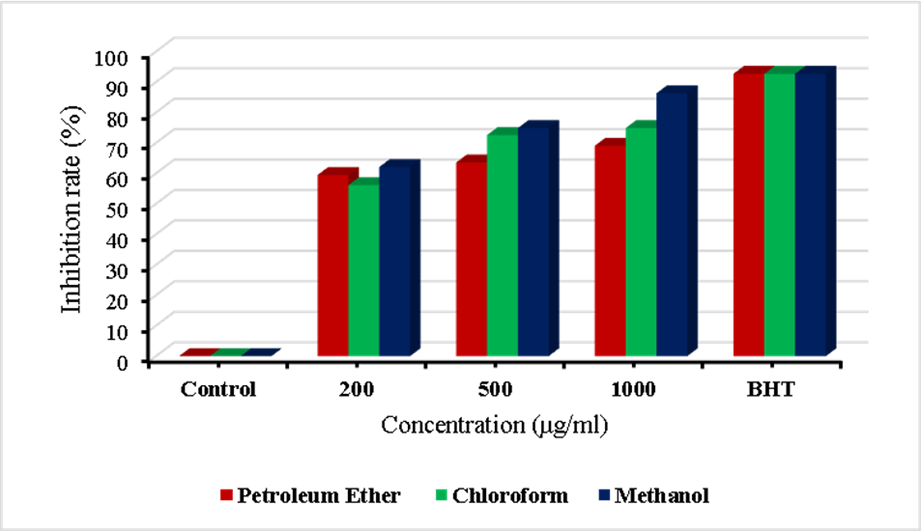
Figure 5 The inhibition rates of Petroleum ether extract for DPPH free radicals compared to BHT.
Density functional fheory (DFT)
HOMO-LUMO and MEP analysis
The studied compound have been optimized at DFT/B3LYP-D3/6-311G(d,p) level of theory. The combined analysis of Frontier Molecular Orbitals (HOMO-LUMO) and Molecular Electrostatic Potential (MEP) maps provides a detailed understanding of the electronic and biological properties of the compounds (see Table 8).
Table 8 FMOs and MEP plots of nine investigated compounds.
Compounds |
HOMO |
LUMO |
MEP |
Pyrogallol |
|
|
|
Benzoic acid |
|
|
|
p-hydroxy benzoic acid |
|
|
|
Gallic acid |
|
|
|
o-coumaric acid |
|
|
|
p-coumaric acid |
|
|
|
Caffeic acid |
|
|
|
Rosemarinic acid |
|
|
|
Quercitin |
|
|
|
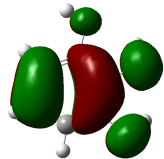
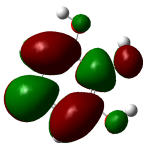
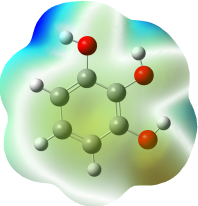
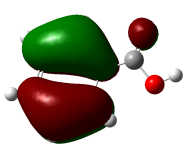
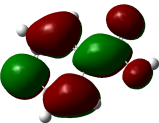
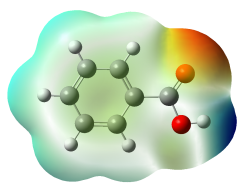
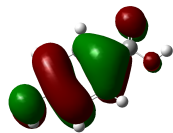
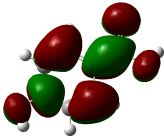
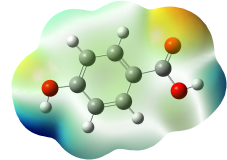
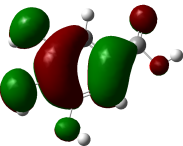
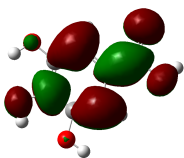
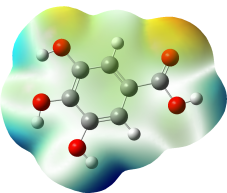
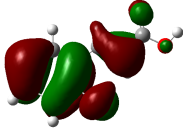
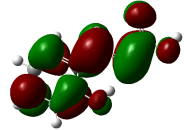
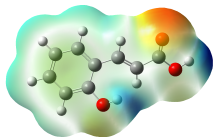
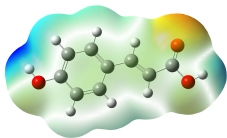
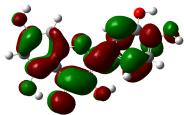
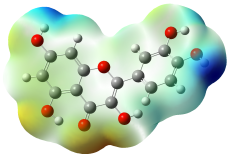
The HOMO-LUMO plots reveal that compounds like rosemarinic acid and quercetin have highly delocalized electron distributions and small energy gaps, enhancing their reactivity and antioxidant potential through efficient electron transfer. In contrast, benzoic acid and p-hydroxy benzoic acid, with localized orbitals and larger energy gaps, show reduced reactivity and weaker antioxidant activity. The MEP maps further corroborate these findings, with highly nucleophilic regions (red zones) observed over hydroxyl and aromatic sites in rosemarinic acid, quercetin, and caffeic acid, underscoring their superior ability to neutralize free radicals and interact with biological targets like xanthine oxidase. Gallic acid, o-coumaric acid, and p-coumaric acid demonstrate moderate nucleophilic regions, supporting their intermediate antioxidant activities, while benzoic acid displays minimal electron density and limited biological reactivity. Overall, the strong correlation between electronic properties, reactivity, and antioxidant activity highlights the potential of highly conjugated compounds as effective therapeutic agents against oxidative stress-related disorders.
HOMO-LUMO energy gap (Eg) and antioxidant activity
The HOMO-LUMO energy gap (Eg) represents the moleculeʼs chemical reactivity, with smaller gaps correlating to higher antioxidant potential due to enhanced electron transfer capability [48]. Among the analyzed compounds, rosemarinic acid exhibits the smallest Eg (3.507 eV), indicating its superior reactivity in scavenging free radicals, followed by quercetin (4.034 eV) and caffeic acid (4.148 eV) (see Table 9). Larger energy gaps, such as those of pyrogallol (6.052 eV) and benzoic acid (5.769 eV), suggest lower antioxidant efficacy. Low Eg values for rosemarinic acid and quercetin are consistent with their robust antioxidant activities observed experimentally, underscoring the critical role of bandgap in determining antioxidant potential.
Table 9 Electronic parameters of both studied compounds.
Compounds |
HOMO (eV) |
LUMO (eV) |
Bandgap (eV) |
Dipole moment (Debye) |
Pyrogallol |
‒5.858 |
0.194 |
6.052 |
2.908 |
Benzoic acid |
‒7.334 |
‒1.565 |
5.769 |
1.918 |
p-hydroxy benzoic acid |
‒6.657 |
‒1.282 |
5.375 |
3.269 |
Gallic acid |
‒6.252 |
‒1.294 |
4.958 |
4.578 |
o-coumaric acid |
‒6.488 |
‒2.136 |
4.352 |
1.071 |
p-coumaric acid |
‒6.224 |
‒1.877 |
4.347 |
2.943 |
Caffeic acid |
‒6.067 |
‒1.919 |
4.148 |
3.536 |
Rosemarinic acid |
‒5.649 |
‒2.142 |
3.507 |
6.651 |
Quercitin |
‒5.899 |
‒1.865 |
4.034 |
8.390 |
Dipole moment and molecular interactions
The dipole moment measures molecular polarity, influencing solubility and interactions with biological targets, such as enzymes. Quercetin, with the highest dipole moment (8.390 Debye), and rosemarinic acid (6.651 Debye) demonstrate superior potential for polar interactions and enzyme binding, enhancing their antioxidant efficacy. Conversely, compounds like O-coumaric acid (1.071 Debye) and benzoic acid (1.918 Debye) have lower dipole moments, potentially limiting their solubility and activity in polar environments. High dipole moments enhance bioavailability and efficacy, aligning with the observed strong antioxidant properties of rosemarinic acid and quercetin.
HOMO energy (εHOMO) and electron donation
The εHOMO parameter indicates a moleculeʼs ability to donate electrons, critical for neutralizing reactive oxygen species (ROS). Rosemarinic acid (−5.649 eV), quercetin (−5.899 eV), and caffeic acid (−6.067 eV) exhibit higher εHOMO, reflecting strong electron-donating properties, essential for effective antioxidant activity. In contrast, benzoic acid (−7.334 eV) and P-hydroxy benzoic acid (−6.657 eV) display lower εHOMO, correlating to reduced antioxidant capacity. This relationship highlights the significance of HOMO energy in determining antioxidant potential, complementing experimental findings.
LUMO energy (εLUMO) and radical stabilization
The εLUMO parameter reflects a moleculeʼs ability to accept electrons, aiding in radical stabilization. Rosemarinic acid (−2.142 eV) and caffeic acid (−1.919 eV) exhibit the lowest εLUMO, enabling superior stabilization of free radicals. Conversely, pyrogallol (0.194 eV) and benzoic acid (−1.565 eV) show less favorable εLUMO, limiting their antioxidant activity. The low εLUMO values of rosemarinic acid and caffeic acid reinforce their effectiveness in neutralizing ROS, aligning with their high experimental activity.
Optical properties analysis of the title compounds
The optical properties of the analyzed compounds, as reflected in their UV-Vis absorption spectra, reveal strong correlations with their biological activities (see Figure S4). Compounds like rosemarinic acid and quercetin exhibit significant bathochromic shifts with absorption peaks extending to higher wavelengths (344 and 352 nm, respectively), indicative of extensive conjugation and electron delocalization. These properties enhance their ability to stabilize free radicals, aligning with their experimentally observed strong antioxidant activities. Similarly, caffeic acid, with a peak at 310 nm, demonstrates substantial UV absorption, consistent with its high radical-scavenging potential. In contrast, compounds like benzoic acid and p-hydroxy benzoic acid, with absorption peaks primarily in the lower UV range (183 - 242 nm), have limited conjugation and correspondingly lower antioxidant activities. The prominent peaks of gallic acid and coumaric acid derivatives (262 - 294 nm) suggest moderate conjugation, contributing to their moderate biological activities. Overall, the strong UV-Vis absorption of highly conjugated compounds correlates with their ability to neutralize reactive oxygen species, emphasizing the role of optical properties in determining biological efficacy.
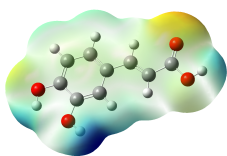
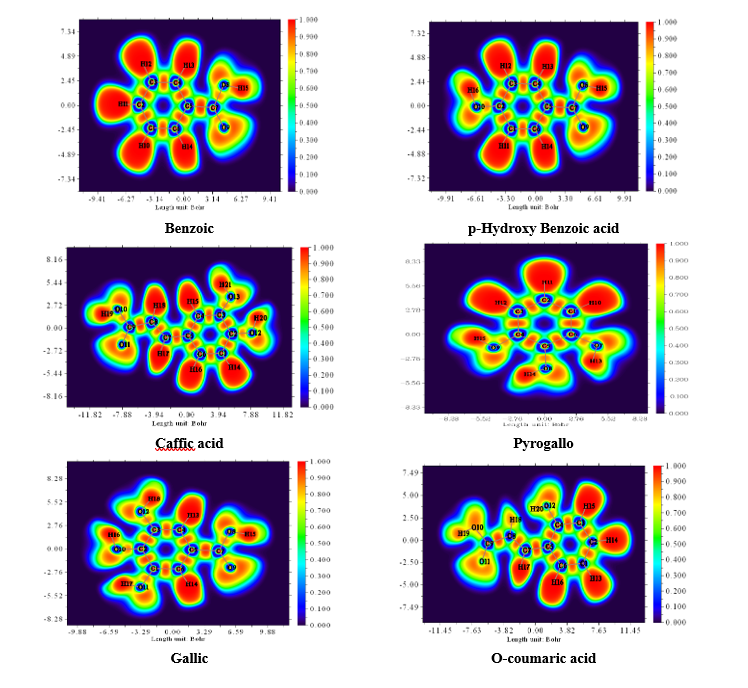
Electron localization function (ELF) analysis
The Electron Localization Function (ELF) is a sophisticated method for investigating the bonding, non-bonding and lone electron pairs on the surfaces of the studied compounds [49]. This technique is beneficial for elucidating the charge transfer mechanism and donor-acceptor groups within our compounds. The ELF values range from 0 to 1, which higher values indicating greater localization of electrons in this specified region. The ELF graphs are depicted in Figure 6. For all Figure 6, a red color surrounding the hydrogen (H) atoms indicate the presence of excess electrons in these regions. Conversely, the blue color around nitrogen (N) and oxygen (O) atoms signifies the presence of delocalized electrons at these sites. This observation suggests a potential charge transfer occurring at the material’s surface, highlighting the presence of significant donor-acceptor interactions. Such bindings enhance the stability of the compounds, making them advantageous for biological applications [64].
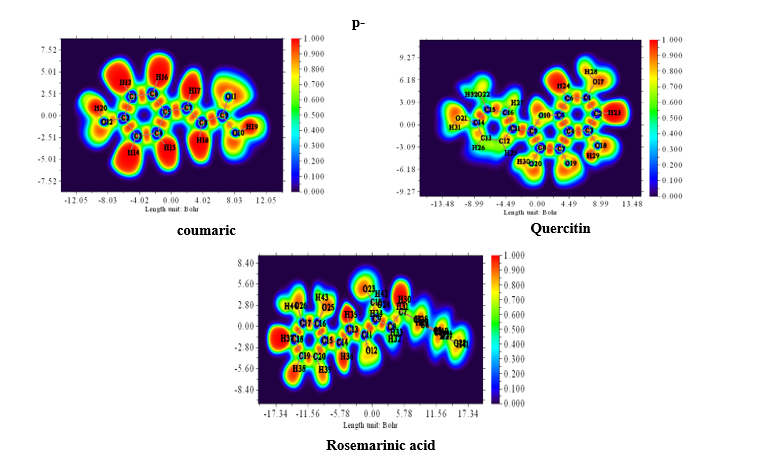 Figure
6
Electron
Localization Function (ELF) in electron distribution analysis and
its effect on the antioxidant capacities of Phenolic compounds in
truffles.
Figure
6
Electron
Localization Function (ELF) in electron distribution analysis and
its effect on the antioxidant capacities of Phenolic compounds in
truffles.
Biological implications
The combined quantum chemical parameters highlight rosemarinic acid and quercetin as standout antioxidants due to their small Eg, high dipole moments, and favorable HOMO and LUMO energies. Rosemarinic acid, with the smallest Eg and strong molecular interactions, is particularly effective in enzyme binding, supported by its high docking affinity with xanthine oxidase (−16.15 kcal/mol-16.15). Similarly, quercetinʼs high dipole moment and reactivity make it a potent antioxidant, capable of scavenging ROS effectively. While caffeic acid also exhibits strong antioxidant potential, compounds like pyrogallol and benzoic acid show limited efficacy due to larger Eg values and weaker polar interactions. These insights corroborate the experimental findings and highlight the therapeutic potential of these compounds in oxidative stress management.
Molecular docking
The molecular docking analysis of phenolic compounds extracted from Libyan T. nivea with xanthine oxidase (PDB ID: 1FIQ) revealed distinct binding affinities, summarized in (Figure 7 Table 10). Rosmarinic acid and Quercetin exhibited the lowest docking scores (‒16.15 and ‒15.14 kcal/mol, respectively), forming multiple hydrogen bonds and π-H interactions with key residues such as THR196, GLY14, and SER347. Pyrogallol, o-Coumaric acid, and Caffeic acid also showed strong binding (‒11.7 to ‒11.02 kcal/mol), whereas Benzoic acid displayed weaker interaction (‒6.3 kcal/mol). In comparison, the standard antioxidant BHT exhibited a docking score of ‒8.03 kcal/mol, indicating that several truffle-derived phenolics may act as more effective inhibitors of xanthine oxidase. Mechanistically, the observed hydrogen bonding and π-H interactions suggest that these phenolic compounds can stably occupy the active site of xanthine oxidase, potentially inhibiting its catalytic activity and contributing to the antioxidant capacity reported in experimental assays. The high binding affinity of Rosmarinic acid and Quercetin correlates with their structural features, including multiple hydroxyl groups capable of forming hydrogen bonds, which may enhance radical scavenging and electron donation. These findings provide critical insight into the functional role of individual phenolics and reinforce the notion that the antioxidant activity of T. nivea is not only due to total phenolic content but also to specific compounds with strong enzyme-binding potential. However, it is important to acknowledge that molecular docking represents a static computational model; it does not account for protein flexibility, solvation effects, or in vivo pharmacokinetics [65].
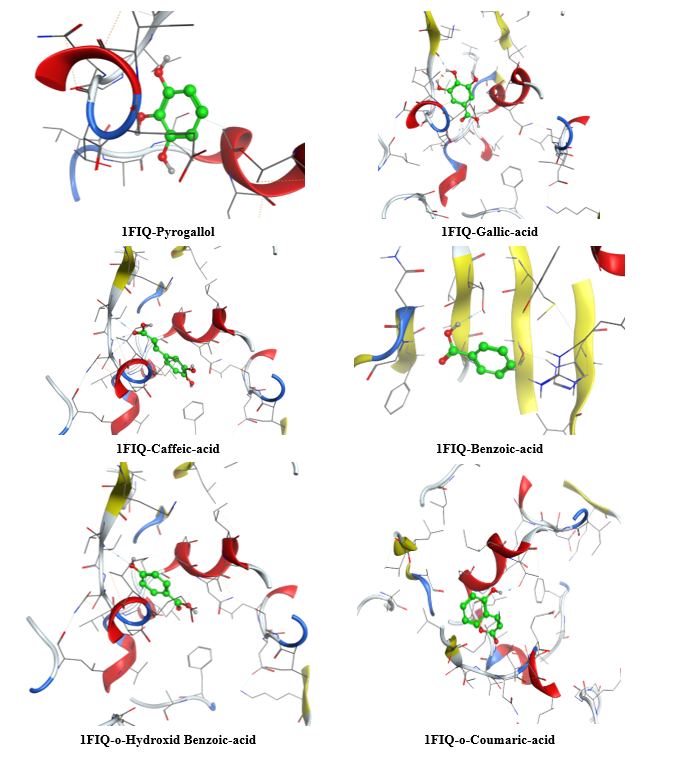
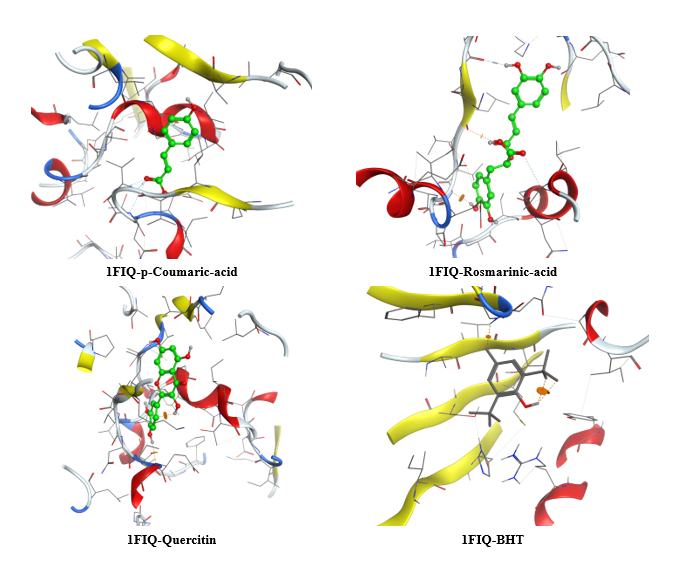
Figure 7 Three-dimensional molecular docking of Phenolic compounds in Libyan Truffle (T. nivea).
Table 10 Molecular docking scores, receptor interactions, binding distances, and energy values.
Compounds |
Docking score (kcal/mol) |
Receptor interaction |
Distance |
Energy (kcal/mol) |
o-Coumaric acid |
‒11.18 |
THR 196 / H-donor |
2.69 |
‒2.7 |
|
|
ILE 194 / pi-H |
4.25 |
‒0.7 |
|
|
ALA 144/pi-H |
4.46 |
‒0.6 |
p-Coumaric acid |
‒9.2 |
THR 196 /H-donor |
2.79 |
‒2.5 |
|
|
PHE 149 /H-pi |
4.36 |
‒0.6 |
|
|
GLY 14 /pi-H |
3.72 |
‒0.7 |
|
|
ILE 194 /pi-H |
4.57 |
‒0.8 |
|
|
ILE 194 /pi-H |
4.19 |
‒0.8 |
Pyrogallol |
‒11.02 |
THR 196 /H-donor |
2.76 |
‒2.6 |
|
|
PHE 149/ H-pi |
4.35 |
‒0.5 |
|
|
GLY 14/pi-H |
3.72 |
‒0.7 |
|
|
ILE 194/pi-H |
4.48 |
‒1 |
|
|
ELI 194/pi-H |
4.15 |
‒0.8 |
Quercetin |
‒15.14 |
GLY14 /H-donor |
3.45 |
‒0.8 |
|
|
SER347/H-donor |
2.95 |
‒1.5 |
|
|
LEU257/pi-H |
3..43 |
‒5 |
Rosmarinic acid |
‒16.15 |
THR196 /H-donor |
2.71 |
‒2.7 |
|
|
PRO 193/pi-H |
4.58 |
‒0.6 |
|
|
ILE 194 /pi-H |
4.31 |
‒0.7 |
|
|
ILE 194 /pi-H |
4.51 |
‒0.6 |
Caffeic acid |
‒11.7 |
VAL259/H-acceptor |
3.06 |
‒3.5 |
|
|
GLY260/H-acceptor |
2.95 |
‒1.9 |
|
|
ASN261/H-acceptor |
3.24 |
‒0.9 |
Gallic acid |
‒11.23 |
VAL259/H-acceptor |
3.17 |
‒1.1 |
|
|
THR354/H-acceptor |
3.39 |
‒0.8 |
Hydroxybenzoic acid |
‒9.32 |
VAL259/H-acceptor |
3.1 |
‒0.8 |
|
|
SER347/pi-H |
4.35 |
‒0.7 |
Benzoic acid |
‒6.3 |
THR86/H-donor |
3.03 |
‒1.6 |
BHT* |
‒8.03 |
ND** |
ND |
ND |
Conclusions
This study provides a comprehensive analysis of the chemical composition and antioxidant activity of T. nivea truffle extracts, utilizing various solvents such as petroleum ether, chloroform, and methanol. The results highlight the significant nutritional value of the truffle with 12.64% protein, 6.56% fat, and 5.91% fiber content, emphasizing its potential as a valuable source of essential nutrients. Furthermore, the identification of key bioactive compounds, such as ergosterol, stigmasterol, and beta-sitosterol, reinforces the antioxidant properties of T. nivea truffles, with ergosterol being the most abundant compound (6,377.22 mg/kg), enhancing the truffle’s health benefits. The antioxidant activity of the extracts was evaluated using the DPPH and β-carotene bleaching assays, revealing notable differences in effectiveness among the extracts. The methanol extract demonstrated the strongest antioxidant potential, showing the highest content of total phenolics (106 mg /100g) and flavonoids (71 mg/100g), coupled with the most potent DPPH• inhibition (86.30% at 1,000 μg/mL). This was followed by the chloroform and petroleum ether extracts, which exhibited moderate antioxidant activity, further confirming the influence of phenolic and flavonoid content on antioxidant efficacy. The results suggest that T. nivea truffles, particularly the methanol extract, are promising natural sources of antioxidants. The study also utilized DFT calculations to assess the reactivity and biological activity of phenolic compounds extracted from the truffles. The analysis of HOMO, LUMO, and Eg values indicated that compounds with smaller energy gaps, such as quercetin (Eg = 4.034 eV), exhibited higher reactivity, which correlates with enhanced antioxidant activity. In contrast, compounds with larger energy gaps, like caffeic acid (Eg = 4.148 eV), demonstrated greater stability and lower biological reactivity. Furthermore, QTAIM analysis revealed strong hydrogen bonding and van der Waals interactions in phenolic compounds such as quercetin and pyrogallol, contributing to their biological activity. In contrast, compounds like benzoic acid, with higher Eg values and less favorable interactions, showed reduced antioxidant potential. Molecular docking studies confirmed that phenolic compounds from T. nivea truffles could effectively inhibit xanthine oxidase activity, with rosmarinic acid and quercetin displaying the strongest binding affinities, suggesting their potential as potent antioxidants. These findings provide valuable insights into the bioactivity of T. nivea truffles and suggest their potential applications in both food and pharmaceutical industries. T. nivea truffles represent a promising natural source of bioactive compounds with strong antioxidant properties. The methanol extract, rich in phenolics and flavonoids, demonstrated the highest efficacy, while computational analyses underscored the structure-activity relationship of the identified compounds. These findings contribute to the growing interest in T. nivea truffles for their therapeutic potential in combating oxidative stress-related diseases.
Acknowledgements
The authors would like to express their thanks and appreciation to their departments and colleges/universities.
CRediT Author Statement
S. H. Haiba, H. Kaur, F. E. Ben Mohamed, F. A. Benkhyal, G. Bouzid: Writing – original draft, Visualization, Investigation, Formal analysis, Conceptualization. M. Belaidi: Writing – original draft. S. Ayachi, S. Bufarwa, J.R.-R., R.R.-G:: Writing – original draft, Investigation, Conceptualization. E.A.L.-M.: Investigation, Conceptualization, Validation, Supervision. S. Bogandora: Investigation, Formal analysis. M. B. El Hadj Rhouma Validation, Investigation, Supervision.
References
[1] K Allen and JW Bennett. Tour of truffles: Aromas, aphrodisiacs, adaptogens, and more. Mycobiology 2021; 49(3), 201-212.
[2] S Hakkou, M Sabir and N Machouri. Global diversity and ecology of truffles. CRC Press, London, 2025, p. 3-36.
[3] M Souna, C Tefiani, TM Chaouche, R Azzi, S Habi, A Chaalel and I Souna. The beneficial effects of the Algerian desert truffle Terfezia claveryi Chatin: Chemical profiling and evaluation of the biological properties. Biomass Conversion and Biorefinery 2025; 15, 8379-8402.
[4] S Górska-Jakubowska1, Y Wu, J Turło and B Xu. Critical review on the anti-tumor activity of bioactive compounds from edible and medicinal mushrooms over the last five years. Nutrients 2025; 17(11), 1887.
[5] H Kaddouri, L Ouahmane and A Tounsi. Diversity, ecology and mycorrhizal association of desert truffles in Morocco. CRC Press, London, 2025, p. 152-179.
[6] I Zegnal , A Brenko and J Medak. Mycorrhiza: The importance of this hidden network. South-East European Forestry 2025; 16(2), 257-267.
[7] AN Ediriweera, W Lu, JP Moreno, R Kalamulla, N Mayadunna, A Pelewatta, G Dissanayake, I Maduwanthi, M Wijesooriya, DQ Dai, N Yapa and S Tibpromma. Ectomycorrhizal fungal symbiosis on plant nutrient acquisition in tropical ecosystems. New Zealand Journal of Botany 2025; 63(5), 1871-1894.
[8] L Huang, S Wan, Y Liu, J Zhan, F Zhang, H Yang, F Zhang, X Xie, X Shi, Y Wang and F Yu. Tuber indicum colonization enhances plant drought tolerance by modifying physiological, rhizosphere metabolic and bacterial community responses in Pinus armandii. Frontiers in Plant Science 2025; 16, 1642071.
[9] GA Flores, G Cusumano, G Zengin, R Venanzoni and P Angelini. Fungal biomolecules for food and pharmaceutical application. eFood 2025; 6(1), 70033.
[10] VR Laganà, F Lombardi, D Di Gregorio and A Nicolosi. Consumption preferences for truffles and truffle-based products: An application of the PLS-SEM model. Sustainability 2024; 16(12), 5002.
[11] S Baldelli, G Aiello1, A De Bruno, S Castelli, M Lombardo, V Stocchi and G Tripodi. Bioactive compounds and antioxidant potential of truffles: A comprehensive review. Antioxidants 2025; 14(11), 1341.
[12] HAE Enshasy, RA Karim, IB Mohamed, M Nurjayadi, D Sukmawati and T Peng. Truffle products from food to pharmaceutical industries. CRC Press, London, 2025, p. 360-376.
[13] N Dedhia. Industrial perspectives on truffles and their products. CRC Press, London, 2025, p. 344-359.
[14] Irum, MZ Haider, Q Ali, AA Simair, A Shaheen, N Sultan and MG Zafar. Mushroom fusion: Blending science and nature for aesthetic marvels. Springer, Switzerland, 2025, p. 201-218.
[15] SM Badalyan and A Zambonelli. The potential of mushrooms in developing healthy food and biotech products. Springer, Switzerland, 2023, p. 307-344.
[16] MG Bumbu, M Niculae, I Ielciu, D Hanganu, I Oniga, D Benedec, MA Nechita, VI Nechita and I Marcus. Comprehensive review of functional and nutraceutical properties of Craterellus cornucopioides (L.) Pers. Nutrients 2024; 16(6), 831.
[17] S Jamali. Unveiling global trends and implications: A bibliometric analysis of research on desert truffles. CRC Press, London, 2025, p. 37-49.
[18] S Aouali. Desert truffles: An appraisal. CRC Press, London, 2025, p. 50-67.
[19] I Ferreira, T Dias, AM Mouazen and C Cruz. Using science and technology to unveil the hidden delicacy Terfezia arenaria, a desert truffle. Foods 2023; 12(19), 3527.
[20] B Laurent, B Marticorena, G Bergametti, JF Léon and NM Mahowald. Modeling mineral dust emissions from the Sahara desert using new surface properties and soil database. Journal of Geophysical Research: Atmospheres 2008; 113, 14218.
[21] S Noor, MN Begum, SR Rony, AA Chowdhury, MH Sohrab and MA Mazid. Bioactivity and chemical screening of endophytic fungi associated with seaweeds Gracilaria sp. and Sargassum sp. of the Bay of Bengal, Bangladesh. Scientific Reports 2025; 15, 16121.
[22] L Anchundia, FJ Piedra, JAM Alcívar, VS Mendoza, DIV Guerrero, SNG Intriago, WAG Muñoz, GLR Pérez, RL Alava, OB Delgado and CJ Piedra. Effect of Ph on the physicochemical properties of a cassava peel starch biopolymer. Cellular Physiology and Biochemistry 2025; 59, 21-33.
[23] BJ Younis, KR Abdalla, NN Wasman and SO Ali. Physiochemical composition and sensory properties of zahidi date seed coffee and their utilization as antidiabetics. International Journal of Environmental Sciences 2025; 11(1), 590-599.
[24] FEA Ruiz, JFO Jácome, JR Mora, AC Landázuri, PV Duchicela, JV Espinoza, P Beltrán-Ayala, MJ Andrade-Cuvi and JM Alvarez-Suarez. Comprehensive characterization and valorization potential of Amazonian Sacha inchi (Plukenetia volubilis L.) seeds, oil, and oilcake by-products for sustainable food applications. Frontiers in Nutrition 2025; 12, 1597300.
[25] CR Marques, C Sousa, C Moutinho, C Matos and AF Vinha. Characterization of dietary constituents, phytochemicals, and antioxidant capacity of Carpobrotus edulis Fruit: Potential application in nutrition. Applied Sciences 2025; 15(10), 5599.
[26] KK Mokwena, G Bultosa, E Seifu, J Gwamba and T Khumoetsile. Nutritional profile and bioactive contents of Englerophytum magalismontanum fruits from Botswana. Measurement: Food 2025; 19, 100232.
[27] E Demiray, A Gerbağa, SE Karatay and G Dönmez. Sequential anthocyanin extraction and ethanol production from eggplant peel through biorefinery approach. Bioenergy Research 2024; 17, 383-391.
[28] E Leonarski, M Kuasnei, EH dos Santos, L Benvenutti, PAD Moraes, K Cesca, D de Oliveira and AAF Zielinski. Ultrasound and microwave-assisted extractions as green and efficient approaches to recover anthocyanin from black rice bran. Biomass Conversion and Biorefinery 2025; 15, 7251-7264.
[29] AA Belew and SH Gebre. Comparative assessment of phenolic and flavonoid contents and antioxidant activities in methanol extracts of spices from Jigjiga market, Ethiopia. Pharmacological Research-Natural Products 2025; 6, 100168.
[30] A Indira, B Joshi, B Shahar, N Kalyan and N Chongtham. Nutritional impact of processing techniques on vitamins and minerals in Bambusa nutans shoots. Journal of Food Measurement and Characterization 2024; 18, 9819-9830.
[31] Z Du, D Liu, H Li, J Li, D Shi, L Gu, L Xu, W Pan and L Ao. Recovery of iron phosphate from secondary sludge by ascorbic and citric acids. Journal of Environmental Chemical Engineering 2024; 12(1), 111917.
[32] M Kawahara, K Danchana and T Kaneta. Microfluidic paper-based analytical devices for antioxidant vitamins C and E in foods. Talanta 2026; 297, 128540.
[33] AR Choirunnisa, K Ruslan, D Rizaldy, H Pramastya, R Hartati, M Insanu and I Fidrianny. Comparative studies of antioxidant capacity of Various solanum sp. extracts by five different antioxidant assays. Pharmaceutical Science: New Insights and Developments 2025; 3, 104-121.
[34] BI Manigo. Quality-based assessment of natural ripening agents as alternatives to calcium carbide in ‘Latundan’ banana using mixed statistical methods. ASEAN Journal of Scientific and Technological Reports 2026; 29(1), 259605.
[35] SA Soomro, ZA Soomro, MA Chahwan, AQ Majeedano, AMA la Memon, MU Rahman, TH Shah, AA Khoso, AA Jamali, AA Shar and A Ismail. Correlation and regression analyses for yield and yield related traits in spring wheat (Triticum aestivum L.). Planta Animalia 2025; 4(5), 257-267.
[36] Mansi, P Khanna, D Gupta, S Yadav and L Khanna. Hydrotrope assisted green synthesis of dicoumarols and in silico and in vitro antibacterial, antioxidant and xanthine oxidase inhibition studies. Journal of Biomolecular Structure and Dynamics 2023; 41(19), 9651-9665.
[37] H Hasan, AMA Almabruk, M Belaidi and S Bufarwa. Dieckol from brown algae targeting the Hepatocellular Carcinoma pathway: A computational pharmacology study. Pharmacological Research-Reports 2025; 4, 100064.
[38] B Mustapha, T Noureddine, D Mohammed, S Bufarwa and DK Thbayh. Computational approach: 3D-QSAR, molecular docking, molecular dynamics simulation investigations, drug-like-ness, and DFT score evaluation of a potential novel and retrosynthesis of some TR-H derivatives as Streptococcus pneumoniae drug. Karbala International Journal of Modern Science 2025; 11, 328-339.
[39] AA Basha, A Kubaib and M Azam. Exploring the antiviral potency of γ-FP and PA compounds: Electronic characterization, non-covalent interaction analysis and docking profiling with emphasis on QTAIM aspects. Computational and Theoretical Chemistry 2024; 1231, 114412.
[40] LM Abbass, M Belaidi, SM Bufarwa and SA Sadeek. Exploring the anti-colon cancer potential of febuxostat-based mixed metal complexes with 2, 2′-bipyridine: MTT assay, toxicity evaluation, prediction profiles, and computational studies. Inorganic Chemistry Communications 2025; 178(1), 114460.
[41] S Yadav, Mansi, N Misra, P Khanna and L Khanna. Novel 10, 11-dihydro-5H-dibenzo [b,f] azepine triazoles hybrids: Synthesis, in vitro antioxidant activity and xanthine oxidase inhibition and computational study. Journal of Molecular Structure 2024; 1312(1), 138639.
[42] A Hamza, H Jdir and N Zouari. Nutritional, antioxidant and antibacterial properties of Tirmania nivea, a wild edible desert truffle from Tunisia arid zone. Medicinal & Aromatic Plants 2016; 5(4), 1000258.
[43] H Gouzi, M Leboukh and E Bouchouka. Antioxidant and antiradical properties of methanolic extracts from Algerian wild edible desert truffles (Terfezia and Tirmania, Ascomycetes). International Journal of Medicinal Mushrooms 2013; 15(5), 471-486.
[44] SZ Hanapi, D Sukmawati, M Nurjayadi, FHS Hussain and HAE Enshasy. Desert truffles: A potential bioresource for bioactive compounds of medicinal value. CRC Press, London, 2025, p. 255-267.
[45] M Martínez-Tomé, A Vera, A Morte, A Gutierrez, M Honrubia and AM Jiménez. Effect of industrial processing on desert truffles Terfezia claveryi Chatin and Picoa juniperi Vittadini): Proximate composition and fatty acids. Journal of the Science of Food and Agriculture 2003; 83(6), 535-541.
[46] AAA Al-Laith. Antioxidant components and antioxidant/antiradical activities of desert truffle (Tirmania nivea) from various Middle Eastern origins. Journal of Food Composition and Analysis 2010; 23(1), 15-22.
[47] M Akyüz and S. Kırbağ. The medicinal properties of truffles. CRC Press, London, 2025, p. 209-241.
[48] DB Said, RB Ali, E Nouiri, MB Hammami, MV Elmay and SE Aidli. Therapeutic effects of edible desert truffle specie (Tirmania nivea) on hepatogastric toxicity induced by aspirin treatment in Rats. Journal of Medicinal Food 2025; 28(6), 595-602.
[49] N Ghanney, LB Yahia, H Hlel and K Nagaz. Nutraceutical assessment of Terfezia boudieri and Tirmania nivea from arid Tunisian ecosystems. SSRN 2025. https://doi.org/10.2139/ssrn.5254025
[50] C Dima, E Assadpour, A Nechifor, S Dima, Y Li and SM Jafari. Oral bioavailability of bioactive compounds; modulating factors, in vitro analysis methods, and enhancing strategies. Critical Reviews in Food Science and Nutrition 2024; 64(24), 8501-8539.
[51] RS Molkabadi, K Ghasemi, MAT Ghanbary and H Moradi. Evaluation of nutritional value and dietary chemicals of winter truffles (Tuber brumale) from north of Iran. Mycologia Iranica 2021; 8(1), 43-57.
[52] NP Arslan, P Dawar, S Albayrak, M Doymus, F Azad, N Esim and M Taskin. Fungi-derived natural antioxidants. Critical Reviews in Food Science and Nutrition 2025; 65(9), 1593-1616.
[53] L Arivarasu. In-vitro antioxidant potential of beta-sitosterol: A preface. Cureus 2023; 15(9), 45617.
[54] A Kiss, VA Papp, A Pál, J Prokisch, S Mirani, BE Toth and T Alshaal. Comparative study on antioxidant capacity of diverse food matrices: Applicability, suitability and inter-correlation of multiple assays to assess polyphenol and antioxidant status. Antioxidants 2025; 14(3), 317.
[55] MA Ghani, C Barril, DR Bedgood and PD Prenzler. Development of a method suitable for high-throughput screening to measure antioxidant activity in a linoleic acid emulsion. Antioxidants 2019; 8(9), 366.
[56] A Hamza, N Zouari, S Zouari, H Jdir, S Zaidi, M Gtari and M Neffati. Nutraceutical potential, antioxidant and antibacterial activities of Terfezia boudieri Chatin, a wild edible desert truffle from Tunisia arid zone. Arabian Journal of Chemistry 2016; 9(3), 383-389.
[57] I Gutiérrez-del-Río, S López-Ibáñez, P Magadán-Corpas, L Fernández-Calleja, Á Pérez-Valero, M Tuñón-Granda, EM Miguélezl, CJ Villar and F Lombó. Terpenoids and polyphenols as natural antioxidant agents in food preservation. Antioxidants 2021; 10(8), 1264.
[58] VP Veeraraghavan, S Hussain, JP Balakrishna, L Dhawale, M Kullappan, JM Ambrose and SK Mohan. A comprehensive and critical review on ethnopharmacological importance of desert truffles: Terfezia claveryi, Terfezia boudieri, and Tirmania nivea. Food Reviews International 2022; 38(1), 846-865.
[59] A Maalej, IDB Moussa, F Karray, M Chamkha and S Sayadi. Olive oil by-product’s contribution to the recovery of phenolic compounds from microalgal biomass: Biochemical characterization, anti-melanogenesis potential, and neuroprotective effect. Biomass Conversion and Biorefinery 2024; 14, 4299-4311.
[60] AA Zaghlul, HM Hamad, A Rashed, A ABD El_Gawad, D Alardan, A Alshammari, N Al-Harbi, K Abdelaal and MA Yassin. Antioxidant properties and chemical composition of white truffle Tirmania nivea and its host plant Helianthemum lippii. Notulae Botanicae Horti Agrobotanici Cluj-Napoca 2024; 52(4), 14176.
[61] M Creydt and M Fischer. Food profiling: Progress in ensuring the authenticity of truffle species and their geographical origin. Current Opinion in Food Science 2024; 57, 101171.
[62] N Chaachouay. Synergy, additive effects, and antagonism of drugs with plant bioactive compounds. Drugs and Drug Candidates 2025; 4(1), 4.
[63] MM Rahaman, R Hossain, J Herrera-Bravo, MT Islam, O Atolani, OS Adeyemi, OA Owolodun, L Kambizi, SD Daştan, D Calina and J Sharifi-Rad. Natural antioxidants from some fruits, seeds, foods, natural products, and associated health benefits: An update. Food Science & Nutrition 2023; 11(4), 1657-1670.
[64] F Ali, S Bibi, M Belaidi, SM Bufarwa, A Ashraf, H Fatima, GM Albadrani, MQ Al-Ghadi, R Altalhi and MM Abdel-Daim. Pharmacophore-based discovery of licoisoflavanone as a dual CXCR4/CXCR7 inhibitor for coronary artery disease: Integration of traditional chinese medicine and modern computational approaches. Journal of Computational Biophysics and Chemistry 2025. https://doi.org/10.1142/S2737416525501236
[65] T Mall, P Prasher, M Loncón-Pavez, S Morales-Guerrero, M Sharma, Y Duarte and FC Zacconi. Molecular docking, molecular dynamics simulation, and ADME profiling of novel benzoxazolone-based OGT inhibitors. In Silico Pharmacology 2025; 13(3), 134.
Supplementary Material
Evaluation of extraction techniques, chemical composition, antioxidant properties, computational modelling, and biological insights of the novel Truffle species (Termania Nivea) for enhanced human health benefits.
chloroform e
Scheme S1 Schematic diagram showing the direct solvent extraction (petroleum ether-chloroform-methanol) of T.Nivea.
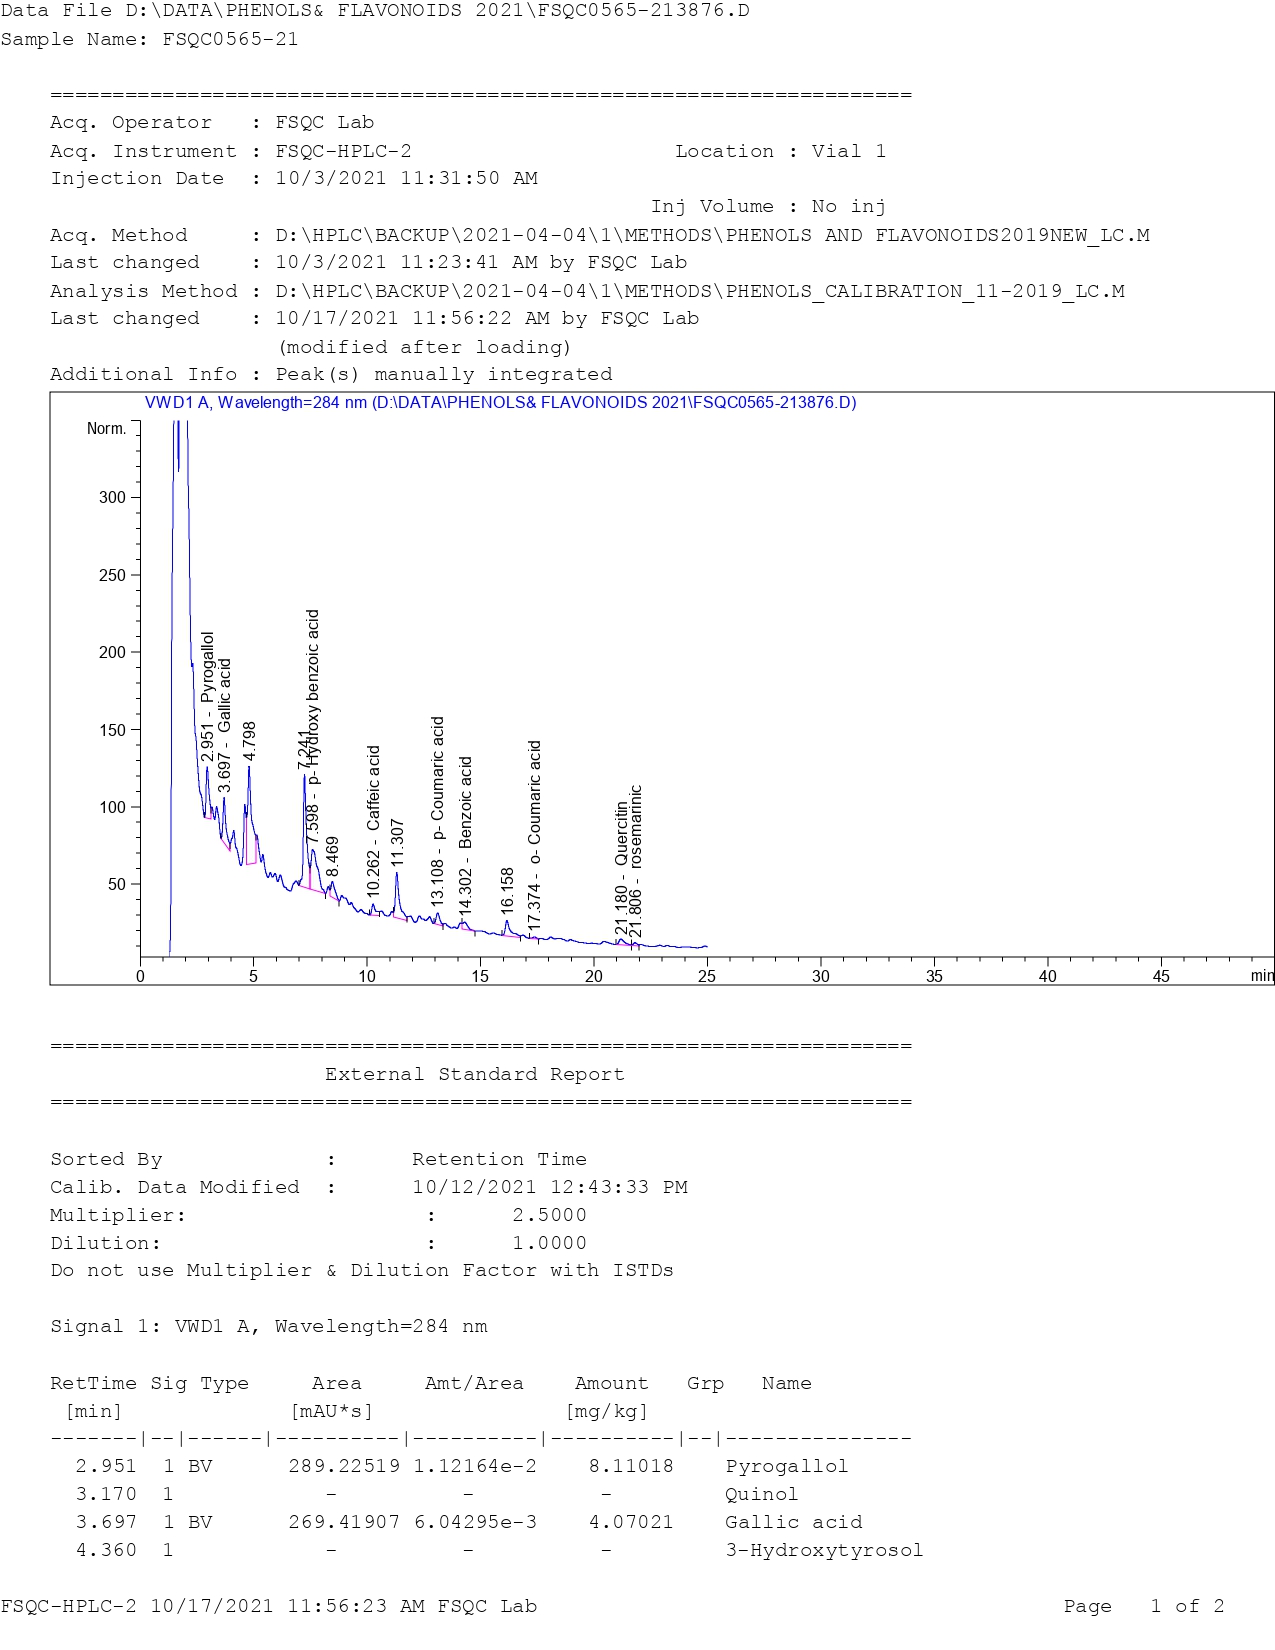
Figure S1 shows the chromatogram of phenolics and flavonoids separated by HPLC in dried truffles.
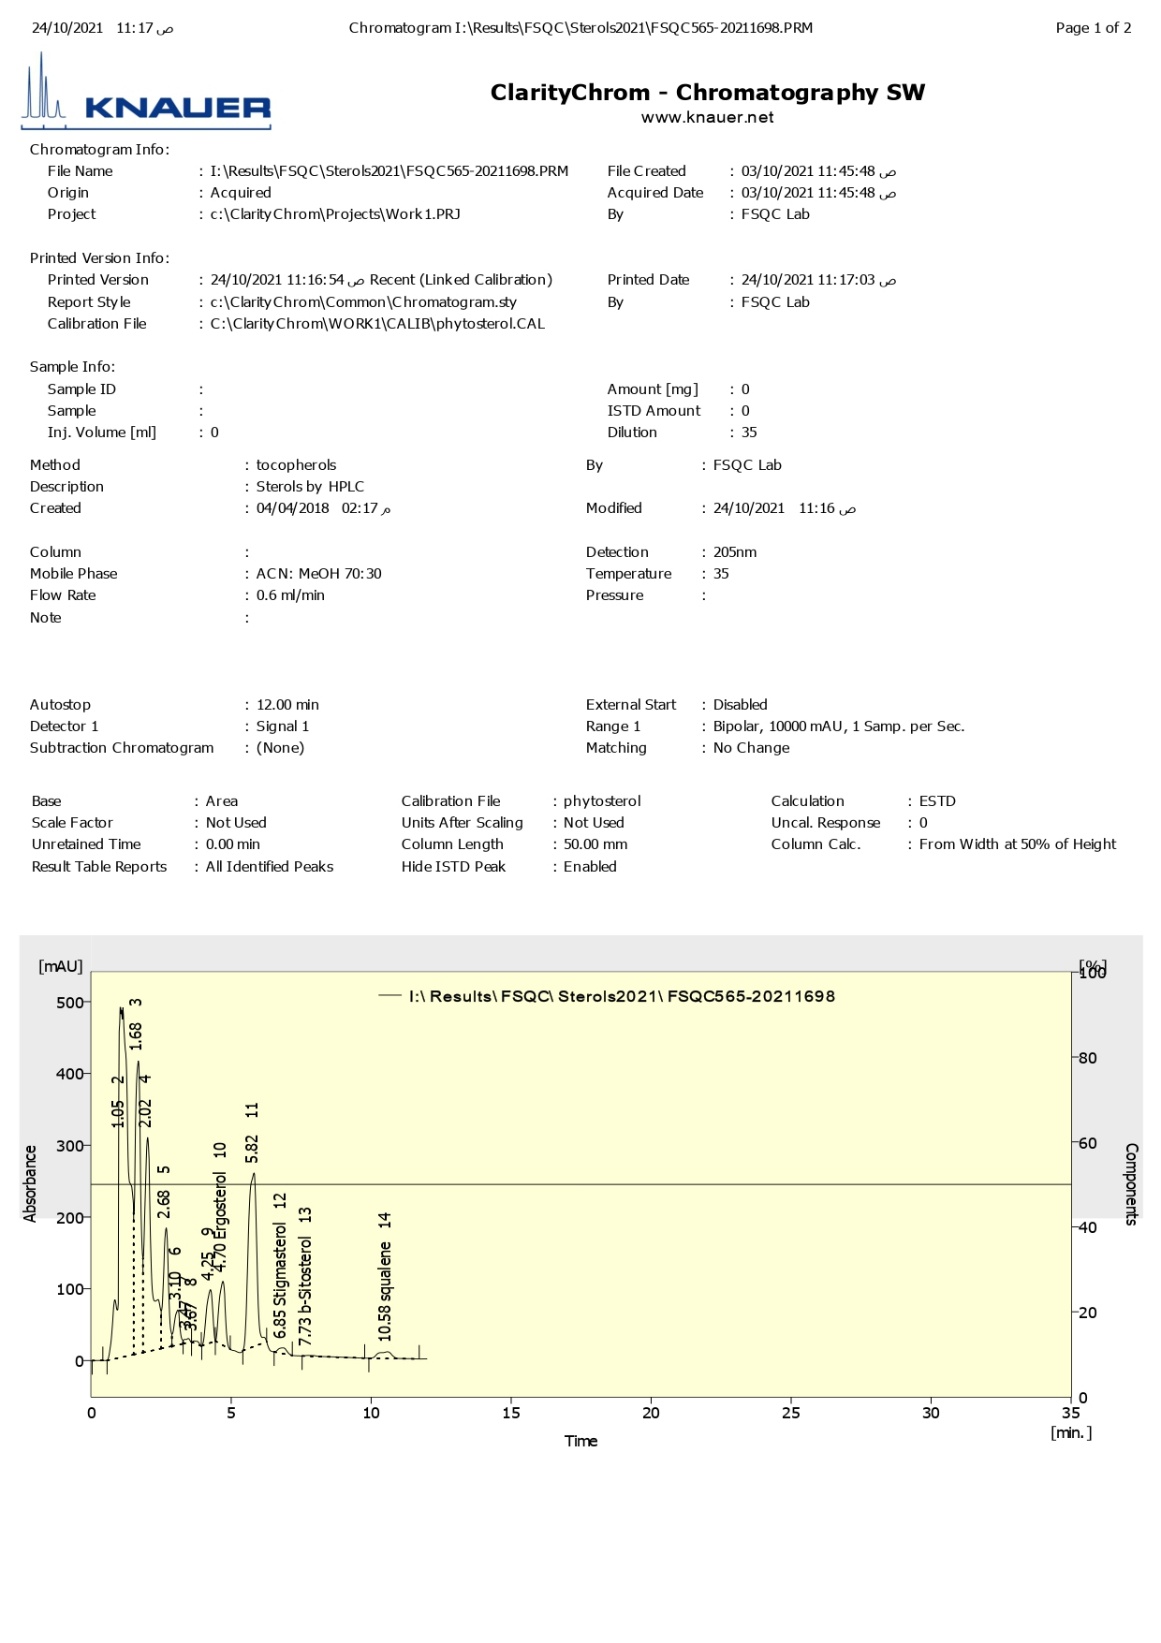
Figure S2 shows the chromatogram of sterols separated by HPLC.
|
|
|
|
|
|
|
|
|
|
|
|
|
|
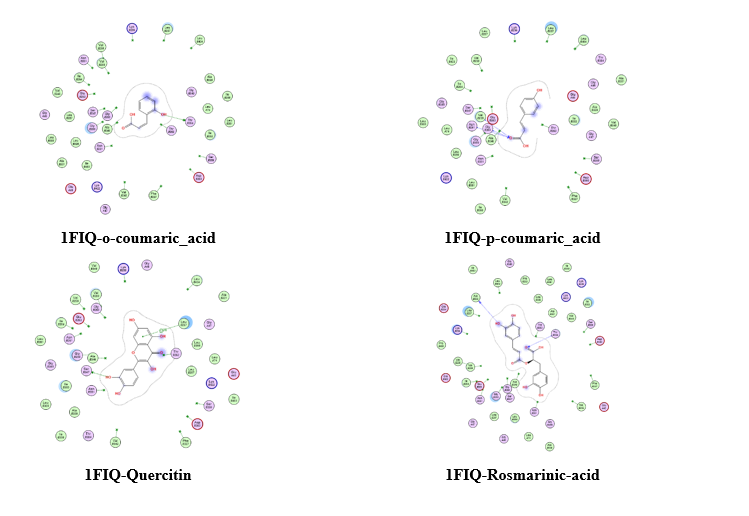
Figure S3 2D diagram of current 1FIQ-compiunds.
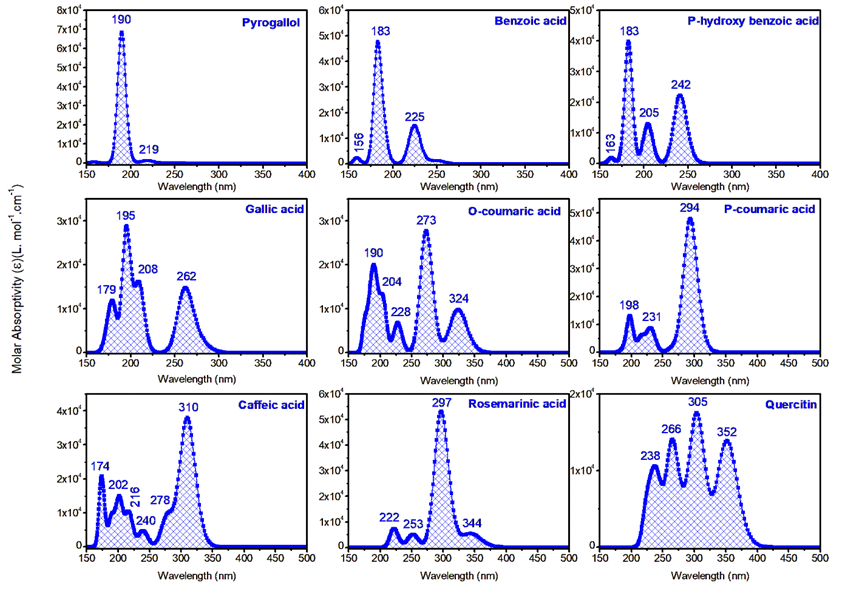
Figure S4 Simulated UV-Vis optical spectra of the nine studied compounds, obtained at DFT//B3LYP/6-311G(d,p) level of theory.