Trends
Sci.
2026;
23(7):
12900
Low-Cost Activated Carbon from Cassava Rhizome Waste via Hydrothermal Method for Methylene Blue and Community Wastewater Treatment: Isotherm and Kinetic Studies
Natkrita
Prasoetsopha1,
![]() ,
Witawat Singsang2,
,
Witawat Singsang2,
![]() ,
Prasit Thongbai3,
,
Prasit Thongbai3,
![]() ,
,
Atiwat
Wiriya-Amornchai4,
![]() ,
Vitsanusat Atyotha5,
,
Vitsanusat Atyotha5,
![]() and Ing-orn Sittitanadol6,*
and Ing-orn Sittitanadol6,*
1Department of Materials and Medical Technology Engineering, Faculty of Engineering and Technology,
Rajamangala University of Technology Isan, Nakhon Ratchasima 30000, Thailand
2Department of Production Engineering and Quality Management, Faculty of Industrial Technology,
Rambhai Barni Rajabhat University, Chanthaburi 22000, Thailand
3Giant Dielectric and Computational Design Research Group (GD-CDR), Department of Physics,
Faculty of Science, Khon Kaen University, Khon Kaen 40002, Thailand
4Department of Materials and Processing Technology, Faculty of Engineering and Technology,
King Mongkut’s University of Technology North Bangkok, Rayong campus, Rayong 21120, Thailand
5Department of Applied Physics, Faculty of Engineering, Rajamangala University of Technology Isan,
Khon Kaen Campus, Khon Kaen 40000, Thailand
6Department of Metallurgical Engineering, Faculty of Engineering, Rajamangala University of Technology Isan,
Khon Kaen Campus, Khon Kaen 40000, Thailand
(*Corresponding author’s e-mail: [email protected])
Received: 5 December 2025, Revised: 22 December 2025, Accepted: 5 January 2026, Published: 15 March 2026
Abstract
Current pollution of natural water sources led to the utilization of agricultural waste, such as cassava rhizome, for conversion into activated carbon in order to reduce waste, promote a circular economy, and enhance the absorption of pollutants, particularly dyes, in wastewater treatment. In this study, the activated carbon was prepared through a hydrothermal process and potassium hydroxide (KOH) activation at 1:1, 1:2, and 1:3 ratios. The resulting activated carbon exhibited increased porosity, smaller pore sizes, and a higher surface area compared to cassava rhizome biochar, especially at a KOH 1:2 ratio. The surface area reached 42.68 m²/g. In the methylene blue adsorption test, the activated carbon showed better adsorption efficiency than cassava rhizome biochar, achieving a maximum removal percentage of 98.35%. Moreover, the results were consistent with the Langmuir adsorption model, with maximum adsorption capacities of 16.08, 81.97, 100, and 96.15 mg/g for biochar and activated carbon prepared with KOH at the respective ratios of 1:1, 1:2, and 1:3, respectively. The kinetic adsorption study aligned with pseudo-second-order kinetic modeling, suggesting that chemisorption may contribute to the adsorption process. In addition, when activated carbon and cassava rhizome biochar are used for natural wastewater treatment, the oxidation-reduction potential (ORP) and dissolved oxygen (DO) are enhanced, which suggests activated carbon and cassava rhizome biochar could effectively be used in real-world applications.
Keywords: Cassava rhizome, Activated carbon, Methylene blue, Wastewater, Hydrothermal
Introduction
Nowadays, household wastewater poses significant environmental issues, particularly in rapidly growing areas. Medium-sized factories located near residential communities, such as food processing and textile dyeing operations, and small-sized factories also contribute to this problem by releasing wastewater into canals, lakes, or rivers. This wastewater frequently contains organic compounds, dyes, and various chemicals such as methylene blue. These substances are stable, difficult to degrade, and can accumulate in living organisms [1]. Without proper treatment, wastewater can harm natural water sources, ecosystems, and human health over time.
Wastewater treatment methods such as physico-chemical treatment [2], enzymatic treatment [3], coagulation [4], flocculation [5], electrochemical degradation [6], filtration [7], photocatalytic degradation [8], and adsorption [9] . The most widely used one is adsorption, thanks to its efficiency, simplicity, and lower cost compared to other methods [10]. Adsorbents used are such as zeolite [11], clay [12], chitosan [13], polyacrylamide [14], polyurethane [15], carbon nanotubes [16], graphene oxide [17], and activated carbon [18]. Many researchers use natural materials as adsorbents. Akter et al. [19] studied textile dye adsorption using dried banana peel with a particle size of 149 m. The banana peel achieved the maximum adsorption of 28.8 mg/g and removed up to 93% of the dye in standard solution. It also removed up to 84.2% of the dye in natural wastewater. Ramutshatsha-Makhwedzha et al. [20] studied the preparation of activated carbon using orange and lemon peel for pollutant adsorption. The activated carbon absorbed up to 96% of methyl orange and 98% of methylene blue. Moreover, biochar from agricultural produce and leftover biomass, such as crops, sewage sludge, forestry residues, straws, rice husks, coconut husks, corncobs, banana peels, orange peels, and bagasse, is also widely used as adsorbents in wastewater treatment [21]. The efficiency of the biochar depends on many factors, including the type of source material, pyrolysis temperature, and residence time.
The most widely used adsorbent is activated carbon due to its large specific surface area, porosity, and capacity for contaminant adsorption [22]. Physical and chemical activation are the 2 major techniques for activated carbon preparation. In the case of physical activation, carbonaceous source materials (wood or coal) are subjected to carbonization at an elevated temperature under oxygen-free conditions, and then exposure to either steam or carbon dioxide at a high temperature (800 - 1,000 °C) is employed as an activating agent, leading to a porous structure. Yi et al. [23] studied the preparation of activated carbon using spherical phenol resin through a pressurized physical activation process with CO2 as the activating agent under 0.1 MPa pressure and 900 °C temperature to increase surface area and total pore volume. The activated carbon had an average pore size of 1.6 nm and a specific surface area as high as 2,600 m²/g. Similarly, Tsai and Tsai [24] studied the major parameters in the physical activation of Honduras mahogany pod husk using CO2. The best result was achieved when activated under 800 °C for 30 min. BET surface area was increased up to 966 m²/g and total pore volume around 0.43 cm³/g, suitable for adsorption of various natural pollutants. While Shahcheragh et al. [25] studied the comparison between physical activation and chemical activation for preparing the activated carbon from almond shells and palm kernels. The results showed that both processes enhanced surface area and porosity. The physical activation via steam achieved larger and uneven pores, while the chemical activation with phosphoric acid (H₃PO₄) resulted in finer and more even pores. In chemical activation, various chemicals such as phosphoric acid (H₃PO₄), sodium hydroxide (NaOH), potassium hydroxide (KOH), sulfuric acid (H2SO4), zinc chloride (ZnCl2), and other acids are added before carbonization. This method utilized a lower temperature range of 400 and 700 °C to develop a porous structure and improve adsorption. Sujiono et al. [26] studied the preparation of coconut shell-derived activated carbon through chemical activation using many chemical activators, including NaOH, H3PO4, and ZnCl2, to evaluate the efficiency of each activator. NaOH-based activated carbon has the highest surface area of up to 516 m²/g, followed by ZnCl2 and H3PO4, respectively. Zhang et al. [27] studied the preparation of bark waste-derived activated carbon using H3PO4 as the activating agent. The best result was achieved using a 50% concentration of H3PO4 under 500 °C for 90 min. The activated carbon had up to 390.89 m²/g of surface area, 6.0 mL/0.1 g of methylene blue adsorption, and 96.92 mg/g of phenol adsorption. Additionally, Jahin et al. [28]; Mohamed et al. [29] prepared bio-adsorbents from banana peels via chemical activation for the adsorption of heavy metals in wastewater. The bio-adsorbents were able to adsorb Cu(II), Zn(II), Pb(II), and Fe(II) up to 3.2, 2.8, 0.96, and 1.05 mg/g, respectively. Currently, chemical activation is preferred over physical activation due to its simplicity, lower equipment requirements, and reduced heat needs. Moreover, many properties of the activated carbon can also be controlled efficiently, making it suitable for laboratory production.
Hydrothermal activation is a form of chemical activation. In this process, the source material and a chemical agent are mixed together in an airtight environment such as a pressure cooker and heated to temperatures between 150 and 250 °C. The high pressure generated during this heating breaks down the material, resulting in a nanoporous structure. The advantage of this process is control over the structure and specific properties of activated carbon and reduced energy consumption [30]. However, most previous studies have employed hydrothermal treatment only as a pretreatment or supplementary step prior to traditional carbonization, rather than using hydrothermal activation as the primary activation process. According to a study by Prandini et al. [31], the KOH-hydrothermal approach can effectively activate lignite to create porous structures and facilitate the production of activated carbon with substantial porosity. This conclusion is consistent with the preparation of activated carbon derived from sugarcane leaf via the hydrothermal pretreatment method by Tawatbundit and Mopoung [30], which demonstrated that the use of the hydrothermal pretreatment method results in a higher percent yield, increased porosity, and enhanced surface area of activated carbon compared to without the hydrothermal pretreatment. Similarly, a study by Adame-Pereira et al. [32] found that coating activated carbon with carbon from sucrose via the hydrothermal method at 180 °C for 20 h increased its surface area from 1,025.5 to 1,144.5 m²/g. In contrast, the present work applies hydrothermal activation directly as the main activation technique without any subsequent carbonization, enabling pore development under milder conditions, which distinguishes this study from earlier research. However, the high cost of commercial activated carbon has generated interest in activated carbon production using natural resources or agricultural waste as a substitute.
Cassava rhizome is a type of biomass that is particularly attractive for value-added applications. Thailand produces a high amount of cassava rhizome waste that is not being fully utilized. Cassava rhizome contains cellulose, hemicellulose, and lignin, which make it suitable for activated carbon production [33]. Cassava rhizome waste has rarely been explored as a precursor for activated carbon, and its chemical composition and structure differ from other agricultural wastes, resulting in distinct pore development and adsorption behavior. Previous studies have explored the utilization of cassava rhizomes in other fields, including using them as a raw material for producing biofuel briquettes to improve the energy content, specifically the Higher Heating Value (HHV) [34]. Additionally, researchers have investigated cassava rhizomes as precursors for carbon nanomaterials, especially in the adsorption of toluene solutions [35]. While many studies have focused on producing activated carbon from various biomaterials for dye adsorption via high-temperature carbonization or using hydrothermal treatment as a pretreatment step, very few studies have examined the efficiency of activated carbon derived from cassava rhizome through hydrothermal activation for wastewater treatment.
The objectives of this research are to produce activated carbon from cassava rhizomes using hydrothermal methods and to investigate methylene blue adsorption and its use as an absorbent for wastewater treatment in residential areas. Furthermore, this work includes an analysis of adsorption isotherms and kinetics to fully understand adsorption and efficient application.
Materials and methods
Activated carbon preparation
Cassava rhizomes collected from Nakhon Ratchasima Province, Thailand, were processed into biochar according to the method described in previous research [36]. The cassava rhizome biochar (CS), which had a particle size of 53 - 74 µm, was used as a starting material to produce the activated carbon by chemical and hydrothermal activation. The weight ratios of biochar to potassium hydroxide (KOH, AR grade 85%, Kemaus) were set at 1:1, 1:2, and 1:3, which are denoted as AC1:1, AC1:2, and AC1:3, respectively. In this process, a specific amount of KOH was dissolved with 10 mL of deionized water. Subsequently, 1 g of cassava rhizome biochar was incorporated and stirred continuously using a magnetic stirrer for 24 hours. The mixture was then placed into hydrothermal equipment, to which 5 mL of deionized water was added, and it was heated in a hot air oven at 200 °C for 24 h. Following this, the mixture was neutralized with hydrochloric acid (HCl, AR grade 35.4%, Labo Chemie Pvt. Ltd.) until the pH reached 7. Finally, the product underwent vacuum filtration, was washed with deionized water 3 times, and was dried in a hot air oven at 60 °C overnight, as illustrated in Figure 1. After drying, the yield of activated carbon was calculated using Eq. (1) [37].
|
|
where Wf and Wi represent the weight of activated carbon (g) and the weight of cassava rhizome biochar (g), respectively.
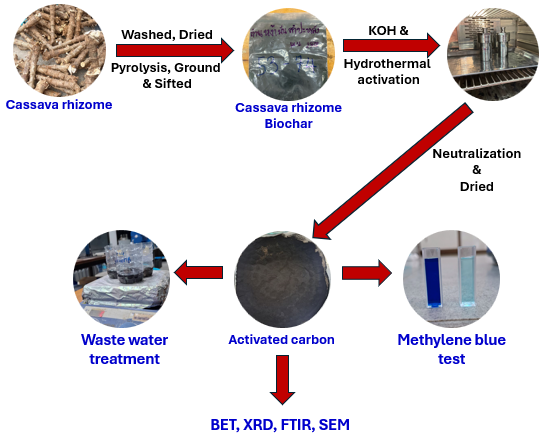
Figure 1 Schematic diagram of activated carbon preparation from cassava rhizome and its characterization and adsorption testing process.
Activated carbon characterization
The activated carbon was analyzed for its morphological and chemical composition using a scanning electron microscope (SEM, SEM-EDS-JEOL/JSM-6010LV) coupled with energy dispersive spectroscopy (EDS). Additionally, the specific surface area and total pore volume were evaluated using a nitrogen adsorption Brunauer-Emmett-Teller analysis (BET, Micrometrics 3Flex, Version 5.02 apparatus), after degassing at 200 °C for 12 h. The particle size was measured using a laser diffraction particle size analyzer (Horiba/LA-950V2). The crystal structure was examined via X-ray diffraction (XRD) using a PANalytical EMPYREA diffractometer in an interval of 10° - 80° with a step size of 0.02°. Surface functional groups were examined using Fourier transform infrared spectroscopy (FTIR, PerkinElmer, Spectrum Two).
Adsorption of methylene blue measurement
The batch method was employed to assess the adsorption of methylene blue (MB, Nice Chemical Pvt., Ltd., M.W. = 373.90 g/mol) in an aqueous solution. For each experiment, approximately 0.025 ± 0.0005 g of adsorbent (cassava rhizome biochar (CS) or activated carbon samples AC1:1, AC1:2, and AC1:3) was added to 50 mL of MB solution at 5 different initial concentrations: 10, 20, 30, 40, and 50 mg/L. The exact mass of each sample was recorded and used for adsorption capacity calculations. The mixture was stirred at 300 rpm in the dark at room temperature for 8 h. The concentration of remaining MB in the solution was measured at a wavelength of 668 nm by using UV-vis spectrophotometry (Jasco V530). The equilibrium adsorption capacity (Qe, mg/g) and removal percentage were calculated using Eqs. (2) and (3) [38], respectively.
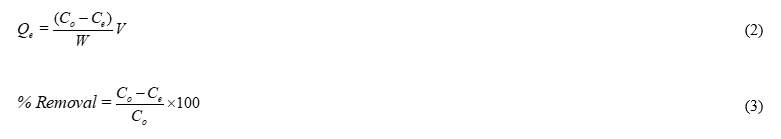
where Co and Ce represent the concentrations of MB solution (mg/L) at initial and equilibrium, respectively. V represents the volume of MB solution (L), while W denotes the weight of the adsorbent (g).
The adsorption kinetics and adsorption isotherms were evaluated also using a batch method, where 0.025 g of adsorbents were added to 50 mL of MB solution at an initial concentration of 30 mg/L, then stirred at 300 rpm in the dark at room temperature, with contact times ranging from 30 to 480 min.
Wastewater treatment measurement
The treatment of wastewater from Bueng Kaen Nakhon, a freshwater lake in Khon Kaen Province, Thailand, was evaluated using biochar and activated carbon in a batch adsorption system. A 0.05 g of adsorbent was added to 100 mL of wastewater and then stirred at room temperature. The oxidation-reduction potential (ORP) and dissolved oxygen (DO) of the water were measured using a Multiparameter Water Quality Meter (HI 9829, HANNA Instruments) at the initial time and every 30 min for 4 h. Each sample was measured in triplicate (n = 3).
Results and discussion
Cassava rhizome activated carbon properties
Figure 2 shows the morphology of cassava rhizome biochar (CS) and activated carbon produced through KOH activation at varying ratios (AC1:1, AC1:2 and AC1:3). The SEM images reveal that the biochar consists of flakes of different sizes and has a compact surface area with low porosity. After KOH activation, a greater degree of surface roughness is evident, and the presence of pores in certain areas corresponds with findings from the study by Prasoetsopha et al. [36]. Such a mechanism can be explained through the reaction between KOH and carbon during the pyrolysis process, which causes an etching effect and emission of gases such as CO, CO2, and H2, resulting in the opening of the surface area and development of a porous structure, including an increase in the specific surface area of the activated carbon [39]. Furthermore, the particle size of the activated carbon decreases with the addition of more KOH, as observed from the SEM images. At AC1:1 (Figure 2(b)), the particle size is smaller than that of CS, but distinct pores have yet to form. By AC1:2 (Figure 2(c)), the particle size continues to decrease, and the number of pores increases. In the case of AC1:3 (Figure 2(d)), the SEM results show a relatively small particle size; however, the particle size analysis using a laser particle size analyzer indicates that AC1:3 is not the smallest but rather smaller than CS and larger than AC1:2, as shown in Table 1. In addition, the porosity decreased compared to AC1:2, possibly due to excessive erosion leading to structure collapse [40]. This observation aligns with the study by Wang et al. [41], which examined the effect of KOH concentration on the characteristics of activated carbon derived from Enteromorpha prolifera. The findings indicate that a higher concentration of KOH affects the activated carbon surface, promoting pore development. However, an excessively high concentration of KOH can lead to a loss of the activated carbon void structure, resulting in surface particles eroding into numerous folds.
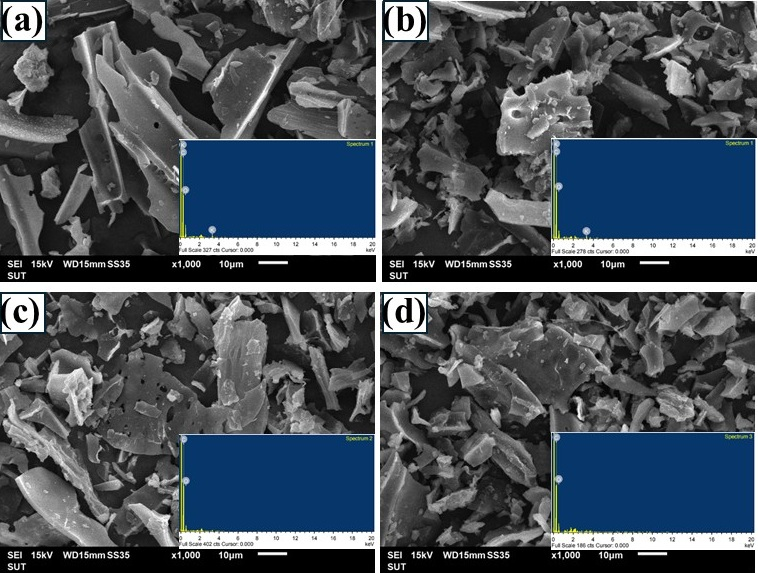
Figure 2 SEM images and corresponding EDS spectra of (a) CS, (b) AC1:1, (c) AC1:2, and (d) AC1:3.
Table 1 Chemical composition of cassava rhizome biochar and its activated carbon.
Sample |
Element content (%) |
Yield (%) |
Particle size ( m) |
||
C |
O |
K |
|||
CS |
75.16 |
23.39 |
1.45 |
- |
30.47 |
AC1:1 |
82.18 |
16.01 |
1.80 |
74 |
26.32 |
AC1:2 |
83.32 |
16.68 |
- |
75 |
24.36 |
AC1:3 |
77.91 |
22.09 |
- |
75 |
29.87 |
The chemical constituents of cassava rhizome biochar and activated carbon were analyzed with the EDS analysis method, as presented in Table 1. Biochar (CS) consists primarily of carbon (C) 75%, oxygen (O) 23.39%, and a trace of potassium (K) as the constituent of biochemicals existing in plant biomass. Following KOH activation, the carbon concentration in the activated carbon samples (AC1:1, AC1:2 and AC1:3) exhibited an increase, whereas the oxygen concentration demonstrated a decrease. The observed change results from the partial removal of oxygen-containing functional groups during the activation process [42]. This finding is consistent with the research by Xiao et al. [43], which demonstrated that KOH initially interacts with the oxygenated compounds in biomass, resulting in hydrogen release via a dehydrogenation reaction. Furthermore, the percentage yields of AC1:1, AC1:2, and AC1:3 are approximately 74% - 75%, indicating that the preparation of activated carbon through KOH activation with a hydrothermal process can produce a higher yield when compared to other chemical activation methods. For example, in the study by Hyeon et al. [44], who synthesized activated carbon from ground coffee by KOH activation at 850 °C for 1 h, only 30% - 40% yield was achieved, which signified the superiority of the hydrothermal method in this work.
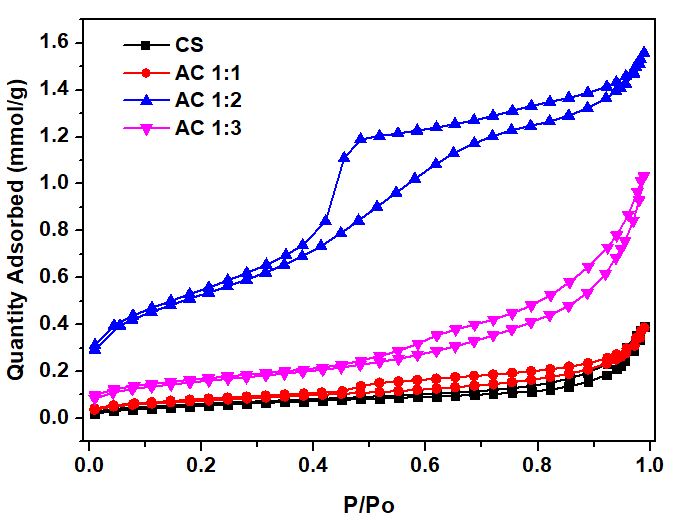
Figure 3 The nitrogen adsorption-desorption isotherm of both cassava rhizome biochar and its activated carbon.
The N2 adsorption-desorption isotherms of biochar from cassava rhizome (CS) and activated carbon from KOH activation at varying ratios (AC1:1, AC1:2 and AC1:3) are shown in Figure 3. The analysis shows that both CS and AC1:1 exhibit a type II isotherm according to IUPAC classification [45], indicating a limited porous structure that is primarily macroporous, characterized by low nitrogen adsorption, a flat isotherm curve, and the absence of a distinct hysteresis loop. Consequently, these results imply a low surface area and an underdeveloped porous structure. In contrast, AC1:2 and AC1:3 display a type IV isotherm, with a clear hysteresis loop observed at approximately P/P₀ ≈ 0.4 - 0.8. This behavior is consistent with the characteristics of material that has medium-sized pores, or mesopores, ranging from 2 to 50 nm [45].
At low P/P₀ (< 0.1), the adsorption of CS and AC1:1 is increased gradually, reflecting a small amount of micropores, while AC1:2 starts to show increased adsorption at P/P₀ ≈ 0.05 - 0.1, suggesting the development of both micropores and mesopores. Moreover, AC1:2 and AC1:3 also have clear hysteresis at P/P₀ ≈ 0.4 - 0.9, confirming the development of mesoporosity in the activated carbon structure [46].
Table 2 Specific surface area from MB adsorption capacity (SMB), specific surface area (SBET), total pore volume, and pore size distribution of cassava rhizome biochar and its activated carbon.
Sample
|
SMB (m2/g) |
SBET (m2/g) |
Total pore volume (cm3/g) |
Pore size distribution (nm) |
CS |
42 |
4.86 |
0.0136 |
11.65 |
AC1:1 |
236 |
6.23 |
0.0130 |
9.53 |
AC1:2 |
287 |
42.68 |
0.0526 |
4.91 |
AC1:3 |
266 |
12.74 |
0.0353 |
11.69 |
The BET surface area of CS is 4.86 m²/g when activated with KOH and increases significantly as more KOH is used (Table 2), especially in the AC1:2 sample, in which the BET surface area is 42.68 m²/g, representing a substantial increase of 778.19% compared to CS. However, the BET surface area decreases in the AC1:3 sample, likely due to over-etching that causes pore collapse, which in turn reduces the surface area [41]. In comparison with the study by Prasoetsopha et al. [36], who prepared the activated carbon from cassava rhizomes through chemical activation with microwaves and achieved only 17.62 m²/g of BET surface area, and the work of Sawasdee and Watcharabundit [47], who reported a BET surface area of only 19.7 m²/g for H₃PO₄-activated cassava rhizome at 500 °C. This result may indicate that the intrinsic structure of cassava rhizome limits the development of microporosity during chemical activation, and the KOH activation using hydrothermal in the current research, particularly at a 1:2 ratio, is more effective in developing a porous structure.
The total pore volume and pore size distribution of CS are 0.0136 cm³/g and 11.65 nm, respectively. When compared to the activated samples, the total pore volume of AC1:2, which has the highest surface area, is increased, while the average pore size is down, corresponding with the N₂ adsorption-desorption isotherm graph (Figure 3). The experiment shows that a 1:2 KOH activation ratio is best for developing the porous structure of activated carbon. The balance between micropores and mesopores maximizes the BET surface area and total pore volume, ideal for application as an adsorbent [48].
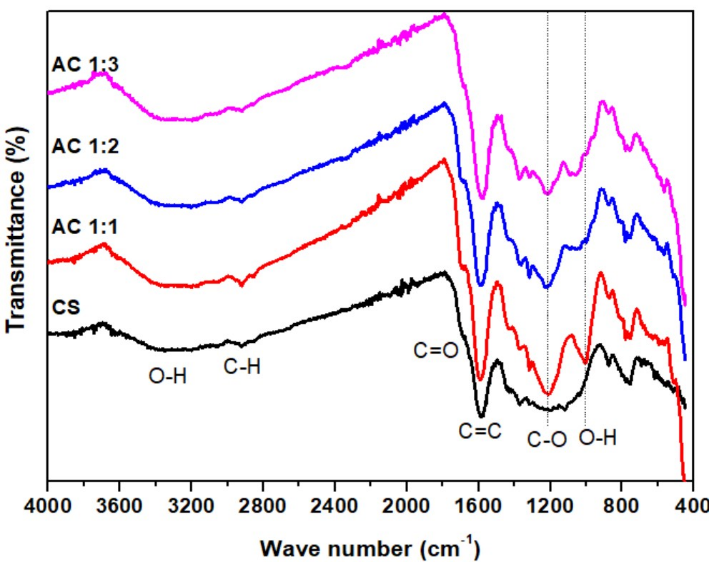
Figure 4 FTIR of cassava rhizome biochar and its activated carbon.
Figure 4 illustrates FTIR spectra of CS, AC1:1, AC1:2, and AC1:3. All samples had absorption bands in 3,100 - 3,600 cm⁻¹, corresponding to O-H stretching vibration, indicating hydroxyl functionalities on the surface. Further, a peak at 2,920 cm⁻¹ is associated with C-H stretching vibrations of aliphatic hydrocarbons [30]. The strong band at 1,700 cm⁻¹ is associated with C=O stretching of carboxylic groups in hemicelluloses [30], and a band at 1,560 cm⁻¹ is associated with C=C stretching or carbon-oxygen bond vibrations [39].
For activated carbons (AC1:1, AC1:2, AC1:3), additional bands appeared at 1,240 and 1,080 cm⁻¹, corresponding to C-O stretching vibrations in phenols, ethers, alcohols, or O-H bending vibration, suggesting a surface modification after KOH activation [41,49]. These are characteristic bands signifying a high quantity of oxygen-functional groups available over activated carbon’s surface, playing an essential role in enhancing material adsorption performance.
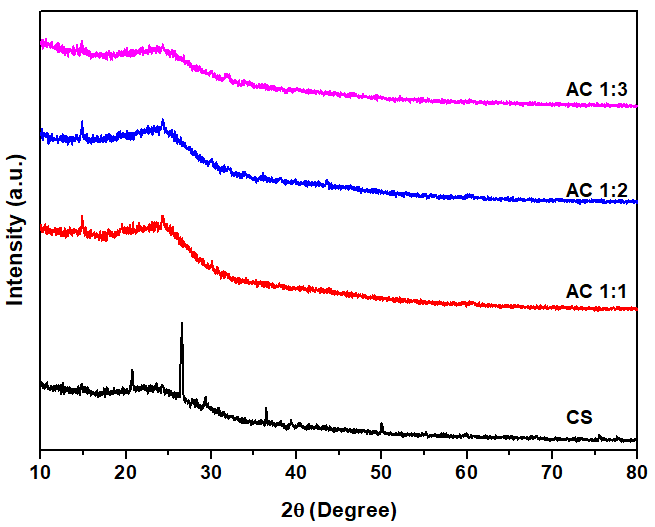
The XRD patterns of CS, AC1:1, AC1:2, and AC1:3 are illustrated in Figure 5. For the CS sample, a peak was observed at 2θ = 26°, which can be attributed to the presence of inorganic impurities, such as silica (SiO₂), which is present in the biomass carbon matrix [42]. After KOH activation, this peak disappeared, suggesting that the impurity was effectively removed during the KOH processing. This finding aligns with previous research by Barakat et al. [50], in which they found that activation of rice husk with KOH reduced a peak assignable to silica or other inorganic impurities. The result is because KOH interacts with silica to produce soluble potassium silicate, which effectively decreases the peak intensity at 2θ ≈ 26° and promotes the development of a highly porous activated carbon structure.
For all activated carbon samples, broad peaks were observed in the range of 22° - 25°, corresponding to the (002) plane of graphitic carbon [49]. The presence of these broad peaks suggests an amorphous carbon structure with a high degree of disorder [10]. Furthermore, the intensity of the (002) peak decreased with increasing amounts of KOH used for activation, indicating the generation of greater structural disorder, which also corresponds to the formation of porous structures after activation. This finding is consistent with the work of Nandi et al. [51], who indicated that KOH-activated carbon derived from rice husks exhibited a decrease in intensity of the C (002) peak with increasing KOH concentration.
Adsorption of methylene blue
The calibration curve of the methylene blue solution was constructed using 6 concentrations. The curve illustrates the relationship between absorbance and concentration, as shown in Figure 6. The absorbance increases with increasing methylene blue concentration. This calibration curve was used to determine the residual methylene blue concentration after adsorption experiments.
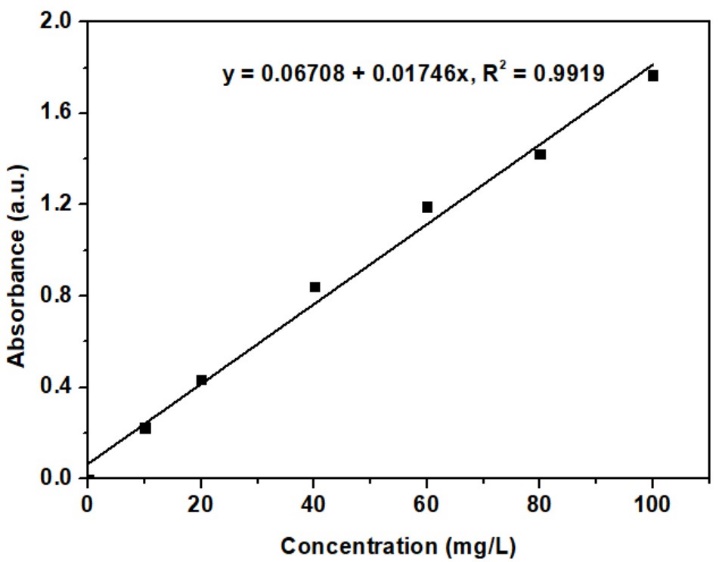
Figure 6 Calibration curve for methylene blue solution.
The adsorption efficiency of methylene blue (MB) over time for CS, AC1:1, AC1:2, and AC1:3 at an initial concentration of 30 mg/L is shown in Figure 7. The adsorption occurred rapidly at the beginning and gradually reached equilibrium after around 5 h. The equilibrium adsorption capacities (Qe) of CS, AC1:1, AC1:2, and AC1:3 were 11.54, 56.94, 62.60 and 59.94 mg/g, respectively, with removal percentages of 18.72%, 90.18%, 98.35%, and 94.55%. To clarify the obtained Qe values, an example calculation based on the experimental data is provided in Table 3. The results show that AC1:2 has the highest adsorption efficiency due to its highest porosity and surface area, as reported in the BET surface area analysis. This conclusion corresponds with the study of Bih et al. [52], who found that activated carbon with a high surface area (up to 1,902.30 m2/g) and a microporous-mesoporous structure can be an efficient adsorbent of chemicals such as phenol and methylene blue, because higher porosity provides a larger surface area for chemical reactions and for capturing biochemical and non-biological materials.
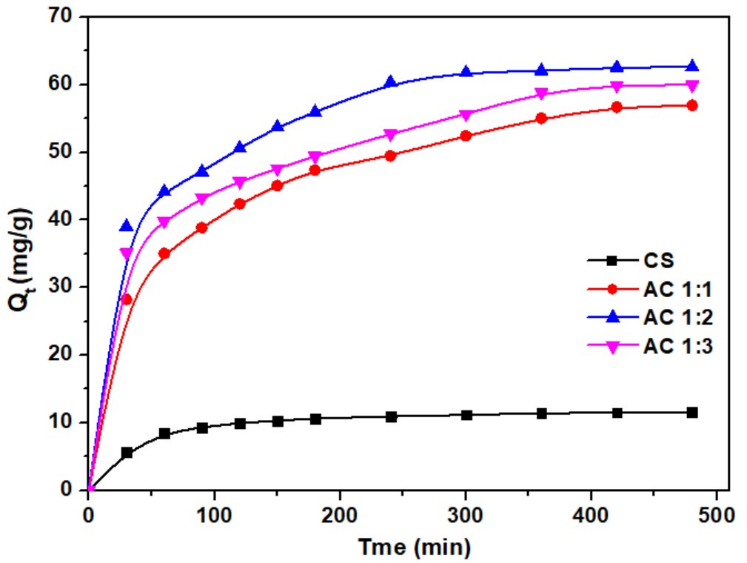
Figure 7 The adsorption efficiency of cassava rhizome biochar and its activated carbon. (MB concentration = 30 mg/L, adsorbent dose = 25 mg/50 mL).
Table 3 Experimental data used to calculate the equilibrium adsorption capacities (Qe).
Sample |
Weight of adsorbent (g) |
Initial concentration (C0) |
Equilibrium concentration (Ce) |
Equilibrium adsorption capacities (Qe, mg/g) |
||
Absorbance (A) |
Concentration (mg/L) |
Absorbance (A) |
Concentration (mg/L) |
|||
CS |
0.0255 |
0.6183 |
31.57 |
0.5155 |
25.68 |
11.54 |
AC1:1 |
0.0250 |
0.6183 |
31.57 |
0.1212 |
3.1 |
56.94 |
AC1:2 |
0.0248 |
0.6183 |
31.57 |
0.0762 |
0.52 |
62.60 |
AC1:3 |
0.0249 |
0.6183 |
31.57 |
0.0971 |
1.72 |
59.94 |
The kinetic data were analyzed using the pseudo-first-order kinetic and pseudo-second-order kinetic models [53], as described in Eqs. (4) and (5), respectively.
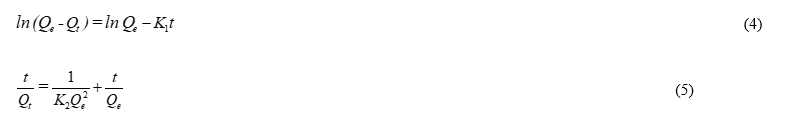
where Qt denotes the adsorption capacity at time t (mg/g), while K1 and K2 represent the pseudo-first-order and pseudo-second-order rate constants (min−1).
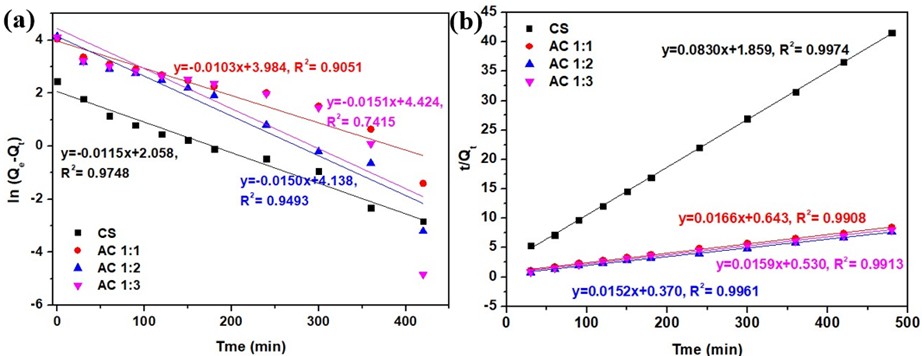
Figure 8 Plot of kinetics adsorption for methylene blue onto cassava rhizome biochar and its activated carbon; (a) Pseudo-first-order and (b) Pseudo-second-order.
The experimental results and fitted kinetic curves are shown in Figure 8, and the kinetic parameters are summarized in Table 4. The analysis suggests that the adsorption kinetics of methylene blue fit the pseudo-second-order equation better due to a higher correlation coefficient (R²) compared to the pseudo-first-order equation, suggesting that the adsorption mechanism is affected not only by diffusion but also by surface interactions or partial chemical adsorption [54]. This corresponds with the studies by Yusop et al. [37]; Sulaiman et al. [55], who found that methylene blue adsorption on activated carbon and biochar mostly fits pseudo-second-order kinetics.
Table 4 Kinetic parameters for the adsorption of methylene blue onto cassava rhizome biochar and its activated carbon adsorbent.
Sample |
Pseudo-first-order parameters |
Pseudo-second-order parameters |
|||||
R2 |
K1 (1/min) |
Qe (mg/g) |
R2 |
K2 (g/mg·min) |
Qe (mg/g) |
h = K2Qe2 (g/mg·min) |
|
CS |
0.9748 |
0.0115 |
7.8303 |
0.9974 |
0.0037 |
12.0423 |
0.5379 |
AC1:1 |
0.9051 |
0.0103 |
53.7315 |
0.9908 |
0.0004 |
60.3136 |
1.5542 |
AC1:2 |
0.9493 |
0.0150 |
62.6773 |
0.9961 |
0.0006 |
65.7030 |
2.7027 |
AC1:3 |
0.7415 |
0.0151 |
83.4293 |
0.9913 |
0.0005 |
63.0119 |
|
Note: Qe values obtained from kinetic model fitting are regression-derived parameters and do not represent experimentally measured adsorption capacities. These values may deviate from mass-balance-limited Qe, particularly when the goodness of fit is low (R² < 0.99), as observed for the pseudo-first-order model of AC1:3. Therefore, these Qe values should not be interpreted as physically achievable maximum adsorption capacities.
The kinetic parameters K₂, Qe, and h (representing the pseudo-second-order rate constant, adsorption capacity at equilibrium, and initial adsorption rate, respectively) indicate that CS has the lowest adsorption capacity (Qe) of 12.04 mg/g and an initial adsorption rate (h) of 0.54 mg/g min, while the activated carbon exhibits higher adsorption capacities of 60.31, 65.70 and 63.01 mg/g for AC1:1, AC1:2, and AC1:3, respectively. The resulting adsorption capacity values closely correlate with those predicted by the pseudo-second-order equation, suggesting that methylene blue adsorption on both activated carbon and biochar can be effectively described using this model. Furthermore, AC1:2 exhibits the highest initial adsorption rate of 2.70 mg/g min, reflecting rapid adsorption and superior performance [56]. This finding correlates with the highest SBET compared to other samples and supports the results of Kurnia et al. [57], who found that activated carbon with a higher surface area exhibits greater adsorption capacity and initial adsorption rate than biochar.
It is noted that, although the pseudo-first-order model yields a higher apparent Qe for AC1:3, the relatively low correlation coefficient (R², Table 4) indicates poor model applicability. Therefore, the pseudo-second-order model is considered more appropriate for describing the adsorption kinetics of all samples.
The adsorption isotherms were studied using the Langmuir and Freundlich models [58] following Eqs. (6) and (7), respectively, which were applied to the data derived from the isotherms. The aim was to investigate the absorption characteristics and evaluate the appropriateness of the models in relation to the experimental data.
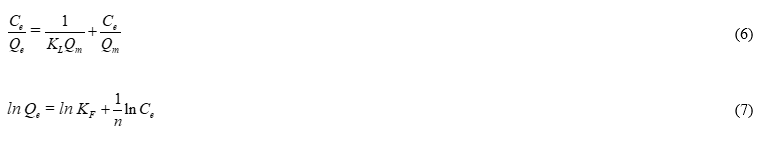
where Qm represents the maximum adsorption capacity, KL denotes the Langmuir constant, and both KF and n represent the Freundlich constants.
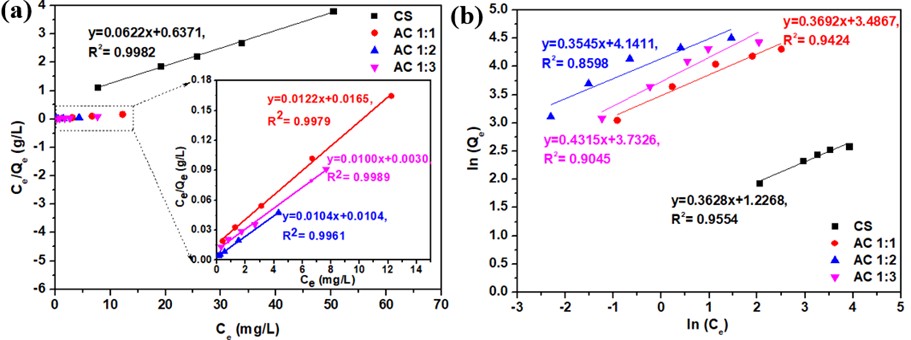
Figure 9 Plot of adsorption isotherms for the adsorption of methylene blue onto cassava rhizome biochar and its activated carbon; (a) Langmuir model and (b) Freundlich model.
Table 5 The Langmuir and Freundlich parameters for the adsorption of methylene blue onto cassava rhizome biochar and its activated carbon absorbent.
Sample |
Langmuir |
Freundlich |
||||
R2 |
Qm (mg/g) |
KL (L/mg) |
R2 |
n |
KF (mg/g)(L/mg)1/n |
|
CS |
0.9982 |
16.0772 |
0.0976 |
0.9554 |
2.7563 |
3.4093 |
AC1:1 |
0.9979 |
81.9672 |
0.7394 |
0.9424 |
2.7086 |
32.6779 |
AC1:2 |
0.9962 |
100.0000 |
3.3333 |
0.8598 |
2.8201 |
62.8719 |
AC1:3 |
0.9989 |
96.1539 |
1.0000 |
0.9045 |
2.3175 |
41.7876 |
The experimental data and fitted Langmuir and Freundlich adsorption isotherm curves are presented in Figure 9. All adsorption isotherms for cassava rhizome biochar (CS) and the activated carbon samples AC1:1, AC1:2, and AC1:3 align more closely with the Langmuir isotherm model, as indicated by correlation coefficients nearing 1 (Table 5). This suggests a homogeneous adsorption process, where each adsorption site captures a single molecule, leading to monolayer adsorption [59]. This finding is consistent with the research conducted by Kalsoom et al. [60], which identified the Langmuir isotherm model as the most appropriate for determining the adsorption equilibrium of biochar and activated carbon. Furthermore, the results demonstrate that activated carbon exhibits higher adsorption capacity compared to cassava rhizome biochar, highlighting the influence of KOH activation on both surface areas and adsorption efficiency. The AC1:2 sample reached an impressive adsorption capacity of 100 mg/g and exhibited the largest surface area among the samples. In addition, the Langmuir constant (KL) for this sample is the highest at 3.33 (L/mg), indicating a stronger bonding force between the adsorbent surface and methylene blue [59], which contributes to its superior adsorption performance.
The methylene blue adsorption data correspond with the Langmuir isotherm model, which allows for the calculation of the specific surface area using the methylene blue monolayer adsorption method. The specific surface area (SMB, m2/g) of activated carbon, based on its methylene blue adsorption capacity, was determined using Eq. (8) [61].
|
|

where Ng represents the quantity of MB dye molecules adsorbed at the activated carbon monolayer (mg/g), aMB denotes the surface area occupied by a single molecule of MB dye (197.20 Å2), N signifies Avogadro’s number (6.02×10²³ mol−1), and M indicates the molecular weight of MB dye.
The result is presented in Table 2, which shows the calculated specific surface areas for methylene blue adsorption (SMB): 42, 236, 287, and 266 m2/g for CS, AC1:1, AC1:2, and AC1:3, respectively. These values were calculated based on the Ng values obtained from the graph shown in Figure 10. These values exceed those obtained from the N2 adsorption analysis (SBET) and reflect a pseudo-second-order adsorption process for methylene blue (Table 4). This suggests that the adsorption mechanism may involve electron exchange or partial chemical adsorption. Furthermore, the specific surface area measured during methylene blue adsorption correlates with SBET; samples exhibiting a high SBET also show a high SMB. The finding corresponds with the research conducted by Ortiz-Anaya and Nishina [62], which indicated that the specific surface area associated with methylene blue adsorption is directly related to the specific surface area derived from N₂ adsorption. This implies that methylene blue adsorption can serve as an effective comparison for assessing specific surface area, particularly in the context of solution adsorption.
The numerical difference between SBET and SMB arises from the different probing molecules and mechanisms involved in each technique. Nitrogen adsorption primarily characterizes microporosity, whereas methylene blue molecules can penetrate mesopores and interact with surface functional groups, resulting in higher apparent surface areas. This behavior is also consistent with the pseudo-second-order kinetics as mentioned above, suggesting that chemisorption may play a role in methylene blue uptake. Similar to the study of Chen et al. [63], who reported SMB values higher than SBET for graphene nanoplatelet paste and graphene oxide due to their complex structures and different adsorption behaviors.
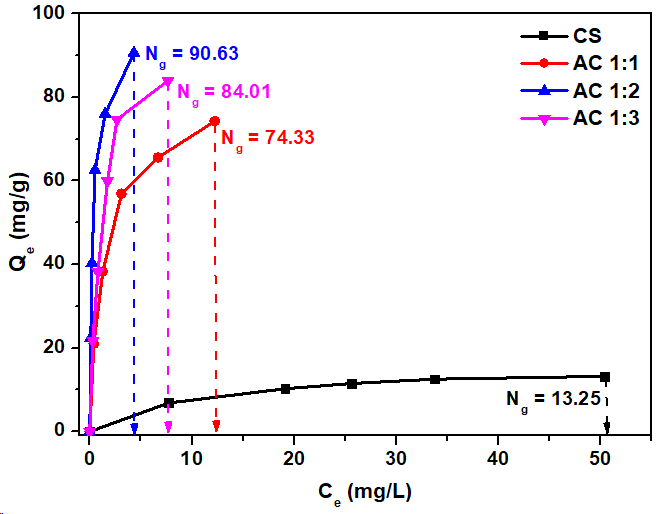
Figure 10 The Langmuir adsorption isotherm of methylene blue solution onto cassava rhizome biochar and its activated carbon.
Wastewater treatment
The results of wastewater treatment for water from Bueng Kaen Nakhon, Khon Kaen, Thailand, using CS, AC1:1, AC1:2, and AC1:3 show an increase in oxidation-reduction potential (ORP) and dissolved oxygen (DO), as shown in Figure 11. Initially, the mean wastewater ORP and DO were 112.37 ± 0.95 mV and 1.44 ± 0.03 mg/L, respectively, indicating a reducing condition and low dissolved oxygen level. After treatment with CS, AC1:1, AC1:2, and AC1:3, the ORP values increased to 333.77 ± 11.44, 320.57 ± 7.11, 301.03 ± 8.77, and 311.77 ± 6.43 mV, respectively. An increase in ORP means better water quality after the removal of the reducing agent, transitioning the state of water from reduced to oxidized, which is more favorable for marine life [64]. This result corresponds with the study by Khumalu et al. [65], who found that an increase in ORP after treatment indicates the removal of reducing agents and reflects a stable oxidation state, suggesting that ORP can also be used as a water quality index for nitrogen removal. Additionally, the study by Salinas-Toledano et al. [66] supports the idea that an increase in ORP indicates the occurrence of an oxidation state, which assists biological oxidation, such as dehydrogenase and catalase activities, and nutrient cycling in the ecosystem, making the treatment more efficient.
The values of DO after treatment increase to 1.68 ± 0.06, 1.65 ± 0.08, 1.68 ± 0.06, and 1.80 ± 0.02 mg/L, respectively. Although these levels remain below the standard (> 5 mg/L), these increases reflect the partial removal of organic compounds that consume oxygen, making more oxygen available for marine life [30]. This change in DO shows the efficiency of activated carbon using hydrothermal with KOH activation in adsorbing organic compounds and other pollutants because of its high surface area and porosity. This corresponds to the study by Tawatbundit and Mopoung [30], who found that an increase in DO during wastewater treatment when using activated carbon derived from hydrothermal activation and adding KMnO4 was the result of an increase in surface area and porosity of the adsorbent. This modification improved the ability to absorb oxygen and promoted marine biological activities, making the wastewater treatment more effective and the environment more suitable for marine life.
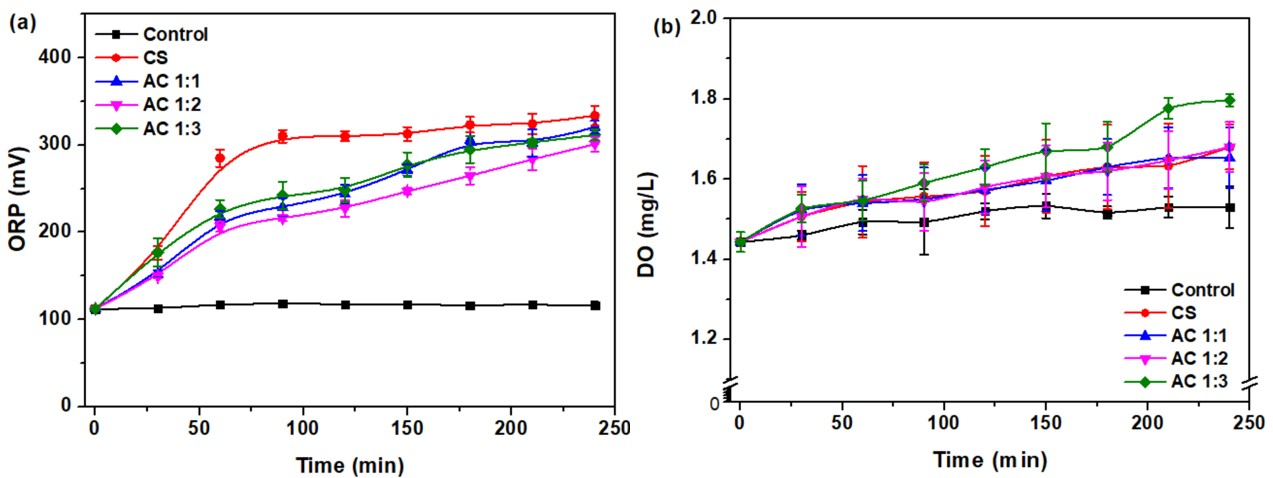
Figure 11 Levels of (a) ORP and (b) DO in wastewater treatment using cassava rhizome biochar and its activated carbon.
Conclusions
The preparation of activated carbon from cassava rhizome was carried out using the hydrothermal method with KOH activation at ratios of 1:1, 1:2, and 1:3. This process yielded an activated carbon adsorbent consisting mainly of carbon and oxygen, with a % yield as high as 74% - 75%, higher porosity, smaller pore size, and higher surface area compared to cassava rhizome biochar. In particular, at the KOH 1:2 ratio (designated as AC1:2), the maximum surface area of 42.68 m²/g was achieved. The results from the methylene blue adsorption test at an initial concentration of 30 mg/L, a volume of 50 mL, and 25 mg of adsorbent showed that activated carbon is more efficient than biochar. Specifically, AC1:2 exhibited the highest removal of methylene blue, up to 98.35%. The adsorption fits the Langmuir isotherm model, indicating monolayer adsorption. The kinetics analysis fits the pseudo-second-order model, suggesting that the adsorption process may involve surface interactions or partial chemical adsorption. Furthermore, the use of activated carbon and biochar for wastewater treatment from a natural source (Bueng Kaen Nakhon, Khon Kaen, Thailand) resulted in an increase in ORP from 112.37 ± 0.95 mV to an average of 333.77 ± 11.44 mV, representing a 2.97-fold increase. The DO level also increased from 1.44 ± 0.03 mg/L to an average of 1.80 ± 0.02 mg/L, indicating a 1.25-fold increase. These findings suggest enhanced water quality and conditions that are more favorable for aquatic life.
Acknowledgements
The author would like to thank all staff from both the Faculty of Engineering and Technology, Rajamangala University of Technology Isan, Nakhon Ratchasima, and the Faculty of Engineering, Rajamangala University of Technology Isan, Khon Kaen Campus, Thailand. This research project is supported by the Science Research and Innovation Fund. Agreement No. FF68/NKR/127.
Declaration of generative AI in scientific writing
The authors acknowledge the use of generative AI tools (e.g., QuillBot and Grammarly) in the preparation of this manuscript, specifically for language editing and grammar correction. No content generation or data interpretation was performed by AI. The authors take full responsibility for the content and conclusions of this work.
CRediT author statement
Natkrita Prasoetsopha: Conceptualization, Data Curation, Formal Analysis, Funding Acquisition, Methodology, Writing - Original Draft Preparation. Witawat Singsang: Formal Analysis, Investigation, Writing - Original Draft Preparation. Prasit Thongbai: Formal Analysis, Investigation, Methodology. Atiwat Wiriya-Amornchai: Formal Analysis, Investigation, Methodology. Vitsanusat Atyotha: Formal Analysis, Investigation, Methodology. Ing-orn Sittitanadol: Conceptualization, Data Curation, Formal Analysis, Investigation, Methodology, Writing - Review & Editing.
References
[1] H Ouaddari, B Abbou, I Lebkiri, A Habsaoui, M Ouzzine and RF Allah. Removal of methylene blue by adsorption onto natural and purified clays: Kinetic and thermodynamic study. Chemical Physics Impact 2024; 8, 100405.
[2] AJ Tóth, D Fózer, P Mizsey, PS Varbanov and JJ Klemeš. Physicochemical methods for process wastewater treatment: powerful tools for circular economy in the chemical industry. Reviews in Chemical Engineering 2023; 39(7), 1123-1151.
[3] Z Liu and SR Smith. Enzyme recovery from biological wastewater treatment. Waste and Biomass Valorization 2021; 12(8), 4185-4211.
[4] S Ihaddaden, D Aberkane, A Boukerroui and K Robert. Removal of methylene blue (basic dye) by coagulation-flocculation with biomaterials (bentonite and Opuntia ficus indica). Journal of Water Process Engineering 2022; 49, 102952.
[5] R Jiao, T Lou, H Zhang and X Wang. Preparation of starch-acrylic acid-carboxymethyl cellulose copolymer and its flocculation performance towards methylene blue. Biochemical Engineering Journal 2022; 187, 108635.
[6] MR Samarghandi, A Dargahi, A Shabanloo, H Nasab, Y Vaziri and A Ansari. Electrochemical degradation of methylene blue dye using a graphite doped PbO2 anode: Optimization of operational parameters, degradation pathway and improving the biodegradability of textile wastewater. Arabian Journal of Chemistry 2020; 13, 6847-6864.
[7] C Liang, D Wei, S Zhang, Q Ren, J Shi and L Liu. Removal of antibiotic resistance genes from swine wastewater by membrane filtration treatment. Ecotoxicology and Environmental Safety 2021; 210, 111885.
[8] W Singsang, P Suttiwattana, K Nakaravarayut, N Prasoetsopha, P Kongsong and I Sittitanadol. Comparison of photocatalytic degradation performance of TiO2-polymer based composites in wastewater treatment. Indochina Applied Science 2025; 14, 260765.
[9] DR Bernstein, GDE Glasgow, MC Lay and M Manley-Harris. Examining how media age affects organic matter removal in activated carbon filtration. AWWA Water Science 2024; 6(4), e1383.
[10] HM El-Bery, M Saleh, RA El-Gendy, MR Saleh and SM Thabet. High adsorption capacity of phenol and methylene blue using activated carbon derived from lignocellulosic agriculture wastes. Scientific Reports 2022; 12(1), 5499.
[11] T Bakalár, M Kaňuchová, A Girová, H Pavolová, R Hromada and Z Hajduová. Characterization of Fe(III) adsorption onto zeolite and bentonite. International Journal of Environmental Research and Public Health 2020; 17(16), 5718.
[12] S Khan, S Ajmal, T Hussain and MU Rahman. Clay-based materials for enhanced water treatment: adsorption mechanisms, challenges, and future directions. Journal of Umm Al-Qura University for Applied Sciences 2025; 11(2), 219-234.
[13 MA Kaczorowska and D Bożejewicz. The application of chitosan-based adsorbents for the removal of hazardous pollutants from aqueous solutions - A review. Sustainability 2024; 16(7), 2615.
[14] O İsmail and GK Özlem. Absorption and adsorption studies of polyacrylamide/sodium alginate hydrogels., Colloid and Polymer Science 2021; 299(5), 783-796.
[15] P Pavithran, RM John, SC George and NM Raju. Highly efficient removal of chromium, methylene blue and methyl orange using electrospun polyurethane as a support in heterogeneous Fenton reaction. Environmental Processes 2024; 11(1), 17.
[16] M Sajid, M Asif, N Baig, M Kabeer, I Ihsanullah and AW Mohammad. Carbon nanotubes-based adsorbents: Properties, functionalization, interaction mechanisms, and applications in water purification. Journal of Water Process Engineering 2022; 47, 102815.
[17] AP Melchor-Durán, MR Moreno-Virgen, A Bonilla-Petriciolet, HE Reynel-Ávila, EL Ortiz and OF González-Vázquez. Heavy metal removal from water using graphene oxide in magnetic-assisted adsorption systems: Characterization, adsorption properties, and modelling. Separations 2024; 11(10), 294.
[18] H Rasouli Sadabad, HM Coleman, JSG Dooley, WJ Snelling, B O’Hagan, YA Ganin and J Arnscheidt. Desorption of antibiotics from granular activated carbon during water treatment by adsorption. Environmental Processes 2024; 11(4), 64.
[19] M Akter, FBA Rahman, MZ Abedin and SMF Kabir. Adsorption characteristics of banana peel in the removal of dyes from textile effluent. Textiles 2021; 1(2), 361-375.
[20] D Ramutshatsha-Makhwedzha, A Mavhungu, ML Moropeng and R Mbaya. Activated carbon derived from waste orange and lemon peels for the adsorption of methyl orange and methylene blue dyes from wastewater. Heliyon 2022; 8(8), e09930.
[21] N Jagadeesh and B Sundaram. Adsorption of pollutants from wastewater by biochar: A review. Journal of Hazardous Materials Advances 2023; 9, 100226.
[22] A Larasati, GD Fowler and NJD Graham. Insights into chemical regeneration of activated carbon for water treatment. Journal of Environmental Chemical Engineering 2021; 9(4), 105555.
[23] H Yi, K Nakabayashi, SH Yoon and J Miyawaki. Pressurized physical activation: A simple production method for activated carbon with a highly developed pore structure. Carbon 2021; 183, 735-742.
[24] CH Tsai and WT Tsai. Optimization of physical activation process by CO2 for activated carbon preparation from honduras mahogany pod husk. Materials 2023; 16(19), 6558.
[25] SK Shahcheragh, MM Bagheri Mohagheghi and A Shirpay. Effect of physical and chemical activation methods on the structure, optical absorbance, band gap and urbach energy of porous activated carbon. SN Applied Sciences 2023; 5(12), 313.
[26] EH Sujiono, D Zabrian, Zurnansyah, Mulyati, V Zharvan, Samnur and NA Humairah. Fabrication and characterization of coconut shell activated carbon using variation chemical activation for wastewater treatment application. Results in Chemistry 2022; 4, 100291.
[27] F Zhang, S Zhang, L Chen, Z Liu and J Qin. Utilization of bark waste of Acacia mangium: The preparation of activated carbon and adsorption of phenolic wastewater. Industrial Crops and Products 2021; 160, 113157.
[28] HS Jahin, AI Khedr and HE Ghannam. Banana peels as a green bioadsorbent for removing metals ions from wastewater. Discover Water 2024; 4(1), 36.
[29] RM Mohamed, N Hashim, S Abdullah, N Abdullah, A Mohamed, MA Asshaary Daud and KF Aidil Muzakkar. Adsorption of heavy metals on banana peel bioadsorbent. Journal of Physics: Conference Series 2020; 1532(1), 012014.
[30] K Tawatbundit and S Mopoung. Activated carbon preparation from sugarcane leaf via a low temperature hydrothermal process for aquaponic treatment. Materials 2022; 15(6), 2133.
[31] MN Prandini, Pranoto and SD Marliyana. A comparative study of kinetics of methylene blue dye using adsorbent andisol and humic acid from lighnite by KOH-hydrothermal method. Journal of Physics: Conference Series 2022; 2190(1), 012019.
[32] M Adame-Pereira, CJ Durán-Valle and C Fernández-González. Hydrothermal carbon coating of an activated carbon - A new adsorbent. Molecules 2023; 28(12), 4769.
[33] K Nakason, P Khemthong, W Kraithong, S Mahasandana and B Panyapinyopol. Effect of alkaline pretreatment on the properties of cassava rhizome. Chiang Mai Journal of Science 2021; 48, 1511-1523.
[34] A Cressoni De conti, G Antonio, F Yamaji, M Brienzo, C Conti and MP Granado. Co-densification and torrefaction of biomass blends to produce durable solid biofuels. Biomass and Bioenergy 2025; 206, 108656.
[35] U Meka, JA Kumar and S Sivamani. Carbon nanomaterials from cassava rhizome for efficient toluene removal from aqueous solutions: Continuous adsorption studies using local and global optimization. South African Journal of Chemical Engineering 2025; 53, 462-475.
[36] N Prasoetsopha, P Somdee, N Srakaew, K Nuilek, W Singsang, P Masakul, P Chumsamrong and I Sittitanadol, Strengthening natural rubber with activated carbon from cassava rhizome waste: Cure characteristics, physical, thermal, and mechanical properties. Applied Science and Engineering Progress 2025; 18(2), 7710.
[37] MFM Yusop, MA Ahmad, NA Rosli and MEA Manaf. Adsorption of cationic methylene blue dye using microwave-assisted activated carbon derived from acacia wood: Optimization and batch studies. Arabian Journal of Chemistry 2021; 14(6), 103122.
[38] C Phaenark, T Jantrasakul, P Paejaroen, S Chunchob and W Sawangproh. Sugarcane bagasse and corn stalk biomass as a potential sorbent for the removal of Pb(II) and Cd(II) from aqueous solutions. Trends in Sciences 2022; 20(2), 6221.
[39] JM Monteagudo, A Durán, M Alonso and A Stoica. Investigation of effectiveness of KOH-activated olive pomace biochar for efficient direct air capture of CO2. Separation and Purification Technology 2025; 352, 127997.
[40] NL Panwar and A Pawar. Influence of activation conditions on the physicochemical properties of activated biochar: A review. Biomass Conversion and Biorefinery 2022; 12(3), 925-947.
[41] C Wang, X Li, W Wu, G Chen and J Tao. Removal of cadmium in water by potassium hydroxide activated biochar produced from Enteromorpha prolifera. Journal of Water Process Engineering 2021; 42, 102201.
[42] A Ateş. The effect of microwave and ultrasound activation on the characteristics of biochar produced from tea waste in the presence of H3PO4 and KOH. Biomass Conversion and Biorefinery 2023; 13(10), 9075-9094.
[43] J Xiao, R Hu and G Chen. Micro-nano-engineered nitrogenous bone biochar developed with a ball-milling technique for high-efficiency removal of aquatic Cd(II), Cu(II) and Pb(II). Journal of Hazardous Materials 2020; 387, 121980.
[44] GW Hyeon, GB Lee, DJ Kang, SE Lee, KM Seong and JE Park. Optimization of activated carbon synthesis from spent coffee grounds for enhanced adsorption performance. Molecules 2025; 30(12), 2557.
[45] MM Rahman, AZ Shafiullah, A Pal, MA Islam, I Jahan and BB Saha. Study on optimum IUPAC adsorption isotherm models employing sensitivity of parameters for rigorous adsorption system performance evaluation. Energies 2021; 14(22), 7478.
[46] S Shimizu and N Matubayasi. Sorption hysteresis: A statistical thermodynamic fluctuation theory. Langmuir 2024; 40(22), 11504-11515.
[47] S Sawasdee and P Watcharabundit. Mechanistic insights into adsorption of methylene blue and methyl orange using cassava rhizome activated carbon: Adsorption, characterization and reusability. Trends in Sciences 2025; 22, 10751.
[48] R Kumar Mishra, B Singh and B Acharya. A comprehensive review on activated carbon from pyrolysis of lignocellulosic biomass: An application for energy and the environment. Carbon Resources Conversion 2024; 7(4), 100228.
[49] Y Guo and Q Wang. Fabrication and characterization of activated carbon from phyllostachys edulis using single-step KOH Activation with different temperatures. Processes 2022; 10(9), 1712.
[50] NAM Barakat, OM Irfan and HM Moustafa. H3PO4/KOH activation agent for high performance rice husk activated carbon electrode in acidic media supercapacitors. Molecules 2022, 28(1), 296.
[51] R Nandi, MK Jha, SK Guchhait, D Sutradhar and S Yadav. Impact of KOH activation on rice husk derived porous activated carbon for carbon capture at flue gas alike temperatures with high CO2/N2 selectivity. ACS Omega 2023; 8(5), 4802-4812.
[52] NL Bih, MJ Rwiza, AS Ripanda, AA Mahamat, RL Machunda and JW Choi. Adsorption of phenol and methylene blue contaminants onto high-performance catalytic activated carbon from biomass residues. Heliyon 2025; 11(1), e41150.
[52] P Hariharan, K Sakthiuma, K Agilandeswari and M Nitheshlee. Statistical optimization and kinetic studies of water hyacinth stem-based activated carbon adsorbent for synthetic textile dye effluent treatment. Water Conservation Science and Engineering 2024; 9(1), 14.
[54] N Vasiljević, S Panić, G Tadić, J Vuković, N Novaković and V Mićić. Investigation of the kinetics of the adsorption of methylene blue on activated carbon. Engineering Proceedings 2025; 99(1), 4.
[55] NS Sulaiman, MH Mohamad Amini, M Danish, O Sulaiman and R Hashim. Kinetics, thermodynamics, and isotherms of methylene blue adsorption study onto cassava stem activated carbon. Water 2021; 13(20), 2936.
[56] S Sutar and J Jadhav. A comparative assessment of the methylene blue dye adsorption capacity of natural biochar versus chemically altered activated carbons. Bioresource Technology Reports 2024; 25, 101726.
[57] I Kurnia, S Karnjanakom, I Irkham, H Haryono, Y Situmorang, A Indarto, AR Noviyanti, YW Hartati and G Guan. Enhanced adsorption capacity of activated carbon over thermal oxidation treatment for methylene blue removal: Kinetics, equilibrium, thermodynamic, and reusability studies. RSC Advances 2023, 13(1), 220-227.
[58] M Andrade-Guel, CA Ávila-Orta, C Cabello-Alvarado, G Cadenas-Pliego, SC Esparza-González, M Pérez-Alvarez and ZV Quiñones-Jurado. Non-woven fabrics based on nanocomposite Nylon 6/ZnO obtained by ultrasound-assisted extrusion for improved antimicrobial and adsorption methylene blue dye properties. Polymers 2021; 13(11), 1888.
[59] A Pimsawat, A Tangtrakarn, N Pimsawat, A Khamkongkaeo and S Daengsakul. Super activated carbon-silica composite from silkworm excrement by microwave-assisted KOH activation for adsorption and supercapacitor. Environmental Technology & Innovation 2025; 37, 104034.
[60] Kalsoom, A Ali, S Khan, N Ali and MA Khan. Enhanced ultrasonic adsorption of pesticides onto the optimized surface area of activated carbon and biochar: adsorption isotherm, kinetics, and thermodynamics. Biomass Conversion and Biorefinery 2024; 14(14), 15519-15534.
[61] N Prasoetsopha, I Soonsook, A Panyayaw, P Nanon, W Singsang and I Sittitanadol. Adsorption of methylene blue and ferrous metal solution by using coconut shell charcoal. Journal of Materials Science and Applied Energy 2023; 12(2), 248672.
[62] I Ortiz-Anaya and Y Nishina. Refined surface area determination of graphene oxide using methylene blue as a probe molecule: A comparative approach. Bulletin of the Chemical Society of Japan 2024; 97, uoae118.
[63] L Chen, C Batchelor-McAuley, B Rasche, C Johnston, N Hindle and RG Compton. Surface area measurements of graphene and graphene oxide samples: Dopamine adsorption as a complement or alternative to methylene blue? Applied Materials Today 2020; 18, 100506.
[64] R Agüero-Quiñones, Z Ávila-Sánchez, S Rojas-Flores, L Cabanillas-Chirinos, M De La Cruz-Noriega, R Nazario-Naveda and W Rojas-Villacorta. Activated carbon electrodes for bioenergy production in microbial fuel cells using synthetic wastewater as substrate. Sustainability 2023; 15(18), 13767.
[65] SM Khumalo, BF Bakare, S Rathilal and EK Tetteh. Characterization of south african brewery wastewater: Oxidation-reduction potential variation. Water 2022; 14(10), 1604.
[66] MA Salinas-Toledano, RW Thring and FY Garcia-Becerra. High-resolution monitoring reveals treatment wetland resilience across temperature and loading conditions: Factorial analysis of operational parameters in domestic wastewater treatment. Journal of Water Process Engineering 2025; 74, 107851.