Trends
Sci.
2026;
23(7):
12518
Spatial Classification of Diurnal Precipitation Cycle in the Tropical and Subtropical Regions Based on the Circular Statistical Analysis
Peeravit
Koad
![]() ,
Chanankorn Jandaeng
,
Chanankorn Jandaeng
![]() ,
,
Jongsuk
Kongsen
![]() and Sirirat Somchuea*,
and Sirirat Somchuea*,
![]()
Informatics Innovation Center of Excellence (IICE) and School of Informatics, Walailak University,
Nakhon Si Thammarat 80160, Thailand
(*Corresponding author’s e-mail: mukmick.sirirat@gmail.com)
Received: 4 November 2025, Revised: 25 November 2025, Accepted: 2 December 2025, Published: 10 February 2026
Abstract
The impact of climate and weather on human existence is of utmost importance, as it shapes several aspects, such as human evolution, migration patterns, and social progress. Observing and comprehending precipitation patterns, especially the diurnal cycle, are imperative for effectively managing everyday activities. This study thoroughly examines diurnal precipitation patterns in tropical and subtropical regions through the utilization of a parametric approach based on the bimodal von Mises distribution. The research effectively creates a spatial classification criterion for diurnal precipitation, offering a simple but helpful tool for meteorological and climatological investigations. It helps identify the spatial extents of convective and stratiform precipitations and reveals the physical mechanisms behind the precipitation, such as over the complex mountaintop terrains. The user-friendliness and capacity to elucidate the bimodal characteristics of diurnal precipitation patterns also render this criterion a significant asset for academia and practitioners.
Keywords: Precipitation, Diurnal cycle, Circular statistics, Spatial classification, Tropical climate, Rainfall variability, Satellite observation
Introduction
Climate and the weather are essential to human survival. Since ancient times, the long-term climate has influenced human evolution and migration. All nations’ social development is dependent on continuous climate change. The weather and climate on Earth have been observed and recorded throughout history. Water level and precipitation are the most straightforward and reliable climate variables to monitor. For agricultural water management, water levels have long been monitored in rivers and lakes. In coastal and ocean settings, water level observations support tide prediction and coastal hazard assessment. Standard rain instruments have also been used to forecast crop yield and reservoir water levels based on precipitation. The variability of precipitation influences the water level trend. However, annual and diurnal cycles of precipitation that are not indicated by the seasonal calendar are typically responsible for prolonged droughts and sudden floods that significantly impact human existence [1-3].
The study of precipitation variability and its environmental effects is crucial to managing and organizing daily life. Recent research examined the mechanism underlying the annual precipitation cycle by analyzing precipitation data from meteorological stations, satellite data, and climate model results. Some of them used harmonic and wavelet analyses to determine the impact of climate change and climate oscillations and to estimate the commencement of the wet season by extracting periodicities from the annual cycle [4-6]. However, using a single sinusoidal function cannot represent abrupt events in meteorology, such as the seasonal monsoon precipitation that occurs once a year within a short period. This limitation is particularly evident in dry and semi-arid regions, where rainfall is concentrated in a specific month, producing a sharp peak and extended dry intervals. Accurately estimating such events requires multiple sinusoidal functions, which consequently increases the number of estimated parameters. Therefore, fewer studies have used probability distributions, such as the von Mises distribution, to investigate the more localized cyclical pattern of precipitation [3,7].
Although less prominent than the annual cycle, the diurnal precipitation cycle is essential for understanding weather and climate patterns in tropical and subtropical regions. Since the early twentieth century, studies have examined this phenomenon, frequently noting a late morning precipitation maximum over the ocean [8]. In contrast, precipitation over land typically peaks in the afternoon, while over the ocean it peaks from evening to early morning [9]. Similar nocturnal peaks also occur in some windward mountain slopes, river basins, and coastal regions [10-12]. Regional variability remains substantial. For example, in summer over the northern North China Plain, rainfall peaks in the afternoon near mountain slopes and propagates southeastward, whereas central areas experience maximum precipitation at midnight and in the early morning [13-15].
This diurnal cycle is studied to determine the timing of precipitation to comprehend the effects of weather variations, instability, and changing conditions. Previous research has identified two distinct physical causes for the diurnal precipitation cycle [1,16]. The diurnal heating of the land surface causes the first type of diurnal precipitation. This variety was predominant over the continent, where solar heating warms the continent until its surface temperature reaches its maximum in the afternoon, frequently resulting in atmospheric destabilization and convective clouds [17,18]. Differential heating between land and water surfaces in coastal regions can also contribute to the perturbation of the atmosphere, resulting in land-sea breezes [2,19]. In addition, the propagation of gravity waves can result in delayed offshore rainfall in the evening or at night [20,21].
The second type of diurnal precipitation is nighttime precipitation, which predominated over the ocean and peaked between midnight and dawn [22]. The causes of the latter variety are still being investigated. Several hypotheses have been proposed and are generally accepted, including the convergence and divergence of air, which is modulated by the general circulation, or the enhanced nighttime radiative cooling of clouds in the atmosphere, which causes relatively light but persistent precipitation compared to the afternoon rain [23-25]. In addition, it was discovered that the diurnal precipitation cycle is influenced by complex spatial and temporal meteorological variables from the surface to the upper atmosphere, such as temperature, pressure, humidity, and wind. These affect cloud cover and extent, the frequency of lightning, cyclogenesis, and atmospheric radiation [2,16].
Understanding and managing the environment, which ultimately contributes to the population’s well-being, depends on the influence of precipitation. This study aims to investigate diurnal precipitation quantities in tropical and subtropical regions using a circular statistics-based parametric approach. Long-term satellite data estimate the diurnal precipitation cycle using the continuous mixture distribution. To evaluate the efficacy of this method, the estimated distribution parameters are also classified into different climate regions that reflect their characteristics.
Materials and methods
Satellite tropical and subtropical precipitation dataset
This study employs the Tropical Rainfall Measuring Mission (TRMM) Multi-satellite Precipitation Analysis (TMPA) version 7 (3B42 research version, hereafter TMPA 3B42) as the satellite-derived tropical and subtropical precipitation dataset (https://doi.org/10.5067/TRMM/TMPA/3H/7) [26]. This gridded TMPA 3B42 dataset has a temporal coverage from January 1998 to December 2019 (22 years) at a resolution of 3 h (90-minute span around the nominal hours) and a spatial coverage from latitudes 50° S to 50° N at a resolution of 0.25° × 0.25°. The total area of the spatial coverage is about 76.6% compared to the entire surface area of the Earth. The TMPA 3B42 dataset consists of gridded data over the continent and the ocean with a ratio of 26:74 or about 1:3.
Although TMPA’s successor, the Global Precipitation Measurement (GPM) mission’s Integrated Multi-satelliteE Retrievals for GPM (IMERG), is available with a superior temporal resolution of 30 min and spatial resolution of 0.1° × 0.1°, its period from June 2000 is shorter compared to TMPA (https://doi.org/10.5067/GPM/IMERG/3B-HH/06) [27]. Although the TMPA and IMERG datasets differ in spatial and temporal resolutions, both share a consistent calibration framework based on multi-satellite retrievals, ensuring comparability and reliability in long-term precipitation analysis. The TMPA 3B42 dataset was used in this study because it provides a long and continuous record with a consistent 3-hour sampling interval. This temporal coverage is important for studying sub-daily precipitation variability over multiple decades. Although the newer IMERG product offers finer spatial and temporal resolution, its shorter record limits its usefulness for long-term climatological analysis. The TMPA dataset therefore provides a practical balance between coverage, consistency, and temporal length for examining the diurnal cycle in tropical and subtropical regions.
In the cases of the diurnal cycle, the period synchronous with the Sun’s apparent position with respect to the local celestial meridian was fixed to be precisely equal to 1 mean solar day having 86,400 s. The original 3-hourly data provided in Coordinated Universal Time (UTC) were converted to Local Mean Solar Time (LMST) at each grid cell based on its longitude to align precipitation timing with local diurnal cycles. Each grid cell’s data was sorted by time of day, separated into eight bins, each having a duration of 3 h, and then converted into a probability density histogram explaining the precipitation rate. A graphical example of Bangkok, Thailand, representing typical tropical monsoon rainfall with clear seasonal and diurnal variations, is shown to illustrate this process. Its precipitation rates time series from 1998 to 2019 extracted from the TMPA 3B42 dataset was used to compute a histogram based on the time of year and the time of day (plot number 1 in Figure 1). The 1-year monthly climatology of precipitation rate can be used to study the annual cycle by (plot number 2 in Figure 1) [3]. The 1-day hourly climatology computed based on the time of day can be used to study the diurnal cycle as in this study (plot number 3 in Figure 1).
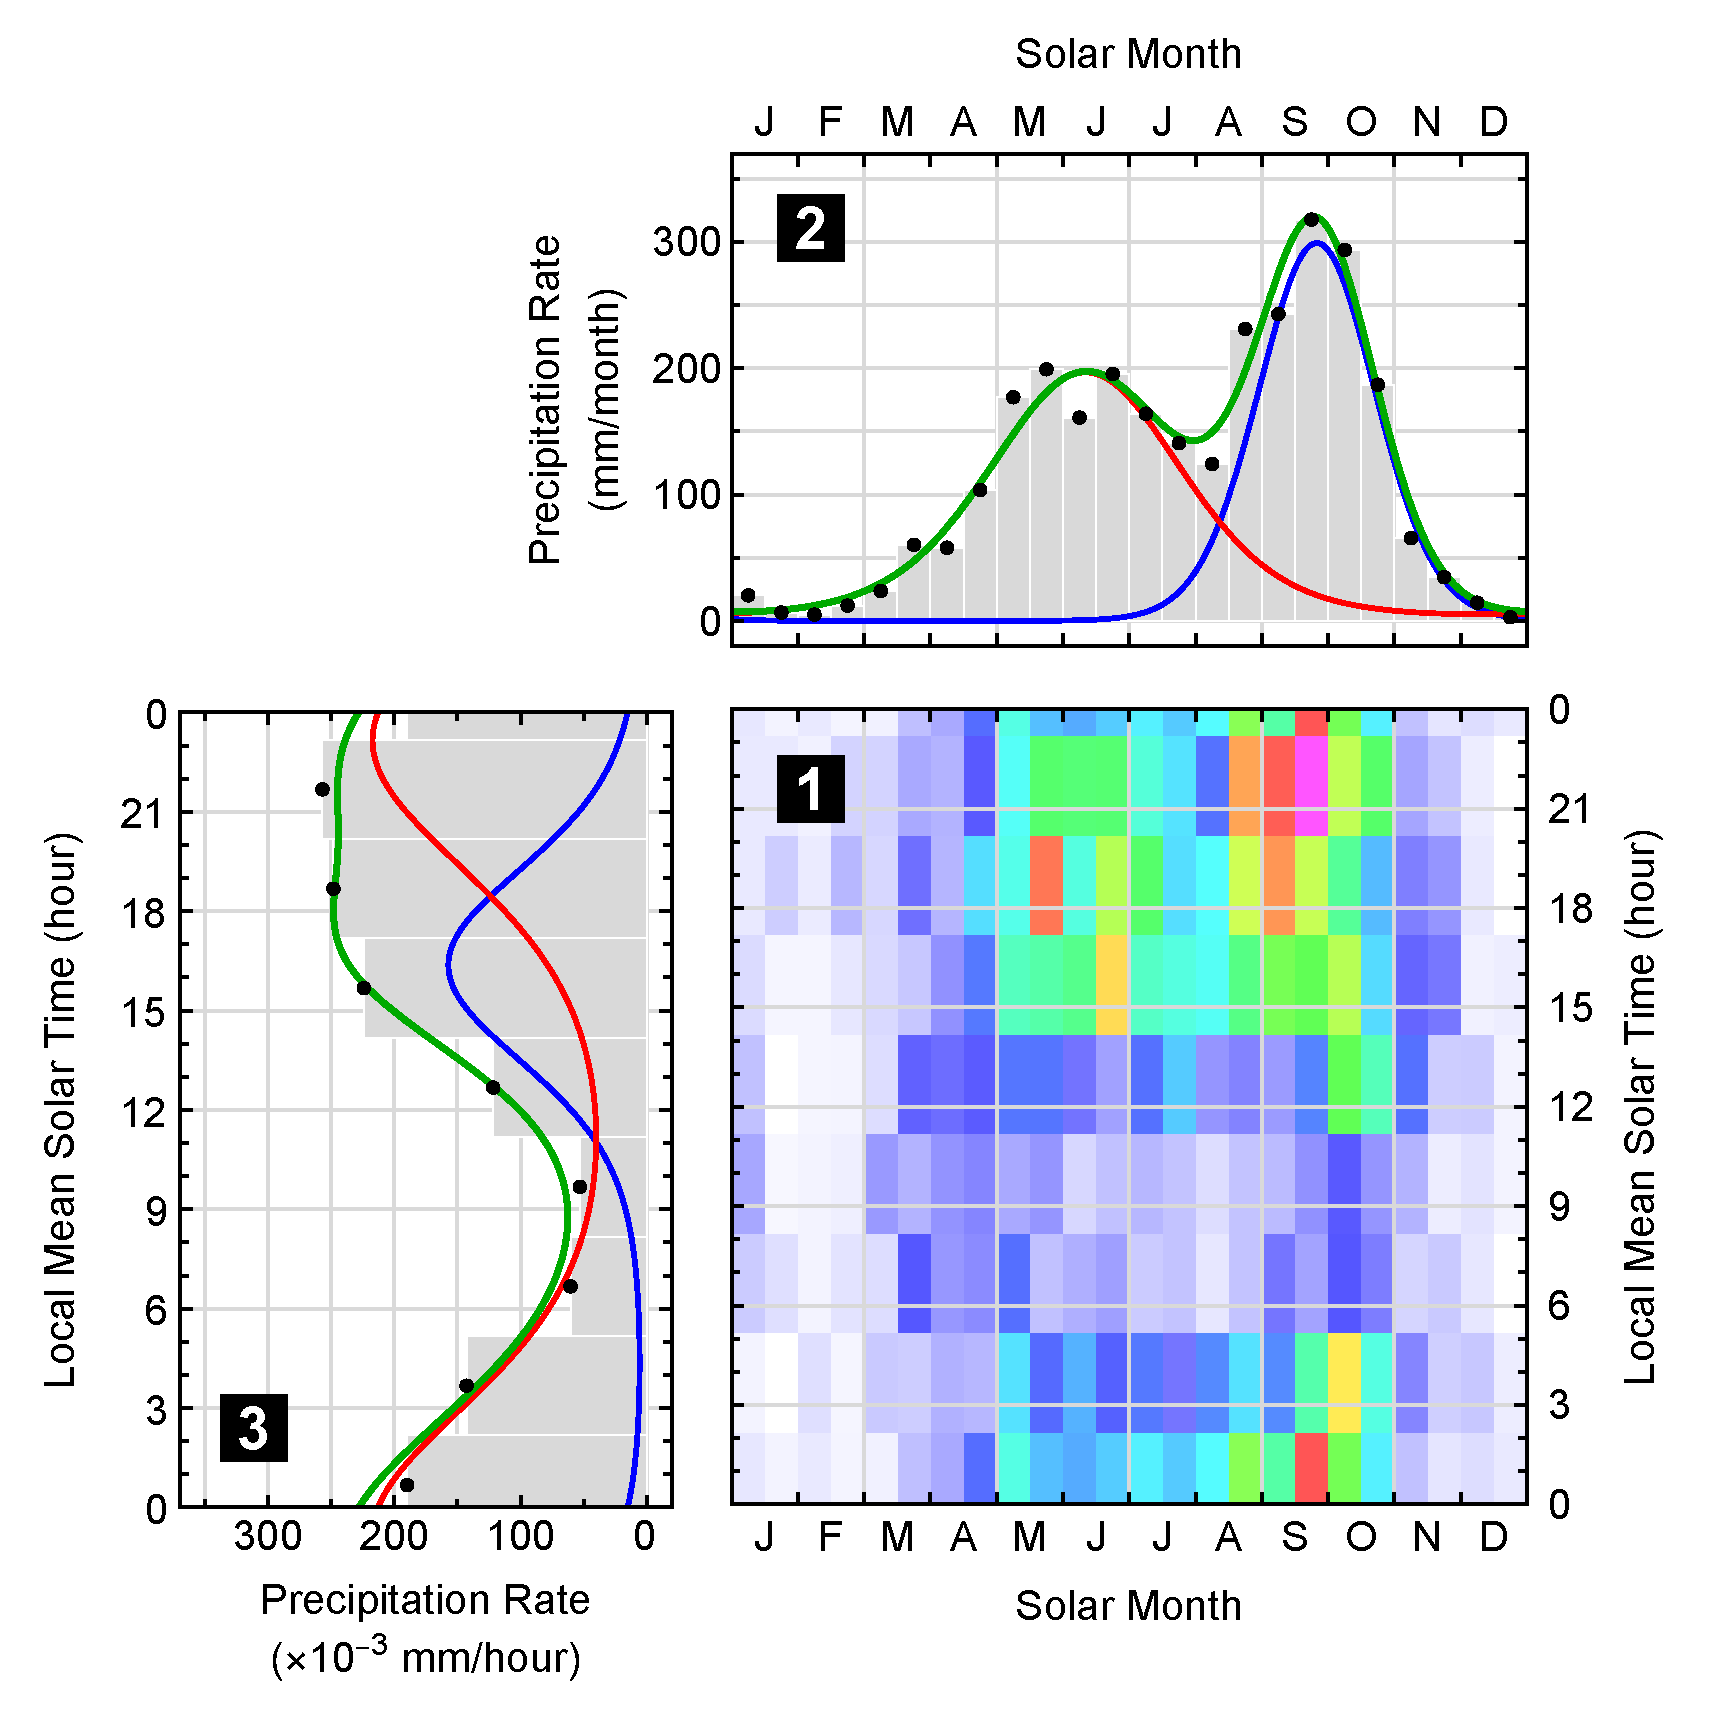
Figure 1 The density plot (plot number 1) shows the average precipitation rate from 1998 to 2019 in Bangkok, Thailand, from the TMPA 3B42 dataset. (Bluish to reddish areas represent low to high precipitation rates, respectively, while white areas represent no precipitation.) Plot number 2 shows its annual cycle having two precipitation maxima, and plot number 3 shows its diurnal cycle. The green curves in diagrams 2 and 3 represent the estimated bimodal von Mises distribution, while the red and blue curves represent their underlying unimodal von Mises distributions.
Circular statistical analysis
Since the diurnal cycle of precipitation repeats every 24 h, its distribution is inherently circular rather than linear. Therefore, circular statistical analysis provides a more appropriate framework for describing and quantifying periodic precipitation patterns. This study employs the theoretical basis of bimodal von Mises distribution and its parameter estimation algorithm from [3], who studied the annual precipitation cycle in tropic and subtropic regions. In this study, the underlying unimodal von Mises distribution that gives the highest diurnal precipitation rate will be referred to as the first subdistribution, and another one that gives the lower rate will be called the second subdistribution.
The mathematical form of this periodic function of precipitation rate R(t) is repeated here for convenience:
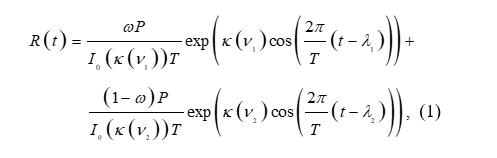
where t is the Local Mean Solar Time (LMST) ranging from 0 to nearly the full period of T = 24 h, P is the average diurnal precipitation, ω represents the relative weight of the first subdistribution compared to the bimodal von Mises distribution (0 < ω ≤ 1, effectively indicating which precipitation peak is more dominant), λ1 and λ2 are location parameters of the first and second subdistributions respectively (0 ≤ λx < T), κ is the concentration parameter which depends on their unit-less circular variances v1 and v2 (0 < vx < 1), and In is the modified Bessel function of the first kind of order n.
The concentration functionκ(vx) is defined such that:
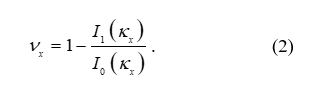
Parameters ω, λ1, ν1, λ2, and ν2 (excluding T and P) will hereafter be called the fundamental parameters. The parameter estimation algorithm used in this study combines the method of moments and non-linear least squares, providing a balance between computational efficiency and estimation accuracy. This approach enables stable parameter estimation over a global dataset with millions of grid cells, where purely non-linear optimization would be computationally intensive.
However, this approach does not always guarantee the optimal goodness-of-fit compared to the non-linear least squares. Therefore, the Root Mean Square Error (RMSE) relative to P will be given for further comparison. The relative RMSE can be written as:

where K is the number of precipitation rate data at each grid cell (which is always K = 8 for TMPA 3B42 dataset), rk is the actual precipitation rate at time tk, and R(tk) is its rate estimated using Eq. (1). The relative RMSE serves as an indicator of how well the bimodal von Mises function represents the observed diurnal precipitation pattern at each grid cell.
Spatial classification of diurnal precipitation
After estimating the bimodal von Mises parameters for each grid cell, the next step was to classify the spatial patterns of diurnal precipitation based on their temporal characteristics. In this study, the behavior of the diurnal cycle of precipitation was categorized into unimodal and bimodal variations, following the notations used in [3]. The unimodal variation shows one precipitation maximum at time λx1 and one precipitation minimum at time λn1 within a 24-hour period. In the case of the bimodal variation, λx1 becomes a temporal parameter associated with the first precipitation maximum (the highest high), while λn1 represents the first precipitation minimum (the lowest low). Another pair of temporal parameters describes the second precipitation maximum (λx2, the lowest high) and the second precipitation minimum (λn2, the highest low). These temporal parameters collectively define the timing of diurnal precipitation variations and serve as the basis for subsequent spatial classification.
Parameters λx1, λn1, λx2, and λn2, hereafter the derived parameters, were used in the spatial classification of diurnal precipitation. However, since these parameters are periodic (i.e., 24:00 of the current day is equivalent to 00:00 of the next day), standard clustering algorithms cannot process them correctly. Modified versions of k-means for circular data have been reported [28,29], but tests in this study produced discontinuous and physically inconsistent spatial patterns. To obtain stable and interpretable results, a simple rule-based classification was developed. The criteria were based on the observed relationships among λx1−λn1, λx1+λn1, λx2−λn2, and λx2+λn2, using time thresholds of −12, 0, 12, 24 and 36 h. These thresholds define the classes used in the spatial classification described in the following section.
Results and discussion
Examples of using the bimodal von mises distribution
To demonstrate the practical performance of the bimodal von Mises model, representative locations from different climatic regions were analyzed. These examples illustrate how the model captures distinct diurnal precipitation behaviors across both continental and oceanic environments. The exact areas in which several cities are located were used to demonstrate the diurnal cycle of precipitation. The selected locations represent a wide range of latitudes, climatic regimes, and geographical settings, ensuring that both convective and stratiform precipitation patterns are well represented (Table 1 and Figures 2(a) - 2(p)).
Table 1 summarizes the estimated fundamental parameters for each location, including the average diurnal precipitation (P), relative weight (ω), location parameters (λ1 and λ2), and circular variances (ν1 and ν2). Figures 2(a) - 2(p) present the corresponding fitted diurnal cycles, where the observed precipitation rates are compared with the bimodal von Mises curves for each city. From these examples, it can be seen that precipitation in most cities that are located over the continent usually peaks in the afternoon from 12:00 - 18:00 (i.e., 12 < λ1 < 18). However, precipitation in some cities peaks during the nighttime to the morning from 18:00 - 06:00 (i.e., 0 < λ1 < 6 or 18 < λ1 < 24), and the bimodal von Mises distribution can be used to capture this characteristic. These include Cape Town in South Africa, Mumbai in India, and Cairo in Egypt (Figures 2(d), 2(i), and 2(j)).
Table 1 Estimated fundamental parameters describing the diurnal precipitation cycle in some areas.
|
Location |
Latitude |
Longitude |
P (mm) |
ω |
λ1* |
λ2* |
ν1 |
ν2 |
|
a |
Highest P |
Colombia |
4.625° N |
77.625° W |
24.353 |
0.715 |
4.793 |
7.562 |
0.518 |
0.315 |
b |
Lowest P |
Egypt |
23.875° N |
25.375° E |
0.003 |
0.576 |
13.995 |
1.312 |
0.223 |
0.324 |
c |
Jakarta |
Indonesia |
6.230° S |
106.549° E |
6.787 |
0.744 |
16.993 |
2.983 |
0.593 |
0.385 |
d |
Cape Town |
South Africa |
33.914° S |
18.096° E |
1.077 |
0.755 |
3.388 |
14.875 |
0.766 |
0.511 |
e |
Tokyo |
Japan |
35.667° N |
139.180° E |
4.363 |
0.523 |
1.322 |
14.185 |
0.649 |
0.628 |
f |
Sao Paulo |
Brazil |
23.682° S |
46.876° W |
4.662 |
0.446 |
17.194 |
22.909 |
0.286 |
0.793 |
g |
Shanghai |
China |
31.223° N |
120.916° E |
3.723 |
0.590 |
18.272 |
5.933 |
0.529 |
0.469 |
h |
Galapagos |
Ecuador |
0.383° S |
91.545° W |
0.333 |
0.482 |
16.142 |
23.549 |
0.327 |
0.619 |
i |
Mumbai |
India |
19.081° N |
72.320° E |
6.021 |
0.224 |
5.990 |
14.361 |
0.376 |
0.962 |
j |
Cairo |
Egypt |
30.059° N |
31.118° E |
0.058 |
0.764 |
23.769 |
14.257 |
0.560 |
0.251 |
k |
Paris |
France |
48.859° N |
2.207° E |
1.712 |
0.976 |
20.067 |
7.826 |
0.910 |
0.109 |
l |
New York |
USA |
40.697° N |
74.260° W |
3.303 |
0.303 |
15.927 |
0.891 |
0.565 |
0.839 |
m |
Sydney |
Australia |
33.847° S |
150.371° E |
2.396 |
0.778 |
15.627 |
3.332 |
0.563 |
0.534 |
n |
Lagos |
Nigeria |
6.548° N |
3.004° E |
3.854 |
0.374 |
13.605 |
3.768 |
0.296 |
0.825 |
o |
Mogadishu |
Somalia |
2.059° N |
45.167° E |
0.805 |
0.520 |
14.299 |
2.824 |
0.242 |
0.518 |
p |
Madrid |
Spain |
40.438° N |
3.960° W |
1.457 |
0.773 |
18.891 |
7.073 |
0.634 |
0.418 |
* λ1 and λ2 are in LMST, not the UTC. For example, λ1 = 10.933 is 10:56 AM, and λ2 = 22.450 is 10:27 PM.
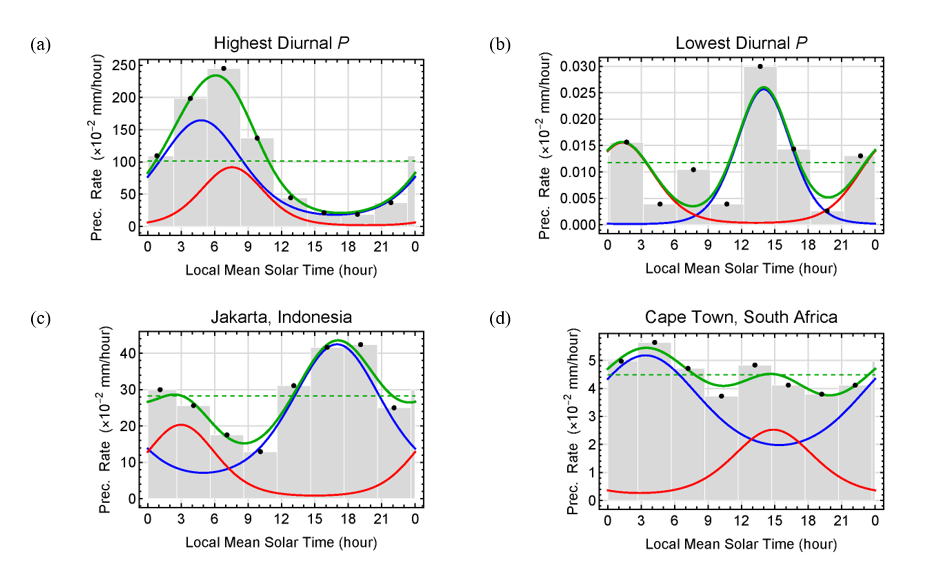
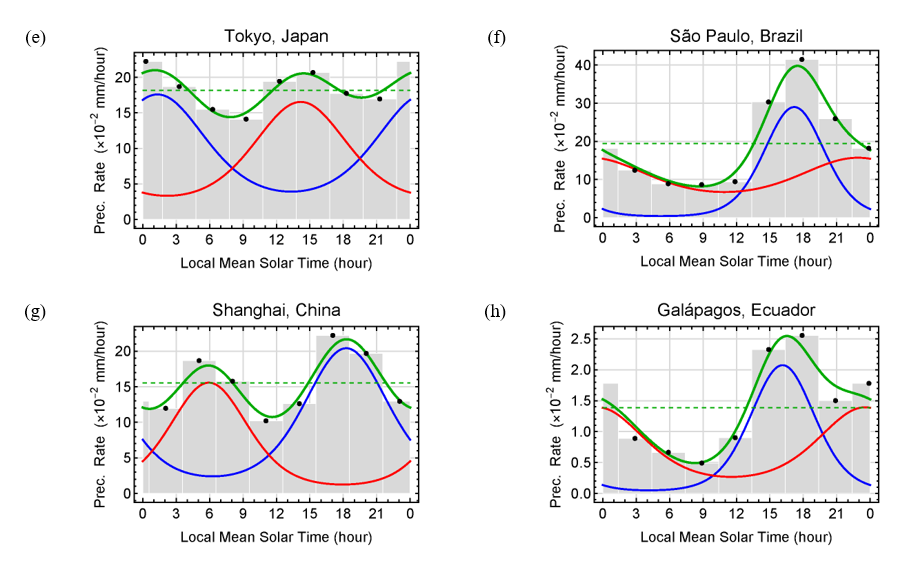
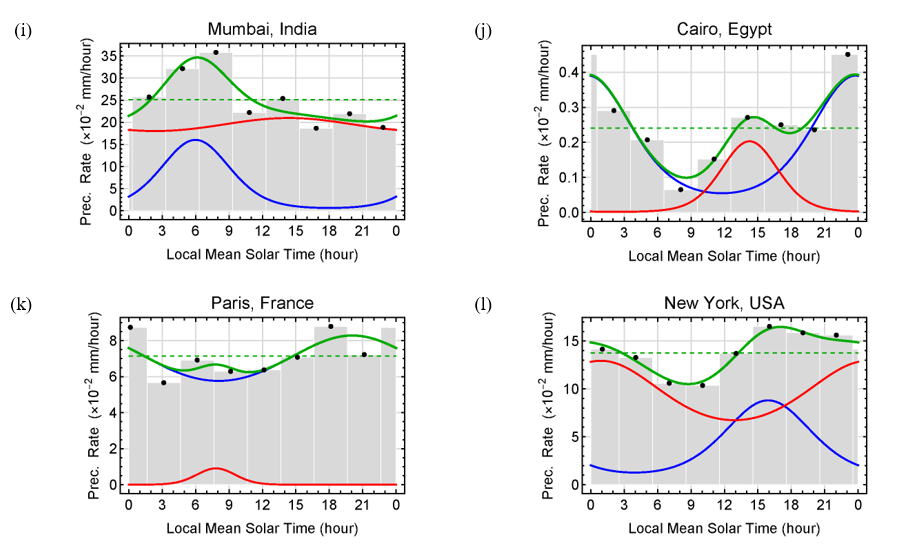
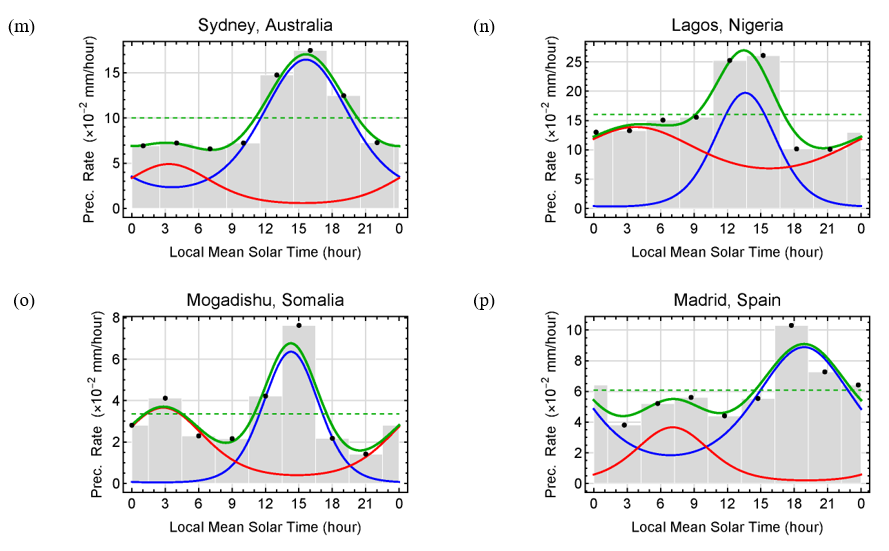
Figure 2 Examples of the diurnal cycle of precipitation for some densely populated cities around the world. Black dots and grey bars are the observed precipitation rates. Blue and red lines represent the first and second subdistributions, respectively. Thick green lines are the bimodal von Mises distribution, while dashed green lines represent the uniform distribution or average precipitation rate.
In some areas, the first and second subdistributions were found to be located close together (λ1 ≈ λ2), or their concentration parameters are significant (ν1 or ν2 approach 1), which resulted in unimodal distributions having a single precipitation peak. These include the area of the highest precipitation in the eastern central Pacific Ocean, Sao Paulo in Brazil, Galapagos in Ecuador, Mumbai in India, New York in the USA, Sydney in Australia, and Lagos in Nigeria (Figures 2(a), 2(f), 2(h), 2(i), 2(l), 2(m), and 2(n)). Some areas exhibit strong bimodality in the diurnal precipitation as can be easily noticed by the shape of estimated bimodal von Mises distributions including Jakarta in Indonesia, Cape Town in South Africa, Tokyo in Japan, Shanghai in China, Cairo in Egypt, Mogadishu in Somalia, and Madrid in Spain (Figures 2(c) - 2(e), 2(g), 2(j), 2(o), and 2(p)).
These examples demonstrate the capability of the bimodal von Mises distribution to flexibly represent both simple and complex diurnal rainfall regimes. It effectively distinguishes between regions dominated by afternoon convective precipitation and those characterized by nocturnal or dual-peak rainfall patterns. The diversity of patterns across these locations provides the foundation for analyzing the spatial distribution of fundamental parameters in the following section.
Fundamental parameters of the diurnal cycle
The fundamental parameters derived from the bimodal von Mises distribution provide quantitative insights into the timing, intensity, and concentration of diurnal precipitation. The estimation process produced stable parameter fields with no visible artifacts or unreasonable discontinuities, indicating consistent numerical performance across the dataset. Analyzing these spatial distributions helps reveal how precipitation characteristics differ between land and ocean regions and across climatic zones. The following results summarize global patterns of these parameters. The map and histogram of the average diurnal precipitation P are the same as that reported in [3], except that its values were scaled by a factor of 1/365.24 to convert from the annual basis to the diurnal basis, ensuring that the precipitation rate corresponds to an average daily value rather than an annual total (Figures 3(a) and 4(a)). Therefore, 95% of their surface area, which has values of the average annual precipitation between 25.0 and 3,238.2 mm, was reduced to 0.068 and 8.866 mm, respectively, based on P.
The values of the probability ratio ω over the ocean were more spatially fluctuated than that of over the continent. The histogram of ω over the ocean shows that most of them were found to concentrate at nearly 0 or 1, while no prominent peak can be found over the continent (Figure 3(b)). These suggest that the diurnal precipitation of most ocean areas can be modeled using the unimodal von Mises distribution. In contrast, that of the continent should be modeled using the bimodal von Mises distribution. This suggests that over most oceanic regions, precipitation is controlled by a single dominant mechanism, whereas over land, multiple diurnal processes such as convection and orographic lifting contribute to bimodal behavior [30,31].
Over the continent, values of the first diurnal location parameter λ1 were found to concentrate around 16:30 and 00:00. In the case of the ocean, they were primarily found around 05:00 and 14:30, respectively (Figures 3(c) and 4(c)). In contrast to λ1, which typically represents the timing of the primary precipitation maximum, λ2 corresponds to the secondary maximum, often reflecting a delayed or secondary rainfall mechanism. Histograms of λ2 show that over the ocean, its values were found to concentrate mainly in the afternoon at around 15:00, and that of the rest were found around 04:00. In contrast, over the continent, they were found to concentrate mainly around 01:30, and other two small peaks (which can be considered as a single peak) can be found around 15:00 (Figures 3(d) and 4(e)).
In the case of the first diurnal circular variance ν1 over the continent, its histogram was found to be positively skewed with a peak at 0.3. In contrast, over the ocean, its histogram tends to be negatively skewed, with a peak located around 0.9 (Figures 3(e) and 4(d)). The second diurnal circular variance ν2 over the continent was found to be in contrast with that of ν1 in which its skewness was found to be slightly negative and concentrated around 0.7, while over the ocean, its skewness is still negative with a significant peak located at 0.95 (Figures 3(f) and 4(f)). These contrasting shapes of ν1 and ν2 distributions indicate that continental precipitation tends to exhibit more variable and spatially diverse concentration patterns than oceanic precipitation, which is generally more uniform, reflecting the sharp, concentrated convective peaks over land and the broad, diffuse stratiform or shallow-convective peaks that dominate over the ocean.
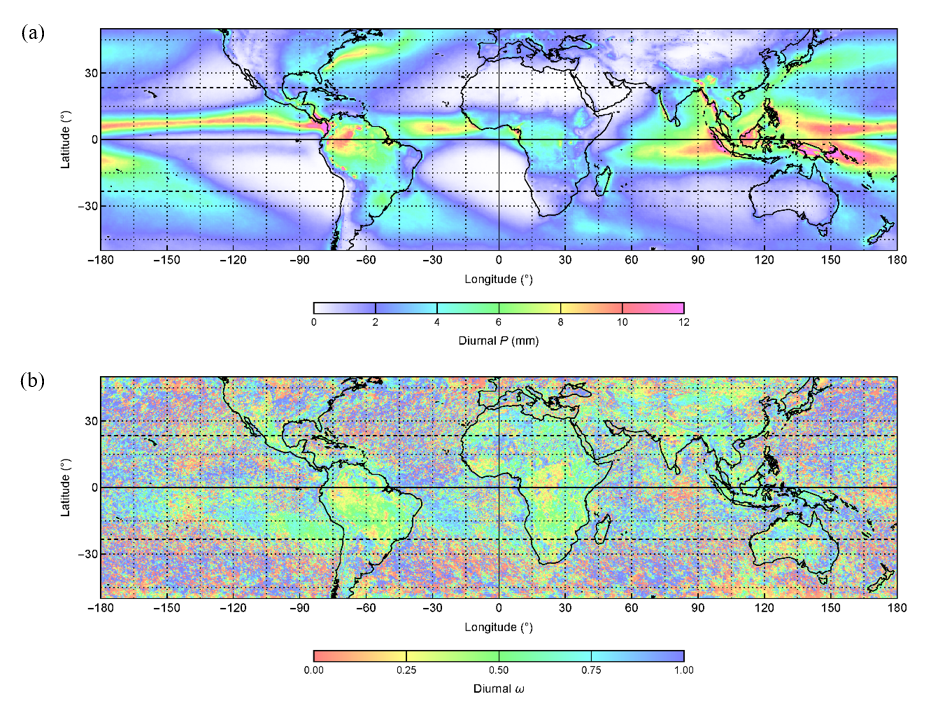
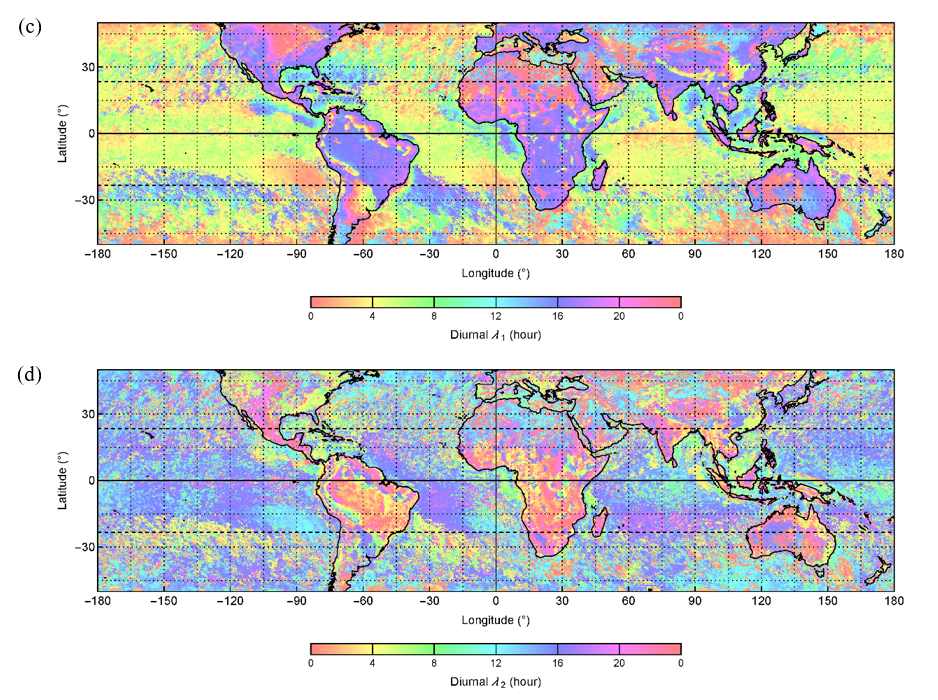
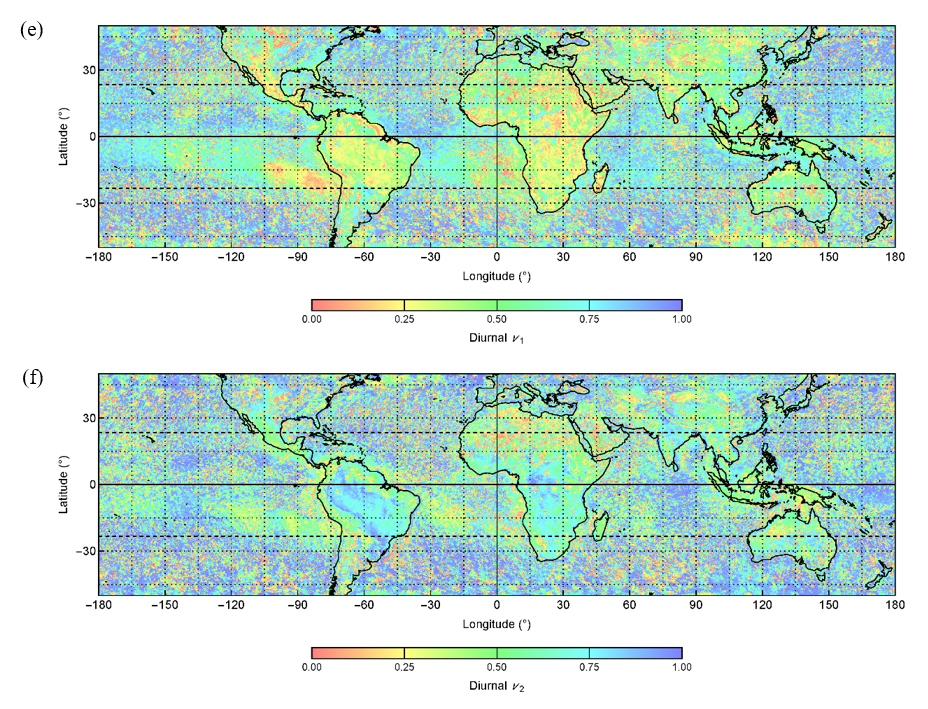
Figure 3 Maps showing fundamental parameters of the diurnal cycle: The average diurnal precipitation P (a), the probability ratio ω (b), location parameters λ1 and λ2 (c) and (d), and circular variances ν1 and ν2 (e) and (f).
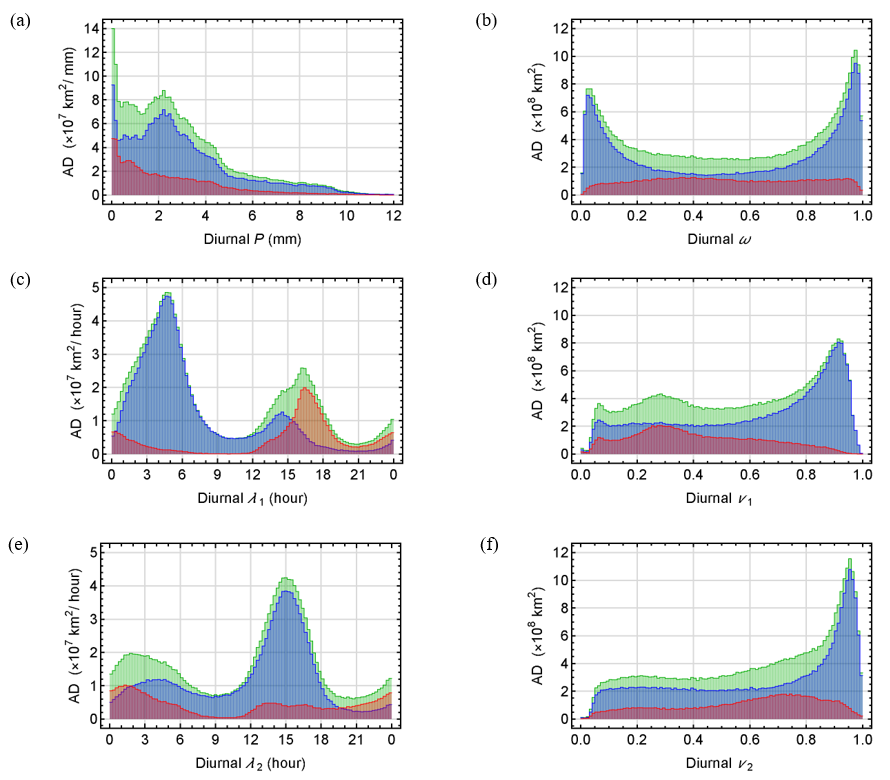
Figure 4 Histograms showing the Area Density (AD) of each fundamental parameter, where all bins in each histogram were expressed as the area density that has a unit of area per unit of the parameter being visualized, such that the total area of all bins is equal to their actual coverage area on the Earth. Histograms computed over the continent, the ocean, and the combined ocean and continent are shown in red, blue, and green, respectively.
Density plots of these fundamental parameters can be considered to gain more information about their mutual relationships. The density plot between the diurnal P and ω confirms that precipitation over some ocean areas can be modeled using the uniform von Mises distribution since their ω approach 0 or 1. In contrast, over the continent, most areas should be modeled using the bimodal von Mises distribution, especially over areas having low values of P (Figure 5(a)).
The density plot between the diurnal ω and λ1 over the ocean reveals that high values of ω (ω > 0.5, the first subdistribution dominates) are primarily associated with λ1 that occurred from 00:00 - 12:00, while low ω values (ω ≤ 0.5, the second subdistribution dominates) can also be found to have λ1 in the afternoon from 12:00 - 18:00 (Figure 5(b)). In the case of the continent, a broad range of ω values exists, but areas having ω of 0.2 - 0.6 mainly were found to have λ1 occurring in the afternoon.
From density plots between the diurnal ω and λ2, most of λ2 over the ocean having ω > 0.5 and λ1 ranging from 00:00 - 12:00 were found to be concentrated from 12:00 - 18:00, while that of having ω ≤ 0.5 can be found chiefly from 03:00 - 12:00. Over the continent, the majority of λ2 from 21:00 - 03:00 can be associated with ω from 0.2 - 0.6 and λ1 in the afternoon, while λ2 from 12:00 - 18:00 were found to have higher ω values from 0.6 - 1.0 and λ1 around the midnight (Figure 5(c)).
Density plots between ω, ν1 and ν2 show that over the ocean, having ω > 0.5 and λ1 from 00:00 - 12:00 tend to have relatively high ν1 and low ν2, while having ω ≤ 0.5 have low ν1 and high ν2 (Figures 5(d) and 5(e)). These relationships can also be found in the case of the continent in which values of ω from 0.2 - 0.6 mainly were found to have values of ν1 from 0.2 - 0.4 and that of ν2 from 0.65 - 0.85. These indicate that, both over the ocean and the continent, the value of ν1 increases with ω and that of ν2 decreases with ω as well as ν1. As the first subdistribution dominates, its shape tends to be flatter. It resembles a more significant uniform distribution, while that of the second subdistribution tends to be more localized and resembles a smaller normal distribution.
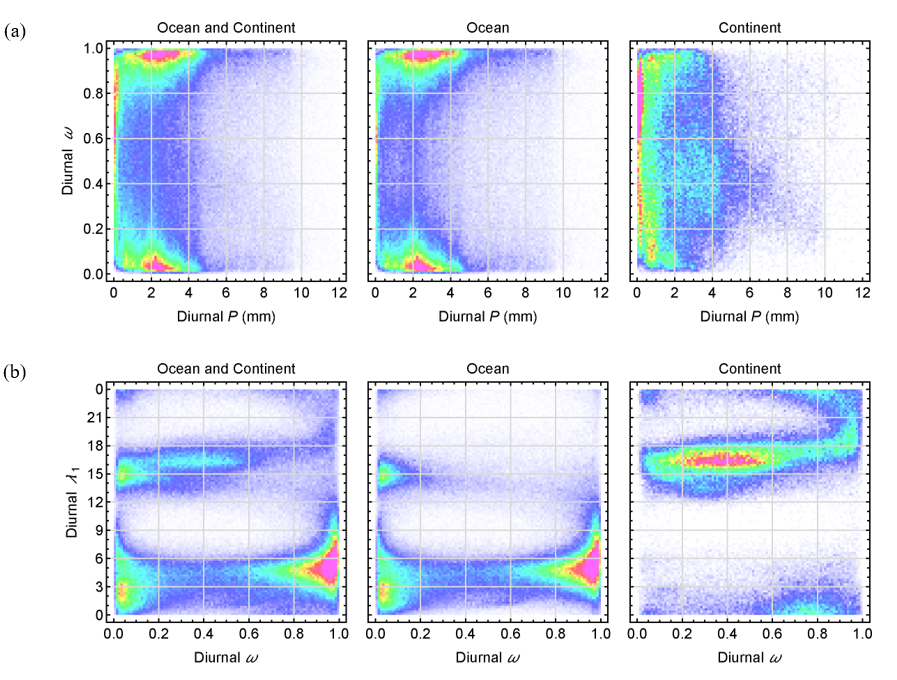
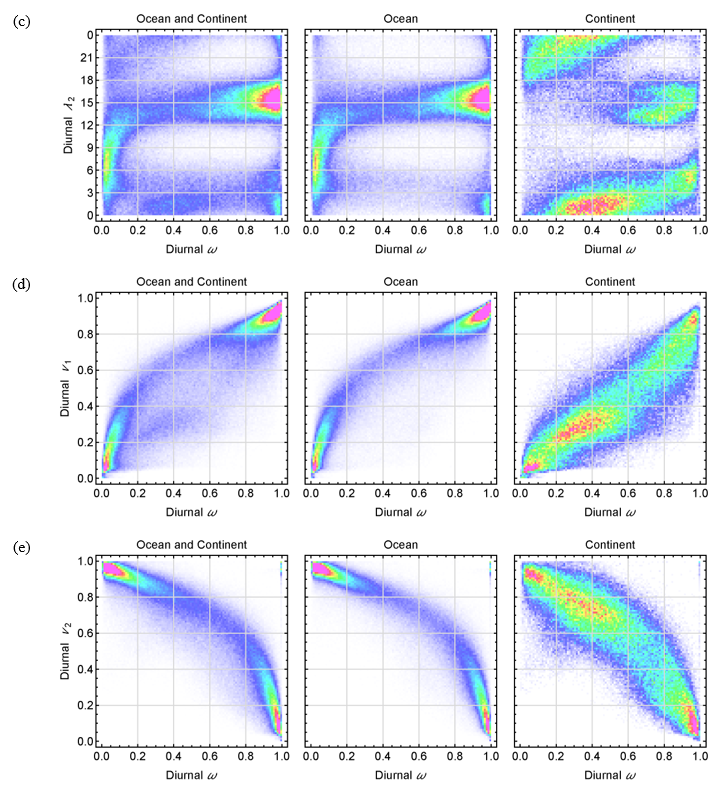
Figure 5 Density plots showing the relationship between two fundamental parameters of the diurnal cycle: P and ω (a), ω and λ1 (b), ω and λ2 (c), ω and ν1 (d), and ω and ν2 (e). Each pair of parameters was separated into three plots, including the combined ocean and continent (left), the ocean (middle), and the continent (right). Colors in each plot represent the relative area density within the plot itself and cannot be compared with other plots.
Overall, the spatial and statistical patterns of the fundamental parameters highlight the contrasting nature of diurnal precipitation over land and ocean. Over land, afternoon convective activity produces bimodal patterns with greater variability, while over the ocean, the predominance of nocturnal and early-morning rainfall is reflected in more uniform, unimodal distributions.
The Goodness-of-Fit of bimodal von mises distributions
To assess the accuracy of the bimodal von Mises model in representing the observed diurnal precipitation cycle, the goodness-of-fit was evaluated using the RMSE and its relative value compared to the average diurnal precipitation P. These metrics help identify regions where the model performs best and where its assumptions may be less applicable. In addition to the general relationship whereby higher diurnal RMSE values correspond to regions with higher P, it was observed that RMSE values over the continent are slightly greater than those over the ocean, particularly across maritime Southeast Asia, central Africa, and the Amazon Basin (Figures 3(a) and 6(a)).
The histograms in Figure 7 summarize the global distribution of both absolute and relative RMSE values over land and ocean. Over the ocean, 95% of the total area was found to have an RMSE of less than about 0.011 mm/h and concentrated at 0.002 mm/h, while that of over the continent also peaked at the same value with 95% of the area have an RMSE of less than 0.026 mm/h (Figure 7(a)). However, these values are less than 1% compared to their diurnal P (Figure 7(b)). Regions having high relative RMSE can be found in high-pressure regions such as the Pacific Ocean, the Atlantic Ocean, the Sahara, and the Middle East (Figure 6(b)). These regions correspond to areas of persistently low precipitation or strong atmospheric stability, where the diurnal cycle is weak or irregular, making it less well captured by the model. Overall, the bimodal von Mises model reproduces the diurnal precipitation pattern with very small residual errors, confirming its suitability for large-scale applications.
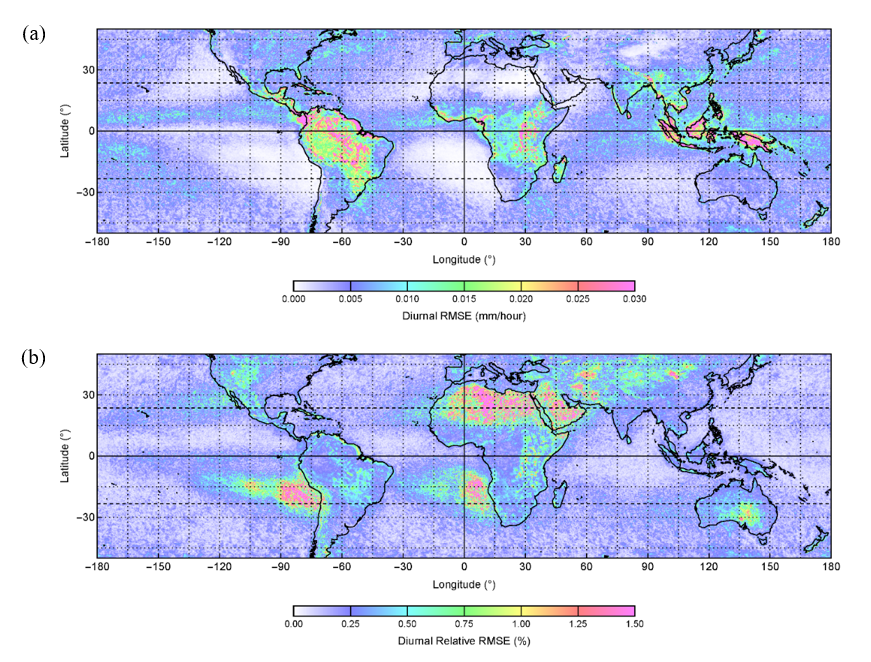
Figure 6 Maps showing the goodness-of-fit of the diurnal cycle: The diurnal RMSE (a) and its relative value compared to diurnal P in percentage (b).
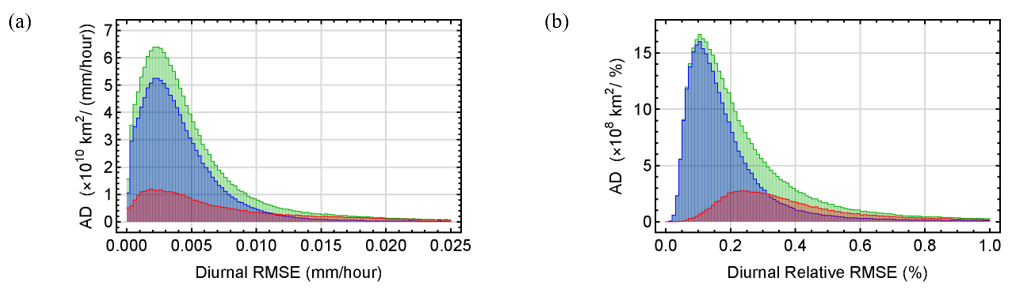
Figure 7 Histograms showing the Area Density (AD) of RMSE and its relative value as shown in Figures 6(a) and 6(b).
It can also be seen that the RMSE over the continent increases with P at a higher rate than the ocean (Figure 8(a)). However, it can be found that these values decrease exponentially with P, which is asymptotic to about 0.1% over the ocean and about 0.2% over the continent (Figure 8(b)). Overall, the small and spatially consistent RMSE values indicate that the bimodal von Mises distribution adequately represents the observed diurnal precipitation patterns across both continental and oceanic regions. The low residual errors show that the model reproduces the main timing and amplitude of the diurnal cycle within the limits of the satellite data used.
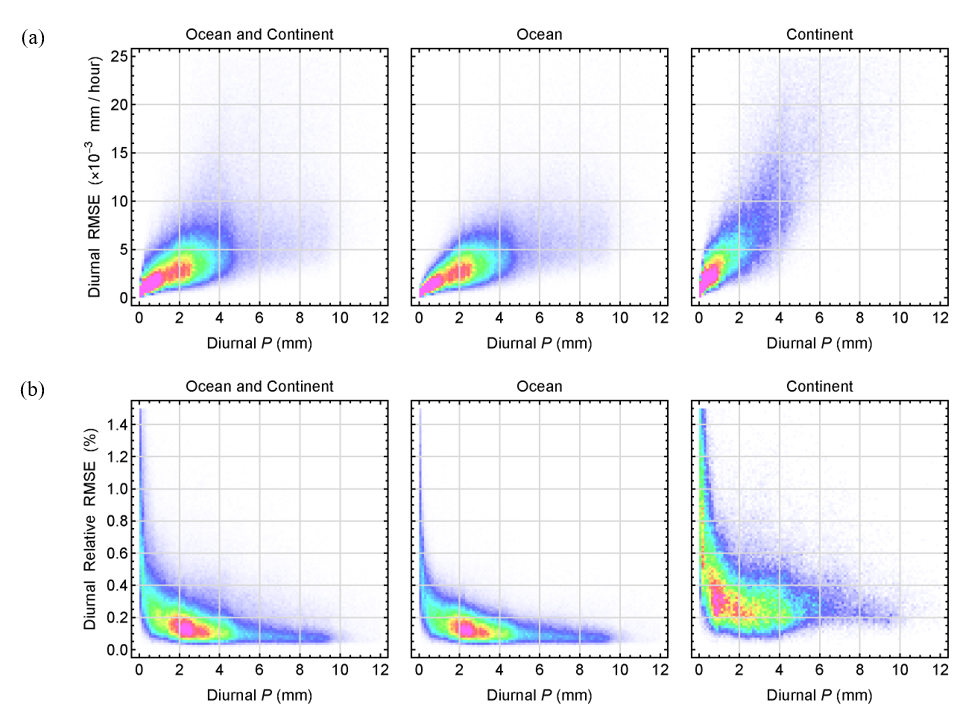
Figure 8 Density plots showing the relationship between P and RMSE (a) and between P and the relative RMSE (b).
Timings and rates of precipitation maxima and minima
To better understand the temporal structure of the diurnal precipitation cycle, the estimated timings of precipitation maxima and minima (λx1, λn1, λx2 and λn2) were derived from the bimodal von Mises parameters. These quantities represent the timing of dominant and secondary rainfall peaks and troughs within a 24-hour period, providing insight into the phase and propagation of precipitation events. The estimated timings are shown in (Figures 9(a) - 9(d)). The spatial distributions and histograms of λx1 are similar to those of λ1, with 95% of λx1−λ1 values ranging from −1.054 - +1.285 h, suggesting that λ₁ is a good approximation of λx1 (Figures 3(c), 4(c), 9(a), and 10(a)). This close correspondence confirms that λ1 can effectively represent the timing of the primary diurnal precipitation maximum across most regions.
In the case of λn1, it can be seen that the timings of the first minimum precipitation over the ocean and the continent are different (Figures 9(b) and 10(c)). Over the ocean, values of λn1 mainly were found to concentrate around 20:00 in which the majority of them were found to be associated with λx1 at around 05:00, while over the continent, only one significant peak can be found around 09:00 and primarily associated with λx1 of around 14:00 and 00:00 (Figures 10(a) and 10(c)).
However, some areas over the ocean (especially around the equator, south of the Tropic of Cancer, and north of the Tropic of Capricorn) show λn1 values that are similar to those over the continent, which concentrate around noon (Figures 9(b) and 10(c)). There are also some areas over the continent (such as some areas in China and the Himalayas in Asia, some areas in the eastern part of central Africa, the Andes, some areas near the Amazon River, and around the Parana River in South America) in which their λn1 values are similar to that of over the ocean in which λn1 usually occurs in the nighttime (Figure 9(b)). These contrasting timings reflect the difference between convective and stratiform rainfall regimes. Over land, afternoon heating drives precipitation peaks followed by morning minima, while over the ocean, nighttime cooling leads to early-morning peaks and evening minima.
The secondary maximum (λx2) and minimum (λn2) exhibit phase relationships with the primary cycle that vary between land and ocean regions. For λx2 values over the ocean, a peak around 14:30 was found to be associated with λx1 peak at 05:00, and another peak at 03:30 comes from λx1 of around 14:00 (Figures 10(a) and 10(b)). For λx values over the continent, λx2 peaks around 01:00 and 13:30 were found to be associated with λx1 peaks around 17:00 and 00:00, respectively. However, histograms of λn2 values are different in that two peaks of λx1 over the ocean were found to contribute to both peaks of λn2 around 11:00 and 20:30, also with two peaks of λx1 over the continent, which were found to contribute to λn2 peaks around 20:00 and 08:00 (Figures 10(a) and 10(d)).
These derived parameters λx1, λn1, λx2 and λn2, which characterize timings of diurnal precipitation maxima and minima, were found to have interesting mutual relationships. Histograms of λx2−λx1, λn1−λx1, λn2−λx1 and λn2−λx2 can be described using the same explanation drawn in the case of the annual cycle (Figures 11(a) - 11(d)). In the case of bimodal variation, if λx2 is located before that of λx1 (λx2 followed by λx1 in less than 12 h, cyan bins in Figure 11(a)), then values of λn1, λx2 and λn2 were found to concentrate around 7, 14 and 18 h after λx1, respectively (cyan bins in Figures 11(b) - 11(d)). And if λx2 is located after that of λx1 (λx2 follows λx1 in less than 12 h, yellow bins in Figure 11(a)), then values of λn2, λx2 and λn1 seem to follow λx1 by about 6.5, 10.5 and 16 h, respectively (yellow bins in Figures 11(b) - 11(d)). Notice that these two sequences are merely mirroring each other around λx1. In the case of unimodal variation in which only the first precipitation maximum and minimum exist, λn1 tends to be concentrated around 9 and 15 h after λx1 (grey bins in Figure 11(b)). These relationships confirm that the bimodal diurnal cycle typically consists of two alternating rainfall peaks separated by 10 - 12 h, consistent with physical processes such as daytime convection and nighttime radiative or gravity-wave-driven precipitation. The distinct phase timings of precipitation maxima and minima thus provide the temporal foundation for the subsequent spatial classification of diurnal precipitation patterns.
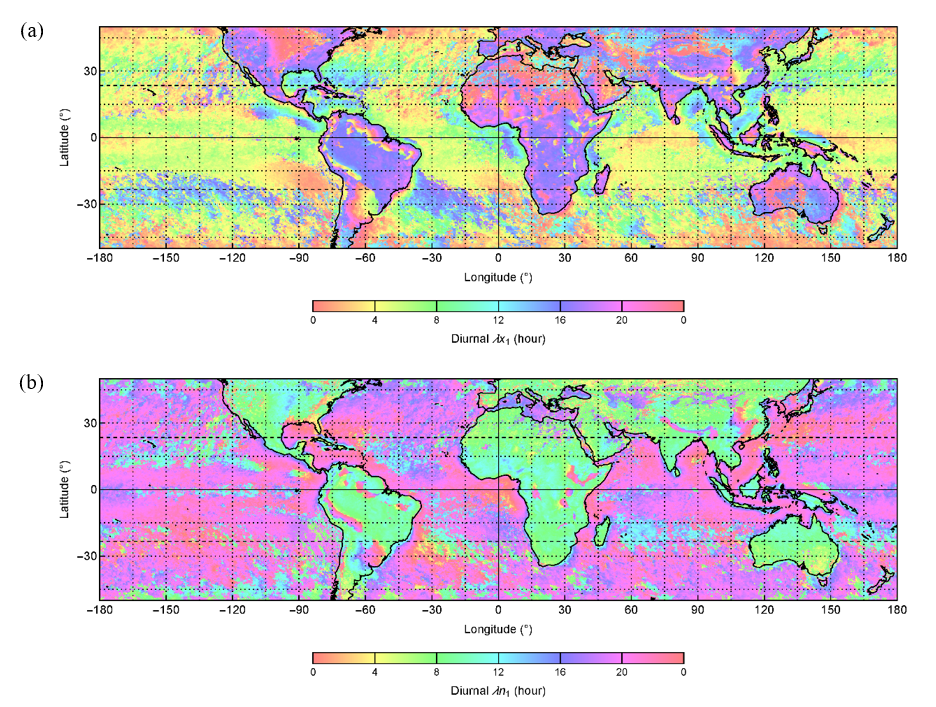
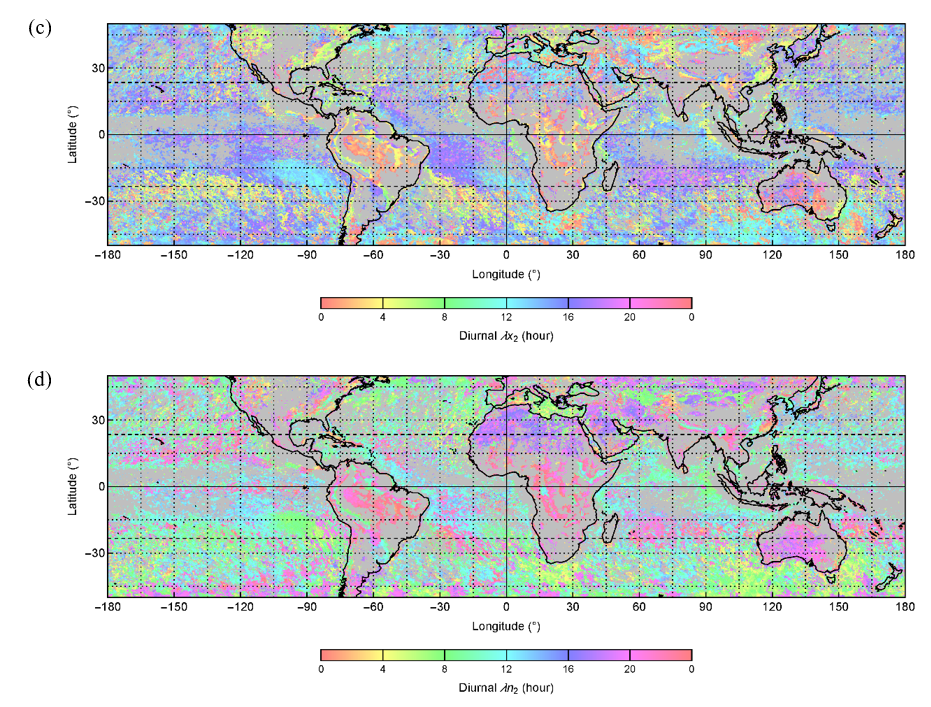
Figure 9 Maps showing λx1 (a), λn1 (b), λx2 (c), λn2 (d) of the diurnal cycle of precipitation. Areas where there is no second maximum and minimum (the unimodal variation) are shown in grey.
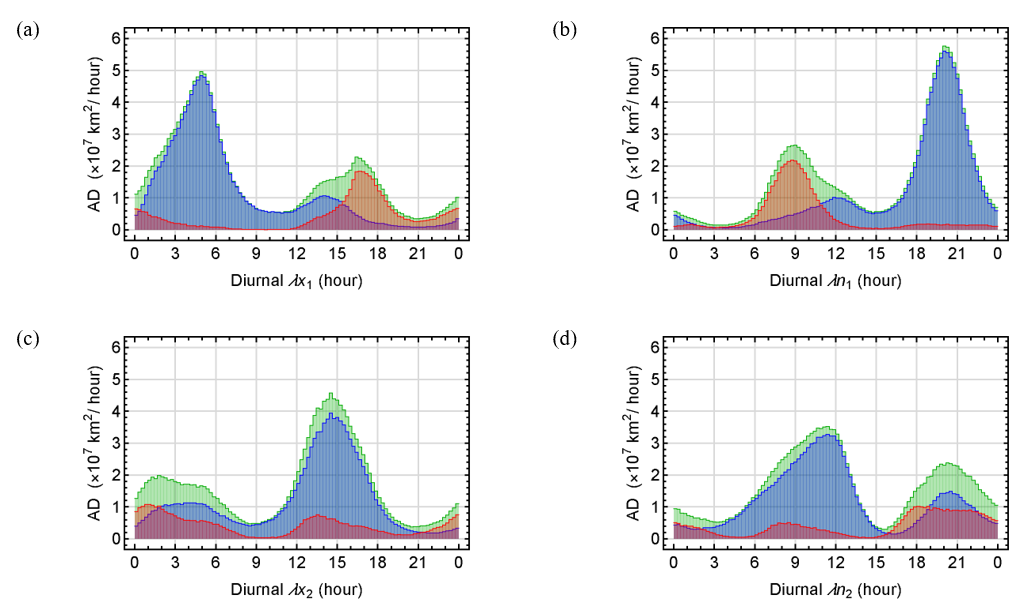
Figure 10 Histograms show each derived parameter’s Area Density (AD).
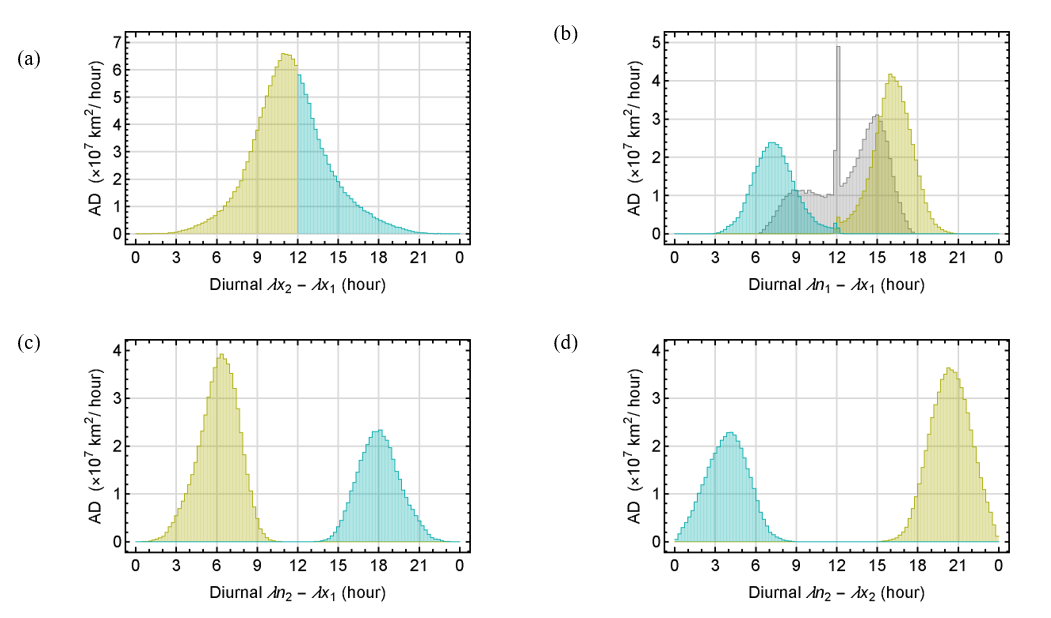
Figure 11 Histograms showing distributions of λx2−λx1 (a), λn1−λx1 (b), λn2−λx1 (c) and λn2−λx2 (d). Values associated with 0 h ≤ λx2−λx1 < 6 h are shown in yellow, 12 h ≤ λx2−λx1 < 24 h are shown in cyan, and no second maximum and minimum exist are shown in grey.
Diurnal precipitation behavior
To interpret the diversity of diurnal precipitation, the derived timing parameters (λx1, λn1, λx2 and λn2) were analyzed jointly. Density plots of λx1 versus λn1 reveal that diurnal precipitation can be grouped into 4 main classes A – D based on specific thresholds of λx1−λn1 and λx1+λn1 (Table 2 and Figure 12(a)). These classes describe dominant phase relationships between precipitation maxima and minima. Within each class, subclasses 0 – 4 indicate unimodal or bimodal behavior: Subclass 0 represents unimodal, whereas subclasses 1 – 4 represent distinct bimodal patterns.
Consistent results are obtained when examining λx2 and λn2, where the same criteria separate bimodal cases into four subclasses (Table 2 and Figure 12(b)). For regions exhibiting unimodal variation, only λx1 and λn1 are present and subclass 0 is assigned. The resulting regional classification is summarized in Table 3 and Figures 13(a) and 13(b). The thresholds, set at 6-hour intervals for simplicity and practical use, also align with the natural diurnal heating-cooling cycle. Small shifts to these boundaries do not affect classification, since most grid cells lie far from the boundary regions.
The diurnal precipitation of class A0 (unimodal daytime convective type) and A4 (major daytime convective with minor nighttime stratiform type) represent regions where precipitation peaks in the late afternoon to evening and diminishes by morning, corresponding to the typical convective diurnal cycle. They were usually found over the continent, with λx1 occurring from the late afternoon to evening (15:00 – 21:00) and λn1 in the morning (06:00 – 12:00), while λx2 and λn2 in the case of A4 occur from before midnight to dawn (21:00 – 06:00) and from the evening to after midnight (18:00 – 03:00) respectively (Figures 13(a) and 13(b)). This phase structure reflects a classic land-atmosphere diurnal regime, where surface heating initiates deep convection in the afternoon, followed by the gradual transition to stratiform precipitation as convective systems mature and propagate into the evening and early night. It is evident that this class belongs to the diurnal cycle in which the convective precipitation from daytime heating dominates, and the stratiform precipitation from nighttime cooling also appears in the case of the bimodal variation [32].
Classes B0, B3, C0 and C2 occur in transitional zones and mountainous regions, where multiple precipitation processes interact. Large regions of classes B0 (unimodal nighttime convective type) and B3 (major nighttime convective with minor daytime orographic type) can be found in the high-pressure regions encircling the Earth both in the Northern and Southern Hemisphere, including the Sahara, the Middle East, and central Australia, as well as some latitudinal bands over the ocean (Figures 13(a) and 13(b)). The λx1 values of B0 and B3 typically occur between before midnight to dawn (21:00 – 06:00), and that of λn1 are between the early mornings to early afternoon (06:00 – 15:00).
Table 2 Criteria of classes and subclasses used in the spatial classification of the diurnal precipitation. Note that precipitation type for subclass 0 represents unimodal variation, while that for 1 – 4 are for secondary peak only. (λx. And λn. Represent λx1 and λn1 for classes, and λx2 and λn2 for subclasses).
Class or Subclass |
Criterion |
A or 1 (Daytime Convective) |
0 < λx.−λn. < 12 and 12 < λx.+λn. < 36 |
B or 2 (Nighttime Convective) |
(−12 < λx.−λn. < 0 and 0 < λx.+λn. < 24) or (12 < λx.−λn. < 24 and 24 < λx.+λn. < 36) |
C or 3 (Daytime Orographic) |
(−12 < λx.−λn. < 0 and 24 < λx.+λn. < 48) or (12 < λx.−λn. < 24 and 12 < λx.+λn. < 24) |
D or 4 (Nighttime Stratiform) |
Class is not “A”, “B” and “C”. Subclass is not “0”, “1”, “2” and “3”. |
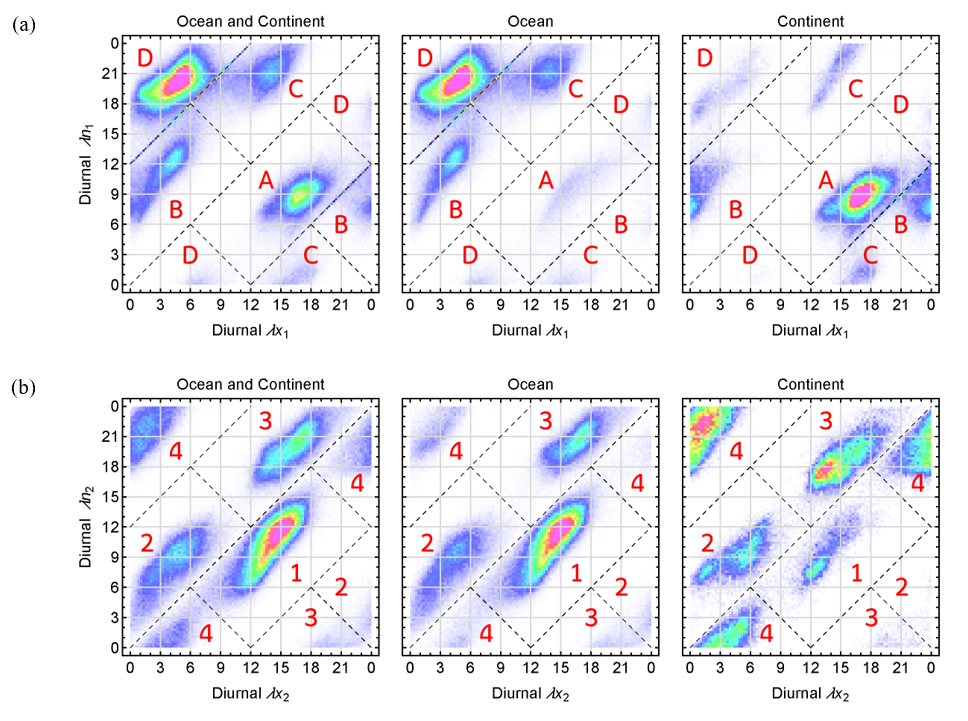
Figure 12 Density plots showing the relationship between λx1 and λn1 (a) and between λx2 and λn2 (b). Dashed lines represent the boundary of each class or subclass.
Table 3 Areas (from 50°S - 50° N) of all diurnal precipitation classes in percentage. Classes and subclasses are designated with a letter and a number, respectively. A subclass with the number “0” represents the unimodal variation, while the rest represents different bimodal variations.
Class/ Subclass |
0 |
1 |
2 |
3 |
4 |
Total |
A |
10.00 |
0.13 |
0.00 |
0.04 |
9.32 |
19.49 |
B |
5.28 |
0.01 |
0.33 |
12.05 |
0.02 |
17.69 |
C |
5.74 |
0.05 |
10.24 |
0.21 |
0.00 |
16.24 |
D |
19.89 |
26.09 |
0.09 |
0.01 |
0.51 |
46.59 |
Total |
40.91 |
26.28 |
10.66 |
12.31 |
9.85 |
100.00 |
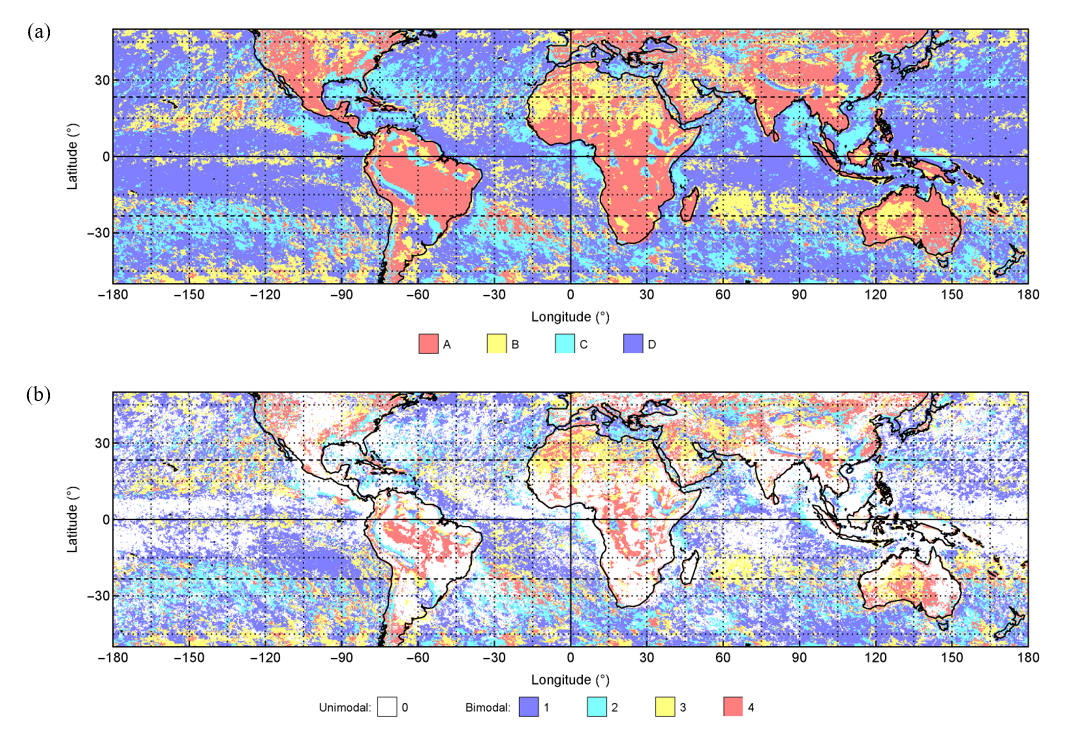
Figure 13 Maps showing the diurnal precipitation classification results including classes (a) and subclasses (b).
In the case of the bimodal variation, their λx2 and λn2 values occur from the early afternoon to evening (12:00 - 21:00) and from the late afternoon to before midnight (15:00 - 00:00), respectively. This timing pattern reflects nocturnal convective activity that develops above a stable surface layer, consistent with elevated or dynamically forced convection in dry subtropical regions and nighttime oceanic convection in adjacent subtropical belts. It can be seen that classes B0 and B3 represent a nocturnal precipitation regime characteristic of the dry subtropics and subtropical oceans, where convection tends to occur aloft and peak at night due to radiatively driven destabilization and low-level jet convergence rather than surface heating [33].
Classes C0 (unimodal daytime orographic type) and C2 (major daytime orographic with minor nighttime convective type) can be found in some areas over the continent as well as over the ocean, such as around Southeast Asia, the west of central Africa, and around central America (Figures 13(a) and 13(b)). Their λx1 values occur in the afternoon (12:00 - 18:00), and that of λn1 are between the evening and after midnight (18:00 - 03:00). And in the case of the bimodal variation, their λx2 and λn2 values occur from after midnight to early morning (00:00 - 09:00) and from dawn to late morning (03:00 - 12:00), respectively. These classes reflect regions where daytime convergence initiated by terrain heating or coastal sea breeze circulation triggers convective development, with occasional nighttime convection in the bimodal cases. C-type behavior over the ocean likely represents a marine diurnal warm layer effect and associated afternoon enhancement of shallow convection rather than topographic forcing [34].
Classes D0 (unimodal nighttime stratiform type) and D1 (major nighttime stratiform with minor daytime convective type) represent nighttime-dominant precipitation associated with stratiform rainfall. They can be primarily found over the ocean, with λx1 mainly occurring from after midnight to early morning (00:00 - 09:00) and λn1 from the late afternoon to before midnight (15:00 - 00:00). In the case of the bimodal variation, the λx2 and λn2 values for D1 occur from the late morning to late afternoon (09:00 - 18:00) and from the early morning to early afternoon (06:00 - 15:00), respectively (Figures 13(a) and 13(b)). This class reflects the well-known nocturnal enhancement of stratiform rainfall over the ocean, where radiative cooling at cloud top and the maturation of convective systems favor stable layer deepening and widespread stratiform precipitation. In the bimodal case, a weaker daytime convective peak associated with daytime surface heating or shallow oceanic convection can also be observed [35].
Moreover, classes C0, C2, D0, D1, B0 and B3 can be clearly identified along major mountain ranges such as the Himalayas in Asia and the Andes in South America (Figures 13(a) and 13(b)). As warm and moist winds ascend from lower elevations along the windward slopes, the rising air cools and condenses, producing orographic precipitation with C0 and C2 behavior that peaks in the afternoon through convective processes [36]. Where terrain is sufficiently high, continued ascent and cooling over the crests support nocturnal or early morning stratiform precipitation characteristic of D0 and D1 classes. On the leeward side, descending air becomes drier and more stable, leading to B0 and B3 patterns with weaker precipitation or delayed nocturnal rainfall linked to elevated convection rather than surface heating. This progression illustrates how diurnal rainfall organization responds to terrain: uplifting moist air enhances afternoon convection on windward slopes, while subsiding and stabilizing air suppresses or delays precipitation on leeward slopes.
The spatial sequence of classes C, D and B closely corresponds to the temporal criteria in Table 2, which define how rainfall maxima and minima occur within the diurnal cycle. Class C typically appears on windward slopes where daytime heating and upslope flow support afternoon convection. Class D emerges over high terrain and adjacent regions where nocturnal stratiform or early morning rainfall develops as convective systems mature. Class B occurs on leeward slopes where precipitation is weaker or delayed and often associated with elevated nocturnal convection under stable near-surface conditions. These spatial and temporal patterns confirm that the classification captures key processes shaping orographic diurnal precipitation.
Overall, the spatial distribution of the diurnal precipitation classes reveals clear geographical structure. Afternoon convective regimes dominate continental interiors, nocturnal stratiform regimes prevail over warm oceans, and mixed or transition patterns arise in regions influenced by mountains and coastal circulations. This framework provides a physically grounded interpretation of the mechanisms governing diurnal rainfall across the tropics and subtropics.
Conclusions
The diurnal cycle of precipitation remains a fundamental component of the climate system due to its role in modulating boundary-layer processes, convective organization, hydrological extremes, and model performance. Numerous studies have established that rainfall over land generally peaks during the late afternoon, whereas oceanic precipitation is more likely to maximize during the early morning hours. Classical harmonic techniques, however, often struggle to capture abrupt phase transitions, asymmetric distributions, or complex signals in regions with steep topography, heterogeneous land-sea contrasts, and semi-arid environments. Here, a circular statistical framework is applied to overcome these limitations by representing both unimodal and bimodal variations, yielding improved fidelity in identifying spatial variability and peak timing.
The analysis is based on a bimodal von Mises distribution, which provides a parametric representation of hourly rainfall occurrence and intensity. This approach accommodates asymmetric and dual-peak diurnal structures that are frequently under-resolved by traditional Fourier decomposition. Its parameters quantify timing, phase concentration, and relative mode contribution, thereby enabling a compact yet robust description of sub-daily rainfall variability. The resulting global classification indicates widespread bimodal behavior over continents and orographically influenced regions, whereas unimodal variation dominate most ocean basins and subtropical high-pressure zones.
It is important to note that the proposed circular-statistical framework is less effective in extremely dry or high-pressure regions where precipitation is sparse, intermittent, or lacks a meaningful diurnal structure. In such environments, the model may yield higher relative errors simply because no coherent daily cycle exists to be captured. Defining a strict precipitation threshold below which the method ‘fails’ is not universal, as practitioners may adopt different criteria depending on their scientific or operational needs. Users may therefore select an appropriate cutoff value based on the local mean diurnal precipitation P, choosing a level below which the diurnal cycle is physically irrelevant for their application.
Physical interpretation of the classification reveals clear mechanistic linkages. Afternoon and evening maxima over land correspond to surface heating, boundary-layer growth, and orographic circulations. Nocturnal peaks over oceans and high terrain are consistent with stratiform precipitation sustained by radiative cooling, gravity-wave adjustments, and offshore propagating convection. The concentration metrics and probability ratio ω further delineate transitions between convective and stratiform regimes across diverse climate zones. By integrating these signals within a unified diagnostic framework, this study provides improved quantitative constraints on the diurnal organization of rainfall and contributes to process-oriented evaluation of satellite products and regional climate simulations.
The classification also has applied value. Reliable characterization of sub-daily rainfall structure can inform reservoir operation, irrigation scheduling, flood-hazard assessment, and hydropower management in vulnerable regions. Identifying areas with highly concentrated or irregular rainfall regimes supports water-resource planning, agricultural timing decisions, and early-warning system design. Such information is especially relevant in rapidly urbanizing tropical and subtropical regions, where afternoon convection or nocturnal convective events can disrupt urban operations, strain drainage systems, and elevate hydrometeorological risk. Accordingly, improved representation of the diurnal cycle has direct implications for climate resilience, infrastructure design, and adaptation planning.
Although the circular statistical framework improves representation of complex diurnal rainfall structures, several limitations remain. The method characterizes timing and distribution but does not explicitly resolve mesoscale dynamics or moisture transport processes. Uncertainties are also possible in regions with sparse observations or intermittent rainfall, where satellite retrieval limitations may influence results. In addition, the analysis focuses on climatological behavior rather than interannual variability, seasonality, or responses to modes such as ENSO and the MJO. Future work will integrate atmospheric reanalyses, convection-permitting simulations, and process-diagnostic fields (for example, radiative heating, low-level jets, and surface fluxes) to strengthen physical attribution, evaluate model performance, and extend applications to subseasonal prediction and climate-change assessment.
Acknowledgements
This study was supported by Walailak University’s, Thailand research fund (grant number WU66254). The shoreline and political boundaries data are from the Global Self-consistent, Hierarchical, High-resolution Geography (GSHHG) database version 2.3.7 (https://www.soest.hawaii.edu/pwessel/gshhg).
Declaration of Generative AI in Scientific Writing
Generative AI tools were used in this study only to improve the readability and language of the manuscript. All content, data interpretation, analysis, and conclusions were produced and verified by the authors. The use of AI-assisted technologies was conducted under full human oversight, and the authors take complete responsibility for the accuracy and integrity of the final text.
CRediT Author Statement
Peeravit Koad: Conceptualization; Methodology; Software; Formal analysis; Investigation; Data Curation; Writing – Original Draft. Chanankorn Jandaeng: Validation; Resources; Writing – Review & Editing; Supervision. Jongsuk Kongsen: Validation; Formal analysis; Investigation; Writing – Review & Editing; Supervision. Sirirat Somchuea: Conceptualization; Methodology; Investigation; Project administration; Funding acquisition.
References
[1] GR McGregor and S Nieuwolt. Tropical climatology: An introduction to the climates of the low latitudes. 2nd ed. John Wiley & Sons, Chichester, 1998.
[2] RG Barry and RJ Chorley. Atmosphere, weather and climate. 9th ed. Routledge, New York, 2010.
[3] P Koad and K Jaroensutasinee. Annual cycle of tropical and subtropical precipitation estimated from TMPA 3B42 dataset. Asia-Pacific Journal of Atmospheric Sciences 2021; 57, 235-260.
[4] T Chen, G Xia, LT Wilson, W Chen and D Chi. Trend and cycle analysis of annual and seasonal precipitation in Liaoning, China. Advances in Meteorology 2016; 2016, 5170563.
[5] M Gehne, TM Hamill, GN Kiladis and KE Trenberth. Comparison of global precipitation estimates across a range of temporal and spatial scales. Journal of Climate 2016; 29(21), 7773-7795.
[6] M Rusticucci and O Penalba. Interdecadal changes in the seasonal precipitation cycle over southern South America and their relationship with surface temperature. Climate Research 2000; 16(1), 1-15.
[7] MF Rios Gaona and G Villarini. Characterization of the diurnal cycle of maximum rainfall in tropical cyclones. Journal of Hydrology 2018; 564, 997-1007.
[8] S Tang, P Gleckler, S Xie, J Lee, M Ahn, C Covey and C Zhang. Evaluating the diurnal and semidiurnal cycle of precipitation in CMIP6 models using satellite- and ground-based observations. Journal of Climate 2021; 34(8), 3189-3210.
[9] P Bechtold, JP Chaboureau, A Beljaars, AK Betts, M Köhler, M Miller and JL Redelsperger. The simulation of the diurnal cycle of convective precipitation over land in a global model. Quarterly Journal of the Royal Meteorological Society 2004; 130(604), 3119-3137.
[10] S Ogino, DM Yamanaka, S Mori and J Matsumoto. Tropical coastal dehydrator in global atmospheric water circulation. Geophysical Research Letters 2017; 44(22), 11636-11643.
[11] T Ohsawa, H Ueda, T Hayashi, A Watanabe and J Matsumoto. Diurnal variations of convective activity and rainfall in tropical Asia. Journal of the Meteorological Society of Japan 2001; 79(1), 333-352.
[12] S Yang and EA Smith. Convective–stratiform precipitation variability at seasonal scale from 8 yr of TRMM observations: Implications for multiple modes of diurnal variability. Journal of Climate 2008; 21(16), 4087-4114.
[13] H He and F Zhang. Diurnal variations of warm-season precipitation over Northern China. Monthly Weather Review 2010; 138(4), 1017-1025.
[14] S Sugimoto, K Ueno, H Fujinami, T Nasuno, T Sato and HG Takahashi. Cloud-resolving-model simulations of nocturnal precipitation over the Himalayan slopes and foothills. Journal of Hydrometeorology 2021; 22(12), 3171-3188.
[15] R Yu, J Li, H Chen and W Yuan. Progress in studies of the precipitation diurnal variation over contiguous China. Journal of Meteorological Research 2014; 28, 877-902.
[16] S Yang and EA Smith. Mechanisms for diurnal variability of global tropical rainfall observed from TRMM. Journal of Climate 2006; 19(20), 5190-5226.
[17] P Koad, S Somchuea, J Weekaew and J Kongsen. Spatiotemporal analysis of Southeast Asian lower atmosphere using historical radiosonde data. Trends in Sciences 2023; 20(1), 6190.
[18] F Dong, X Zhi, S Zhu, L Zhang, F Ge, Y Fan, Y Lyu, J Wang and K Fraedrich. Principal modes of diurnal cycle of rainfall over South China during the presummer rainy season. Journal of Climate 2023; 36(8), 2457-2470.
[19] F Dong, X Zhi, L Zhang and C Ye. Diurnal variations of coastal boundary layer jets over the northern South China Sea and their impacts on the diurnal cycle of rainfall over southern China during the early-summer rainy season. Monthly Weather Review 2021; 149(10), 3341-3363.
[20] TT Warner, BE Mapes and M Xu. Diurnal patterns of rainfall in northwestern South America. Part II: Model simulations. Monthly Weather Review 2003; 131(5), 813-829.
[21] H Bai, G Deranadyan, C Schumacher, A Funk, C Epifanio, A Ali, E Endarwin, F Radjab, R Adriyanto, N Nurhayati, Y Nugraha and A Fauziah. Formation of nocturnal offshore rainfall near the west coast of Sumatra: Land breeze or gravity wave? Monthly Weather Review 2021; 149(3), 715-731.
[22] S Gao, X Cui and X Li. A modeling study of diurnal rainfall variations during the 21-day period of TOGA COARE. Advances in Atmospheric Sciences 2009; 26, 895-905.
[23] A Dai. Global precipitation and thunderstorm frequencies. Part II: Diurnal variations. Journal of Climate 2001; 14(6), 1112-1128.
[24] CH Sui, KM Lau, YN Takayabu and DA Short. Diurnal variations in tropical oceanic cumulus convection during TOGA COARE. Journal of the Atmospheric Sciences 1997; 54(5), 639-655.
[25] C Liu and E Zipser. Diurnal cycles of precipitation, clouds, and lightning in the tropics from 9 years of TRMM observations. Geophysical Research Letters 2008; 35(4), 04819.
[26] GJ Huffman, DT Bolvin, EJ Nelkin, DB Wolff, RF Adler, G Gu, Y Hong, KP Bowman and EF Stocker. The TRMM Multi-satellite Precipitation Analysis (TMPA): Quasi-global, multiyear, combined-sensor precipitation estimates at fine scales. Journal of Hydrometeorology 2007; 8(1), 38-55.
[27] GJ Huffman, DT Bolvin, D Braithwaite, K Hsu, R Joyce, C Kidd, EJ Nelkin, S Sorooshian and J Tan. NASA Global Precipitation Measurement (GPM) Integrated Multi-Satellite Retrievals for GPM (IMERG). National Aeronautics and Space Administration, Washington DC, 2025.
[28] A Miniak-Górecka, K Podlaski and T Gwizdałła. Using k-means clustering in Python with periodic boundary conditions. Symmetry 2022; 14(6), 1237.
[29] M Vejmelka, P Musilek, M Palus and E Pelikan. K-means clustering for problems with periodic attributes. International Journal of Pattern Recognition and Artificial Intelligence 2009; 23(4), 721-743.
[30] R Yu, W Yuan, J Li and Y Fu. Diurnal phase of late-night against late-afternoon of stratiform and convective precipitation in summer southern contiguous China. Climate Dynamics 2010; 35, 567-576.
[31] YG Yang and J Slingo. The diurnal cycle in the tropics. Monthly Weather Review 2001; 129(4), 784-801.
[32] KMR Hunt, AG Turner and RKH Schiemann. Katabatic and convective processes drive two preferred peaks in the precipitation diurnal cycle over the Central Himalaya. Quarterly Journal of the Royal Meteorological Society 2022; 148(745), 1731-1751.
[33] JHR Jr and C Hohenegger. Diurnal circulation adjustment and organized deep convection. Ruppert and hohenegger 2018; 31(12), 4899-4916.
[34] R Shevchenko, C Hohenegger and M Schmitt. Impact of diurnal warm layers on atmospheric convection. Journal of Geophysical Research: Atmospheres 2023; 128(14), 2022JD038473.
[35] P Singh and V Matsumoto. Diurnal variation in summer precipitation over the central Tibetan Plateau. Journal of Geophysical Research: Atmospheres 2009; 114(20), 20107.
[36] RA Houze Jr. Orographic effects on precipitating clouds. Reviews of Geophysics 2012; 50(1), 1001.