Trends
Sci.
2026;
23(7):
12541
Synthesis of MWCNTs/AC-Based Supercapacitor Electrode Composite and Analysis Using a Three-Electrode System with Various Electrolyte Concentrations
Agus Subagio1,*, Heydar Ruffa Taufiq1, Heri Sutanto1, Risma Aimatul Qudsiyah1,
Markus Diantoro2, Ishmah Luthfiyah2, Agus Purwanto3 and Worawat Meeyasana4
1Department of Physics, Faculty of Science and Mathematics, Universitas Diponegoro, Semarang 50275, Indonesia
2Department of Physics, Faculty of Mathematics and Sciences, Universitas Negeri Malang, Malang 65145, Indonesia
3Department of Chemical Engineering, Faculty of Engineering, Universitas Sebelas Maret, Surakarta 57126, Indonesia
4School of Physics, Institute of Science, Suranaree University of Technology, Nakhon Ratchasima 30000, Thailand
(*Corresponding author’s e-mail: [email protected])
Received: 5 November 2025, Revised: 3 December 2025, Accepted: 15 December 2025, Published: 15 February 2026
Abstract
The limited electrical conductivity and pore utilization of conventional activated-carbon-based electrodes often restrict the achievable energy density of supercapacitors, especially when electrolyte conditions are not optimally engineered. This study aims to overcome these limitations by developing a multiwalled carbon nanotubes/activated carbon (MWCNTs/AC) composite electrode and systematically elucidating the role of H2SO4 electrolyte concentration on its electrochemical performance using a three-electrode configuration. The MWCNTs/AC composite was fabricated via a simple physical–chemical route and deposited on copper foil, while its structural and morphological characteristics were confirmed by XRD, SEM, and TEM analyses, which demonstrated successful integration of conductive MWCNT networks within the porous AC matrix. Electrochemical behavior was evaluated by cyclic voltammetry, galvanostatic charge–discharge, and electrochemical impedance spectroscopy at H2SO4 concentrations of 0.05, 0.1, 0.5, and 1 M to clarify the correlation between ion availability, charge-transfer resistance, and double-layer formation. Optimized electrolyte engineering at 1 M H2SO4 yielded a high specific capacitance of 528.57 F g⁻¹, with an energy density of 436.73 Wh g⁻¹, a power density of 391 W g⁻¹, and excellent cycling stability of 98.89% after 5,000 cycles, indicating efficient ion transport and low internal resistance. Compared with previous carbon-based systems, the combined strategy of tailoring both the MWCNTs/AC composite architecture and electrolyte concentration provides a clear pathway to simultaneously enhance capacitance, energy density, and durability, highlighting the MWCNTs/AC electrode as a promising candidate for high-performance aqueous supercapacitors.
Keywords: Supercapacitor, MWCNTs, Activated carbon, H2SO4, Electrolyte concentration
Introduction
In the modern era, energy storage technology has become increasingly important, not only for our daily lives, but also for the sustainable development of human society. Integrated energy storage and output systems are needed to store as much energy capacity as possible for long-term use and to provide sufficient instant energy when needed [1]. It has been predicted that all explored fossil fuel resources, including oil, coal, and natural gas, will be depleted in the coming years, raising serious concerns about future energy supplies. In addition, the excessive use of fossil fuels also causes environmental pollution and contributes to serious climate change issues, posing a major threat to the survival and sustainability of human society. Therefore, the use of renewable and clean energy sources, such as those derived from the sun, wind, and tides, is urgently needed. However, all of these sustainable energy resources are intermittent and fluctuating, increasing the demand for energy storage [2].
Among various energy storage technologies, batteries and supercapacitors are two examples that can be used in portable electronics, electric vehicles, and energy reservoir arrangements for green and sustainable energy resources. Compared to batteries, supercapacitors have high power density (up to 106 kW kg−1), fast charging and discharging rates (in seconds), and long-life cycles (> 105 cycles), but they have low energy density and high self-discharge rates. The electrochemical performance of supercapacitors significantly depends on the properties of the electrode materials, the properties of the electrolyte, and the concentration of electrolyte ions [3,4].
Activated carbon (AC) is a 3D porous material with sp2 hybridization, and is generally synthesized from the physical and chemical activation of different organic precursors [5]. AC can have a very high surface area (e.g., ∼1,000 - 3,000 m2 g−1), and exhibits low-to-moderate electronic conductivity. However, AC electrodes often show limitations at extreme temperatures and exhibit low electrical conductivity, which can reduce the energy density and overall performance of the device. Combining the AC structure with conductive metal additives, such as black carbon (BC) or multi-walled carbon nanotubes (MWCNTs), is an excellent strategy to overcome some of the weaknesses exhibited by AC. As a result, charge storage can be achieved without significant ohmic loss during electron flow across hierarchically interconnected pore walls, improving supercapacitor characteristics. In a study conducted by Wang et al. [6], it was reported that 10% PVDF in the electrode material tested as a binder had a higher potential compared to concentrations of 12.5%, 7.5%, and 5% across the entire current density range, which can be attributed to the exceptional electrochemical activity at a concentration of 10%.
One important factor affecting supercapacitor performance is the electrolyte. The electrolyte acts as an electrical conduit between the electrodes. The ionic conductivity of the electrolyte directly affects the supercapacitor’s ability to charge and discharge quickly. Higher conductivity allows for faster ion transport, which is important for high-power applications. The electrochemical stability of the electrolyte determines the voltage window of the supercapacitor. A wider voltage window allows for higher energy storage, thereby increasing the energy density of the device. The size and mobility of ions in the electrolyte can affect the capacitance and resistance of the supercapacitor. Smaller ions with higher mobility can access the pores of the electrode material more easily, leading to higher capacitance. The viscosity of the electrolyte affects the rate of ion diffusion. Lower viscosity generally results in better performance, especially at lower temperatures, where higher viscosity can inhibit ion movement [7]. Thus, the concentration used in the electrolyte affects the performance of the supercapacitor. The most commonly used electrolyte in supercapacitors is sulfuric acid (H2SO4). H2SO4 is preferred due to its high ionic conductivity and ability to produce high specific capacitance. Acid electrolytes such as H2SO4 offer high specific capacitance, which is beneficial for storing more charge. This electrolyte has high ionic conductivity, which contributes to the high power density of supercapacitors. Acid electrolytes typically exhibit low ESR, which is advantageous for reducing energy loss during operation [8].
In a study conducted by Ishita et al. [9], it was revealed that H2SO4 as an electrode electrolyte showed a synergistic increase in charge storage capacity that was greater than that of Na2SO4 and 1M KOH using porous carbon nanofiber (PCNF) electrodes in a three-electrode system. The study on porous electrode systems revealed that H2SO4 provides an electrocatalytic effect with reduced redox peak potential and lower charge transfer resistance, as well as a very high capacitance increase, due to improved electrode wetting. Improved wetting results in electrolyte penetration into the electrode micropores, thereby increasing the electrochemically active surface area. Increased H2SO4 wetting also causes damping of self-discharge compared to Na2SO4 and KOH. The results show that the maximum utilization of KI potential to increase charge storage is achieved with H2SO4 electrolyte compared to KOH or Na2SO4. This study highlights the importance of electrolyte selection in electrodes for redox behavior, which has broad applications in energy storage technology.
Although various in-depth studies have been conducted on carbon-based supercapacitor electrodes, the effect of H₂SO₄ electrolyte concentration on the electrochemical behavior of MWCNT/AC composite electrodes is still not adequately understood. Previous studies generally used a single concentration, whereas this study used a variety of H₂SO₄ electrolyte concentrations, namely 1 M, 0.5 M, 0.1 M, and 0.05 M. There is a lack of systematic correlation between ion concentration and performance metrics obtained from CV, GCD, and EIS analyses. In addition, the unique pore structure and surface chemistry of MWCNT/AC composites may interact uniquely with varying ionic environments, but these effects have not been comprehensively evaluated. As a result, rigorous comparative assessments across various H₂SO₄ concentrations are still lacking in the existing literature.
Materials and methods
Chemicals and methods
Multi-walled carbon nanotubes (MWCNTs) were purchased from the Nanotechnology Laboratory, Universitas Diponegoro (Semarang, Indonesia), with a diameter of less than 10 nm and non-functionalized surfaces. Activated carbon (AC) was obtained from Sigma-Aldrich® (St. Louis, MO, USA), with a specific surface area of 1,000 m²/g and particle size distribution of approximately 74 μm (15%) and 10 μm (75%). Polyvinylidene fluoride) (PVDF) and N-methyl-2-pyrrolidone (NMP, 99.5% purity) were also purchased from Sigma-Aldrich® (St. Louis, MO, USA). Sulfuric acid (H₂SO₄, analytical grade, 98%) was supplied by Merck® (Darmstadt, Germany).
The structural and morphological characteristics of the synthesized MWCNTs/AC composite were analyzed using several techniques. The crystalline structure of the composite was examined by X-ray diffraction (XRD, Rigaku D/MAX-2500/PC, Cu Kα radiation, λ = 1.54 Å) operated at 40 kV, to determine the phase composition and degree of crystallinity of the carbon-based materials. The surface morphology and microstructural features of the composite were observed using scanning electron microscopy (SEM, JEOL JSM-6510LA), which provided detailed information on the dispersion of MWCNTs within the activated carbon matrix and the surface texture of the electrode.
Fabrication of MWCNTs/AC Electrodes for Supercapacitor Applications
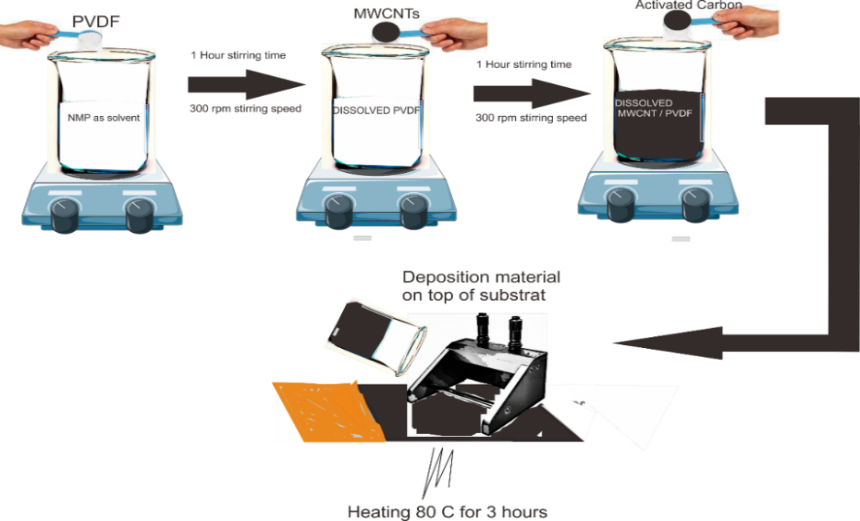
The MWCNTs/AC composite electrode was fabricated using the doctor blade technique. The active material slurry was prepared by mixing multi-walled carbon nanotubes (MWCNTs), activated carbon (AC), and polyvinylidene fluoride) (PVDF) binder in a mass ratio of 45:45:10, with a total mass of 0.1 g for each batch. Initially, PVDF was dissolved in N-methyl-2-pyrrolidone (NMP) solvent under magnetic stirring at 300 rpm for 1 h at 25 °C to obtain a homogeneous binder solution. Subsequently, activated carbon was added and stirred under the same conditions for another 1 h to ensure uniform dispersion. Finally, MWCNTs were introduced into the mixture, and the resulting suspension was continuously stirred for 24 h at 300 rpm at 25 °C to obtain a stable and homogeneous black slurry [10].
The homogeneous slurry was then deposited onto a clean copper foil substrate using a doctor blade with a micrometer-adjustable film applicator. The coated film was dried at 80 °C for 3 h to ensure complete solvent evaporation and proper adhesion between the electrode layer and the substrate. The foil substrate was cut into 1×1 cm pieces. Figure 1 schematically illustrates the synthesis and deposition process of the MWCNTs/AC composite electrode.
Electrochemical characterization
The electrochemical properties of the MWCNT/AC composite electrodes were investigated using cyclic voltammetry (CV), galvanostatic charge–discharge (GCD), electrochemical impedance spectroscopy (EIS), and retention measurements performed on a PalmSens4 potentiostat controlled by the PSTrace BETA 5.10 software. All electrochemical tests were conducted in aqueous H₂SO₄ electrolytes with varying concentrations of 1 M, 0.5 M, 0.01 M, and 0.05 M to evaluate the influence of ion concentration on electrode performance. A three-electrode configuration was employed, consisting of the synthesized MWCNTs/AC electrode as the working electrode, a platinum plate as the counter electrode, and an Ag/AgCl electrode as the reference electrode. Figure 2 shows the measurement scheme for electrochemical performance.
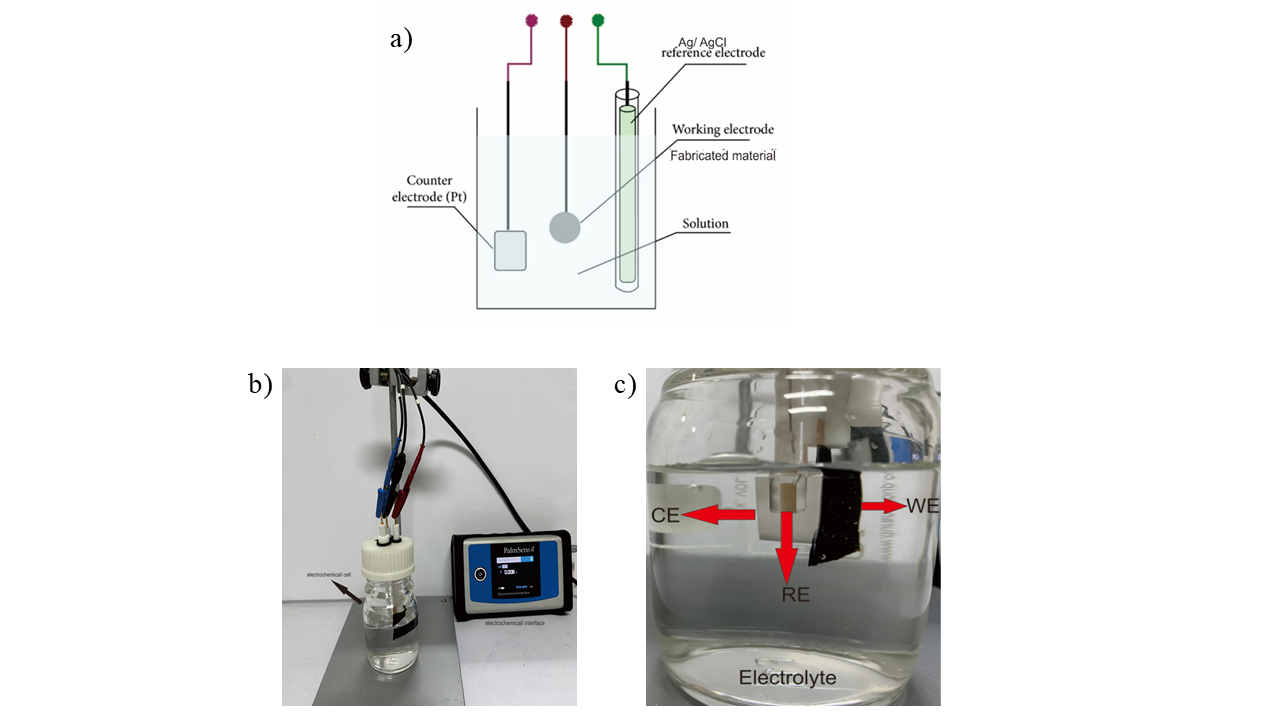
Figure 2 Scheme of measurement with a three-electrode system. (a) measurement models, (b) real-time measurements, and (c) electrochemical cell components.
CV testing was carried out to analyze the capacitive behavior and charge storage mechanism of the electrodes by observing the cyclic curve profile in the potential range of 0 - 1 V at scan rates of 10, 25, 50, 75, and 100 mV s⁻¹ over a potential range of -1.0 to 0.1 V at various concentrations of H₂SO₄ electrolyte solution of 0.05, 0.1, 0.5, and 1 M. To measure the specific capacitance after obtaining the CV plot, we can use the following Eqs. (1) - (2):
Cs is the specific capacitance (F/g), m is the mass of the electrode (g), k is the scan rate of measurement (V/s), V1 is the first potential where the scan is forwarded, and V2 is the second potential where the scan is reversed.
The GCD measurements were performed at different current densities of 0.5, 1.0, 2.5, 5.0, 7.5, and 10.0 A g⁻¹ to determine the specific capacitance (Cₛ), energy density (E), and power density (P) under various electrolyte concentrations using the following Eqs. (3) - (5):
where:
’I’ is the current (A),
’ΔV’ is a potential window (V),
’Δt’ is the discharging time (s), and
‘m’ is the weight of the active electrode (g).
EIS analysis was conducted in the frequency range from 0.1 Hz to 10⁶ Hz to study the internal resistance, charge transfer resistance, and ion diffusion behavior of the electrodes at different electrolyte molarities [11].
Results and discussion
Characterization and data analysis of MWCNTs/AC
Figure 3 shows the results of the XRD testing of MWCNTs/AC. The XRD analysis of MWCNTs/Activated Carbon (AC) often shows diffraction patterns with a main peak around 2θ = 25°, which is a characteristic feature of the (002) crystal plane of the MWCNTs structure. This peak indicates parallel stacked graphene layers, indicating a relatively high degree of crystallinity in the carbon tube walls. Additionally, other peaks around 43° and 57° are often associated with the (100) and (101) planes, which represent the hexagonal crystal structure of carbon, This is consistent with research conducted by XRD analysis of MWCNTs/AC, which often shows diffraction patterns with a main peak around 2θ = 25.5°, a characteristic feature of the (002) crystal plane of the MWCNTs structure. This peak indicates parallel stacked graphene layers, indicating a relatively high degree of crystallinity in the carbon tube walls. Additionally, other peaks at angles around 43.2° and 56.9° are often associated with the (100) and (101) planes, which represent the hexagonal crystal structure of carbon [12].
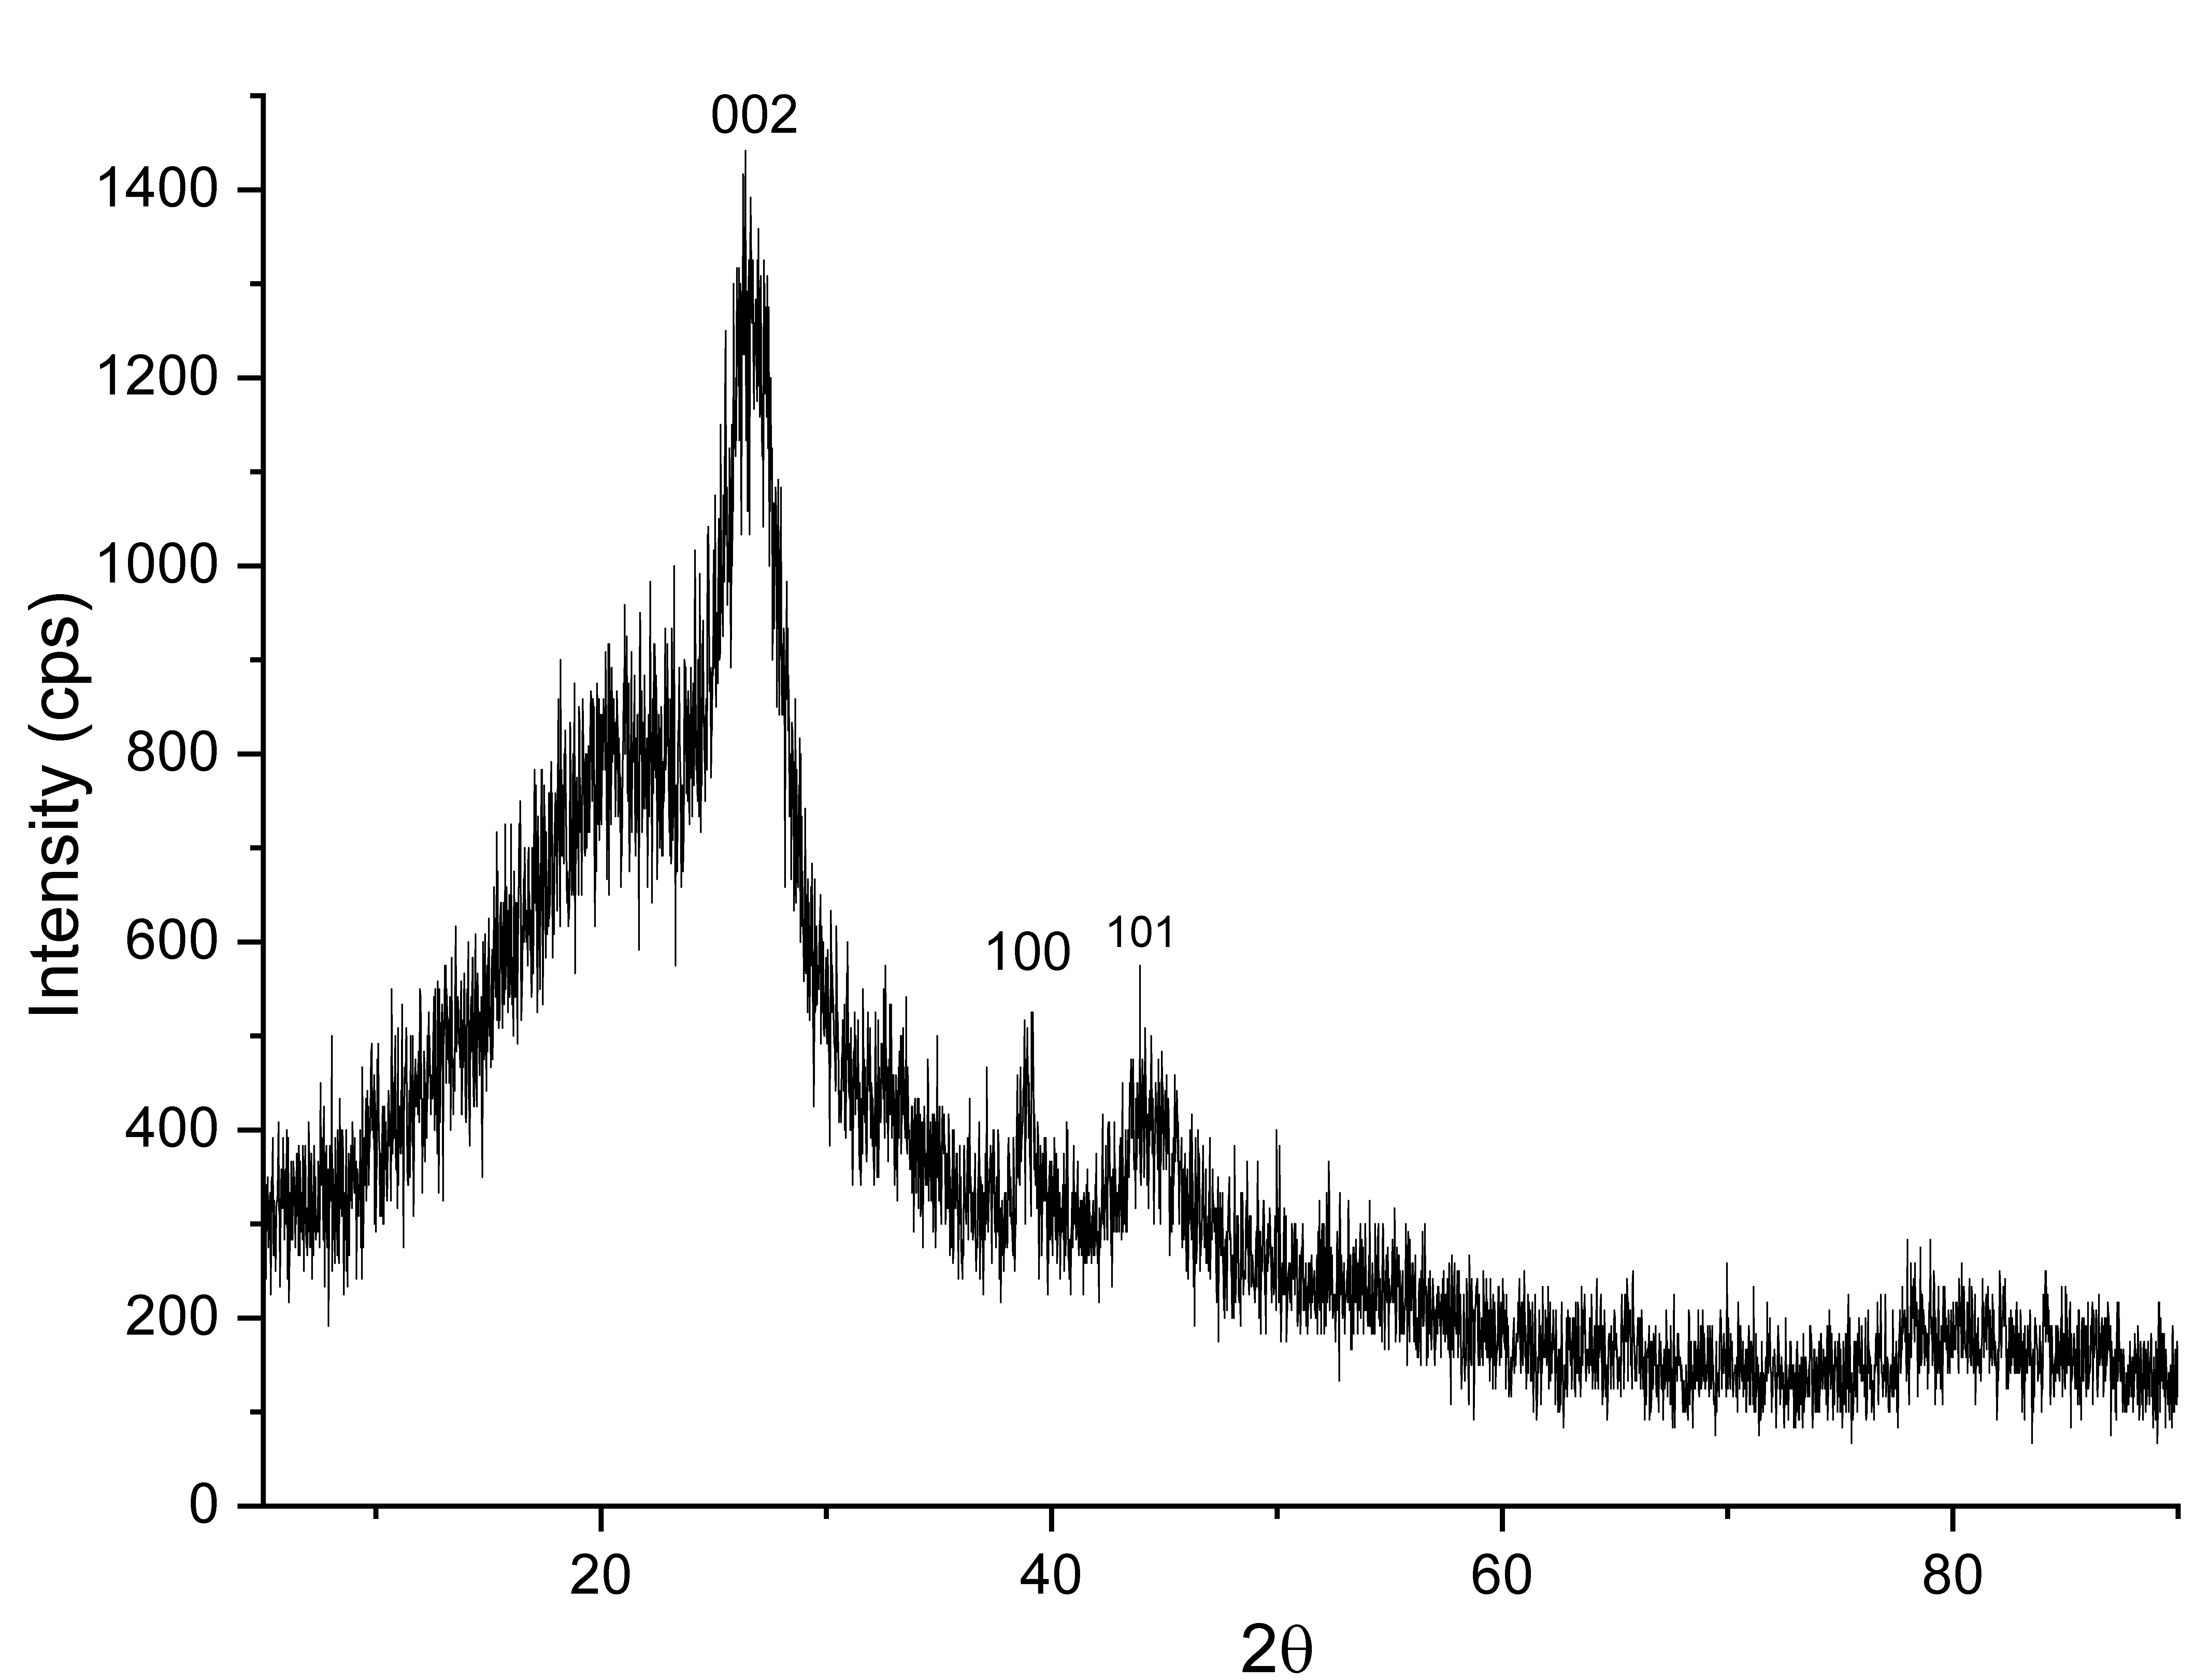
Research on MWCNTs/AC composites shows that this XRD pattern indicates the presence of a dominant crystalline carbon phase from MWCNTs, accompanied by an amorphous phase from activated carbon, and shows interactions between components at the nanoscopic level that can affect the physical and chemical properties of the material [13]. The sample had a two-phase structure, and the subjective crystalline phase and non-crystalline phase could be separated by the minimum diffraction intensity. The calculation formula is presented as follows:
Using these values, the % crystallinity equation given above can be used to calculate the approximate crystalline and amorphous content of the sample (14). In this case, the area under the crystalline peaks was 470.13, and the total area was 3940. The sample had a crystallinity of 12% (meaning 88%) amorphous material.
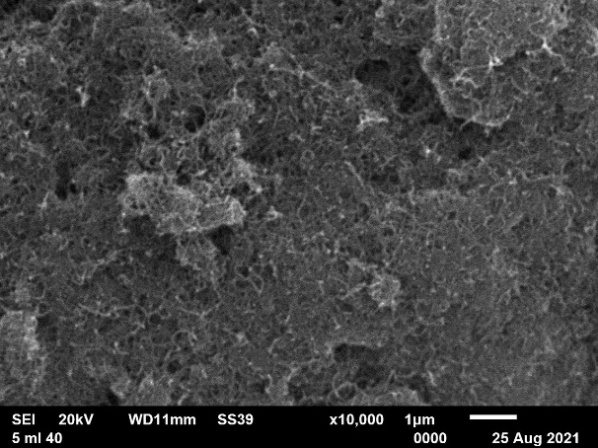
Electrode surface morphology was obtained by SEM analysis. The results of surface morphological images can show a correlation between the structures formed and the results of electrode electrochemical analysis. Morphological analysis of the electrode surface using SEM in Figure 4 shows the uniform distribution of MWCNTs within the activated carbon (AC) matrix. The tubular structure of MWCNTs is randomly distributed without regular orientation across the material surface. MWCNTs with diameters ranging from 1–10 nm can easily penetrate the micrometer-scale pores of AC. This infiltration of MWCNTs is crucial as it forms conductive pathways within the AC structure, thereby enhancing electron conductivity. Research by Li et al. [15] also shows that the presence of MWCNTs within the activated carbon matrix functions as an electron bridge that improves connectivity between activated carbon particles and reduces internal resistance, ultimately supporting supercapacitor performance .
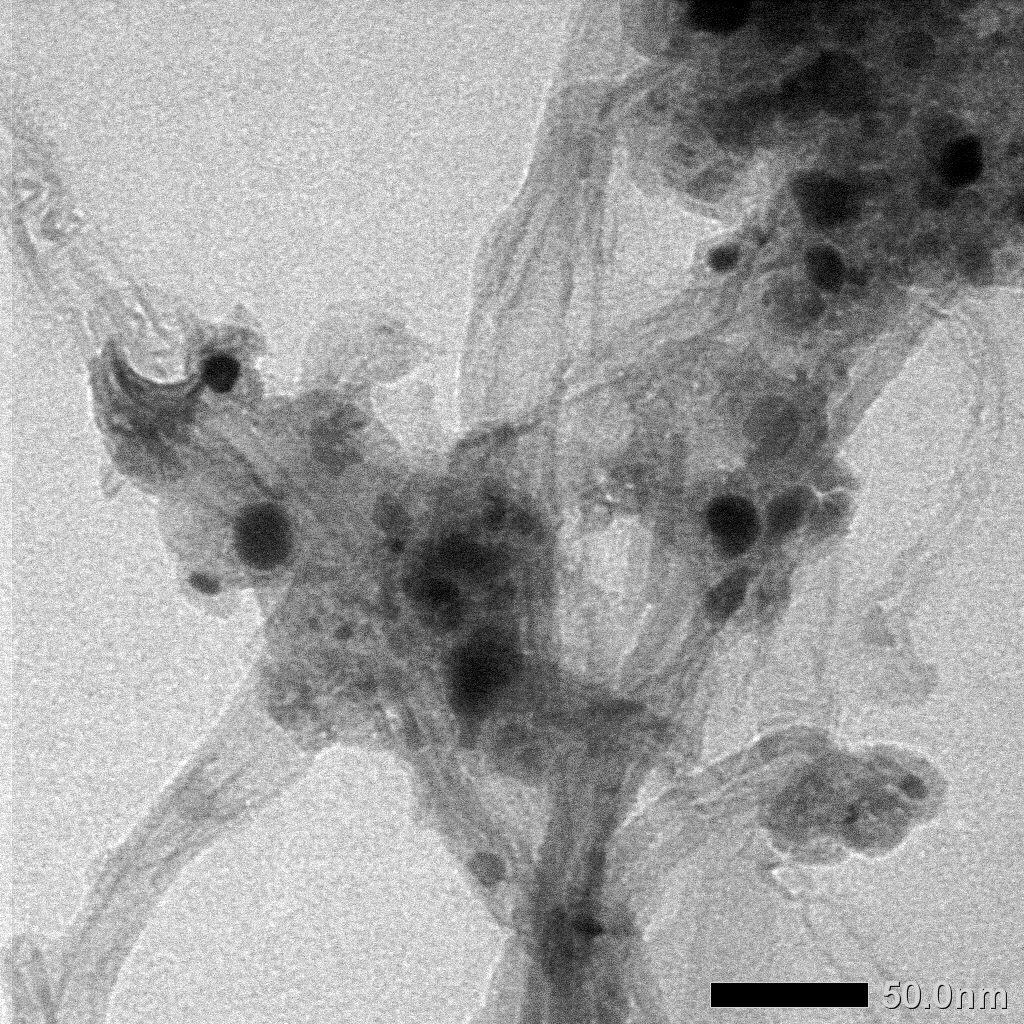
TEM analysis was used to analyze the internal shape and size of MWCNTs/AC samples at the nanometer scale. The TEM analysis results in Figure 5 show that the diameter of MWCNTs is less than 20 nm. The results also show the presence of AC attached to the MWCNTs.
Electrochemical Characterization and Data Analysis of MWCNTs/AC
The cyclic voltammetry (CV) graphs shown in Figures 6(a) - 6(d) illustrate the electrochemical behavior of the electrode material at different H₂SO₄ electrolyte concentrations of 0.05 M, 0.5 M, 0.1 M, and 1 M, across a scan rate range of 5 - 100 mV s-1. The CV curves exhibit a quasi-rectangular shape, indicating ideal capacitive behavior (double layer), particularly at higher acid concentrations and lower scan rates. This suggests that the electrode possesses good charge storage characteristics and rapid ion transport within the electroactive material. This study shows that as the concentration of the electrolyte increases, with the highest concentration being 1 M H₂SO₄, the specific capacitance value of the supercapacitor also increases due to the increased number of ions available for charge storage at the electrode, consistent with the research conducted by Wu et al. [16]. As the H₂SO₄ concentration increases, the current generated becomes larger, and the CV curve area becomes wider, indicating an increase in charge storage capacity. This is due to the increased number of H⁺ ions in the electrolyte, which supports the formation of an electric double layer on the electrode surface, thereby improving ion transfer capability and energy storage efficiency.
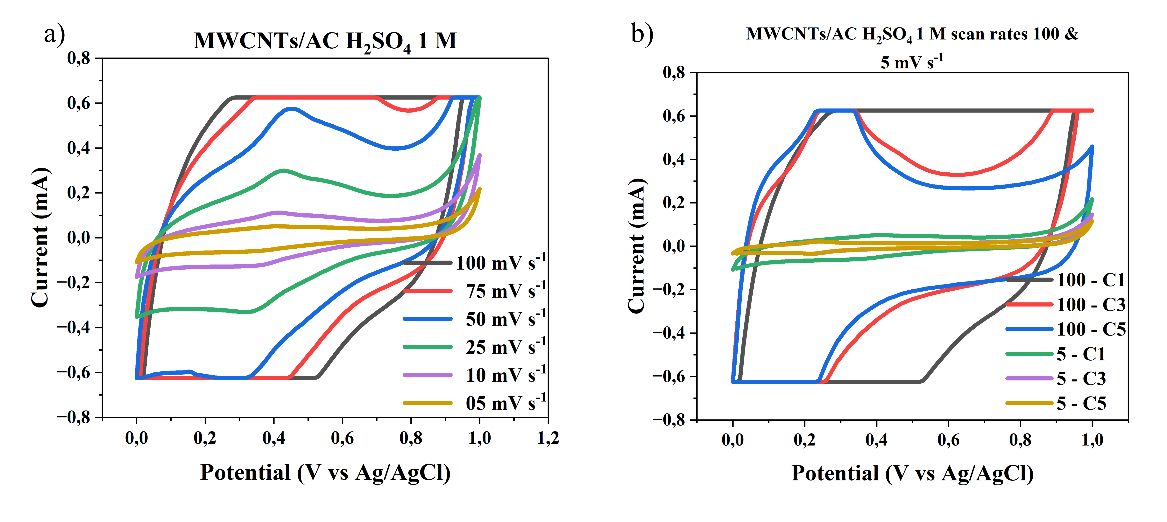
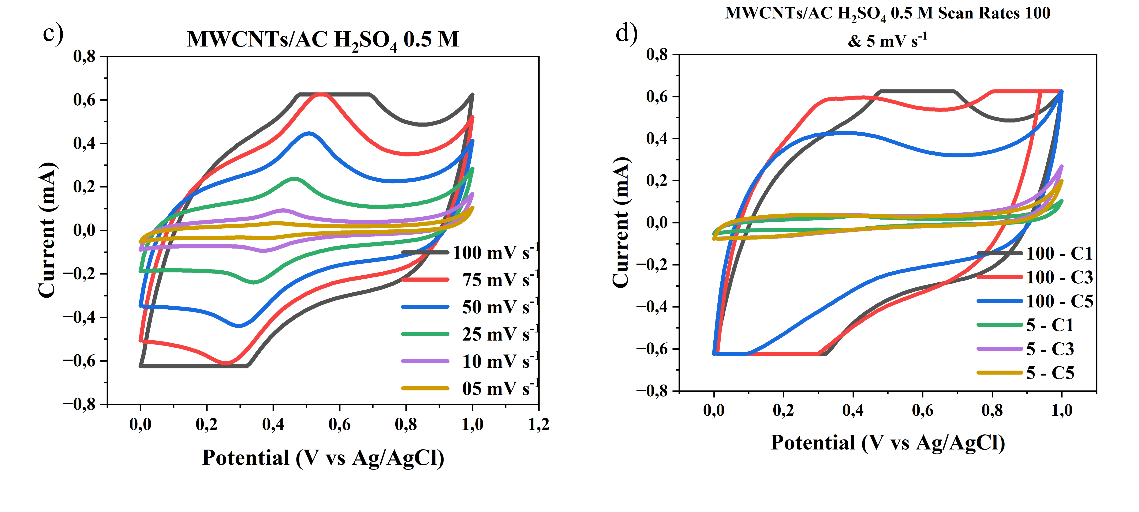
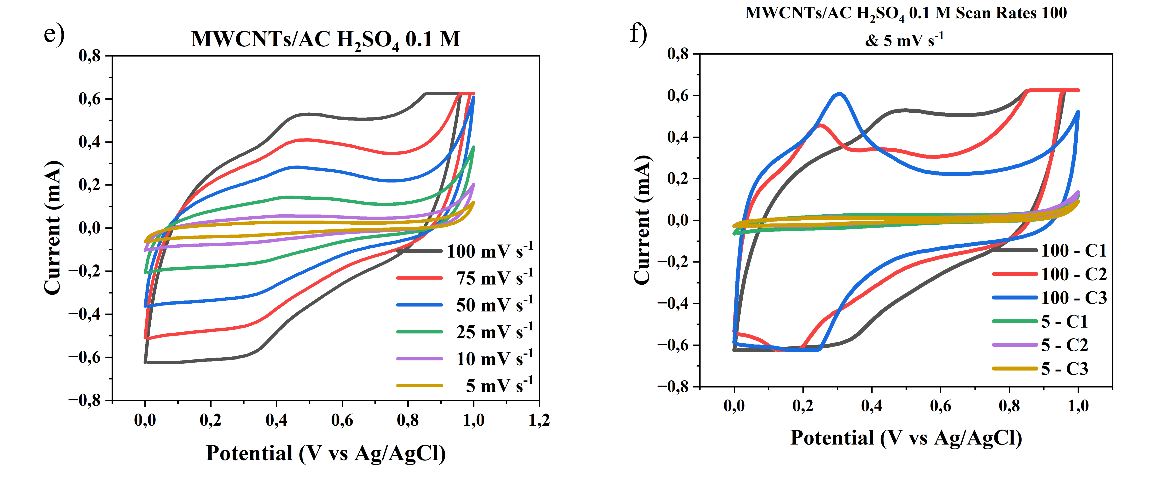
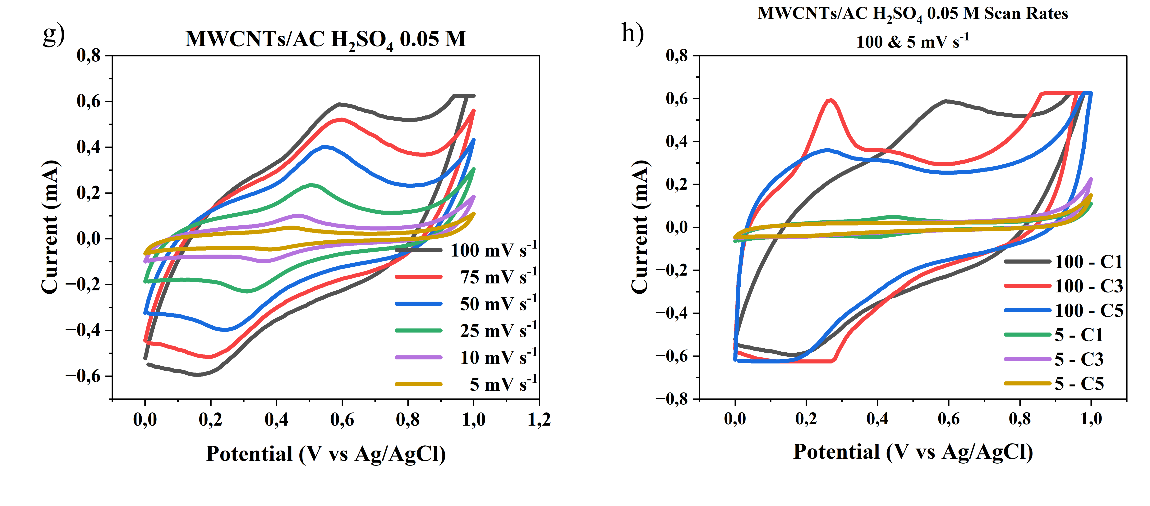
Figure 6 Cyclic voltammogram scan rate curves of 100 - 5 mV s-1 and cycle MWCNTs/AC Scan Rates 100 and 5 mVs of a three-electrode system in different concentrations of H2SO4 electrolyte, a) and b) 1M, c) and d) 0.5 M, e) and f) 0.1 M, g) and h) 0.01 M.
Figure 7 shows the relationship between the specific capacitance of the electrode and the variation in scan rate in a three-electrode system at various concentrations of H₂SO₄ electrolyte (1 M, 0.5 M, 0.1 M, and 0.05 M), which is the result of calculations from Eq. (2) shown in Table 1. From the research results, as the scan rate increases, the specific capacitance tends to decrease for all electrolyte concentrations. This is because at low scan rates, electrolyte ions have sufficient time to penetrate the entire electrode surface, resulting in higher stored charge. Conversely, at high scan rates, the diffusion of ions into the electrode pores becomes limited, resulting in a decrease in specific capacitance [17]. Additionally, the highest specific capacitance was achieved at an electrolyte concentration of 1 M, indicating that a greater availability of ions in the electrolyte solution can enhance the electrode’s charge storage capacity. At lower electrolyte concentrations (0.5 M, 0.1 M, and 0.05 M), the specific capacitance values decrease significantly, indicating that the limited number of H⁺ ions restricts the electrode–electrolyte interaction process [18]. These findings emphasize the importance of optimizing electrolyte concentration to achieve maximum supercapacitor performance.
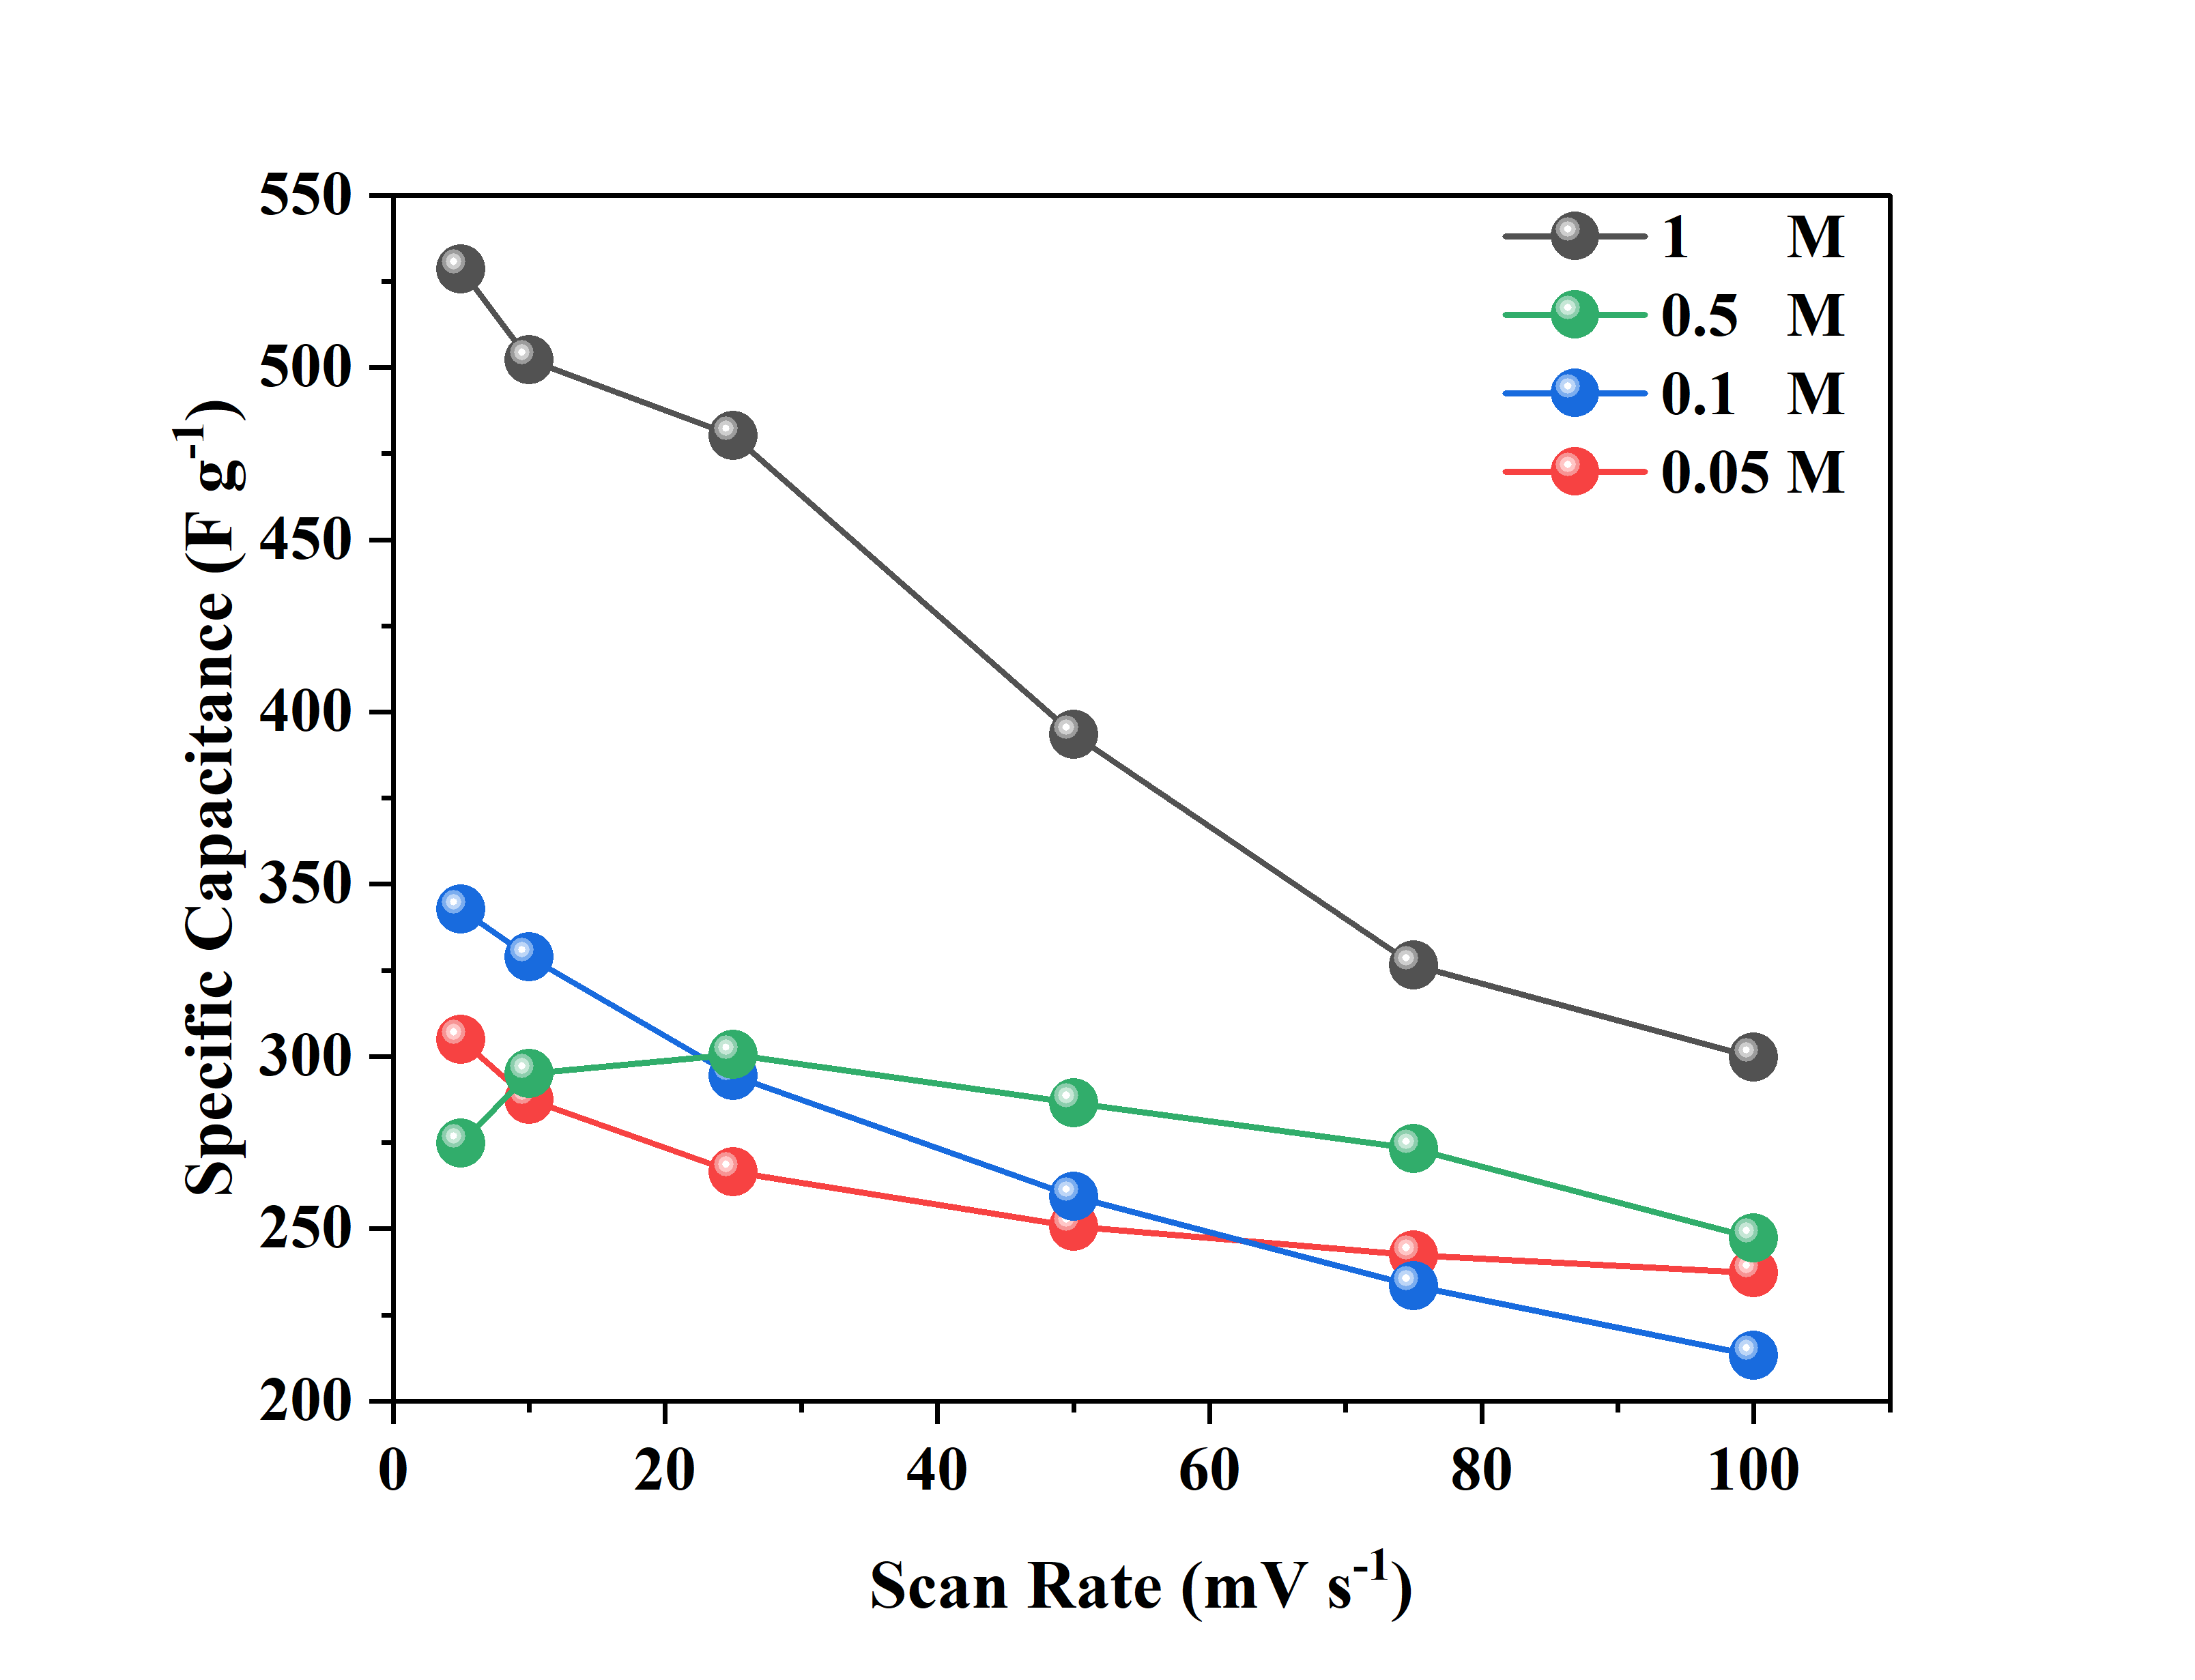
Figure 7 Specific capacitance at a different scan rate of a three-electrode system in different concentrations of H2SO4 electrolyte.
Table 1 Specific capacitance at a different scan rate of a three-electrode system in different concentrations of H2SO4 electrolyte.
Scan Rate (mV s-1) |
Specific Capacitance (F g-1) |
|||
1 M |
0.5 M |
0.1 M |
0.05 M |
|
5 |
528.57
|
342.68
|
304.97
|
274.82
|
10 |
502.31
|
328.89
|
287.48
|
295.09
|
25 |
480.17
|
294.45
|
266.54
|
300.57
|
50 |
393.42
|
259.35
|
250.75
|
286.55
|
75 |
326.47
|
233.51
|
242.38
|
273.16
|
100 |
299.68
|
213.25
|
237.21
|
247.33
|
 3.16
3.16The galvanostatic charge-discharge (GCD) curves shown in figure illustrate the electrochemical performance of MWCNTs/AC-based supercapacitor electrodes at various H₂SO₄ electrolyte concentrations (1 M, 0.5 M, 0.1 M, and 0.05 M) and different current densities (1 - 10 A g-1). The GCD curve profiles show clear differences in capacitance and internal resistance behavior as a function of electrolyte concentration. At the highest electrolyte concentration of 1 M H₂SO₄ (Figure 8(a)), the discharge curve exhibits an almost ideal triangular shape with the longest discharge time across all current densities, reflecting superior charge storage capacity and reversibility. The steep slope at higher current densities indicates better ionic conductivity and minimal voltage drop (IR drop), indicating low equivalent series resistance (ESR). This suggests that the 1 M concentration is the optimal electrolyte concentration for efficient ion transport and the formation of an electric double layer, resulting in the highest specific capacitance at the electrode [19].
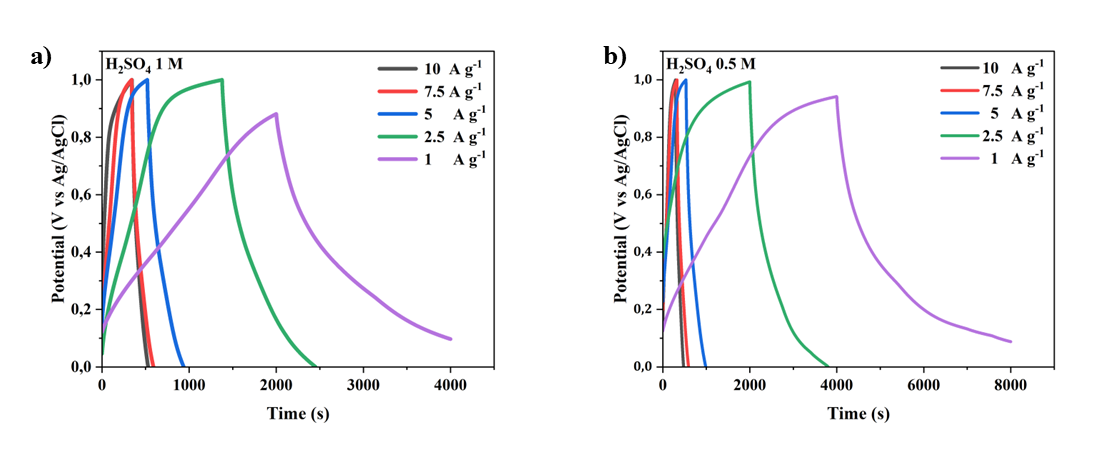
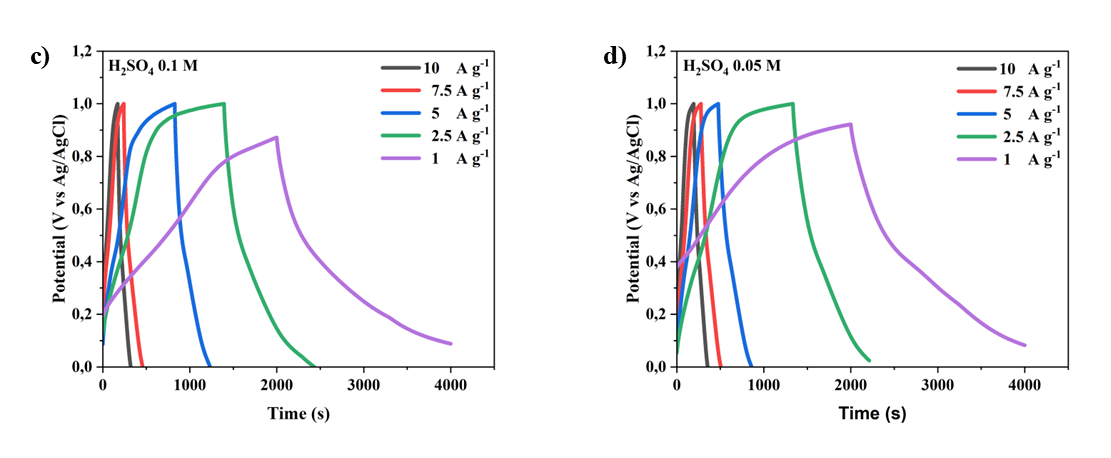
Figure 8 The charge–discharge current density 10-1 A g-1 curves of MWCNTs/AC-based supercapacitor electrode at different concentrations of H2SO4 electrolyte: A) 1M, b) 0.5 M, c) 0.1 M, and d) 0.01 M.
Figure 9 (a) Specific capacitance at a different current density; (b) Ragone plot of a three-electrode system in various concentrations of H2SO4 electrolyte.
Analysis of Figure 9(a) shows that the specific capacitance of MWCNTs/AC material decreases significantly with increasing current density at various electrolyte concentrations. The graph in Figure 9(a) illustrates Table 2. Table 2 presents capacitance values from a three-electrode system, showing the highest value of 501.7 F/g at 1 A g⁻¹ in 0.05 M electrolyte, dropping to 162.07 F/g at 10 A g⁻¹ in 1 M, confirming the general behavior of carbon supercapacitors, optimal performance at wide ion access and diffusion times. This study aligns with research conducted by Choudhury and Moholkar on the use of MWCNTs, which demonstrated high capacitance up to 217.1 F/g at 4 A g-1 but significantly lower at higher rates due to kinetic limitations in ion diffusion and access to the internal electrode surface area [20]. As the current increases, ions do not have enough time to penetrate the electrode pores optimally, resulting in a clear decrease in capacitance [21,22].
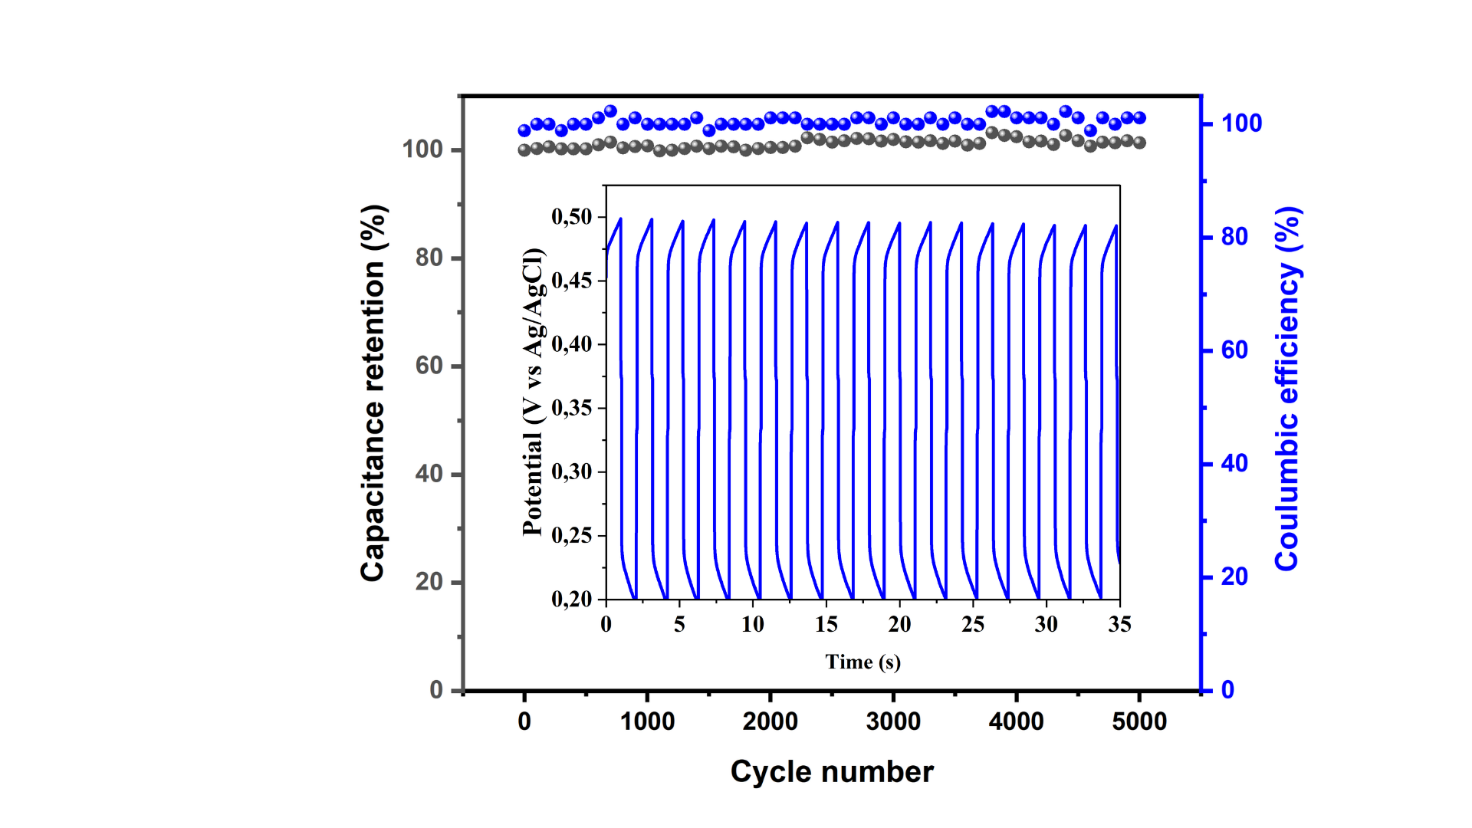
Figure 10 Stability of MWCNTs/AC cycles in 1M H2SO4 electrolyte.
Table 2 Specific capacitance at a different current density of a three-electrode system in various concentrations of H2SO4 electrolyte.
Current Density W (A g-1) |
Specific Capacitance (F g-1) |
|||
1 M |
0.5 M |
0.1 M |
0.05 M |
|
1 |
502.57 |
356.98 |
356.98 |
247.33 |
2.5 |
455.43 |
266.50 |
259.55 |
222.2 |
5 |
230.54 |
207.40 |
203.87 |
190.09 |
7.5 |
201.93 |
186.70 |
162.71 |
171.32 |
10 |
184.84 |
184.07 |
150.25 |
162.07 |
Table 3 Energy Density at a different current density of a three-electrode system in various concentrations of H2SO4 electrolyte.
Current Density (A g-1) |
Energy Density (W h g-1) |
|||
1 M |
0.5 M |
0.1 M |
0.05 M |
|
1 |
436.73 |
411.80 |
403.19 |
378.74 |
2.5 |
378.95 |
367.19 |
359.76 |
295.83 |
5 |
307.51 |
285.76 |
279.77 |
259.30 |
7.5 |
279.37 |
257.25 |
224.64 |
234.89 |
10 |
254.67 |
255.45 |
208.26 |
221.68 |
Table 4 Power Density at a different current density of a three-electrode system in various concentrations of H2SO4 electrolyte.
Current Density (A g-1) |
Power Density (W h g-1) |
|||
1 M |
0.5 M |
0.1 M |
0.05 M |
|
1 |
391 |
391 |
396 |
454 |
2.5 |
1,245 |
1,249 |
1,238 |
1,218 |
5 |
2,490 |
2,485 |
2,450 |
2,485 |
7.5 |
3,735 |
3,739 |
3,742 |
3,735 |
10 |
4,998 |
4,995 |
4,980 |
4,980 |
Analysis of the Ragone plot in Figure 9(b), corresponding to the data in Tables 3 and 4, shows that the MWCNTs/AC material exhibits a characteristic trade-off between energy and power density at various H2SO4 concentrations. At an electrolyte concentration of 1 M H2SO4, the energy density value remains high across the entire power density range. This graph aligns with previous research indicating that increasing electrolyte concentration improves ion transport efficiency and reduces internal resistance, thereby maintaining optimal energy density and power density even at high currents. At high concentrations, the electrode consistently combines high energy density and power density, while at low concentrations, performance declines due to limitations in the number of active ions and diffusion effects [10,23,24]. These results emphasize the importance of selecting the appropriate electrolyte concentration to maximize the performance of carbon-based supercapacitors.
The long-cycle performance of MWCNTs/AC in 1 M H₂SO₄ electrolyte was also determined using GCD analysis. Cycle stability (Figure 10) showed that after 5,000 cycles, there was no significant decrease in specific capacitance. A high capacitance retention of 98.89% was obtained after 5,000 cycles, indicating fast charging capability and ion transport within the MWCNTs/AC electrode. Additionally, the GCD curve from the first 17 cycles (inner part of Figure 10) shows good cycling and stable performance. The observed cycle stability proves that MWCNTs/AC is electrochemically stable and superior to most EDLC supercapacitors [25].
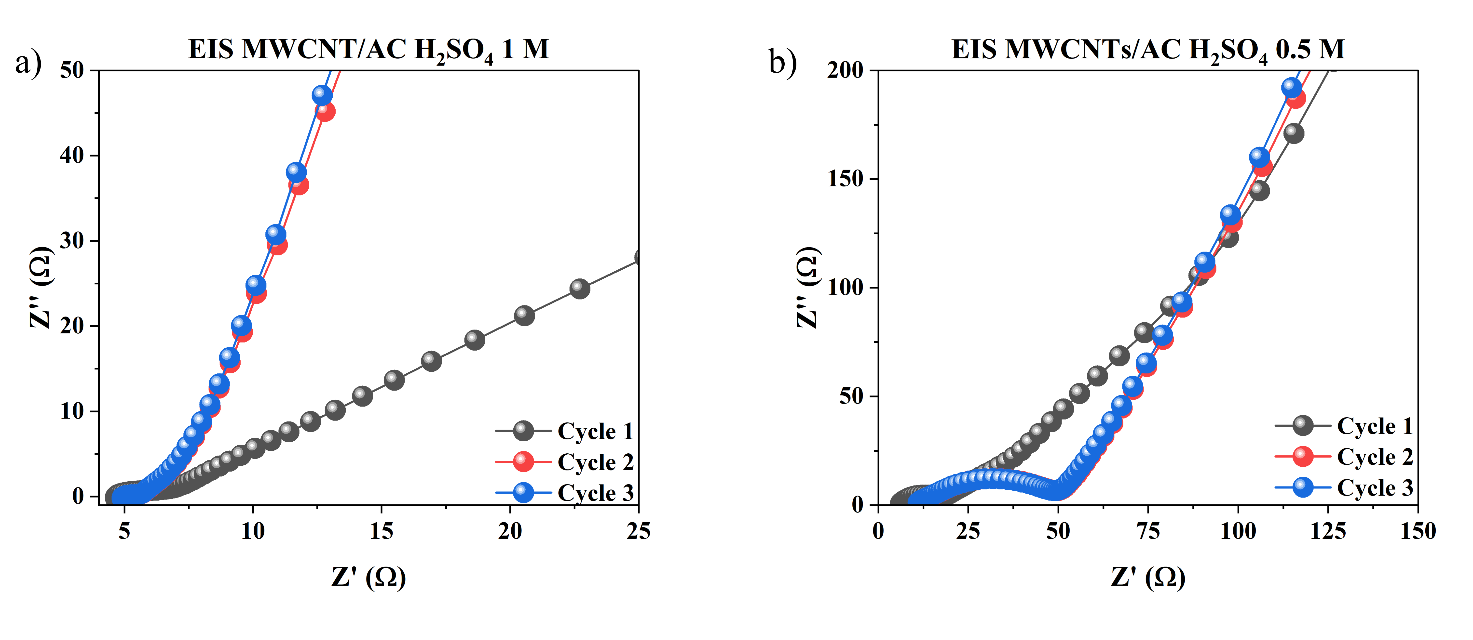
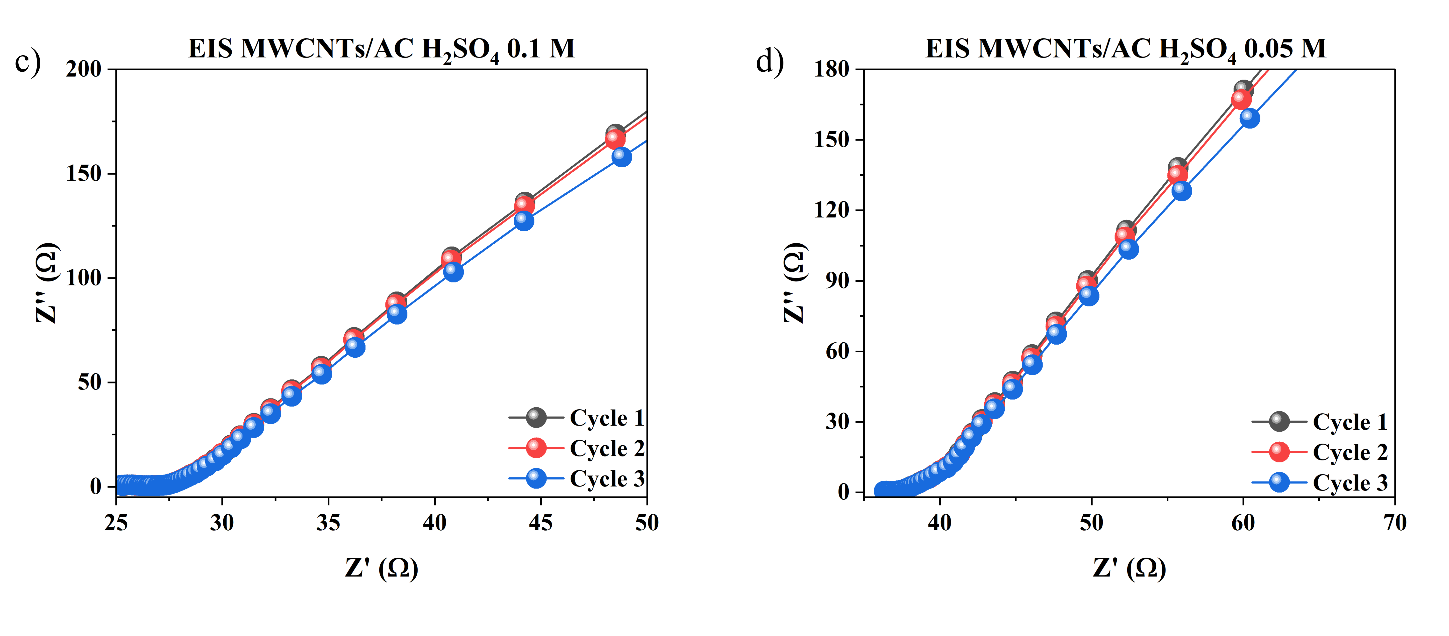
Figure 11 Nyquist Plot of Electrochemical Impedance Spectroscopy (EIS) Test Results from MWCNTs/AC Electrodes in Variations of H₂SO₄ Electrolyte Concentration a) 1 M, b) 0.5 M, c) 0.1 M, and d) 0.05 M in Three Measurement Cycles.
The EIS results in Figure 11 show that variations in H₂SO₄ electrolyte concentration have a clear effect on the impedance characteristics of the MWCNTs/AC electrode. At 1 M and 0.5 M, the Nyquist curve shows lower initial Z′ values and smaller semicircles, indicating lower series resistance (Rs) and charge transfer resistance (Rct). This indicates that the greater availability of H⁺ ions increases the conductivity of the electrolyte and accelerates the electrochemical kinetics at the electrode interface [26]. Conversely, at 0.1 M and 0.05 M, there was a significant increase in Z′ values and enlargement of the semicircle, indicating increased internal resistance and decreased charge transfer efficiency due to ion limitations in the solution [27,28].
At low frequencies, all curves show the typical linear trend of Warburg impedance, but the diffusion line appears longer at low concentrations, indicating that ion diffusion becomes a more dominant limiting factor. Meanwhile, high concentrations produce a shorter and steeper impedance response, indicating faster ion diffusion into the electrode pore structure [29]. The similarity of patterns between measurement cycles also indicates that MWCNTs/AC electrodes have good electrochemical stability. Overall, these EIS results confirm that increasing the electrolyte concentration directly contributes to a decrease in total impedance and an increase in the electrochemical performance of the system.
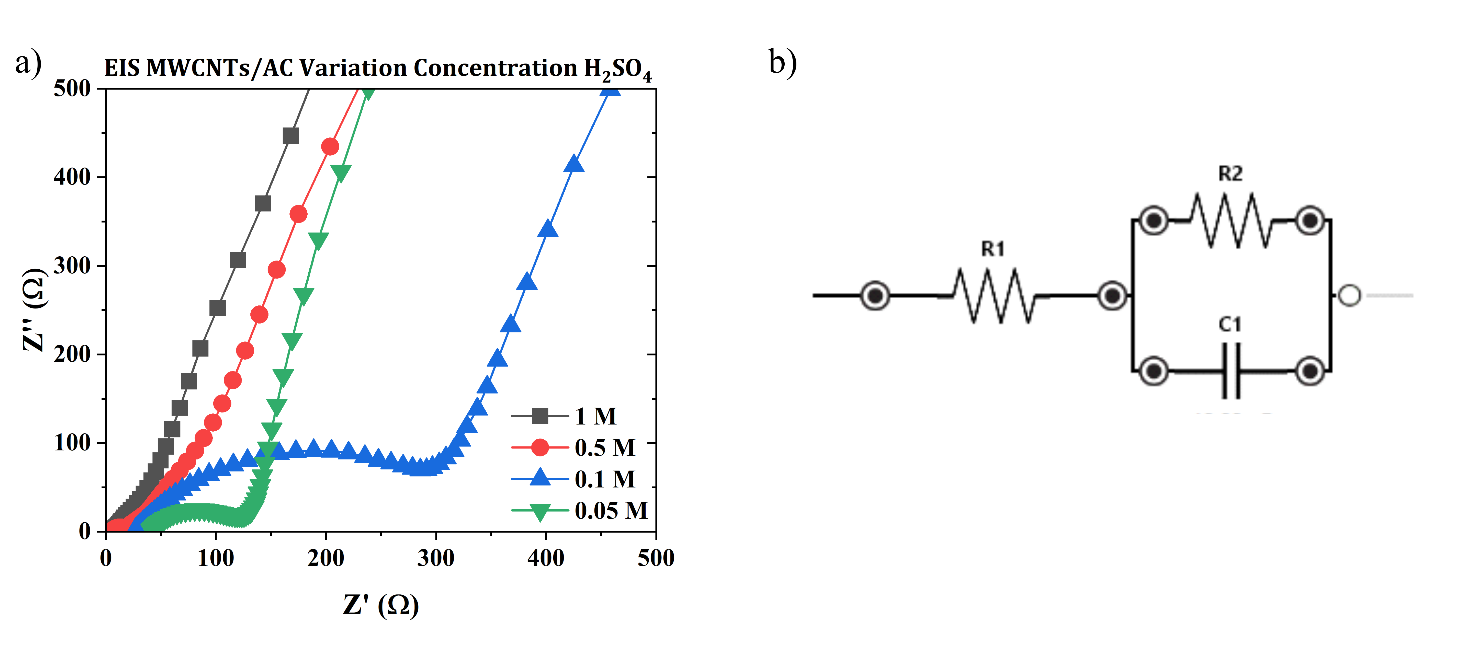
Figure 12 The electrochemical performance of the MWCNTs/AC electrode (a) Nyquist plot of EIS analysis and (b) a simplified equivalent circuit model used to interpret the EIS data.
Figure 12 shows the corresponding Nyquist plot of the electrode measurement. The intercept gives the values of 0.230, 0.690, 0.725, 1.080, and 1.225 Ω for the concentrations of 1, 0.5, 0.1, 0.05 M, respectively. The value at the intercept (Rs) is defined as the sum of the contact resistances (between the electrode and the current collector) and electrolyte resistance. It was observed that the value of Z’ (real impedance) at the intercept on the real axis decreased as the concentration increased [30].
The EIS results show a dependence on electrolyte concentration. Increasing the electrolyte molarity from low to high values results in a significant decrease in solution resistance (R1) and charge transfer resistance (R2), while increasing the double-layer capacitance (C1), as shown in Table 5. Specifically, high concentrations facilitate greater ionic conductivity and ion mobility, resulting in reduced resistance at the electrode/electrolyte interface and enhanced capacitive behavior [18]. This correlation is consistent with the findings of Li et al. [15], where optimized electrolyte concentration serves to maximize ionic charge transport and produce higher specific capacitance and lower overall resistance in supercapacitor applications.
Table 5 Fitting data from the Nyquist plot EIS analysis.
Electrolyte concentration (M) |
R1 (ohm) |
R2 (ohm) |
C1 (F) |
1 |
6.14
|
1225
|
1×10⁻³
|
0.5 |
9.86
|
459
|
1×10⁻³
|
0.1 |
31.46
|
252
|
1.9×10⁻⁵ |
0.05 |
45.35
|
79.06
|
1.1×10⁻⁵
|
 2.3×10⁻⁷
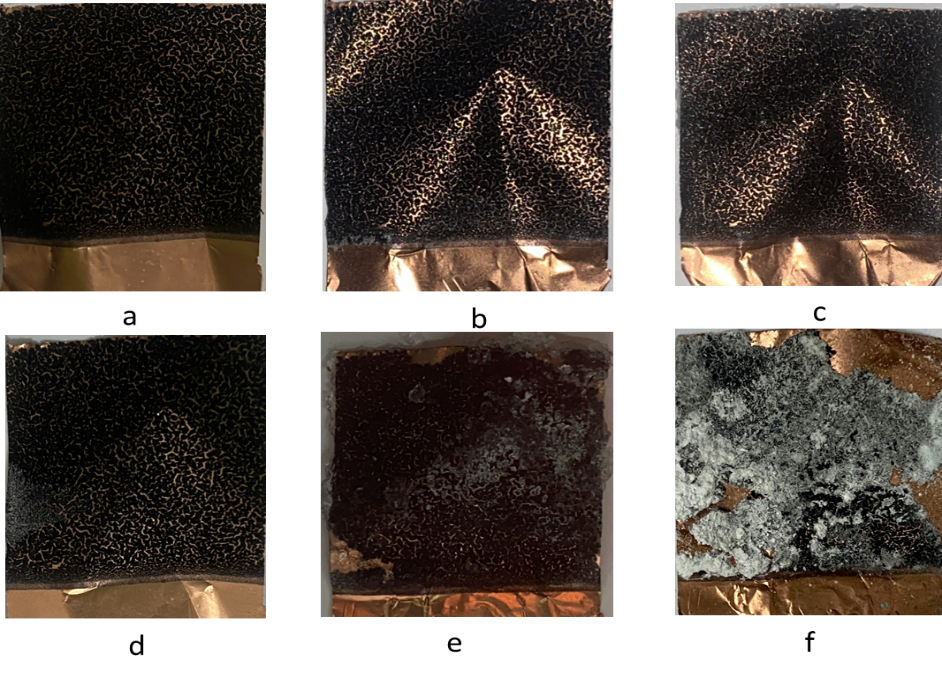
Figure 13 The surface of the electrode after electrochemical analysis in various electrolyte concentrations: A) 1M, b) 0.5 M, c) 0.1 M, and d) 0.05 M.
Figure 13 shows the physical appearance of the supercapacitor electrode surface after electrochemical measurements at different electrolyte concentrations. In this observation, an increase in H₂SO₄ electrolyte concentration causes more pronounced peeling and detachment of the electrode layer from the substrate. In samples tested with higher electrolyte concentrations, particularly at 1 M H₂SO₄ (Figure 14(a)), the electrodes exhibited fewer signs of surface degradation and maintained better structural integrity. Additionally, deposit buildup was observed on some electrode surfaces, which may be due to incomplete dissolution of the electrolyte or side reactions during electrochemical cycles. These findings suggest that the highest specific capacitance values are due to the small size and high conductivity of H+ and SO42- ions, which allow more ions to diffuse into the electrode pores, enhancing the formation of a double-layer charge and thus improving energy storage capacity. Although increasing the electrolyte concentration can enhance specific capacitance, it may also accelerate physical degradation and surface instability of the electrode due to increased chemical activity of the electrolyte [18,19].
Conclusions
The electrode was successfully developed by combining most of the MWCNTs/AC using a PVDF binder with a simple method. The material was also deposited on copper foil as a substrate. From the morphological analysis, AC successfully adhered to MWCNTs. Electrochemical testing showed that a higher concentration of H₂SO₄ electrolyte (1 M) significantly improved performance, with a specific capacitance of 528.57 F g-1 (CV), an energy density of 436.73 Wh kg-1, a power density of 391 W kg-1, and a 5,000-cycle stability of 98.89% (GCD). EIS analysis revealed low electrolyte resistance and charge transfer, highlighting the excellent conductivity of the material. However, excessive concentrations exceeding 1 M can cause electrode degradation, emphasizing the need for optimized electrolyte conditions to balance performance and stability.
Acknowledgements
The authors sincerely thank the Nanotechnology Laboratory for their support in material synthesis and testing throughout this research. Financial support was provided by the Institute for Research and Community Services, Universitas Diponegoro, Indonesia through the RKI 2022 project #434-14/UN7.D2/PP/VI/2022.
Declaration of generative AI in scientific writing
The authors acknowledge the use of generative artificial intelligence tools (Preplexity) for language editing and grammar correction. No content generation or data interpretation was performed by artificial intelligence. The authors take full responsibility for the content and conclusions of this work.
CRediT author statement
Agus Subagio: Conceptualization, Methodology, Supervision, Review & Editing. Heydar Ruffa Taufiq: Investigation, Software, Writing – Review & Editing. Heri Sutanto: Supervision, Software, Writing – Review & Editing. Risma Aimatul Qudsiyah: Investigation, Resources, Validation, Software, Writing – Original Draft. Markus Diantoro: Supervision, Software, Writing – Review & Editing. Ishmah Luthfiyah: Supervision, Formal Analysis. Agus Purwanto: Data Curation.Worawat Meeyasana: Data Curation, Formal Analysis.
References
[1] N Swain, A Tripathy, A Thirumurugan, B Saravanakumar, L Schmidt-Mende and A Ramadoss. A brief review on stretchable, compressible, and deformable supercapacitors for smart devices. Chemical Engineering Journal 2022; 446(P3), 136876
[2] M Zhong, M Zhang and X Li. Carbon nanomaterials and their composites for supercapacitors. Carbon Energy 2022; 4(5), 950-985.
[3] X Chen, H Zhang, Y Gao, JH Liu, X Cao, C Zhan, S Wang, J Wang, SX Dou and D Cao. Zinc-ion hybrid supercapacitors: Design strategies, challenges, and perspectives. Carbon Neutralization 2022; 1(2), 159-188.
[4] MM Hasan, T Islam, SS Shah, A Awal, MA Aziz and AJS Ahammad. Recent advances in carbon and metal-based supramolecular technology for supercapacitor applications. Chemical Record 2022; 22(7), e202200041.
[5] B Freitas, WG Nunes, DM Soares, FC Rufino, CM Moreira, LMD Silva and H Zanin. Robust, flexible, freestanding, and high surface area activated carbon and multi-walled carbon nanotubes composite material with outstanding electrode properties for aqueous-based supercapacitors. Materials Advances 2021; 2(13), 4264-4276.
[6] G Wang, X Duan, D Wang, X Dong and X Zhang. Polyvinylidene fluoride effects on the electrocatalytic properties of air cathodes in microbial fuel cells. Bioelectrochemistry 2018; 120, 138-144.
[7] B Pal, S Yang, S Ramesh, V Thangadurai and R Jose. Electrolyte selection for supercapacitive devices: A critical review. Nanoscale Advances 2019; 1(10), 3807-3835.
[8] A Mendhe and HS Panda. A review on electrolytes for supercapacitor device. Discover Materials 2023. https://doi.org/10.1007/s43939-023-00065-3
[9] I Ishita, P Sahoo, PK Sow and R Singhal. Unlocking the potential of KI as redox additive in supercapacitor through synergistic enhancement with H2SO4 as a co-electrolyte. Electrochimica Acta 2023; 451, 142286.
[10] PEP Sari, A Subagio and NAK Umiati. Fabrication of MWCNT/S/AC battery electrodes using the doctor blade method with cyclic voltammetry (CV) testing of kcl electrolyte variations to determine specific capacitance values. International Journal of Scientific Research in Science and Technology 2025; 12(1), 563-566.
[11] DD Ristiana, M Handayani, MA Anggoro, BW Widagdo, E Angelina, H Sutanto, I Anshori, E Febriana, F Firdiyono, E Sulistiyono, AB Prasetyo, Lusiana and INGP Astawa. Reduced graphene oxide/nano-silica (rGO/n-SiO2) nanocomposite for electrode materials of supercapacitor with a high cycling stability. South African Journal of Chemical Engineering 2024; 48, 130-137.
[12] B Bagautdinov, K Ohara and AA Babaev. High-energy X-Ray diffraction study of multiwalled carbon nanotubes fabricated by arc discharge plasma process. Carbon NY 2022; 191, 75-83.
[13] A Awadallah-F and S Al-Muhtaseb. Carbon nanoparticles-decorated carbon nanotubes. Scientific Reports 2020; 10(1), 4878.
[14] R Yang, X Dong, G Chen, F Lin, Z Huang, M Manzo and H Mao. Novel terahertz spectroscopy technology for crystallinity and crystal structure analysis of cellulose. Polymers 2020; 13(1), 6.
[15] J Li, PHQ Pham, W Zhou, TD Pham and PJ Burke. Carbon-nanotube-electrolyte interface: Quantum and electric double layer capacitance. ACS Nano 2018; 12(10), 9763-9774.
[16] H Wu, X Wang, L Jiang, C Wu, Q Zhao, X Liu, B Hu and L Yi. The effects of electrolyte on the supercapacitive performance of activated calcium carbide-derived carbon. Journal of Power Sources 2013; 226, 202-209.
[17] M Javed, SM Abbas, M Siddiq, D Han and L Niu. Mesoporous silica wrapped with graphene oxide-conducting PANI nanowires as a novel hybrid electrode for supercapacitor. Journal of Physics and Chemistry of Solids 2018; 113, 220-228.
[18] M Reza, L Ernawati, A Hariyadi, RK Wardhani, TW Sari and N Sylvia. Analysis of KCl and H2SO4 electrolyte concentration variations on specific capacitance of electrodes (CNT/PVA) through cyclic voltammetry (CV). 2025; 10(2), 12956-12961.
[19] L Tang, X Ji, P Wu, H Luo, Y Zhu, L Deng, S Cheng and M Liu. Achievement of high energy carbon based supercapacitors in acid solution enabled by the balance of SSA with abundant micropores and conductivity. Electrochimica Acta 2020; 353, 136562.
[20] BJ Choudhury and VS Moholkar. Ultrasound-assisted facile one-pot synthesis of ternary MWCNT/MnO2/rGO nanocomposite for high performance supercapacitors with commercial-level mass loadings. Ultrason Sonochem. 2021; 82, 105896.
[21] M Zhong, M Zhang and X Li. Carbon nanomaterials and their composites for supercapacitors. Carbon Energy 2022; 4(5), 950-985.
[22] MW Hakim, I Ali, S Fatima, H Li, SHM Jafri and S Rizwan. Enhanced electrochemical performance of MWCNT-assisted molybdenum-titanium carbide MXene as a potential electrode material for energy storage application. ACS Omega 2024; 9(8), 8763-8772.
[23] NA Mukti, HR Taufiq, H Sutanto, M Diantoro, W Meevasana, A Purwanto and A Subsgio. MWCNT/AC electrode synthesis on supercapacitor performance with NaCl electrolyte. International Journal of Scientific Research in Science and Technology 2023; 10(6), 119-125.
[24] M Rosi, MNZ Fatmizal, DH Siburian, A Ismardi and NH Abdullah. Electrochemical properties of activated carbon electrodes for supercapacitor application: The effect of various electrolyte concentrations of Na2SO4. Jurnal Ilmiah Pendidikan Fisika Al-Biruni 2023; 12(2), 243-250.
[25] SB Aziz, PO Hama, PA Mohammed, MB Ahmed, RM Abdullah, NM Sadiq, MFZ Kadir and HJ Woo. Electrochemical properties of plasticized PVA-based electrolyte inserted with alumina nanoparticles for EDLC application with enhanced dielectric constant. Journal of Energy Storage 2024; 103(A), 114264.
[26] K Takeshita, Z Zhi and K Dokko. Li-Ion intercalation kinetics at LiMn2O4 thin film electrode/localized high-concentration electrolyte interface. ECS Meeting Abstracts 2024; 67, 4532.
[27] LS Kremer, T Danner, S Hein, A Hoffmann, B Prifling, V Schmidt, A Latz and M Wohlfahrt-Mehrens. Influence of the electrolyte salt concentration on the rate capability of ultra-thick NCM 622 electrodes. Batter Supercaps 2020; 3(11), 1172-1182.
[28] HJ Yang, D Han, J Kim, YH Kim and JH Bae. Constant phase element affected by ion transport in nanoporous electrodes. Journal of Electroanalytical Chemistry 2022; 922, 116766.
[29] M Janssen and J Bisquert. Locating the frequency of turnover in thin-film diffusion impedance. The Journal of Physical Chemistry C 2021; 125(28), 15737-15741.
[30] Z Ma, WL Dacayan, C Chatzichristodoulou, KS Mølhave, FM Chiabrera, W Zhang and SB Simonsen. Electrochemical impedance spectroscopy integrated with environmental transmission electron microscopy. Small Methods 2023; 7(7), e2201713.