Trends
Sci.
2026;
23(8):
12776
Multi-Scale Structural Analysis and Hierarchical Discrimination of Natural Chitin from Diverse Biological Sources
Numphon Thaiwong1, Narinthip Keawrangsi1, Suviporn Ruenphoklang1,
Muntita Kongsuk1, Narawich Phetsuk1, Kraisit Vasupen1, Kanokkarn Rabpairee2, Watcharaporn Toommuangpak2, Tanayt Sinprachim3, Supraewpan Lohalaksanadech3, Siriwan Nawong2 and Natta Kachenpukdee3,*
1Faculty of Agricultural Innovation and Technology, Rajamangala University of Technology Isan,
Nakhon Ratchasima 30000, Thailand
2Synchrotron Light Research Institute (Public Organization), Nakhon Ratchasima 30000, Thailand
3Aquaculture and Fishery Product Department, Faculty of Science and Fisheries Technology,
Rajamangala University of Technology Srivijaya, Trang Campus, Trang 92150, Thailand
(*Corresponding author’s e-mail: [email protected])
Received: 24 November 2025, Revised: 16 December 2025, Accepted: 26 December 2025, Published: 15 March 2026
Abstract
Chitin, one of the most abundant sustainable biopolymers in nature, exhibits source-dependent structural variations that significantly influence its functional properties and applications. This study presents a multi-scale morphological analysis combined with hierarchical multivariate discrimination to comprehensively characterize chitin extracted from 5 diverse biological sources: marine mollusks (cockle, mussel), marine crustacean (shrimp), and terrestrial insects (cricket, silkworm pupa). Chitin was extracted through sequential deproteinization, neutralization, and demineralization processes. Scanning electron microscopy at 25,000× magnification revealed distinct morphological characteristics across all sources. Marine mollusk chitin exhibited highly organized fibrous (cockle) and compact plate-like (mussel) structures, while shrimp demonstrated extensive porous networks. Multi-scale analysis (5,000× - 25,000×) of insect chitin revealed a remarkable hierarchical organization with a consistent sheet-like (cricket) and wrinkled (silkworm pupa) morphologies maintained across all magnification levels, distinguishing them from marine sources. Extraction yields varied significantly (4.09% - 15.07%), with marine sources (shrimp, cockle, mussel) achieving the highest yields, correlating with their high-density structures. Degree of acetylation ranged from 68.20 1.00% (cricket) to 83.39 1.26% (shrimp) to 89.15 1.52% (silkworm pupa), while true protein content ranged from 4.50 0.34% (shrimp) to 8.19 0.31% (cockle). Synchrotron Radiation-coupled Fourier-transform infrared (SR-FTIR) spectroscopy combined with hierarchical multivariate analysis (PCA) successfully discriminated all sources. Comprehensive PCA (73% variance) separated marine mollusks from other sources, but shrimp, cricket, and silkworm pupa remained overlapping. Focused PCA performed specifically on these 3 non-marine sources (71% variance) successfully resolved their subtle spectral differences. These findings establish structure-property relationships across multiple scales, providing practical guidance for selecting chitin sources for biomaterial applications. The multi-scale approach reveals that hierarchical organization in insect chitin influences extraction efficiency and molecular properties.
Keywords: Chitin, Comprehensive structural characterization, Hierarchical organization, SR-FTIR spectroscopy, Multivariate analysis, Principal component analysis, Marine biomaterials, Insect biomaterials
Introduction
Growing awareness of environmental issues is one of the driving forces behind the increasing popularity of renewable, bio-based materials over synthetic ones. This shift is leading to a greener future. Chitin, a nitrogen-containing polysaccharide, is the second most common biopolymer after cellulose. Chitin exhibits several key properties, including biodegradability, biocompatibility, non-toxicity, and functional versatility, making it particularly attractive for industrial applications [1]. Consequently, chitin finds widespread use in diverse industries, from food preservation and agriculture to wastewater treatment, cosmetics, biomedicine, and pharmacology [2], including advanced bioink applications for 3D printing [3]. Moreover, chitin serves as the precursor for chitosan production through deacetylation processes [4]. Chitosan, a biopolymer derivative with enhanced solubility, has extensive applications in the pharmaceutical and biomedical industries [5]. In 2025, the global chitin derivatives market was valued at US$131.08 million and is expected to reach US$165.49 million by 2034 [6].
The structure of chitin comprises N-acetyl-glucosamine units connected through β-1,4 glycosidic linkages to form a linear polymer [7]. It resembles cellulose, but the presence of an acetylamino group in place of the hydroxyl group leads to stronger hydrogen bonding and higher tensile strength in the chitin fiber structure [7]. Chitin is an important structural component in the exoskeletons of arthropods, fungal cell walls, and mollusk shells, protecting living organisms [2,8]. Key properties, including molecular weight, degree of deacetylation, crystallinity, and functional group distribution, vary depending on the biological source, extraction methodology, and processing conditions [9].
Chitin occurs naturally in 3 polymorphic forms (α, β and γ) with different orientations of microfibrils [10]. Crustacean chitin exhibits the α-form, characterized by an antiparallel chain arrangement that yields higher crystallinity through stronger hydrogen bonding [11,12]. In contrast, the β-form displays a parallel chain arrangement and is predominantly found in mollusk sources [13]. The γ-form contains both parallel and antiparallel chain arrangements, which result in properties that are intermediate between those of the α- and β-forms [10]. This polymorph is also found in insect cocoons [14]. The differences in chitin form determine its suitability for various industrial applications.
Source is a key factor influencing chitin’s properties. In previous research, chitin was extracted and characterized from diverse sources, including insects (Hermetia illucens and Tenebrio molitor) [15,16], mollusks (Ensis arcuatus and Modiolus modiolus) [17,18], and fungi (Ganoderma lucidum and Hericium erinaceus) [19]. Moreover, studies of structural stability in chitin from marine sources, such as Antarctic krill, white shrimp, and crayfish [20], revealed differences in crystallinity among the sources (white shrimp: 87% vs. Antarctic krill: 78%). Similarly, chitin from Coenobita brevimanus exhibits a unique 5-layer sublayer structure: a sandwich-like mechanical gradient also found in mollusk nacre [21] as described by Lin et al. [22].
Beyond marine sources, insect-derived chitin exhibits morphologically diverse structures, displaying 4 distinct surface morphologies as revealed by Scanning Electron Microscopy (SEM): (I) nanofiber, (II) nanopore, (III) smooth surface, and (IV) rough surface [23]. Species such as black soldier fly (Hermitia illucens), wasps (Vespa spp.), and cockroaches (Blaberus giganteus) demonstrate highly ordered nanofiber structures, while grasshopper species exhibit irregular block structures without porosity, reflecting the inherent structural variability across insect sources [23]. Despite this diversity, systematic studies using integrated SR-FTIR spectroscopy, multi-scale morphological analysis, and hierarchical multivariate discrimination remain rare. SR-FTIR offers significant advantages over conventional FTIR: higher spatial resolution (beam size < 10 µm) [24], superior spectral quality, and enhanced signal-to-noise ratio [25]. These capabilities enable better discrimination of subtle spectral differences in complex biomaterials and the establishment of robust structure-property relationships across diverse sources. Accordingly, this research focused on extracting and characterizing chitin from insect and shellfish sources using integrated SR-FTIR spectroscopy, multi-scale morphological analysis, and hierarchical PCA to assess source-dependent structural variations systematically.
The different polymorphic forms of chitin and their distinct structural properties significantly influence how suitable they are for various applications. Consequently, selecting the right chitin source is essential for designing optimal biomaterials. Rigid α-chitin from crustaceans is characterized by an antiparallel chain arrangement and high crystallinity. Rigid α-chitin form is preferred for structural applications, including biocomposite reinforcement [26], food packaging with enhanced barrier properties [26], and mechanically demanding scaffolds [27]. In contrast, more flexible chitin variants from mollusks and insects are better suited for biomedical applications that require biocompatibility and flexibility, such as drug delivery systems, absorbable wound dressings, and injectable biomaterials [28,29]. Variations in protein content and surface morphology across different chitin sources influence both extraction efficiency and the biochemical properties of the final product. Thus, understanding these source-specific differences is essential for optimizing both chitin selection and biomaterial performance.
The objectives of this research were to (1) extract and characterize chitin from 5 taxonomically diverse sources-shrimp shells, cockle shells, mussel shells, crickets, and silkworm pupae; (2) analyze and compare their structural profiles using SR-FTIR spectroscopy and multi-scale SEM to reveal hierarchical organization; and (3) assess relationships between taxonomic origin and structural characteristics through hierarchical PCA. Our findings reveal distinct spectral signatures and scale-dependent morphological features unique to each biological source, providing practical guidance for source selection in developing sustainable biomaterials from alternative sources.
Materials and methods
This study systematically characterized chitin extracted from 5 taxonomically diverse biological sources through integrated multi-scale analytical approaches. The complete experimental workflow is illustrated in Figure 1, which provides a comprehensive overview of the sequential processes from raw material preparation through final characterization. Key operational parameters are indicated at each procedural step.
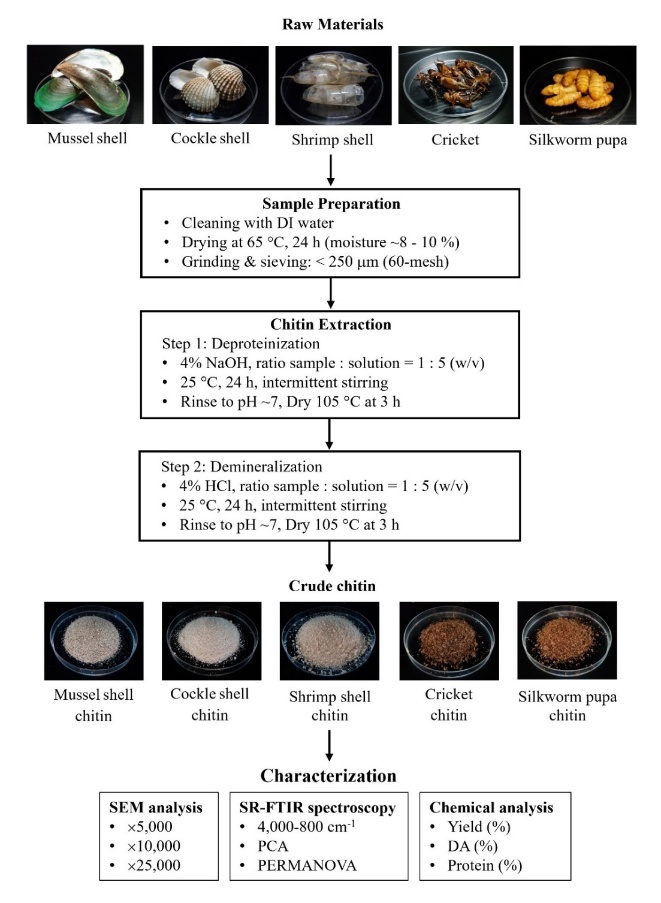
Figure 1 Schematic workflow shows chitin extraction from 5 biological sources and subsequent characterization using multi-scale SEM, SR-FTIR spectroscopy with PCA, and chemical analysis.
Sample preparation
Raw materials (shrimp shells, cockle shells, and mussel shells collected) were obtained from local restaurants in Mueang District, Nakhon Ratchasima Province, Thailand. Frozen crickets and silkworm pupae (Kwanjai Cricket Farm brand) were purchased from Makro and thawed at room temperature to preserve tissue structure. All raw materials were thoroughly washed with deionized water and dried in a tray dryer (HS-169, O.V.D Series 10 Trays, AT Packing, Thailand) at 65 °C for 24 h until the moisture content reached approximately 8% - 10%. The dried samples of cockle shells, mussel shells, and shrimp shells were manually ground into fine powder using a stone mortar. Dried crickets and dried silkworm pupae were re-sized with a laboratory blender (Waring™ Laboratory Blenders, USA). All powdered samples were sieved through a 60-mesh screen (particle size: < 250 m) to achieve a uniform particle size distribution. The prepared samples were stored in sealed aluminum foil pouches at room temperature and subjected to chitin extraction within 48 h to minimize moisture reabsorption and microbial contamination.
Chitin extraction
The chitin extraction procedure was adapted from Zia et al. [30] with modifications, comprising 2 sequential steps: Deproteinization followed by demineralization. Mild extraction conditions (4% NaOH, 4% HCl, 25 °C, 24 h) were applied uniformly across all 5 sources. Although protein-chitin binding strength varies among taxa, these mild conditions were selected to ensure extraction reproducibility while preserving native chitin structure. This standardization enables direct structural comparison among sources while controlling extraction-related variables.
Deproteinization
Powdered samples were treated with 4% (w/v) sodium hydroxide (NaOH, ≥ 98%, Loba Chemie, India) at a solid-to-liquid ratio of 1:5 (w/v) and incubated at ambient temperature (25 2 °C) for 24 h with intermittent stirring. After treatment, the samples were rinsed repeatedly with distilled water until the pH reached neutrality (pH ~7). The deproteinized samples were then dried in a hot air oven (ED 115, BINDER, Germany) at 105 °C for 3 h.
Demineralization
The dried deproteinized samples were subsequently treated with a 4% (v/v) hydrochloric acid (HCl, 37%, RCI Labscan, Ireland) at a solid-to-liquid ratio of 1:5 (w/v) at ambient temperature for 24 h with intermittent stirring. Following the treatment, samples were rinsed again with distilled water to reach neutrality (pH ~7). The demineralized samples (crude chitin) were dried in a hot-air oven (ED 115, BINDER, Germany) under the same conditions as during the deproteinization process. Afterwards, chitin was kept in sealed aluminum foil pouches until further analysis.
Scanning Electron Microscopy (SEM) analysis
The surface morphology of chitin samples was observed using a scanning electron microscope (SEM; Quanta 450, FEI, Oregon, USA). Dried chitin powder samples were ground and mounted on aluminum stubs with double-sided carbon tape, then cleaned with nitrogen gas to remove loose particles. The samples were sputter-coated with gold-palladium to enhance conductivity and prevent charging effects. SEM imaging was performed under high vacuum conditions at an accelerating voltage of 10kV. Micrographs were captured at magnifications of 5,000×, 10,000×, and 25,000× to evaluate the surface morphology, fibrous structure, and microstructural features of the extracted chitin.
Yield calculation
Extraction yields were calculated gravimetrically through measurement of the initial raw material powder and final dried chitin product. Samples were weighed using an analytical balance with 0.0001 g readability (Model BSA224S-CW, Sartorius, Germany). Chitin yield was calculated using Eq. (1):
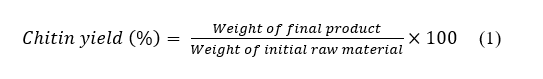
where the weight of the final product refers to the dried chitin obtained after demineralization, and the weight of the initial raw material refers to the dried, powdered sample before deproteinization.
Protein determination
Protein analysis based on Kjeldahl nitrogen determination [31]. Samples were digested with concentrated sulfuric acid, followed by distillation and titration. Results were calculated as crude protein using the conversion factor of 6.25. The actual protein content was corrected for nitrogen present in the chitin structure using Eq. (2):
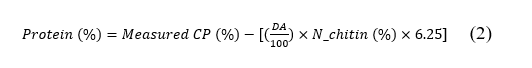
where CP = crude protein, N_chitin = theoretical N content in pure chitin (%) = 6.89.
Degree of acetylation
The degree of acetylation (DA) was determined from SR-FTIR absorbance ratios as described by Baxter et al. [32] using Eq. (3):
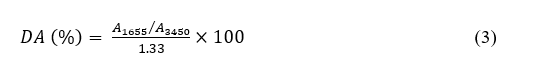
where A₁₆₅₅ and A₃₄₅₀ represent the absorbance values at 1,655 cm−1 (amide I band) and 3,450 cm−1 (hydroxyl band), respectively.
Synchrotron Radiation-Fourier Transform Infrared (SR-FTIR) spectroscopy and multivariate analysis
SR-FTIR spectroscopy was performed at Beamline 4.1, Synchrotron Light Research Institute (SLRI), Nakhon Ratchasima, Thailand, using a Bruker Vertex 70 spectrometer coupled with a Hyperion 3000 microscope (Bruker Optik GmbH, Ettlingen, Germany). Dried chitin powder samples were dispersed as thin films on barium fluoride (BaF2) infrared windows for transmission measurements. Spectra were acquired using a 36× objective with a liquid nitrogen-cooled mercury cadmium telluride (MCT) detector in transmission mode over the range 4,000 - 800 cm at 4 cm−1 resolution. Each spectrum corresponded to 64 co-added scans through a 20×20 m2 aperture. For each biological source, 5 independent samples were analyzed, with 10 spectra collected per sample distributed across randomly selected measurement points throughout the sample area. A total of 50 spectra per source were retained for subsequent multivariate analysis.
Data acquisition was controlled via OPUS 7.5 software (Bruker Optik GmbH, Ettlingen, Germany). The Unscrambler X 10.5 platform (CAMO Software AS, Oslo, Norway) was employed for multivariate statistical analysis. Preprocessing steps comprised Savitzky-Golay second-order derivative calculation and EMSC-based normalization, followed by PCA for sample discrimination and quality control.
Statistical analysis
All experiments were performed in triplicate. Data are presented as mean standard deviation. Statistical differences in chemical parameters were evaluated using 1-way ANOVA followed by Tukey’s HSD post hoc test (p < 0.05) via JASP software (Version 0.19.3.0, JASP Team, University of Amsterdam, The Netherlands). Multivariate differences were assessed by PERMANOVA based on Euclidean distances of PC scores (9999 permutations, p < 0.001) with post-hoc pairwise tests.
Results and discussion
Morphological characterization of chitin
The surface morphology of chitin, as observed using SEM at multiple magnifications (Figures 1 and 2), revealed distinct structural features from various biological sources.
High-magnification analysis
Marine crustacean-derived chitin exhibited diverse morphologies at high magnification (25,000×, Figure 2). Chitin from cockle shells exhibits a highly organized fibrous structure, with chitin fibers arranged parallel to each other (Figure 2(A)), a characteristic of well-crystallized α-chitin. Mussel shell-derived chitin displayed a compact, plate-like morphology with overlapping lamellar structures (Figure 2(B)), indicating a tight packing and dense organization. Chitin from shrimp shells showed a well-developed porous network with oval-shaped pores evenly distributed over the surface (Figure 2(C)), indicating that chitin from this source may have a higher specific surface area than chitin from other sources. In contrast, insect-derived chitin exhibited distinct sheet-like morphologies at high magnification. Cricket chitin presented smooth, flexible sheets with prominent folding (Figure 2(D)), while silkworm pupa chitin displayed a wrinkled layered structure with irregular surface topology (Figure 2(E)).
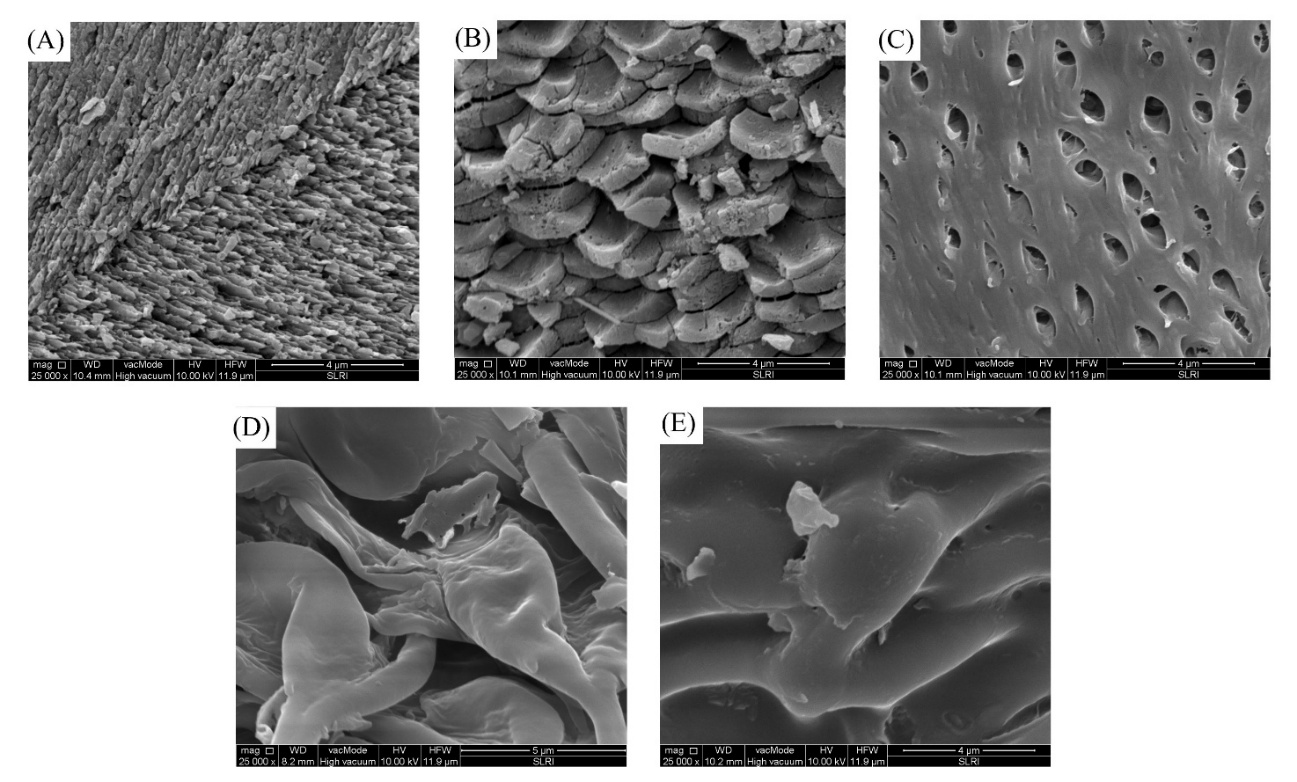
Figure 2 SEM images of chitin powder from mollusk, crustacean, and insect sources at 25,000×: (A) cockle shell, (B) mussel shell, (C) shrimp shell, (D) cricket, and (E) silkworm pupa. Dried samples were ground, extracted, and gold-palladium coated. Scale bars = 5 µm.
Multi-scale structural organization
Lower magnification analysis (5,000× - 10,000×) of selected samples (shrimp, cricket, and silkworm pupae) revealed their hierarchical structural organization (Figure 3). Although analysis at high magnification (25,000×, Figure 2) provides fine microstructural details, examination at low magnification reveals the hierarchical arrangement and overall structural context more clearly.
Shrimp chitin revealed extensively interconnected porous structures at 10,000× magnification (Figure 3(A)), confirming the porous network architecture observed at 25,000× magnification (Figure 2(C)) across multiple scales. Cricket and silkworm pupa chitin maintained their characteristic sheet-like and wrinkled morphologies, respectively, at 10,000× magnification (Figures 3(B) and 3(C)). Notably, lower magnification analysis (5,000×) of insect-derived chitin revealed distinctive macroscale features that distinguish these materials from those of marine crustaceans (Figures 3(D) and 3(E)). Cricket chitin displayed large sheet structures with uniform folding patterns extending across the entire field of view (Figure 3(D)). In contrast, silkworm pupa chitin exhibited a continuously wrinkled layer network throughout the material, with wave-like architecture preserved across all macroscopic regions (Figure 3(E)).
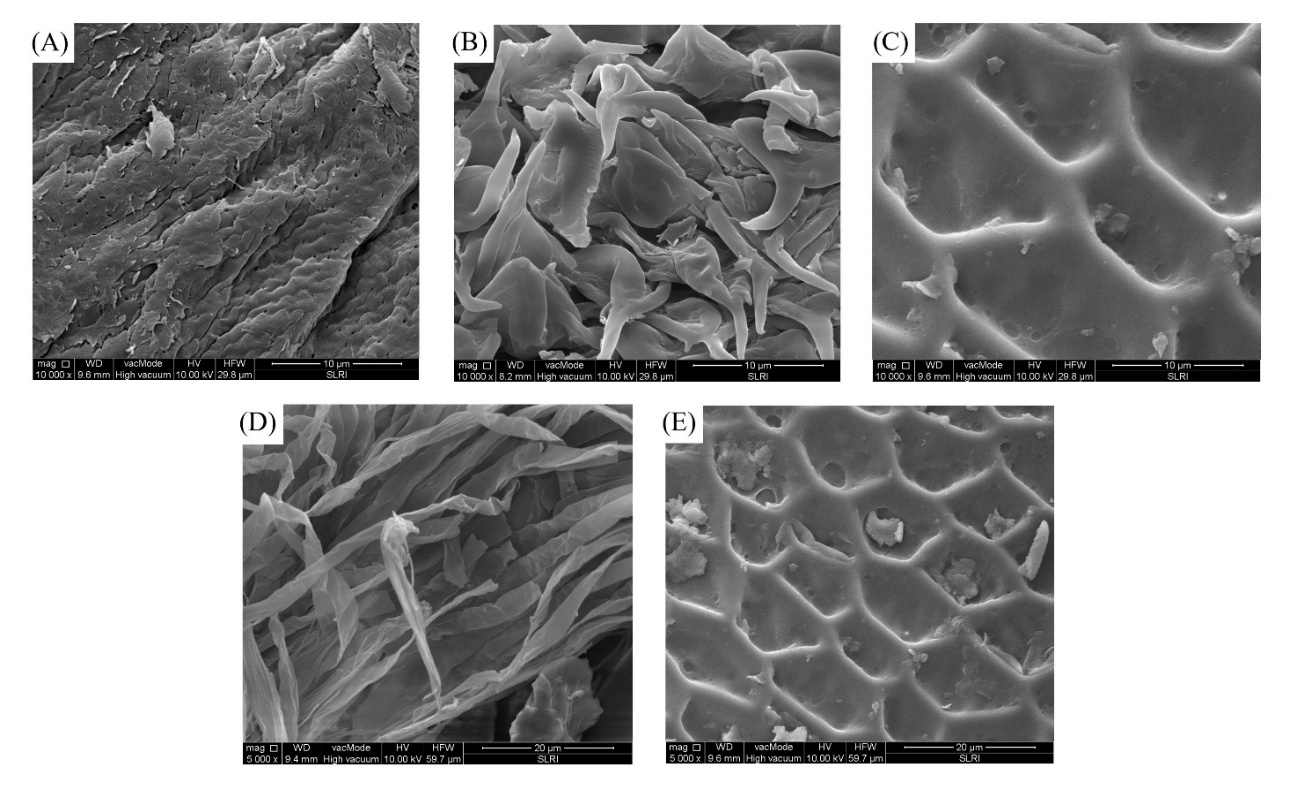
Figure 3 Multi-magnification SEM images of chitin powder from crustacean and insect sources: (A) shrimp (10,000×), (B) cricket (10,000×), (C) silkworm pupa (10,000×), (D) cricket (5,000×), and (E) silkworm pupa (5,000×). Dried samples were ground, extracted, and gold-palladium coated. Scale bars: 10 µm (A-C), 20 µm (D-E).
Insect-derived chitin (crickets and silkworm pupae) exhibited pronounced hierarchical organization, with microscopic features at 25,000× magnification (Figures 2(D) and 2(E)) contributing to the macroscopic architecture (Figures 3D and 3E). The observed hierarchical organization reflects the composite nature of arthropod chitin, which combines with tanned proteinaceous matrices to form sclerotin in insect cuticle [12]. Sclerotin exhibits greater hardness and stiffness than pure chitin, while maintaining toughness and fracture resistance, thereby providing the strength-flexibility balance essential for terrestrial life, such as in the rigid wings of insects [33]. In contrast, marine-derived chitin exhibits structural diversity reflecting varied functional requirements.
In mollusk shells, chitin serves as a framework for the crystallization of calcium carbonate [34,35], with its hierarchical organization conferring mechanical properties essential for shell protection [32]. On the other hand, crustacean-derived chitin, such as that from shrimp shells, displays a highly porous microstructure with specific surface areas ranging from 1.72 to 2.11 m2/g [33]. Shrimp shells have a porous structure, which is highly beneficial for deacetylation, making them a valuable raw material for the direct production of chitin [12]. These morphological differences demonstrate that chitin source profoundly influences structural characteristics, reflecting the biological role and anatomical requirements of each organism.
Characterization of extracted chitin: Yield, degree of acetylation, and protein content
The quality and characteristics of chitin varied significantly among different sources, as shown in Table 1. Key parameters, including degree of acetylation (DA), true protein content, and extraction yield, were evaluated to assess the suitability of each source for various applications. Chitin extraction yields varied significantly among sources, ranging from 4.09% to 15.07%. Crustacean and molluscan sources (shrimp: 15.07 0.27%, cockle: 14.70 0.26%, mussel: 13.08 0.34%) yielded significantly higher chitin than insect sources (cricket: 7.85 0.19%, silkworm pupa: 4.09 0.10%) (p < 0.05).
Table 1 Extraction yield, degree of acetylation, and true protein content of chitin from different sources.
Sample |
Yield (%) |
DA (%) |
Measured CP (%) |
True Protein (%) |
Shrimp |
15.07 0.27a |
83.39 1.26a |
33.13 0.97c |
4.50 0.34c |
Mussel |
13.08 0.34b |
76.19 1.23bc |
38.82 1.08b |
6.41 0.42b |
Cockle |
14.70 0.26a |
74.92 0.80c |
39.44 1.19b |
8.19 0.31a |
Cricket |
7.85 0.19c |
68.20 1.00d |
37.75 0.75b |
7.52 0.24a |
Silkworm pupa |
4.09 0.10d |
78.98 1.48b |
42.44 0.91a |
7.90 0.28a |
Note: Values are mean SD (n = 3). Different superscript letters in the same column indicate statistically significant differences at p < 0.05 level (1-way ANOVA followed by Tukey’s HSD post-hoc test).
The DA value, which reflects the proportion of N-acetyl-D-glucosamine units in the polymer chain, ranged from 68.20 1.00% (cricket) to 83.39 1.26% (shrimp). All samples showed DA > 50% which confirmed that they retained their original chitin structure due to high levels of acetyl groups, indicating non-conversion to chitosan [9]. Shrimp chitin exhibited the highest DA (83.39%), followed by silkworm pupa (78.98%), mollusks (74.92% - 76.19%), and cricket (68.20%). High DA values, particularly in chitin derived from crustaceans and insects, are an important factor for applications requiring high crystallinity and mechanical strength, as the degree of crystallinity directly affects the stiffness and load-bearing capacity of the material [27]. The observed variation in DA among different taxonomic groups may reflect inherent differences in chitin crystallinity, polymer organization, and protein-chitin interactions. The superior DA in crustacean-derived chitin (83.39%) compared to mollusks (74.92% - 76.19%) and insects (68.20% - 78.98%) suggests that α-chitin structure facilitates better preservation of acetyl groups during extraction than β-chitin or insect cuticle structures [36].
The mild conditions used for chitin extraction (4% NaOH, 25 °C, 24 h) consistently yielded high DA values (68.20% - 83.39%), providing direct evidence of successful preservation of chitin structure. In contrast, studies on chitin deacetylation using concentrated NaOH (40% - 50%) at high temperatures (100 - 120 °C) found deacetylation degrees of 71.9% - 93% [37-39], effectively converting chitin to chitosan. This inverse relationship (increasing NaOH concentration, decreasing acetylation) confirms that mildly alkaline conditions are optimal for chitin extraction while minimizing structural degradation. Therefore, the observed differences in DA values among the 5 raw materials (68.20% - 83.39%) primarily reflect inherent differences in chitin structure and crystallinity, rather than excessive deacetylation during the extraction process.
True protein content ranged from 4.50 0.34% (shrimp) to 8.19 0.31% (cockle). Shrimp chitin showed significantly lower residual protein than all other sources, followed by mussel (6.41 0.42%). In contrast, cricket (7.52 0.24%), silkworm pupa (7.90 0.28%), and cockle (8.19 0.31%) showed the highest residual protein with no significant differences among them (p < 0.05). These differences reflect the specificities of protein-chitin structure within each taxonomic group, as the association between chitin and proteins varies significantly among crustaceans, insects, and mollusks [40].
In mollusk shells, proteins and polysaccharides form a hierarchical brick-and-mortar structure [41]. Aragonite crystals form the bricks, while the organic matrix serves as an elastic, viscous cement that tightly binds the crystals together. Protein-chitin interactions in crustaceans are weaker than those in mollusks and insects, facilitating the easier removal of protein during extraction. Conversely, mollusks and insects exhibit stronger covalent and mineral-mediated crosslinks between protein and chitin, resulting in greater resistance to protein removal [41,42]. However, the retention of good DA levels (> 68%) across chitin from different sources confirms that the extraction process effectively preserved the native chitin structure with minimal degradation [9]. For applications requiring high purity, it is recommended to use crustacean chitin [35]. Conversely, for general chitin applications, other sources may be considered based on sustainability and cost-effectiveness [43].
The variations in chitin yield, DA, and residual protein content among different biological sources are partially attributable to inherent taxonomic differences [35]. However, these variations may also reflect the influence of extraction parameters, including the acid-base solvent ratio, extraction sequence, incubation time, and processing temperature [18,26]. In particular, optimizing these parameters according to source-specific characteristics can substantially enhance chitin extraction efficiency and minimize residual protein content. For example, the strong protein-chitin interactions in mollusk samples would benefit significantly from such optimization [34,35,41]. Crustaceans, mollusks, and insects exhibit differential strength in their protein-chitin crosslinks [10,44]. Therefore, systematic optimization studies tailored to each source category would be essential. Establishing standardized extraction protocols suitable for large-scale industrial applications is therefore necessary [16,17].
SR-FTIR spectroscopic characterization
SR-FTIR analysis of chitin from different sources revealed characteristic absorption bands with source-specific variations in peak positions and intensities (Figure 4).
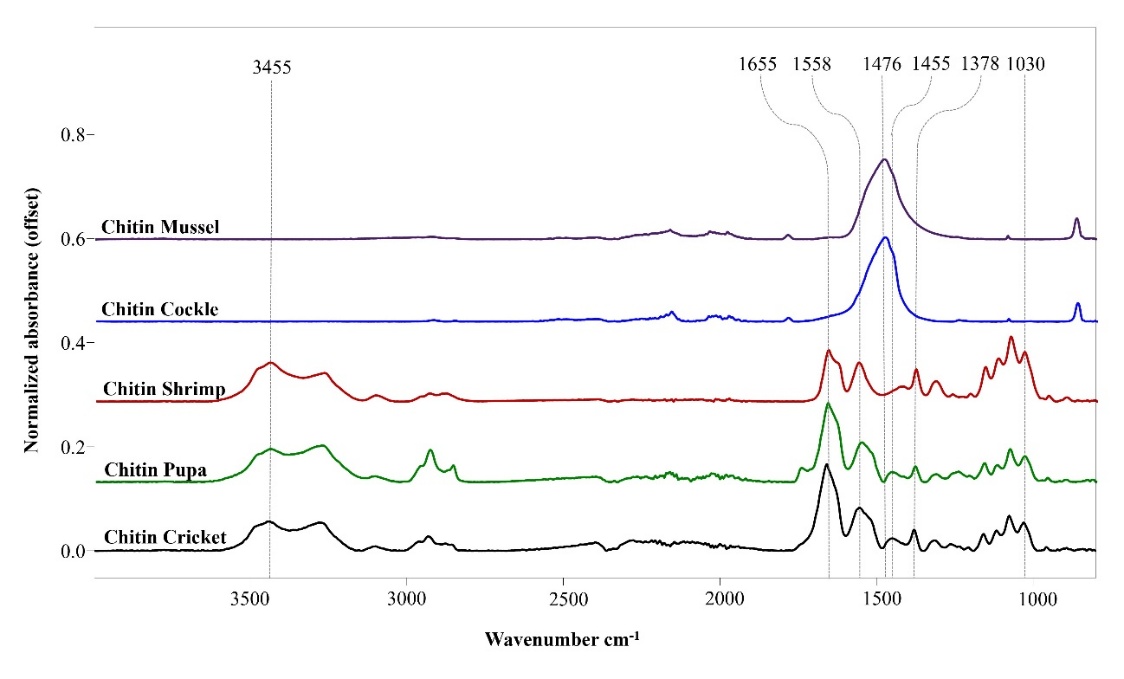
Figure 4 SR-FTIR spectra of chitin from different sources. Spectra were normalized to the amide I peak (1655 cm-1). Major absorption bands: 3,455 cm−1 (O-H/N-H), 1,655 cm−1 (amide I, C=O), 1,558 cm−1 (amide II, N-H bend), 1,378 cm−1 (crystallinity index), and 1,030 cm−1 (C-O stretching). Shrimp chitin displays sharp, well-defined amide bands reflecting high crystallinity. Marine mollusks (cockle, mussel) show elevated baseline in the fingerprint region (1,000 - 1,200 cm−1), indicating higher residual protein and mineral-chitin association. Insect-derived chitin (cricket, silkworm pupa) exhibits pronounced O-H/N-H stretching, characteristic of elevated protein content and chitin-protein complexes.
All samples exhibited consistent positions for the amide I (1,655 2 cm−1) and amide II bands (1,558 3 cm−1), confirming the predominance of the α-chitin allomorph [45,46]. Spectral variations among sources were most pronounced in the C-O and C-O-C stretching region (1,000 - 1,200 cm−1) [47,48] and at 1,378 cm−1 (attributed to amide N-C stretching and used as a crystallinity index) [49]. These differences indicate variations in crystallinity and degree of acetylation [45].
Marine mollusk chitin (cockle and mussel) exhibited higher baseline absorbance in the fingerprint region (1,500 - 1,000 cm−1) [50], correlating with their higher residual protein content (8.19% for cockle and 6.41% for mussel, Table 1). Such protein-chitin complexes, arising from incomplete removal during extraction, produce observable spectral features.
Insect-derived chitin (cricket and silkworm pupa) showed pronounced O-H/N-H stretching bands around 3,455 cm−1 [33], reflecting differential water binding or free hydroxyl groups. This enhanced absorption is consistent with their higher residual protein content (7.52% - 7.90%, Table 1) and the distinct protein compositions of sclerotized cuticular structures [33]. Shrimp shell chitin exhibited intermediate spectral characteristics between marine mollusks and terrestrial insects, consistent with its phylogenetic position as a marine arthropod [46]. Importantly, intensity variations at 1,378 cm−1 (crystallinity index) correlated inversely with the degree of acetylation observed in Table 1 [49,50]. These source-specific spectral variations provide the foundation for hierarchical multivariate discrimination analysis, which systematically differentiates among chitin sources based on their spectral signatures.
Principal component analysis of SR-FTIR spectra
Comprehensive analysis of all 5 sources
Principal component analysis (PCA) was performed on SR-FTIR spectra (4,000 - 400 cm−1) to evaluate spectral variations among all 5 chitin sources (Figure 5).
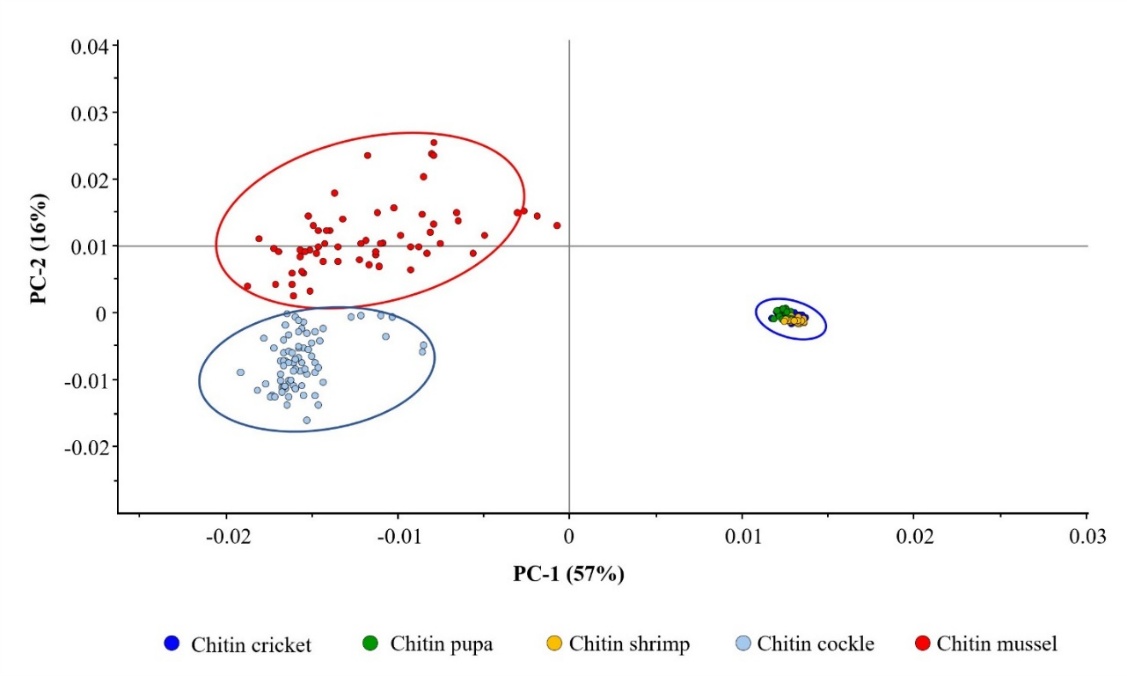
Figure 5 Principal component analysis (PCA) score plot of SR-FTIR spectra for chitin from all 5 sources. Each data point represents an individual SR-FTIR measurement (n = 30 - 50 per source). Ellipses represent 95% confidence intervals. PC-1 (57%) and PC-2 (16%) explained 73% of total variance. Clear separation between marine mollusk (cockle, mussel) and non-marine sources (shrimp, cricket, silkworm pupa) was observed along PC-1. Marine mollusk sources further separated along PC-2, while non-marine sources formed overlapping clusters. PERMANOVA analysis confirmed significant differences among marine mollusk sources (cockle vs. mussel, p < 0.001) and between marine mollusk and non-marine groups (p < 0.001 for all comparisons).
The first 2 principal components accounted for 73% of the total variance: PC-1 explained 57% and PC-2 explained 16%. Along PC-1, a clear separation was observed between marine mollusk and non-marine arthropod chitin. Marine mollusk chitin formed 2 distinct clusters in the negative PC-1 and positive PC-2 regions. Such cockle chitin clustered in the lower portion, while mussel chitin occupied the upper portion with slightly higher PC-2 values. These spectral variations between the 2 mollusk sources reflect species-specific differences in chitin-protein interactions and biomineralization processes [51].
Non-marine sources (shrimp, cricket, and silkworm pupa) clustered together in the positive PC-1 region, forming a large, overlapping group. The overlap reflects more subtle spectral differences than the marine-nonmarine distinction. This appearance is explained by the similar growth environmental conditions (the absence of seawater minerals) and comparable biosynthetic pathways in terrestrial and freshwater arthropods [52]. In Figure 5, PCA revealed statistically significant differences between marine mollusk and non-marine groups (p < 0.001). However, pairwise comparisons within the non-marine group showed no significant separation in the comprehensive PCA analysis. These results highlight that the dominant marine-nonmarine separation masked the subtle spectral variations among shrimp, cricket, and silkworm pupa. Focused PCA was therefore necessary for clear discrimination.
The partial spectral overlap observed among non-marine sources in the comprehensive PCA analysis can be attributed to the dominance of marine mollusk spectral signatures along PC-1. Marine mollusk chitin exhibits distinctly elevated baseline absorbance in the fingerprint region (1,000 - 1,200 cm−1) relative to non-marine sources. This characteristic is correlated with their higher residual protein content (cockle: 8.19 0.31%, mussel: 6.41 0.42%, Table 1) and associated mineral-protein complexes. Such a robust spectral signal, representing fundamental biosynthetic differences between mollusk and non-mollusk sources, accounts for 57% of the variance explained by PC-1. As a result, the more subtle spectral differences among non-marine arthropods are effectively masked across secondary components (PC-2: 16%). The spectral variations distinguishing shrimp, cricket, and silkworm pupa derive from their different acetylation degrees (shrimp: 83.39%, cricket: 68.20%), protein compositions, and hierarchical architectures. Consequently, these variations remain insufficiently resolved to achieve clear discrimination among the 3 non-marine sources.
A second PCA analysis was performed exclusively on chitin from shrimp, cricket, and silkworm pupa (Figure 6) to resolve the masked spectral differences among non-marine sources. Upon removing marine mollusk samples that dominated PC-1 variance, the analysis captured more subtle spectral variations specific to these 3 sources. The focused PCA revealed clear separation among all 3 non-marine sources, with PC-1 and PC-2 explaining 53% and 18% of variance, respectively (71% cumulative). Shrimp chitin demonstrated the most compact clustering, reflecting high spectral consistency, whereas silkworm pupa exhibited the broadest distribution, indicating greater spectral variability. Cricket chitin showed intermediate characteristics. PERMANOVA confirmed statistically significant differences among all 3 sources (all p < 0.001): shrimp vs. cricket, shrimp vs. silkworm pupa, and cricket vs. silkworm pupa.
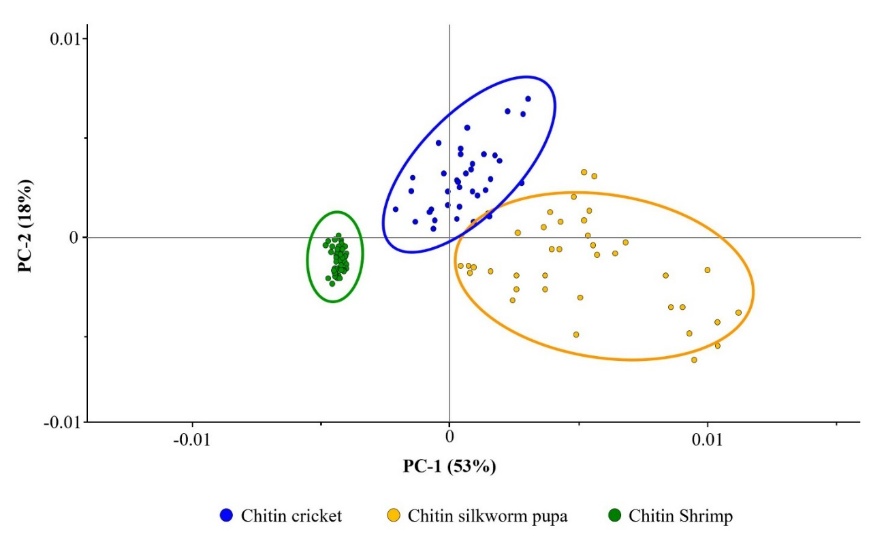
Figure 6 Principal component analysis (PCA) score plot of SR-FTIR spectra for non-marine chitin sources only. Each data point represents an individual SR-FTIR measurement (n = 30 - 50 per source). Ellipses represent 95% confidence intervals. PC-1 (53%) and PC-2 (18%) explained 71% of the total variance. Clear separation was achieved among all 3 sources: Shrimp formed a compact cluster at negative PC-1, cricket occupied distinct positive PC-1/PC-2 space, and silkworm pupa showed broader distribution across positive PC-1 with intermediate PC-2 values. PERMANOVA analysis confirmed statistically significant differences among all 2 sources for all pairwise comparisons (p < 0.001): shrimp vs. cricket, shrimp vs. silkworm pupa, and cricket vs. silkworm pupa.
The resolved spectral signatures reflect 2 interdependent factors. First, acetylation-dependent differences generate distinct amide signals, with shrimp (DA: 83.39%) showing higher intensity than cricket (68.20%), as evident in Figure 4. Second, protein content variability is manifested in the O-H/N-H stretching region (3,455 cm−1), where insect sources (cricket: 7.52%, silkworm: 7.90%) show elevated intensities versus shrimp (4.50%). Third, hierarchical structural organization differs markedly: shrimp display a porous network architecture (Figures 2(C) and 3(A)), cricket shows sheet-like structures, and the silkworm pupa exhibits wrinkled, layered morphologies (Figures 2(D), 2(E), 3(D) and 3(E)). These morphological differences are reflected in conformational variations detectable by FTIR spectroscopy.
The quantitative relationships confirm that these spectral differences are significant. The acetylation difference between shrimp (DA: 83.39%) and cricket (DA: 68.20%) is 15.19%, and this difference correlates with crystallinity index variations (1,378 cm−1) (Table 1). The protein content differences manifest as differential O-H/N-H stretching intensities. SR-FTIR spectroscopy combined with hierarchical multivariate analysis enables effective discrimination among non-marine chitin sources. This effectiveness arises because analytical approaches account for multifactorial compositional variation.
The clear separation among all 3 non-marine sources in the focused PCA reflects differences in acetylation degree, protein content, and hierarchical structure. The intermediate position of shrimp chitin in PCA space is particularly noteworthy, as it reflects its phylogenetic position between marine and terrestrial arthropods [20]. Such positioning indicates evolutionary adaptation in cuticle composition and protein-chitin interactions, evident from spectral signatures that demonstrate source-specific biosynthetic pathways. From the sclerotized cuticle structures in insects [33] to the crustacean cuticle organization revealed in shrimp (Figures 2 - 3), these molecular-scale variations are readily detectable by FTIR spectroscopy. By using SR-FTIR spectroscopy combined with hierarchical multivariate analysis, one can effectively discriminate among non-marine chitin sources. Such discrimination is achieved by appropriately isolating the dominant confounding variance arising from marine-terrestrial differences. These findings underscore the importance of informed analytical strategies when characterizing complex natural biopolymers. Chitin’s structural and compositional diversity suggests its potential as a sustainable reinforcing material for sensor technologies [53]. The inherent antimicrobial properties of chitin can be enhanced by surface modification with suitable metal oxide nanocomposites, such as CdO-NiO and CuO-TiO2 systems [54,55]. Future research may explore chitin-nanocomposite hybrid systems for biomedical and environmental applications. By combining chitin’s structural advantages with the enhanced antimicrobial and catalytic properties of nanocomposites, such systems offer promising functionality.
Conclusions
A multi-scale study characterized chitin from 5 diverse sources, revealing structure-property relationships critical for biomaterial applications. Marine mollusks displayed highly organized structures, whereas non-marine arthropods showed contrasting morphologies. The latter ranged from porous networks (shrimp) to hierarchical organization (insects). Chemical characterization revealed significant variations in yields and molecular properties reflecting biosynthetic environments. Marine mollusk sources achieved superior extraction yields, while crustacean chitin (shrimp) demonstrated the highest acetylation (DA: 83.39%), and insect-derived chitin showed variable properties. PCA analysis effectively discriminated among all sources, revealing fundamental marine-terrestrial differences in chitin composition and structure. Accordingly, marine mollusk sources are recommended for high-purity applications, such as biomedical scaffolds and pharmaceutical excipients. Crustacean chitin with superior acetylation is suitable for applications demanding high crystallinity and mechanical strength. Insect-derived chitin’s hierarchical structures are ideal for nanocomposites and tissue-engineering matrices, where scale-dependent properties provide significant advantages. This study employed standardized extraction conditions across all sources; source-specific optimization could yield different results.
Acknowledgements
The authors acknowledge the Synchrotron Light Research Institute (SLRI), Thailand, the Faculty of Agricultural Innovation and Technology, Rajamangala University of Technology Isan, Thailand and the Aquaculture and Fishery Product Department, Faculty of Science and Fisheries Technology, Rajamangala University of technology Srivijaya, Trang campus, Thailand.
Declaration of generative AI in scientific writing
Generative AI tools (Claude) were used to improve the readability and language clarity of this manuscript. All content remains under full author responsibility and oversight.
CRediT author statement
Numphon Thaiwong: Conceptualization; Investigation; Data curation; Visualization; Writing - Original draft preparation; Writing - Review and editing. Narinthip Keawrangsi: Investigation. Suviporn Ruenphoklang: Investigation. Muntita Kongsuk: Investigation. Narawich Phetsuk: Investigation. Kraisit Vasupen: Methodology; Supervision; Resources. Tanayt Sinprachim: Methodology; Supervision; Resources. Supraewpan Lohalaksanadech: Methodology; Supervision; Resources. Kanokkarn Rabpairee: Formal analysis. Watcharaporn Toommuangpak: Formal analysis. Siriwan Nawong: Conceptualization; Methodology; Project administration; Supervision; Resources; Writing - Review and editing. Natta Kachenpukdee: Conceptualization; Methodology; Project administration; Supervision; Resources; Writing - Review and editing.
References
[1] AK Azad, T Bhattacharya, MS Hasnain, G Tripathi and AK Nayak. Chitin- and chitosan-based nanomaterials for therapeutic applications. In: MS Hasnain, AK Nayak and TM Aminabhavi (Eds.). Polymeric nanosystems. Academic Press, Oxford, England, 2023, p. 173-205.
[2] D Elieh-Ali-Komi and MR Hamblin. Chitin and chitosan: Production and application of versatile biomedical nanomaterials. International Journal of Advanced Research 2016; 4, 411-427.
[3] M Kumi, T Wang, O Ejeromedoghene, J Wang, P Li and W Huang. Exploring the potentials of chitin and chitosan-based bioinks for 3D-printing of flexible electronics: The future of sustainable bioelectronics. Small Methods 2024; 8, 2301341.
[4] R Ridwanto, VD Rosa, Z Rani and ZPA Fauzi. Utilization of chitosan from fresh water lobster (Cherax quadricarinatus) shells in anti-acne gel preparations. Trends in Sciences 2024; 21(2), 7243.
[5] RAF Jasim. Medical, pharmaceutical, and biomedical applications of chitosan: A review. Medical Journal of Babylon 2021; 18(4), 291-294.
[6] Chitin derivatives market overview, Available at: https://www.industryresearch.biz/market-reports/chitin-derivatives-market-100764, accessed November 2025.
[7] KY Zhu, H Merzendorfer, W Zhang, J Zhang and S Muthukrishnan. Biosynthesis, turnover, and functions of chitin in insects. Annual Review of Entomology 2016; 61, 177-196.
[8] B Moussian. Chitin: Structure, chemistry and biology. Advances in Experimental Medicine and Biology 2019; 1142, 5-18.
[9] I Younes and M Rinaudo. Chitin and chitosan preparation from marine sources. Structure, properties and applications. Marine Drugs 2015; 13, 1133-1174.
[10] T Hahn, A Roth, R Ji, E Schmitt and S Zibek. Current state of chitin purification and chitosan production from insects. Journal of Chemical Technology & Biotechnology 2020; 95(11), 2775-2795.
[11] RA Muzzarelli. Chitin nanostructure in living organisms. In: N Gupta (Ed.). Chitin: Formation and diagenesis. Springer, Dordrecht, Netherlands, 2011, p. 1-34.
[12] NAZ Abidin, F Kormin, NAZ Abidin, NAFM Anuar and MFA Bakar. The potential of insects as alternative sources of chitin: An overview on the chemical method of extraction from various sources. International Journal of Molecular Sciences 2020; 21, 4978.
[13] RL Lavall, OBG Assis and SP Campana-Filho. β-chitin from the pens of Loligo sp.: Extraction and characterization. Bioresource Technology 2007; 98(13), 2465-2472.
[14] Lalarukh, SM Hussain, S Ali, AF Zahoor, H Azmat, N Nazish, MA Alshehri, D Riaz, E Naeem and Mahrukh. (2024). Innovation of advanced polymers from seafood waste: Applications of chitin and chitosan. Polymers for Advanced Technologies 2024; 35(6), e6471.
[15] M Triunfo, E Tafi, A Guarnieri, V Longo, R Russo, R Carotenuto, D Montesano, R Di Sanzo, S Moliterni, D Coppola, M Gallo, TS Tiuman, M Francavilla and P Di Pierro. Characterization of chitin and chitosan derived from Hermetia illucens, a further step in a circular economy process. Scientific Reports 2022; 12, 6613.
[16] M Chalghaf, K Charradi, R Ksouri, QA Alsulami, A Jaouani, SMAS Keshk and EA Hayouni. Physicochemical characterization of chitin extracted by different treatment sequences from an edible insect. International Journal of Biological Macromolecules 2023; 253(6), 127156.
[17] AI Zamri, NF Latiff, QH Abdullah and F Ahmad. Extraction and optimization of chitosan from razor clam (Ensis arcuatus) shells by using response surface methodology (RSM). Food Research 2020; 4, 674-678.
[18] R Varma and S Vasudevan. Extraction, characterization, and antimicrobial activity of chitosan from horse mussel Modiolus modiolus. ACS Omega 2020; 5(32), 20224-20230.
[19] BA Alimi, S Pathania, J Wilson, B Duffy and JMC Frias. Extraction, quantification, characterization, and application in food packaging of chitin and chitosan from mushrooms: A review. International Journal of Biological Macromolecules 2023; 237, 124195.
[20] C Yang, X Chen, Z Chen, Y Zhao, R Yang, Y Xia, Q Zeng, Y He and H Lan. Source-dependent variations in chitin: a comparative study on Antarctic krill, white shrimp and crayfish. Frontiers in Marine Science 2025; 12, 1592331.
[21] P Stempflé, X Bourrat, O Pantalé, RK Njiwa, J Jehl, A Domatti and E Lopez. Multiscale structure of nacre biomaterial: Thermomechanical behavior and wear processes. Materials Science & Engineering C 2018; 91, 78-93.
[22] W Lin, P Liu, S Li, J Tian, W Cai, X Zhang, J Peng, C Miao, H Zhang, P Gu, Z Wang, Z Zhang and T Luo. Multi-scale design of the chela of the hermit crab Coenobita brevimanus. Acta Biomaterialia 2021; 127, 229-241.
[23] Z Mei, P Kuzhir and G Godeau. Update on chitin and chitosan from insects: Sources, production, characterization, and biomedical applications. Biomimetics 2024, 9, 297.
[24] M Wang, X Lu, X Yin, Y Tong, W Peng, L Wu, H Li, Y Yang, J Gu, T Xiao, M Chen and J Zhang. Synchrotron radiation-based Fourier-transform infrared spectromicroscopy for characterization of the protein/peptide distribution in single microspheres. Acta Pharmaceutica Sinica B 2015; 5(3), 270-276.
[25] Y Guo, T Chen, S Wang, X Zhou, H Zhang, D Li, N Mu, M Tang, M Hu, D Tang, Z Yang, J Zhong, Y Tang, H Feng, X Zhang and H Wang. Synchrotron radiation-based FTIR microspectroscopic imaging of traumatically injured mouse brain tissue slices. ACS Omega 2020; 5, 29698-29705.
[26] MA Islam, MN Hasan, MSH Evan, MJ Uddin, WS Tulin, MS Islam, MU Khandaker, IMM Rahman and FI Chowdhury. Chitin nanofibers: Recent advances in preparation and applications in biomedical and beyond. Royal Society of Chemistry 2025, 15, 14655-14690
[27] M Salavati. Mechanical properties of α-chitin and chitosan biocomposite: A molecular dynamic study. Journal of Composites Science 2023; 7, 464.
[28] P Baharlouei and A Rahman, Chitin and chitosan: Prospective biomedical applications in drug delivery, cancer treatment, and wound healing. Marine Drugs 2022, 20, 460.
[29] Y Kim, Z Zharkinbekov, K Raziyeva, L Tabyldiyeva, K Berikova, D Zhumagul, K Temirkhanova and A Saparov. Chitosan-based biomaterials for tissue regeneration. Pharmaceutics 2023, 15, 807.
[30] ZM Zia. Experiment on the chemical extraction of chitin and chitosan from the exoskeletons of indigenous prawn species and their biomedical application. International Journal of Zoology and Applied Biosciences 2019; 4(3), 106-112.
[31] AOAC International. Protein (crude) in seafood, Kjeldahl method (method 984.13). In: Official methods of analysis of AOAC International. 20th ed. AOAC International, Rockville, United States, 2016.
[32] A Baxter, M Dillon, KDA Taylor and GAF Roberts. Improved method for i.r. determination of the degree of N-acetylation of chitosan. International Journal of Biological Macromolecules 1992; 14(3), 166-169.
[33] S Muthukrishnan, S Mun, MY Noh, ER Geisbrecht and Y Arakane. Insect cuticular chitin contributes to form and function. Current Pharmaceutical Design 2020; 26(29), 3530-3545.
[34] VBS Chan, MB Johnstone, AP Wheeler and AS Mount. Chitin facilitated mineralization in the eastern oyster. Frontiers in Marine Science 2018; 5, 347.
[35] L Addadi, D Joester, F Nudelman and S Weiner. Mollusk shell formation: A source of new concepts for understanding biomineralization processes. Chemistry - A European Journal 2006; 12(4), 980-987.
[36] H Izadi, H Asadi and M Bemani. Chitin: A comparison between its main sources. Frontiers in Materials 2025; 12, 1537067.
[37] LD Tolesa, BS Gupta and MJ Lee. Chitin and chitosan production from shrimp shells using ammonium-based ionic liquids. International Journal of Biological Macromolecules 2019; 130, 818-826.
[38] N Sayari, A Sila, BE Abdelmalek, RB Abdallah, S Ellouz-Chaabouni, A Bougatef and R Balti. Chitin and chitosan from the Norway lobster by-products: Antimicrobial and anti-proliferative activities. International Journal of Biological Macromolecules 2016; 87, 163-171.
[39] M Agarwal, MK Agarwal, N Shrivastav, S Pandey and PA Gaur. A simple and effective method for preparation of chitosan from chitin. International Journal of Life Sciences Research 2018; 4, 1721-1728.
[40] M Jones, M Kujundzic, S John and A Bismarck. Crab vs. Mushroom: A review of crustacean and fungal chitin in wound treatment. Marine Drugs 2020; 18, 64.
[41] MAS Siddiqui, MS Rabbi, RU Ahmed, F Alam, MAM Hossain, S Ahsan and NM Miah. Bioinspired composite structures: A comprehensive review of natural materials, fabrication methods, and engineering applications. Composites Part C: Open Access 2025; 17, 100578.
[42] SO Andersen. Insect cuticular sclerotization: A review. Insect Biochemistry and Molecular Biology 2010; 40(3), 166-178.
[43] MM Abo Elsoud and EM El Kady. Current trends in fungal biosynthesis of chitin and chitosan. Bulletin of the National Research Centre 2019; 43, 59.
[44] X Hu, Z Tian, X Li, S Wang, H Pei, H Sun and Z Zhang. Green, simple, and effective process for the comprehensive utilization of shrimp shell waste. ACS Omega 2020; 5, 19227-19235.
[45] J Kumirska, M Czerwicka, Z Kaczyński, A Bychowska, K Brzozowski, J Thöming and P Stepnowski. Application of spectroscopic methods for structural analysis of chitin and chitosan. Marine Drugs 2010; 8, 1567-1636.
[46] S Hasan, VM Boddu, DS Viswanath and TK Ghosh. Chitin and Chitosan. Springer, Cham, Switzerland, 2022, p. 79-102.
[47] Y Ogawa, CM Lee, Y Nishiyama and SH Kim. Absence of sum frequency generation in support of orthorhombic symmetry of α‑chitin. Macromolecules 2016; 49, 7025-7031.
[48] J Nie, X Wu, J Wei, Y Li, H Xie, W Wang, H Wang, H Ping, B Li and Z Fu. Regulating growth of strontium carbonate in self-assembled chiral chitin matrices with robust mechanical properties. ACS Applied Materials & Interfaces 2025; 17, 25849-25860.
[49] R Seoudi and AMA Nada. Molecular structure and dielectric properties studies of chitin and its treated by acid, base and hypochlorite. Carbohydrate Polymers 2007; 68, 728-733.
[50] L Ogresta, F Nekvapil, T Tamas, L Barbu-Tudoran, M Suciu, R Hirian, M Aluas, G Lazar, E Levei, B Glamuzina and SC Pinzaru. Rapid and application-tailored assessment tool for biogenic powders from crustacean shell waste: Fourier transform-infrared spectroscopy complemented with x‑ray diffraction, scanning electron microscopy, and nuclear magnetic resonance spectroscopy. Omega 2021; 6, 27773-27780.
[51] KM Kocot, F Aguilera, C McDougall, DJ Jackson and BM Degnan. Sea shell diversity and rapidly evolving secretomes: insights into the evolution of biomineralization. Frontiers in Zoology 2016; 13, 23.
[52] X Zhang, J Yuan, F Li and J Xiang. Chitin Synthesis and degradation in crustaceans: A genomic view and application. Marine Drugs 2021; 19, 153.
[53] MH Younus, GG Ali and HA Salih. The reinforced optical fiber sensing with bilayer AuNPs/SiC for pressure measurement: Characterization and optimization. Journal of Physics: Conference Series 2021; 1795, 012002.
[54] GG Ali, AZ Khalil and OA Alhamd. Growth and characterization of cadmium and nickel nanocomposites on porous silicon for some antibacterial properties. Trends in Sciences 2025; 22(8), 10054.
[55] OA Alhamd, GG Ali and MSH Aljuboori. Study and characterization of copper and titanium oxides nanostructures for some molecular and biological applications. Trends in Sciences 2024; 21(4), 7402.