Trends
Sci. 2026;
23(8): 12722
Surface Modification of Banana Pseudo-Stem Cellulose Using Fenton Oxidation: Adsorption Kinetics, Isotherms, and Optimization
Quynh
Anh Nguyen Thi1,2,3,
![]() ,
Nhat Huy Nguyen1,3,
,
Nhat Huy Nguyen1,3,
![]() ,
Phuoc Toan Phan2,3,
,
Phuoc Toan Phan2,3,
![]() ,
,
Thuy
Nguyen Thi2,4,
![]() ,
Tri Thich Le2,3,
,
Tri Thich Le2,3,
![]() and Trung Thanh
Nguyen2,3,*,
and Trung Thanh
Nguyen2,3,*,
![]()
1Faculty of Environment and Natural Resources, Ho Chi Minh City University of Technology, Ho Chi Minh City, Vietnam
2Nanomaterial Laboratory, An Giang University, An Giang, Vietnam
3Vietnam National University Ho Chi Minh City, Ho Chi Minh City, Vietnam
4School of Chemical and Environmental Engineering, International University, Ho Chi Minh City, Vietnam
(*Corresponding author’s e-mail: [email protected])
Received: 22 November 2025, Revised:16 December 2025, Accepted: 18 January 2026, Published: 20 March 2026
Abstract
Surface-modified cellulose derived from banana pseudo-stem (BMC), as an abundant, cost-effective, and environmentally-friendly adsorbent, was used to remove methylene blue dye (MB) from water. At first, the banana pseudo-stem underwent several physicochemical treatments to isolate cellulose and followed by Fenton oxidation to introduce desired functional groups onto its surface. The adsorbent was characterized by SEM, TEM, EDS, FTIR, and XRD for understanding its characteristics. Next, the effect of adsorption time, pH, initial concentration, and temperature for MB adsorption was investigated in batch experiments. The MB adsorption kinetic and equilibrium data were consistently explained by pseudo-second-order and Langmuir models, respectively, with a calculated maximum adsorption capacity of 56.6 mg/g. Thermodynamic studies indicated that the adsorption is an exothermic and spontaneous process. In an optimization study, response surface methodology based on the Box-Behnken method was applied and revealed that under the optimal condition (contact time of 151 min, pH of 6.9, and initial concentration of 22.6 mg/L), the maximum removal efficiency was 99.7%. This study suggests a promising strategy to prepare an economical and biodegradable adsorbent from agricultural residue for efficient purification of wastewater.
Keywords: Fenton, Modified cellulose, Adsorption, MB dye, Kinetic, BBD-RSM
Introduction
Clean water is essential for the growth of humans and economic development. However, the shortage of clean water caused by environmental contamination has become a significant challenge to human life and production. For this reason, reducing water pollution by removing pollutants and minimizing emissions is crucial. Among the common pollutants, MB dyes are of particular concern due to not only their widespread applications but also their persistence and stability in the environment. The MB dye is used in paper, plastic, wood, and cosmetic production. Its structure is complex and highly resistant to biodegradation. Additionally, it causes cardiovascular, respiratory, and skin issues, neurotoxicity, and serotonin syndrome [1,2].
Various technical approaches have been successfully applied to remove MB dyes from aqueous solutions, such as photocatalysis, nanofiltration, coagulation-flocculation, membrane filtration, adsorption, ion exchange, advanced oxidation processes (AOPs), and electrochemical technologies. Among these, adsorption becomes a suitable option, offering both cost-effectiveness and ease of operation. There are various types of adsorbents being used for the removal of MB, including carbon-based adsorbents, MOFs, metal oxides, bioadsorbents, and polymer-based materials [3-7]. Additionally, there has been a great deal
of research on the performance of adsorbents produced from agricultural residues for the elimination of MB from aqueous solution [8-11]. Especially, numerous studies have demonstrated that cellulose and modified cellulose adsorbents exhibit high capability in contaminant removal from wastewater [12-14]. Recent research on cellulose modification has highlighted the significance of environmentally friendly synthesis approaches [15,16]. Among the established strategies used to tailor material properties, homogeneous Fenton oxidation is considered a simple, environmentally friendly, single-step, and highly effective chemical modification technique for breaking down residues (lignin and hemicellulose), cleaving glycosidic linkage, and incorporating functionalities into the cellulose surface under green, eco-benign conditions [16,17]. Additionally, Fenton oxidation is recognized as an advanced oxidative technique value for its excellent cost efficiency [18].
Furthermore, for large-scale application of wastewater treatment, understanding the relationship between the operational parameters, such as contact time, pH level, initial concentration, and treated effectiveness, is important. Therefore, optimizing the operating conditions for pollutant adsorption using the adsorbents should be conducted. Among the techniques, Box-Behnken design in response surface methodology is an effective tool for optimizing studies that have been utilized in literature [19,20].
In this study, banana pseudo-stem (BPS) was used as a starting material for the preparation of surface-modified cellulose (BMC) for eliminating MB dye. The raw material underwent several chemical treatment steps to remove residue and then oxidation by homogeneous Fenton to form surface functional groups, making it effective for cationic dyes removal. The BMC was subsequently characterized using SEM, TEM, EDS, FTIR, and XRD analyses. The impacts of experimental conditions were explored, and the adsorption mechanism was investigated via kinetic, equilibrium, and thermodynamic studies. Box-Behnken design in response surface method was also utilized to optimize the adsorption performance.
Materials and methods
Material synthesis and characterization
The BPS was collected from a local banana farm in Long Xuyen Ward (An Giang Province, Vietnam). Analytical grade chemicals, including NaOH (> 97%, pellets), H2SO4 (95% - 98%), H2O2 (35%), FeSO4·7H2O (> 99%), and methylene blue (MB, > 82%) were purchased in Ho Chi Minh City (Vietnam).
To isolate cellulose, BPS was subjected to physicochemical treatments to remove lignin and hemicellulose. At first, the material was cut into 2- to 3-cm pieces, washed, and dried in an oven. Next, the dried pieces were refluxed using H2SO4 solution and followed by a NaOH solution at approximately 200 ℃ for 1 h to remove hemicellulose and lignin, then washed with deionized water and dried at 70 °C until their weight became stable. After that, the obtained solid was oxidized by a Fenton system (Fe2+/H2O2) for 2 h to introduce carboxyl and aldehyde functional groups onto its surface. Finally, the material was washed and dried, which is labeled as BMC.
FTIR spectroscopy was used to study the surface chemical structure using a spectrophotometer (ALPHA, Bruker, Germany). A XRD diffractometer with CuKα at 40 kV and 15 mA under a 2θ diffraction angle from 10° to 70° was used to analyze the crystallinity of the material (Aeris Benchtop, Malvern Panalytical, Netherlands). SEM and TEM images, as well as EDS spectra, were used to investigate the surface morphology and the chemical composition (JCM-7000 and JEM-2100, JEOL, Japan). BET surface area was determined using a BET-201A sorptometer (Porous Material, USA), while the point of zero charge (pHpzc) of the materials was measured following the pH drift method.
Adsorption study
The effect of exposure time (0 - 60 min), pH (2 - 9), initial concentration (20 - 150 mg/L), and temperature (25 - 40 °C) on the MB removal using the prepared BMC material was investigated in batch experiments. In this process, the pH of the solution was adjusted using 0.1 N NaOH or HCl solution. In a typical test, 0.05 g sorbent was added to 50 mL of
MB solution, and the mixture was shaken at 200 rpm. After the designated contact time, the BMC was separated from the solution using a centrifuge (EBA 200, Hettich, Germany). The remaining MB concentration in the
solution was analyzed by a UV-Vis spectrophotometer (V730, Jasco, Japan) at λ = 664 nm. The adsorption capacity (qe) and the removal efficiency (R%) were calculated following Eqs. (1) and (2) below:
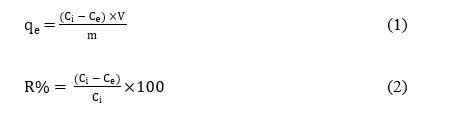
where Ci (mg/L), Ce (mg/L), V (L), and m (g) represent initial and equilibrium MB concentration, volume of MB solution, and weight of BMC, respectively.
In this study, 3 adsorption kinetics models, including pseudo-first-order, pseudo-second order, and intraparticle diffusion, were employed to obtain a deeper insight into the adsorption mechanism on the adsorbent. To further analyze the adsorption mechanism at equilibrium, the experimental data were fitted to the Langmuir, Freundlich, D-R, and Temkin isotherm models [21].
Experiment design
Box-Bohnken design in response surface method was used to investigate how contact time, pH, and initial concentration impact the removal of MB using the studied BMC adsorbent. A trial version of Design-Expert 12.0 software was applied for experiment planning and analysis. The range of 3 variables is summarized in Table 1. A quadratic polynomial model was used to assess MB removal, with the variables described by Eq. (3).
![]()
where Y is the removal efficiency, Xi and Xj are the code values of the factors, β0 is the constant coefficient, and βi, βii, and βij are the coefficients calculated by the software.
Table 2 presents the experiment design based Box-Behnken design matrix. In each test, 0.05 g of BMC was added to 50 mL of MB solution at room temperature and shaken at 200 rpm. The removal efficiency of MB was measured under different combinations of these variables.
Table 1 Codes and input variables, and their levels in the Box-Behnken design.
Run |
A: Contact time (min) |
B: pH |
C: Initial concentration (mg/L) |
R (%) |
1 |
20 |
7 |
200 |
32.5904 |
2 |
100 |
7 |
110 |
70.5169 |
3 |
180 |
4 |
110 |
54.0605 |
4 |
100 |
7 |
110 |
73.6786 |
5 |
100 |
7 |
110 |
69.9689 |
6 |
20 |
10 |
110 |
7.8954 |
7 |
100 |
10 |
200 |
33.9485 |
8 |
180 |
7 |
20 |
98.4296 |
9 |
100 |
7 |
110 |
71.9808 |
10 |
180 |
7 |
200 |
80.1923 |
11 |
180 |
10 |
110 |
66.6763 |
12 |
20 |
7 |
20 |
72.0615 |
13 |
100 |
4 |
200 |
58.0652 |
14 |
100 |
10 |
20 |
73.7374 |
15 |
100 |
7 |
110 |
69.6103 |
16 |
100 |
4 |
20 |
80.8781 |
17 |
20 |
4 |
110 |
34.8542 |
Table 2 Experimental matrix based on the Box-Behnken design method for designing experiments and the corresponding response.
Variables |
Codes |
Level 1 (-1) |
Level 2 (0) |
Level 3 (+1) |
Contact time (min) |
A |
20 |
100 |
180 |
pH |
B |
4 |
7 |
10 |
Initial concentration (mg/L) |
C |
20 |
110 |
200 |
Results and discussion
Characterization of BMC
As can be seen in Figure 1, the color of the MB solution and the BMC was changed due to the adsorption of MB on the surface of BMC. The morphology of the prepared BMC was observed by SEM, as presented in Figure 2. The SEM image at magnification 170× in Figure 2(a) indicates that the adsorbent consists of limited-length and rod-like particles with rugged surface morphology. From the magnification of 350× and 600× in Figures 2(b) and 2(c), it can be seen that the particles’ surface contains numerous uneven parts along their structures. This rough surface could facilitate MB molecules to be deposited during the adsorption process. Additionally, the EDS spectrum in Figure 2(d) presents the peaks of carbon and oxygen with their atomic mass, respectively. Besides, the adsorbent primarily contains 47.16% C and 52.84% O and is free from any other impurities. This result illustrates that a purified material was produced from the preparation process. Furthermore, particle shape and size were analyzed by TEM images shown in Figure 3. It can be observed that the prepared material consists of particles with a wide size distribution, potentially extending into the nanometer scale.
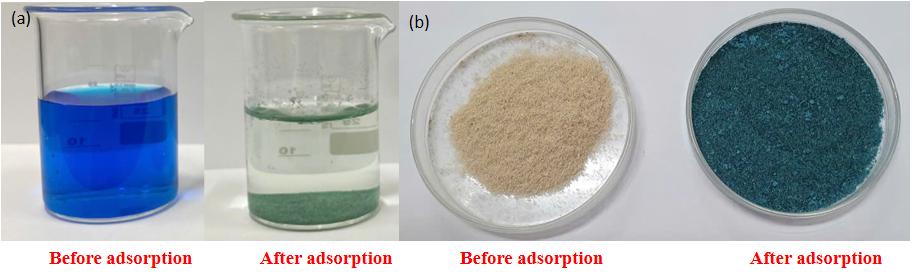
Figure 1 Images of (a) MB solution before and after adsorption, and (b) BMC before and after adsorption.
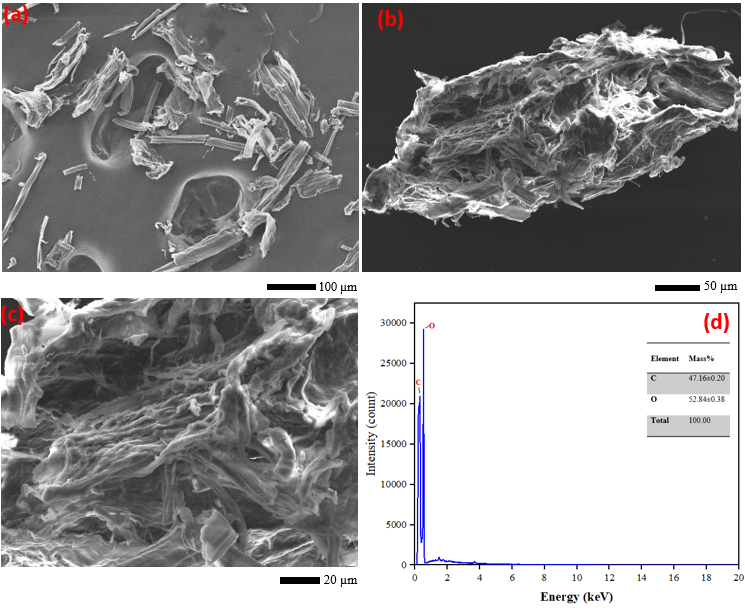
Figure 2 SEM images at magnification (a) 170×, (b) 350×, (c) 600×, and (d) EDS spectra of BMC.
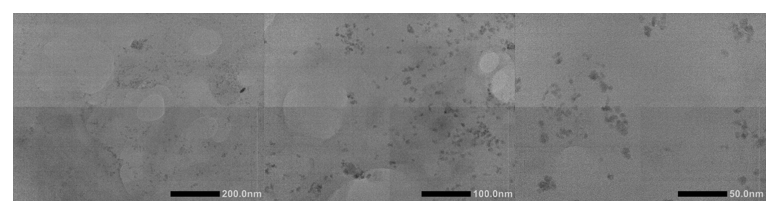
Figure 3 TEM images at different magnifications of the BMC material.
FTIR spectra of the BPS and BMC materials before and after the MB adsorption are shown in Figure 4(a). On the one hand, the spectrum of BPS displayed the adsorption bands at 2,852 and 1,737 cm−1, which relate to the presence of –CH2 and –OH groups, respectively, within the hemicellulose structure. Besides, the band located at 1,512 cm−1 is associated with C=C stretching vibration in the lignin structure [22]. On the other hand, the pristine BMC spectrum showed the characteristic peaks of cellulose I at 3,460, 2,910, 1,642, 1,065, and 898 cm−1. These peaks were attributed to O–H stretching vibrations, C–H stretching vibrations, O–H bending vibrations and absorbed water, C–O–C stretching vibrations, and C=H rocking vibrations, respectively [23-25]. Moreover, the absence of peaks at 1,737 and 1,512 cm−1 suggests that the prepared processes have reduced hemicellulose and lignin content effectively. The spectrum of BMC after MB adsorption was similar to that of pristine BMC. Additionally, the MB adsorption on the BMC surface was confirmed by an increase in intensities at 1,642 cm−1 and 1,167 - 1,115 cm−1 related to the overlapping with C=N and N–C functional groups in the MB structure [26]. This suggests that the MB adsorption on BMC primarily occurs via a hydrogen bonding mechanism, which is formed through the N+ of MB and the –OH group of the BMC [27].
XRD patterns Figure 4(b) indicate the crystalline 2 of the studied materials. For BPS, there were 2 diffraction peaks at 2θ = 15.61° and 22.37° relating to the (101) and (200) planes of cellulose I, respectively. Meanwhile, the pattern of the BMC exhibits an additional peak at 2θ = 34.34° associated with the (040) plane of cellulose I [24]. Besides, the absence of a doublet peak at 22.37° confirms the exclusive presence of cellulose I in BMC samples and their derivatives [28]. Moreover, the increase in intensity of the mentioned peaks indicates an enhancement in the crystallinity of the BMC, which results from the rearrangement of individual cellulose crystalline structures [29]. Additionally, the crystallinity index (CrI%) of the BMC (74.4%) is higher than that of the BPS (64.1%), which may be attributed to the removal of the amorphous structure from the starting material [30]. High crystallinity index increases the durability of the BMC, promoting it to be reused multiple times in adsorption treatment processes [28,31].
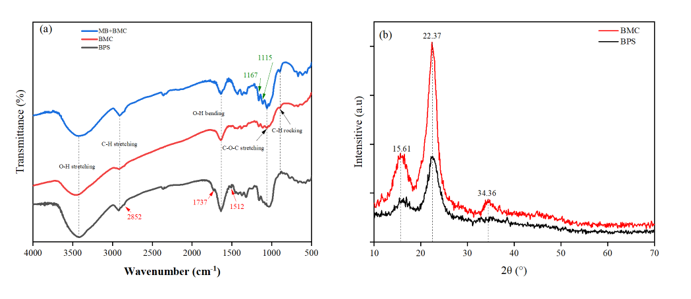
Figure 4 Structural characterization of the materials: (a) FTIR spectra and (b) XRD patterns.
Figure 5 presents the pHpzc of the pre-modified cellulose and the BMC materials. In the modification using the Fenton reaction, the hydroxyl radicals and other reactive oxygen species attack the cellulose structure, leading to the formation of surface carboxyl groups [32]. According to the results, the pHpzc value of the studied BMC becomes more negative because the incorporation of –COOH groups increases its surface acidity, leading to a shift of the point of 0 charge toward lower pH values. In addition, the BET surface area, total pore volume, and average pore size for the pre-modified cellulose and the BMC were summarized in Table 3. It can be seen that after the modification of cellulose, there was an enhancement in the BET surface, which facilitates its application as an adsorbent. The studied cellulose materials can be classified as mesopores based on the average pore sizes.
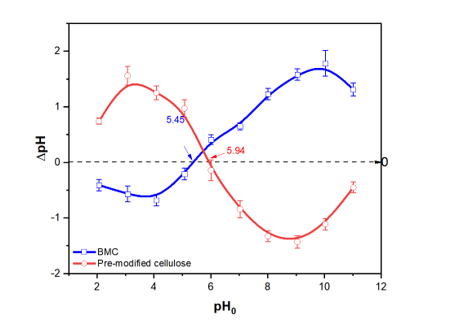
Figure 5 Determination of the pHpzc of pre-modified cellulose, and BMC.
Table 3 BET data for the studied cellulose materials.
Material |
SBET (m2/g) |
Vpore (cm3/g) |
Dpore (Å) |
Pre-modified cellulose |
2.25 |
0.0028 |
45.4 |
BMC |
4.04 |
0.0046 |
22.6 |
MB adsorption results
The contact time between MB and the BMC adsorbent is a crucial factor for its adsorption. It was thus conducted at various durations of shaking using 0.05 g BMC in 50 mL of 20 mg/L MB solution at its original pH (pH = 6.40) under ambient temperature. Figure 6(a) presents the impact of shaking time on the adsorption efficiency and capacity of MB using BMC. It can be seen that the adsorption takes place rapidly in the first 10 min, during which approximately 76% of MB is removed, followed by a slower elimination that steadily approaches equilibrium conditions and maximum adsorption capacity obtained after 15 min (19.2 mg/g). It can be explained by the presence of more unoccupied active sites and steeper concentration gradients at the beginning [33,34]. Figure 6(b) indicates that the adsorption capacity of BMC for MB increases, followed by a decrease as pH rises from 2 to 9. The maximum capacity is 19.4 mg/g at pH = 6.01. At a pH below pHpzc (5.45), the active sites on the BMC surface become protonated and carry a positive charge, whereas they become deprotonated and carry a negative charge at pH above pHpzc. Therefore, a large amount of H+ ions in the solution competed with the cations of MB for adsorption at low pH, leading to a decrease in removal efficiency [34]. This competition decreases after increasing pH, resulting in enhanced adsorption. The observed behavior confirms the significant role of the electrostatic interaction mechanism in the adsorption process, consistent with the previous findings [27,35]. Figure 6(c) represents the impact of MB concentration on the elimination performance at 0.05 g of dosage in 50 mL of solution at pH 6.01 for 15 min at ambient temperature with an initial concentration ranging from 20 to 150 mg/L. The higher adsorption efficiency obtained at lower concentration is due to an increased number of active sites compared to the molecules of pollutants. However, the concentration exceeds 100 mg/L, the capacity shows no significant increase, indicating that the saturation has been reached at the experimental conditions. In Figure 6(d), the graph plotted between the MB adsorption capacity (mg/g) and removal efficiency (%) at different temperatures (50 mL of 20 mg/L MB solution, 0.05 g BMC, pH 6.01, 15 min). The results illustrated that the adsorption capacity and removal efficiency decrease with increasing temperature from 25 to 40 °C, proving that the removal of MB using BMC is an exothermic process [26,36].
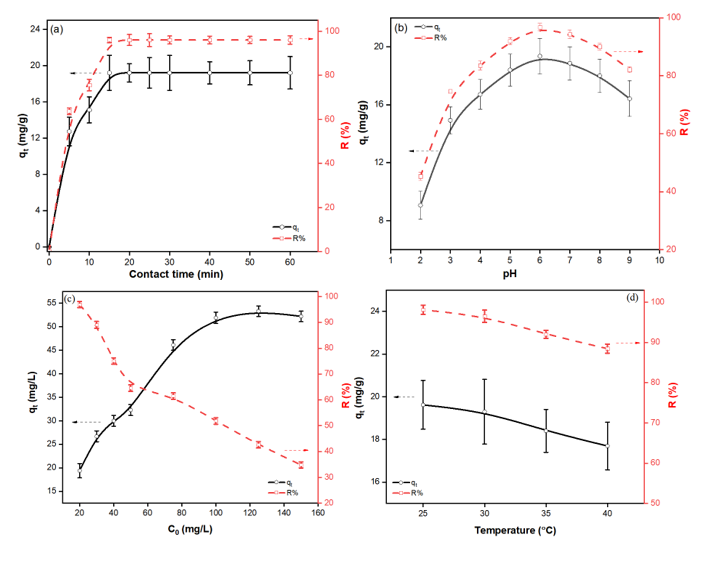
Figure 6 Effect of (a) contact time, (b) pH, (c) initial concentration, and (d) temperature on the removal of MB by BMC, error bars represent standard deviation (n = 3).
Figure 7 and Table 4 present linear plots and parameters for 3 kinetic models. The pseudo-second-order model provides a better fit for describing the adsorption mechanism, as evidenced by the higher correlation coefficient (R2) and lower Reduced Chi-square statistic (Reduced χ2) than those of the other 2 types of models. Besides, the qe value calculated from the kinetic model is close to the experimental result. It pointed out that the adsorption of MB on BMC is a chemisorption process consistent with the literature [22,23].
Table 4 Kinetic parameter of MB adsorption using BMC.
Pseudo-first-order |
Pseudo-second-order |
Intraparticle diffusion |
k1 = 0.324 min−1 |
k2 = 0.002 g/mg.min |
kip = 2.562 |
qe = 8.106 mg/g |
qe = 22.45 mg/g |
|
R2 = 0.897 |
R2 = 0.996 |
R2 = 0.837 |
Reduced χ2 = 0.977 |
Reduced χ2 = 0.005 |
Reduced χ2 = 10.379 |
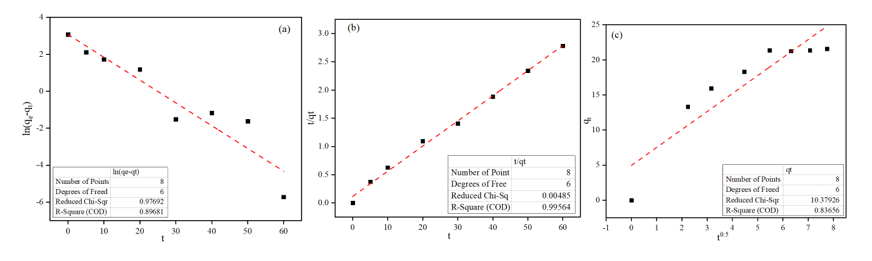
Figure 7 Linear plots of (a) pseudo-first-order, (b) pseudo-second-order, and (c) intraparticle diffusion kinetic models for the adsorption of MB onto BMC.
Figure 8 presents a linear form of Langmuir, Freundlich, D-R, and Temkin isotherm models. The value of calculated parameters, the correlation coefficients (R2), and the error values (Reduced χ2) are summarized in Table 5. The Langmuir model exhibited the higher R2 and lower Reduced χ2 values than those of the Freundlich model, which indicated that the adsorption of MB on the BMC surface follows the Langmuir isotherms. It suggests that MB accumulates a single layer on the internal surface of the studied adsorbent, which is similar to previous findings [26,37,38]. Additionally, the Freundlich model provides an n value between 1 and 10, indicating the adsorption of MB on BMC is favorable under the investigated conditions [39]. Furthermore, an E value of between 8 and 16 kJ/mol from the D-R model and a positive value of BT from the Temkin model suggested that the adsorption is associated with chemisorption [39,40]. Comparison of maximum MB adsorption capacities among various adsorbents is presented in Table 6. It can be seen that the BMC material exhibits an enhanced capacity for MB retention compared with varied modified cellulose or residue.
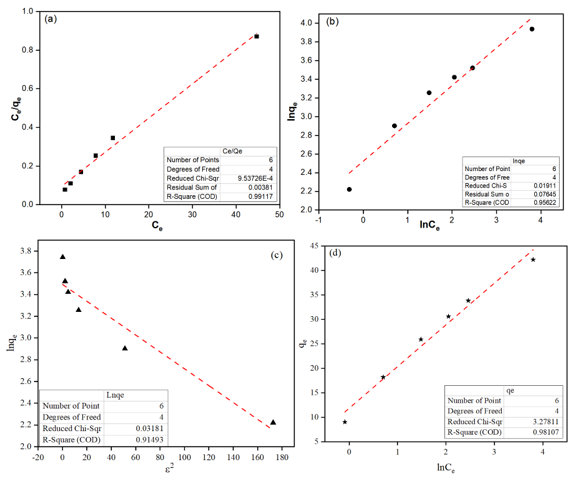 Figure
8 Linear
plots of (a) Langmuir, (b) Freundlich, (c) D-R, and (d)
Temkin isotherm models for the adsorption of MB onto BMC.
Figure
8 Linear
plots of (a) Langmuir, (b) Freundlich, (c) D-R, and (d)
Temkin isotherm models for the adsorption of MB onto BMC.
Table 5 Isotherm parameters of MB adsorptive removal onto BMC at 30 ℃.
Isotherm |
Parameters |
Value |
Langmuir |
qm (mg/g) |
56.6 |
KL (L/mg) |
0.1857 |
|
R2 |
0.991 |
|
Reduced χ2 |
9.534×10⁻⁴ |
|
Freundlich |
n |
2.47 |
KF (mg/g) |
0.0802 |
|
R2 |
0.956 |
|
Reduced χ2 |
0.019 |
|
D-R |
qm (mol/g) |
32.88 |
KD-R (kJ2/mol2) |
7.76×10⁻³ |
|
E (kJ/mol) |
8.647 |
|
R2 |
0.915 |
|
Reduced χ2 |
0.032 |
|
Temkin |
AT (L/g) |
4.076 |
BT (J/mol) |
8.493 |
|
R2 |
0.981 |
|
Reduced χ2 |
3.278 |
Table 6 Comparison of the maximum adsorption capacity of different adsorbents
Adsorbent |
pH |
Contact time (min) |
qmax (mg/g) |
Reference |
Cellulose-based hydrogel derived from tea residue |
10 |
300 |
41.67 |
[41] |
Biochar from tea waste (BC) |
5.7 |
70 |
13.054 |
[21] |
Magnetic biochar from tea waste (MTWBC) |
24.39 |
|||
Carboxymethyl cellulose-grafted-poly(acrylamide) hydrogels composited with biochar from walnut shell |
10 |
50 |
41.152 |
[42] |
Carboxymethyl cellulose-grafted-poly(acrylamide) hydrogels composited with magnetic biochar from walnut shell |
52.91 |
|||
The powder of modified and magnetized corn cobs |
12.04 |
105 |
13.23 |
[43] |
Commercial microcrystalline cellulose |
6 |
3 |
4.95 |
[26] |
Sodium periodate cellulose nanoparticle |
8 |
60 |
62.91 |
[44] |
BMC |
6.01 |
20 |
56.6 |
This study |
Thermodynamic study parameters for MB adsorption on the BMC were summarized in Table 7. The negative values of ΔG and ΔH indicate that the adsorption process is feasible and an exothermic process, respectively. Similar results were reported from the literature [34,36]. Moreover, the positive value of ΔS suggests that there exists disorder in the adsorbent-solution contact region.
Table 7 Thermodynamic parameters for MB adsorption onto BMC adsorbent.
T (K) |
ΔG (kJ/mol) |
ΔH (kJ/mol) |
ΔS (KJ/mol.K) |
298 |
−4.45 |
−0.576 |
1.3×10⁻² |
303 |
−4.51 |
||
313 |
−4.64 |
||
318 |
−4.71 |
Comparison study
An adsorption performance comparison was conducted between different adsorbents, including the BPS, the pre-modified cellulose, and the BMC, under experimental conditions: 0.05 g of BMC in 50 mL of 20 mg/L MB solution for 15 min at pH 6.01 under room temperature. Note that the BPS was only subjected to size reduction by cutting, with no other modification applied. According to the result (Figure 9), the adsorption performance for MB decreases in the order of BMC > Pre-modified cellulose > BPS. It can be concluded that the modification treatments significantly improved the contaminant removal efficiency of the investigated materials.
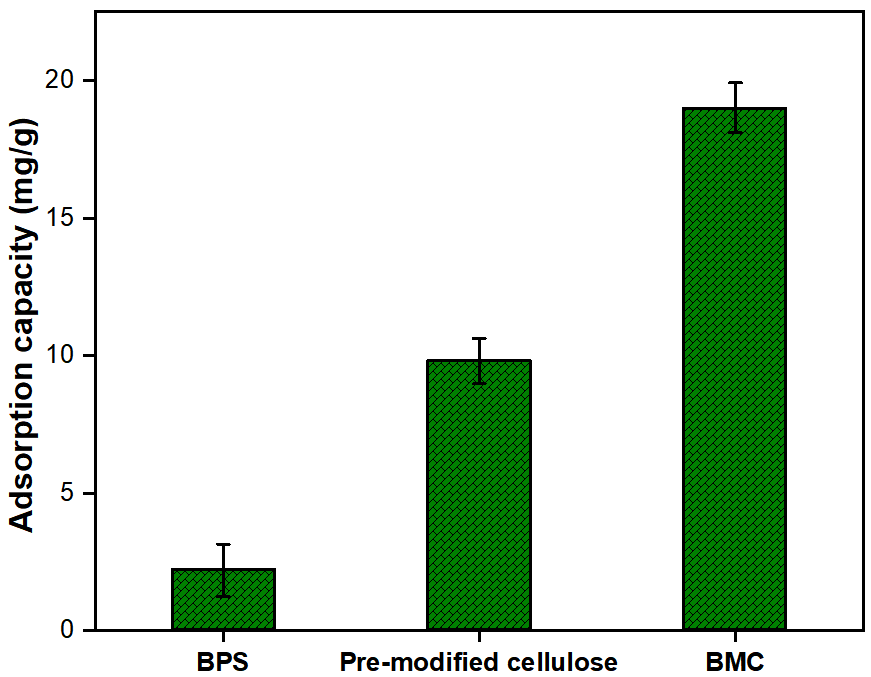
Figure 9 Adsorption efficiency of MB on BPS, Pre-modified cellulose, and BMC, error bars represent standard deviation (n = 3).
Response surface methodology - Box-Behnken design
Analysis of variance (ANOVA) was applied to examine the model’s validity, in which it is possible to identify the interaction between the experimental parameters and the response. This examination was conducted based on the F-test and p-value for assessing the model’s statistical significance [19,20]. Table 8 summarizes the ANOVA results of the quadratic model for the elimination of the target pollutant under designated experiments. It can be seen that the model F-value of 120.30 implies the model is significant. There is a 0.01% chance that an F-value could occur due to noise. Besides, p-values less than 0.05 indicate that model terms A, B, C, AB, AC, BC, A2, B2, and C2 are significant. A positive value suggests that increasing the factor enhances adsorption efficiency, while a negative value indicates that reducing the factor promotes MB capacity. The Lack of fit F-value of 4.83 implies that there is an 8.11% chance that this could occur due to noise. A substantial correlation R2 (0.9936) value was detected between predicted and observed results, which substantiates the reliability of the model in reproducing the variations in the experimental data [19]. The predicted R2 of 0.9173 is in reasonable agreement with the adjusted R2 of 0.9853 (the difference is < 0.2). An Adeq. precision of 44.6038 indicates an adequate signal that the model can be used to navigate the design space. Next, the interaction between the response removal efficiency and the factors under this study is expressed by Eq. (4).
R (%) = 71.1511 + 18.99A − 5.7B − 15.04C + 9.89AB + 5.31AC − 4.24BC − 10.56A2 − 19.72B2 + 10.23C2 (4)
Eq. (4) shows that 4 variables, including A, AB, AC, and C2, have beneficial effects on the response, as displayed by their positive regression coefficients on the one hand. On the other hand, the other variables B, C, BC, A2, and B2 have negative effects on the response. In this context, contact time (A), mutual interaction AB, AC, and the quadratic term C2 positively influence MB adsorptive removal. In contrast, pH (B), initial concentration (C), the interaction term BC, and the quadratic terms A2, B2 negatively affect the response, leading to a reduction in adsorption efficiency.
Table 8 ANOVA analysis for the quadratic model.
Source |
Sum of Squares |
df |
Mean Square |
F-value |
p-value |
|
Model |
8046.41 |
9 |
894.05 |
120.30 |
< 0.0001 |
significant |
A-Contact time |
2886.37 |
1 |
2886.37 |
388.38 |
< 0.0001 |
|
B-pH |
259.93 |
1 |
259.93 |
34.97 |
0.0006 |
|
C-Initial Concentration |
1809.31 |
1 |
1809.31 |
243.45 |
< 0.0001 |
|
AB |
391.54 |
1 |
391.54 |
52.68 |
0.0002 |
|
AC |
112.72 |
1 |
112.72 |
15.17 |
0.0059 |
|
BC |
72.05 |
1 |
72.05 |
9.69 |
0.0170 |
|
A² |
469.46 |
1 |
469.46 |
63.17 |
< 0.0001 |
|
B² |
1637.44 |
1 |
1637.44 |
220.33 |
< 0.0001 |
|
C² |
440.34 |
1 |
440.34 |
59.25 |
0.0001 |
|
Residual |
52.02 |
7 |
7.43 |
|
|
|
Lack of Fit |
40.77 |
3 |
13.59 |
4.83 |
0.0811 |
not significant |
Pure Error |
11.25 |
4 |
2.81 |
|
|
|
Cor Total |
8098.43 |
16 |
|
|
|
|
Std. Dev. |
2.73 |
|
R² |
0.9936 |
|
|
Mean |
61.71 |
|
Adjusted R² |
0.9853 |
||
C.V. % |
4.42 |
|
Predicted R² |
0.9173 |
||
|
|
|
Adeq Precision |
44.6038 |
||
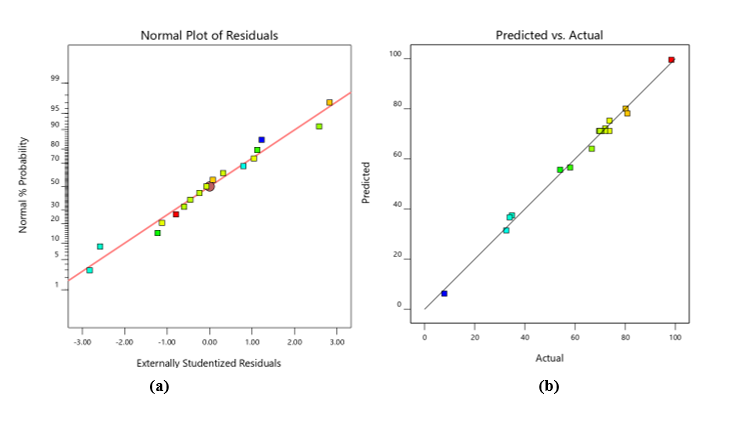
Figure 10 Determination of the accuracy and validity of the proposed model: (a) Normal probability plot of residuals, (b) Experimental outcomes vs predicted outcomes by the statistical model.
Next, a key stage in evaluating the model’s applicability is to examine the residuals. As can be seen in Figure 10(a), the validated model shows that although there are errors in the model, the residuals are distributed around the line. This observation was made after the model had been validated, indicating a good match between the prediction of the model and the experimental data. Figure 10(b) presents a comparison between the estimated removal efficiency of MB based on the model and the corresponding measured values. From the result, it can be concluded that there is a consistency between the measured and simulated values for MB removal, indicating the robustness of the statistical analysis and providing strong support for the experimental results.
Moreover, 3D surface graphics were used to evaluate the interactions between the variables of MB adsorption by the BMC. Figure 11(a) shows an increase in removal efficiency by extending the contact time from 20 to 180 min, accompanied by a change of pH close to the neutral environment. This suggests that a proper duration is needed for MB molecules’ diffusion into the pores of the BMC and enhance the MB removal. In addition, the removal of MB is found as a combination effect of contact time and initial concentration (Figure 11(b)). It can be observed that the removal efficiency of MB increased with increasing contact time, but decreased with increasing initial concentration. Furthermore, the plot in Figure 11(c) illustrates that a decrease in the efficiency is obtained by an increase in the initial concentration. This trend can be explained by the saturation of specific active sites on the sorbent’s surface [45]. Besides, the removal efficiency was improved as pH changes to neutral conditions due to a competition of H+ or OH− at acidic or basic conditions.
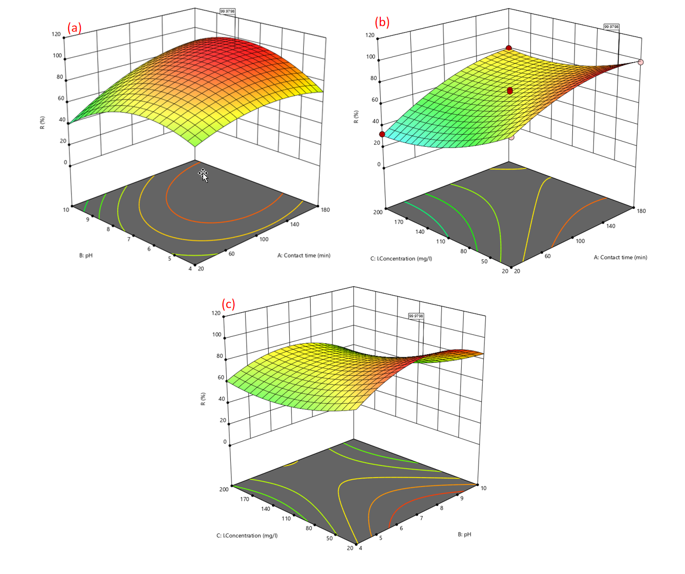
Figure 11 3D response surface plots of (a) contact time - pH, (b) contact time - initial concentration, and (c) pH - initial concentration.
Finally, the optimal conditions for MB removal efficiency using the BMC are demonstrated in Figure 12. The conducted calculations and the obtained desirability score for MB illustrate that the maximum removal efficiency was approximately 99.7% at optimal conditions (contact time of 151 min, pH 6.9, and initial concentration of 22.6 mg/L). Moreover, an experiment was conducted to examine the adsorption performance following the optimal conditions. A 99.9% removal efficiency observed in this experiment indicates that the BMC can be considered a promising and highly potential dye treatment application.
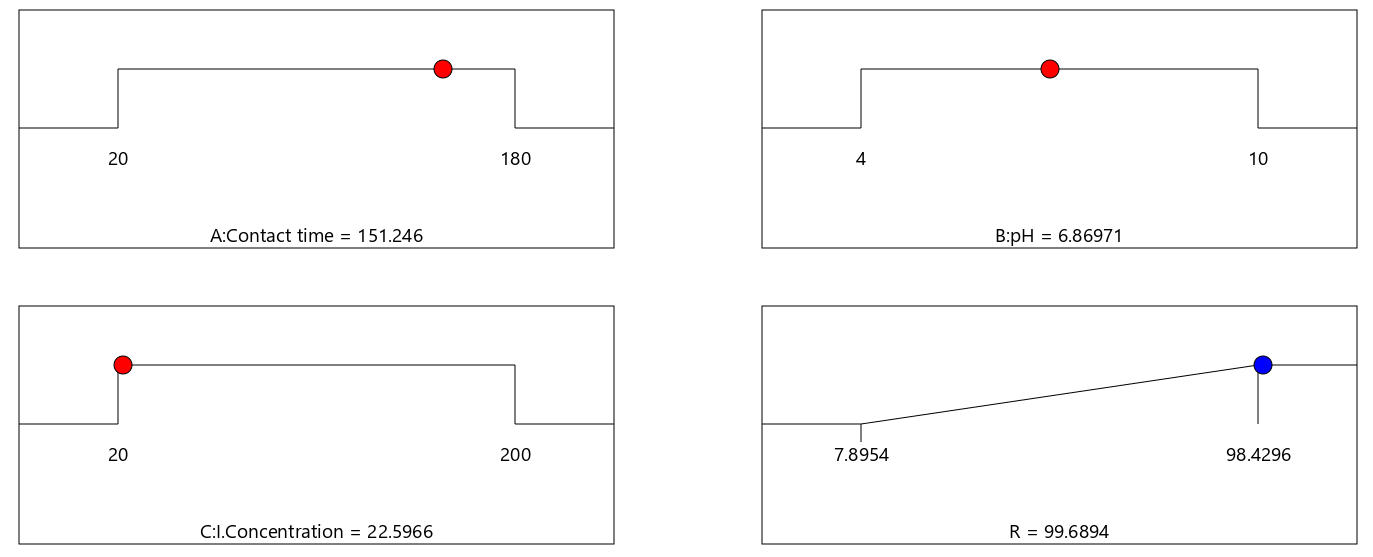
Figure 12 The optimal conditions for the elimination of MB using the BMC.
Conclusions
The BMC was successfully prepared from the banana pseudo-stem via cellulose surface modification under eco-friendly conditions by using Fenton oxidation. The structure, composition, and morphology of the produced BMC were identified by SEM, EDS, FTIR, and XRD analyses. The preliminary experiment results showed that approximately 97% of MB was removed after 15 min of contact time and pH 6.01. Additionally, the MB adsorption fits better with pseudo-second order kinetics and Langmuir isotherm models, indicating a chemisorption on a homogeneous surface. Moreover, the thermodynamic data reveal that the adsorption process is spontaneous (ΔG of −4.45 to −4.71 kJ/mol) and exothermic (ΔH = −0.576 kJ/mol). The optimization of MB removal was conducted using a Box-Behnken design of response surface methodology for 3 variables. From ANOVA data, a maximum removal efficiency of 99.7% was obtained at 151 min of contact time, pH 6.9, and 22.6 mg/L of initial concentration. Therefore, it can be concluded that the BMC prepared from agro-waste is an efficient and promising adsorbent for wastewater treatment, with considerable potential for application in the elimination of additional pollutants.
Acknowledgements
This research is funded by Vietnam National University - Ho Chi Minh City, Vietnam under grant number DS2025-16-01.
Declaration of generative AI in scientific writing
No content generation or data interpretation was performed by AI. The authors take full responsibility for the content and conclusions of this work.
CRediT author statement
Quynh Anh Nguyen Thi: Conceptualization, Investigation, Visualization, Writing - original draft. Nhat Huy Nguyen: Supervision, Writing - original draft, Writing - review & editing. Phuoc Toan Phan: Validation, Formal analysis. Thuy Nguyen Thi: Funding acquisition, Validation. Tri Thich Le: Investigation, Data Curation. Trung Thanh Nguyen: Conceptualization, Funding acquisition, Methodology, Project administration, Resources, Supervision, Writing-review & editing.
[1] B Lellis, CZ Fávaro-Polonio, JA Pamphile and JC Polonio. Effects of textile dyes on health and the environment and bioremediation potential of living organisms. Biotechnology Research and Innovation 2019; 3(2), 275-290,
[2] JB Adeoye, SY Lau, YH Tan, YY Tan, T Chiong, NM Mubarak, G Anbuchezhiyan, M Khalid and JTW Ng. A comprehensive review on adsorption technologies for methylene blue elimination: Efficiency, mechanisms, and future perspectives. Discover Applied Sciences 2025; 7(11), 1285.
[3] SH Paiman, MA Rahman, T Uchikoshi, N Abdullah, MHD Othman, J Jaafar, KH Abas and AF Ismail. Functionalization effect of Fe-type MOF for methylene blue adsorption. Journal of Saudi Chemical Society 2020; 24(11), 896-905.
[4] F Ebrahimzadeh and A Akbari. Investigation the adsorption mechanisms, chemical resistance and mechanical strength of the synthesized chitosan/activated carbon composite in methylene blue removal. Scientific Reports 2025; 15(1), 37820,
[5] KH Alharbi. Efficient removal of methylene blue from aqueous solutions using mixed oxides of cobalt oxide and tungsten trioxide modified graphene oxide. Journal of Saudi Chemical Society 2024; 28(1), 101802,
[6] AM Metwally, SAA Aly, SO Makled and AMS Abdelkader. Biosorption of methylene blue from industrial wastewater using silicon dioxide nanoparticles and Cladophora glomerata. Alexandria Engineering Journal 2025; 130, 115-138.
[7] L Ma, W Liu, B Liu and Y Tang. Removal of methylene blue by acrylic polymer adsorbents loaded with magnetic iron manganese oxides: Synthesis, characterization, and adsorption mechanisms. Chemosphere 2024; 346, 140588.
[8] G Mosoarca, C Vancea, S Popa, ME Radulescu-Grad, M Dan, C Tanasie and S Boran. Adsorption of methylene blue onto environmentally friendly lignocellulosic material obtained from mature coltsfoot (Tussilago farfara) Leaves. Polymers 2025; 17(11), 1549.
[9] D Dimbo, M Abewaa, E Adino, A Mengistu, T Takele, A Oro and M Rangaraju. Methylene blue adsorption from aqueous solution using activated carbon of spathodea campanulata. Results in Engineering 2024; 21, 101910.
[10] J Fito, M Abewaa, A Mengistu, K Angassa, AD Ambaye, W Moyo and T Nkambule. Adsorption of methylene blue from textile industrial wastewater using activated carbon developed from Rumex abyssinicus plant. Scientific Reports 2023; 13(1), 5427.
[11] D Sachdev, K Shah, D Sharma, G Verma, N Kaur and O Sahu. Adsorptive removal of methylene blue dye by extracted banana stem fibers. Materials Today: Proceedings 2022; 68, 728-733,
[12] A El Mahdaoui, S Radi, A Elidrissi, MAF Faustino, MGPMS Neves and NMM Moura. Progress in the modification of cellulose-based adsorbents for the removal of toxic heavy metal ions. Journal of Environmental Chemical Engineering 2024; 12(5), 113870.
[13] T Nikiforova, V Kozlov, P Razgovorov, N Politaeva, K Velmozhina, P Shinkevich and V Chelysheva. Heavy metal ions(II) sorption by a cellulose-based sorbent containing sulfogroups. Polymers 2023; 15(21), 4212.
[14] D Suteu, S Coseri, C Zaharia, G Biliuta and I Nebunu. Modified cellulose fibers as adsorbent for dye removal from aqueous environment. Desalination and Water Treatment 2017; 90, 341-349.
[15] P Groszewicz, P Mendes, B Kumari, J Lins, T Gutmann and G Buntkowsky. N-Hydroxysuccinimide-activated esters as a functionalization agent for amino cellulose: Synthesis and solid-state NMR characterization. Cellulose 2020; 27, 1239-1254.
[16] XM Fan, HY Yu, DC Wang, ZH Mao, J Yao and KC Tam. Facile and green synthesis of carboxylated cellulose nanocrystals as efficient adsorbents in wastewater treatments. ACS Sustainable Chemistry & Engineering 2019; 7(21), 18067-18075.
[17] Y Gong, Q Zhang, H Yuan and X Luo. Fabrication of carboxylated cellulose microspheres via Fe2+/H2O2 oxidation method and their application in vitamin B12 efficient loading and controlled release. Journal of Drug Delivery Science and Technology 2025; 104, 106515.
[18] D Ortiz, M Munoz, J Nieto-Sandoval, C Romera-Castillo, ZM de Pedro and JA Casas. Insights into the degradation of microplastics by Fenton oxidation: From surface modification to mineralization. Chemosphere 2022; 309, 136809.
[19] B Belahrach, M Farah, Y Belaoufi, M Bensemlali, H Nasrellah, N Labjar, A Baraket, A Dahrouch and S El Hajjaji. Optimization of process parameters for methylene blue dye removal using “Eriobotrya Japonica” grains via box-behnken design based on response surface methodology. Eng 2025; 6(6), 123.
[20] NH Abdullah, M Mohamed, NA Mohd Shohaimi, AM Lazim, AZA Halim, NM Shukri and MKAA Razab. Enhancing the decolorization of methylene blue using a low-cost super-absorbent aided by response surface methodology. Molecules 2021; 26(15), 4430.
[21] SJ Peighambardoust, M Azari, PM Pakdel, R Mohammadi and R Foroutan. Carboxymethyl cellulose grafted poly(acrylamide)/magnetic biochar as a novel nanocomposite hydrogel for efficient elimination of methylene blue. Biomass Conversion and Biorefinery 2024; 15, 15193-15209.
[22] H Holilah, Asranudin, N El Messaoudi, M Ulfa, A Hamzah, Z Hamid, D Ramadhani, L Suryanegara, M Mahardika, A Melenia, A Pratama and D Prasetyoko. Fabrication a sustainable adsorbent nanocellulose-mesoporous hectorite bead for methylene blue adsorption. Case Studies in Chemical and Environmental Engineering 2024; 10, 100850.
[23] V Ngwenya, NR Sibanda Ndebele, LK Ncube, NZ Nkomo, S Gadlula and LN Ndlovu. Enhanced technique for removal of methylene blue dye from water using Luffa microcrystalline cellulose. South African Journal of Chemistry 2024; 78, 113-121.
[24] HT Kara, ST Anshebo, FK Sabir, GA Workineh and MA Delele. Removal of methylene blue dye from wastewater using periodiated modified nanocellulose. International Journal of Chemical Engineering 2021; 2021(1), 1-16.
[25] N Somsesta, V Sricharoenchaikul and D Aht-Ong. Adsorption removal of methylene blue onto activated carbon/cellulose biocomposite films: Equilibrium and kinetic studies. Materials Chemistry and Physics 2020; 240, 122221.
[26] KB Tan, AZ Abdullah, BA Horri and B Salamatinia. Adsorption mechanism of microcrystalline cellulose as green adsorbent for the removal of cationic methylene blue dye. Journal of the Chemical Society of Pakistan 2016; 38(4), 651-664.
[27] H Bai, J Chen, X Zhou and C Hu. Single and binary adsorption of dyes from aqueous solutions using functionalized microcrystalline cellulose from cotton fiber. Korean Journal of Chemical Engineering 2020; 37(11), 1926-1932.
[28] M Diarsa and A Gupte. Preparation, characterization and its potential applications in Isoniazid drug delivery of porous microcrystalline cellulose from banana pseudostem fibers. 3 Biotech 2021; 11(7), 334.
[29] Holilah, Asranudin, N El Messaoudi, M Ulfa, A Hamzah, ZAA Hamid, DV Ramadhani, L Suryanegara, M Mahardika, AT Melenia, AW Pratama and D Prasetyoko. Fabrication a sustainable adsorbent nanocellulose-mesoporous hectorite bead for methylene blue adsorption. Case Studies in Chemical and Environmental Engineering 2024; 10, 100850.
[30] R Gomez-Garcia, SC Sousa, OL Ramos, DA Campos, CN Aguilar, AR Madureira and M Pintado. Obtention and characterization of microcrystalline cellulose from industrial melon residues following a biorefinery approach. Molecules 2024; 29(14), 3285.
[31] R Randis, DB Darmadi, F Gapsari and AAA Sonief. Isolation and characterization of microcrystalline cellulose from oil palm fronds biomass using consecutive chemical treatments. Case Studies in Chemical and Environmental Engineering 2024; 9, 100616.
[32] Z Xiao, Y Pan, Q Zhao, J Yang, H Wang, L Yu, X Ding and J Huang. Surface cationization of cellulose via Fenton oxidation for remedying dye contaminants: Adsorption performance and mechanism. International Journal of Biological Macromolecules 2025; 312, 144040.
[33] V Jakka, A Goswami, AK Nallajarla, U Roy, K Srikanth and S Sengupta. Coconut coir-derived nanocellulose as an efficient adsorbent for removal of cationic dye safranin-O: A detailed mechanistic adsorption study. Environmental Science and Pollution Research 2025; 32(32), 19026-19047.
[34] AS El-Zeny, ESRH El-Gharkawy, TA Gad-Allah and MA Akl. Novel aminothiazole-supported chlorocellulose composite for the efficient removal of cationic dyes from wastewater. RSC Advances 2025; 15(48), 40501-40518.
[35] ZU Zango and SS Imam. Evaluation of microcrystalline cellulose from groundnut shell for the removal of crystal violet and methylene blue. Nanoscience and Nanotechnology 2018; 8(1), 1-6.
[36] M Naushad, AA Alqadami, ZA AlOthman, IH Alsohaimi, MS Algamdi and AM Aldawsari. Adsorption kinetics, isotherm and reusability studies for the removal of cationic dye from aqueous medium using arginine modified activated carbon. Journal of Molecular Liquids 2019; 293, 111442.
[37] HA Said, I Ait Bourhim, A Ouarga, I Iraola-Arregui, M Lahcini, A Barroug, H Noukrati and HB Youcef. Sustainable phosphorylated microcrystalline cellulose toward enhanced removal performance of methylene blue. International Journal of Biological Macromolecules 2023; 225, 1107-1118.
[38] CHC Tan, S Sabar, MKM Haafiz, ZN Garba and MH Hussin. The improved adsorbent properties of microcrystalline cellulose from oil palm fronds through immobilization technique. Surfaces and Interfaces 2020; 20, 100614.
[39] CHC Tan, S Sabar and MH Hussin. Development of immobilized microcrystalline cellulose as an effective adsorbent for methylene blue dye removal. South African Journal of Chemical Engineering 2018; 26, 11-24.
[40] K Phumivanichakit, T Borsu, J Maneerat, P Kaewmaneerat and P Wangsirikul. Utilizing jackfruit peel as a sustainable adsorbent for methylene blue dye: Adsorption efficiency and isotherm analysis. Engineering and Technology Horizons 2025; 42(3), 420308.
[41] TTC Truong, NTT Vo, KD Nguyen and HM Bui. Preparation of cellulose-based hydrogel derived from tea residue for the adsorption of methylene blue. Cellulose Chemistry and Technology 2019; 53, 573-582.
[42] SJ Peighambardoust, S Rezaei-Aghdam, JS Niroumand, PM Pakdel and M Sillanpää. Efficient methylene blue elimination from water media by nanocomposite adsorbent-based carboxymethyl cellulose-grafted poly(acrylamide)/magnetic biochar decorated with ZIF-67. RSC Advances 2025; 15, 32407-32423,
[43] NB Allou, MA Tigori, AA Koffi, M Halidou, NS Eroi, P Atheba and A Trokourey. Methylene blue magnetic adsorption separation process from aqueous solution using corn cob. Scientific African 2023; 21, e01828,
[44] H Melese and H Kara. Cellulose based adsorbent for cationic methylene blue dye removal. Discover Applied Sciences 2024; 6(2), 46.
[45] S Afshin, Y Rashtbari, M Vosough, A Dargahi, M Fazlzadeh, A Behzad and M Yousefi. Application of Box-Behnken design for optimizing parameters of hexavalent chromium removal from aqueous solutions using Fe3O4 loaded on activated carbon prepared from alga: Kinetics and equilibrium study. Journal of Water Process Engineering 2021; 42, 102113.