Trends
Sci.
2026;
23(8):
11719
Drying Kinetics and Quality Assessment of Thai Rice Noodles Using Hot-Air and 2-Stage Drying Methods
Paradorn Nuthong1, Kunthikar Bunsupawong2, Jittimon Wongsa3,4 and Thanutyot Somjai5,*
1Department of Applied Physics, Faculty of Sciences and Liberal Arts, Rajamangala University of Technology Isan, Nakorn Ratchasima 30000, Thailand
2Department of Applied Biology, Faculty of Sciences and Liberal Arts, Rajamangala University of Technology Isan, Nakorn Ratchasima 30000, Thailand
3Department of Agricultural Engineering for Industry, Faculty of Industrial Technology and Management,
King Mongkut’s University of Technology North Bangkok (Prachinburi Campus), Prachinburi 25230, Thailand
4Food and Agro-Industry Research Center, Science and Technology Research Institute, King Mongkut’s University of Technology North Bangkok, Bangkok 10800, Thailand
5Department of Industrial Management, Faculty of Industrial Technology and Management, King Mongkut’s University of Technology North Bangkok (Prachinburi Campus), Prachinburi 25230, Thailand
(*Corresponding author’s e-mail: [email protected])
Received: 28 August 2025, Revised: 30 September 2025, Accepted: 7 October 2025, Published: 10 March 2026
Abstract
This
study investigated the drying kinetics and quality attributes of
Thai rice noodles subjected to hot air and 2-stage thin layer drying
methods. Hot-air drying experiments were conducted at 40, 50, and 60
°C The 2-stage drying involved an initial infrared drying phase at
200, 400, and 600 W for 120, 90, and 30 min, respectively, followed
by hot-air drying at temperatures of 40, 50 and 60 °C. Key quality
parameters assessed included color metrics, rehydration ratio,
surface morphology, and texture. Results showed that the moisture
content during hot-air drying decreased exponentially, with the
drying rates varying from 0.0119 to 0.0236
 and
drying times from 120 to 240 min. The effective diffusion
coefficient ranged from 1.3378×10⁻¹¹
to 2.5796×10⁻¹¹
m2/s
and, drying behavior was well described by Page’s drying model. In
contrast, the two-stage drying exhibited a linear moisture decrease
during the infrared phase and an exponential decrease during the
subsequent hot-air drying. The drying rates ranged from 0.0096 to
0.0376
and
drying times from 120 to 240 min. The effective diffusion
coefficient ranged from 1.3378×10⁻¹¹
to 2.5796×10⁻¹¹
m2/s
and, drying behavior was well described by Page’s drying model. In
contrast, the two-stage drying exhibited a linear moisture decrease
during the infrared phase and an exponential decrease during the
subsequent hot-air drying. The drying rates ranged from 0.0096 to
0.0376
 with
drying times ranged between 75 and 300 min. Effective diffusion
coefficients for the first and second stages ranged from
4.1045×10⁻¹²
to 2.6461×10⁻¹¹
to 1.5668×10⁻¹¹
to 4.3220×10⁻¹¹
m2/s,
respectively, with drying kinetics accurately predicted by Singh et
al.
drying model. Quality analysis revealed that prolonged drying time
reduced brightness but increased redness and yellowness. Both drying
techniques produced dried noodles exhibiting quality characteristics
comparable to commercial products, along with a notably higher
rehydration ratio.
with
drying times ranged between 75 and 300 min. Effective diffusion
coefficients for the first and second stages ranged from
4.1045×10⁻¹²
to 2.6461×10⁻¹¹
to 1.5668×10⁻¹¹
to 4.3220×10⁻¹¹
m2/s,
respectively, with drying kinetics accurately predicted by Singh et
al.
drying model. Quality analysis revealed that prolonged drying time
reduced brightness but increased redness and yellowness. Both drying
techniques produced dried noodles exhibiting quality characteristics
comparable to commercial products, along with a notably higher
rehydration ratio.
Keywords: Thai rice noodles drying, Effective diffusion coefficients, Mathematical modeling, Hot-air drying, Two-stage drying
Introduction
Thai rice noodles, known as Khanom Jeen, are made from rice flour and resemble round rice noodles in shape. Based on the type of flour used, they can be classified into 2 categories: Noodles made from fresh flour and those made from fermented flour. Fermented flour, popular in northeastern Thailand, is traditionally
prepared by soaking heavy rice and fermenting it for up to 3 days. The fermented flour is then boiled, sieved, and added to boiling water to form noodles through a traditional flour-mixing technique. These noodles tend to be brown, firm, soft in texture, and have a longer shelf life. In contrast, noodles made from fresh flour are typically larger, white in color, capable of retaining more water, and softer but less sticky than those made with fermented dough. While the production process is similar, fresh flour does not require extended soaking, resulting in white noodles free of broken strands, off-odors, or mucilage. However, these noodles have a shorter shelf life.
Previous research has extensively examined hot-air drying (HA) and infrared radiation drying (IR) of agricultural and food commodities. Studies on hot-air drying have shown that drying temperature significantly influences drying characteristics. Specifically, increasing the drying temperature enhances the drying rate while reducing overall drying time [1]. Hot-air drying typically occurs during the falling-rate period [2]. In the case of infrared radiation drying, higher infrared power correlates with an increased drying rate and shorter drying time [3,4]. Compared to hot-air drying, infrared drying can reduce drying time by 33% - 83% [2,3]. Furthermore, combined drying methods using both infrared and hot air (IR-HA) have been found to further increase the drying rate [5,6]. Drying characteristics are typically categorized into 3 distinct periods: The heat-up period, the constant-rate period, and the falling-rate period, with most drying processes occurring predominantly during the falling-rate period. Drying behavior can be described using theoretical, semi-theoretical, and empirical models. Key drying parameters - such as the effective moisture diffusion coefficient and the drying constant - are used to characterize moisture content changes over time. Studies have shown that the effective diffusion coefficient increases with both drying temperature [1,7,8] and infrared power [3,9,10]. These coefficients, along with drying constants derived from the models, provide insight into the rate of moisture migration within the material. Notably, infrared drying tends to yield higher effective diffusion coefficients than hot-air drying [7], indicating faster internal moisture transport. Among the available modeling techniques, non-linear regression analysis is the most commonly used method for determining drying constants [11].
Previous studies have evaluated dried product qualities such as rehydration ratio, color, water activity, and related physicochemical properties. In addition, surface morphology and hardness have been analyzed, often in comparison with standard or commercially available products. Assessing product quality is essential for identifying optimal drying processes, as it directly influences product quality, energy efficiency, and cost-effectiveness. Drying at elevated temperatures and higher infrared power levels has been shown to significantly affect product quality [12]. Various drying methods - including hot-air drying, infrared drying, combined infrared and hot-air drying, and intermittent infrared-hot-air drying - have been reported to have no significant impact on shrinkage or total color change. However, infrared drying followed by hot-air drying significantly affected total color values [13]. Increasing infrared power and drying temperature generally improved the rehydration ratio while reducing shrinkage [14,15]. Furthermore, infrared drying has been associated with better product quality compared to hot-air drying [5], though it tends to result in lower color change values [12].
A review of the literature indicated that the infrared drying significantly reduced drying time due to its high energy, while the hot-air drying take a longer time but yields a good quality product. Therefore, a two-stage drying approach (infrared drying followed by hot-air drying) presents an interesting alternative for drying Thai rice noodles. Accordingly, the objectives of this study were to investigate the effects of hot-air and 2-stage drying on the thin-layer drying behavior of Thai rice noodles, specifically focusing on total color change and key quality attributes of the dried product.
Materials and methods
Materials
Fresh
Thai noodles were sourced from a local market in Mueang District,
Nakhon Ratchasima Province, Thailand. The samples were conditioned
by refrigerating them at 4 °C for 24 h [16,17]. The samples were
then sliced into 100-mm strips. Before the experiment, samples were
packed into trays weighing 50
 (3 trays), with the noodles evenly spread to a uniform thickness of
10 mm.
(3 trays), with the noodles evenly spread to a uniform thickness of
10 mm.
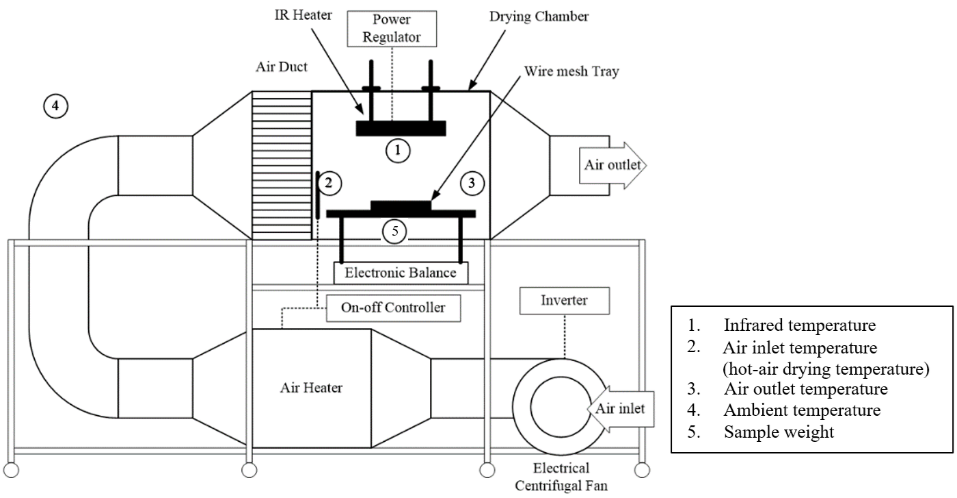
Figure 1 Schematic diagram of the infrared and convective air dryer.
Experimental set-up and drying procedure
Experimental set-up
An infrared and hot-air dryer was used in this study (Figure 1). The drying chamber had dimensions of 0.5×0.5×0.5 m3. Hot air was generated by an electric heater capable of reaching a maximum temperature of 120 °C, with temperature regulation controlled by a thermostat. A centrifugal fan with curved front blades circulated air at a maximum speed of 2.0 m/s. An infrared radiator (650 W) was positioned parallel to the tray, and the distance between the emitter and sample was kept constant at 200 mm.
Drying process
Thai rice noodles were dried in a thin layer on 3 aluminum trays weighing 50 ± 3 g each. The noodles were evenly spread to a uniform thickness of no more than 1 cm. After drying, the moisture content decreased from 303.36 ± 5.43 to 13.88 ± 0.85 %d.b. [3].
Hot-air drying was carried out at an air velocity of 1.0 m/s and drying temperatures of 40, 50, and 60 ℃. The drying conditions were maintained at stable levels throughout the experiments. Samples were placed into the drying chamber, and their weights were recorded every 15 min for the first h and then every 30 min until drying was complete. The experiments were done in 3 replications.
Table 1 Color qualities of Thai rice noodles dried using infrared drying in the first stage.
Infrared Power (W) |
Moisture content (%db.) |
Lightness (L*) |
Redness (a*) |
Yellowness (b*) |
Total color change (∆E*) |
Commercial product |
|
62.27 |
–0.46 |
7.80 |
14.69 |
200 W |
198.52 |
71.95 |
–0.23 |
8.56 |
7.77 |
400 W |
132.80 |
66.08 |
–0.26 |
7.76 |
13.20 |
600 W |
190.87 |
71.54 |
–0.32 |
8.59 |
8.15 |
Two-stage drying was carried out by applying infrared radiation in the first stage at power levels of 200, 400, and 600 W for 120, 90, and 30 min, respectively. The distance between the emitter and sample was 200 mm while an air velocity of 1.0 m/s was used. In the second stage, the samples from the first stage were further dried using hot air at 40, 50, and 60 °C. Color and moisture content were used as criteria to determine the appropriate drying method - either infrared or hot-air drying. The variations in these parameters were required to remain smaller than those observed in the commercial product (Table 1). The data were collected using the same procedure as in the hot-air drying experiments. The experiments were done in 3 replications.
Drying characteristics
Moisture content
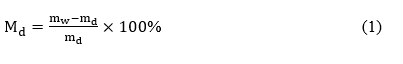
Moisture content refers to the amount of water present in a material. During drying, it is typically quantified using 2 primary methods: The wet basis, which is commonly used in commercial applications; and the dry basis, which is preferred in drying kinetics analysis due to its reference to a constant dry mass. Samples were in an oven dryer at 105 ℃ for 24 h [15]. Moisture content on a dry basis was calculated using Eq. (1).
where
 is the moisture content of the Thai rice noodles (% d.b.),
 is the mass of the Thai rice noodles (g), and
 is the mass of dry matter (g).
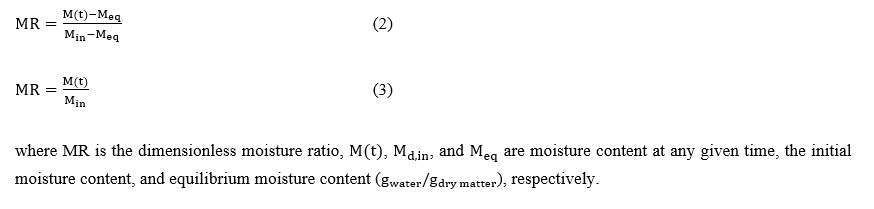
In
agricultural and food materials, the initial moisture content is
often difficult to control. As a result, comparisons of moisture
content are typically expressed in terms of moisture ratio (MR) as
defined in Eq. (2). In infrared drying, the equilibrium moisture
content was lower than the initial moisture content ( )
and moisture content at any given time (
)
and moisture content at any given time ( ).
Therefore, the moisture ratio could be simplified as shown in Eq.
(3) [18,19].
).
Therefore, the moisture ratio could be simplified as shown in Eq.
(3) [18,19].
Specific drying rate
The
specific drying rate (SDR) refers to the rate at which moisture
evaporates from the material per unit time during drying. The unit
of SDR is expressed as
,
as shown in Eq. (4) [17].

Mathematical modelling
Determination of effective moisture diffusivity
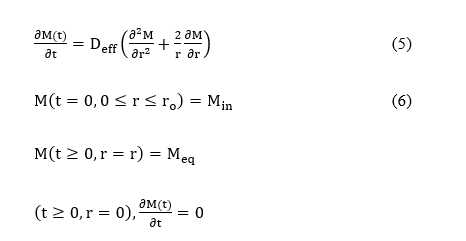
Fick’s second law is used to characterize material drying behavior under unstable moisture diffusion conditions: [18].
where
M is the average moisture content at any time,
 is the effective moisture diffusion coefficient (m2/s),
t is the drying time (s), and r is the radius of the material (m).
In this study, Thai rice noodle were assumed to have the geometry of
an infinite cylinder, as moisture diffusion was considered to occur
in the radial direction. It solved Eq. (5) by using the boundary
conditions of Eq. (6) and wrote in terms of the moisture ratio (Eq.
(3)). Therefore, the drying behavior could be simplified based on
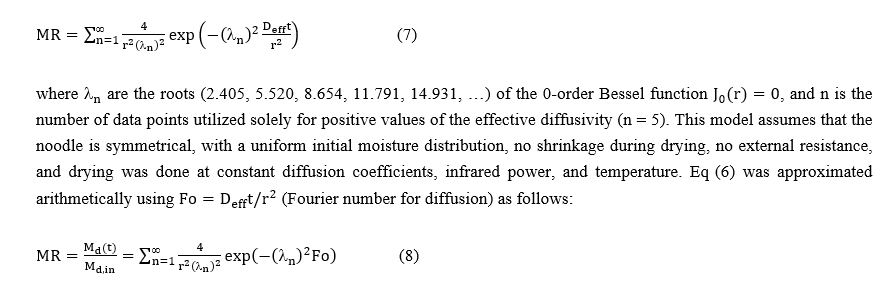
this geometry, as derived from Eq. (7) [10,13,18].
is the effective moisture diffusion coefficient (m2/s),
t is the drying time (s), and r is the radius of the material (m).
In this study, Thai rice noodle were assumed to have the geometry of
an infinite cylinder, as moisture diffusion was considered to occur
in the radial direction. It solved Eq. (5) by using the boundary
conditions of Eq. (6) and wrote in terms of the moisture ratio (Eq.
(3)). Therefore, the drying behavior could be simplified based on
this geometry, as derived from Eq. (7) [10,13,18].
The
effective diffusion coefficient was determined using the slope
method, which is appropriate for assessing the diffusion coefficient
that vary non-linearly with moisture content. The diffusion
coefficient was determined using the slope of the experimental
moisture ratio versus time
 and the slope of the calculated moisture ratio versus the Fourier
number
and the slope of the calculated moisture ratio versus the Fourier
number
 at the same moisture content. The analytical value of the diffusion
coefficient could be derived using Eq. (9) [20].
at the same moisture content. The analytical value of the diffusion
coefficient could be derived using Eq. (9) [20].
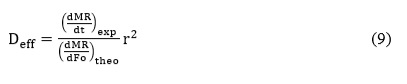
The activation energy for diffusion was determined using the Arrhenius equation, based on the effective diffusion coefficient with hot-air temperature for hot-air drying and with infrared power for infrared drying, as shown in Eqs. (10) and (11), respectively.
where
is the effective diffusion coefficient (m2/s),
 is the pre-exponential factor of the Arrhenius equation (m2/s),
 is the activation energy in
 for Eq. (10) and in
 for Eq. (11),
 is the absolute drying temperature (K), P is the infrared power (W),
m is the sample weight (g), and R is the universal gas constant
(8.314 kJ/mol∙K).
is the absolute drying temperature (K), P is the infrared power (W),
m is the sample weight (g), and R is the universal gas constant
(8.314 kJ/mol∙K).
Drying kinetics model
Currently, many popular drying kinetic models use various equations. This article considers the drying kinetics, as shown in Table 2. It is used to describe the change in moisture content over drying time. Nonlinear regression methods were used to analyze the data [10,11,18,21].
Table 2 Thin-layer drying models applied to Thai rice noodle drying.

Quality analysis
Color measurements
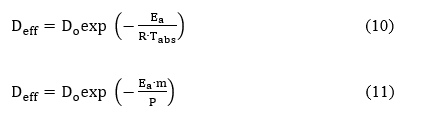
The color of the dried Thai rice noodles was assessed using a Hunter Lab colorimeter, model MiniScan EZ. Measurements were based on CIE system standards. The findings were given in terms of brightness/blackness (L*), redness/greenness (a*), and yellowness/blueness (b*). Each sample was measured in triplicate, and the browning index (BI) was calculated using Eq. (16) [22,23].
where
 represents the lightness/darkness,
 represents redness/greenness, and
 represents yellowness/blueness over time. The experiments were done
in 3 replications.
represents yellowness/blueness over time. The experiments were done
in 3 replications.
Rehydration ratio
Dried samples were weighed and recorded. The samples were then boiled in hot water at a temperature of 95 ± 2 °C for 10 min. After boiling, excess water was removed by gently wiping the samples, which were then weighed again. The rehydration ratio (RR) was calculated in triplicate for each sample using Eq. (18) [2].
![]() where
and
where
and
 are the weights of the rehydrated sample and the dried sample,
respectively. The experiments were done in 3 replications.
are the weights of the rehydrated sample and the dried sample,
respectively. The experiments were done in 3 replications.
Scanning electron microscopy (SEM)
The surface morphology of the dried samples was assessed using a scanning electron microscope (SEM), model TM-3030. Samples were mounted on stubs using carbon tape. The measurement involved focusing an electron beam on the sample surface at a magnification of 400× or 500×. Each sample was imaged 3 times [2].
Textural analysis
Texture, defined as the resistance to deformation or hardness, was determined by measuring the maximum force (N) applied to the sample. The hardness of the dried rice noodles was measured using a Texture Analyzer, model TA-XT2i. The samples were cut into 10 pieces, each 5 cm in length. A 1 mm-thick PerSpex cutting probe was used for penetration tests. The crosshead speed was 10 mm/s, and the load cell was 10 kg. The pressure probe was pressed against the sample until it snapped or broke, and the maximum force was recorded [2]. Each test was performed in triplicate.
Statistical data analysis
Model
fit quality was evaluated using several statistical parameters,
including the correlation coefficient ( ),
the reduced chi-square (
),
the reduced chi-square ( ),
and the root mean square error (RMSE) as given in Eqs. (19) - (21),
respectively. An effective drying model exhibited a high
alongside low
and RMSE values
[3,7,11,13,21].
),
and the root mean square error (RMSE) as given in Eqs. (19) - (21),
respectively. An effective drying model exhibited a high
alongside low
and RMSE values
[3,7,11,13,21].
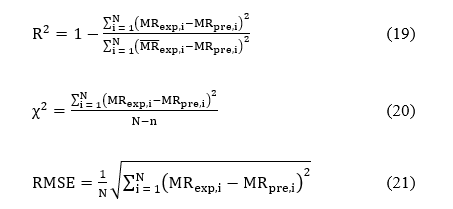
where
 is the ith
experimental moisture ratio,
is the ith
experimental moisture ratio,
 is the ith
predicted moisture ratio,
is the ith
predicted moisture ratio,
 is the mean value of ith
experimental moisture ratio,
is the mean value of ith
experimental moisture ratio,
 is the number of observations, and
 is the number of constants in the drying model.
Results and discussion
Materials text area
This study investigated 2 different drying methods for Thai rice noodles: hot-air drying and 2-stage drying. Drying characteristics were evaluated in terms of moisture content, drying rate, and surface temperature.
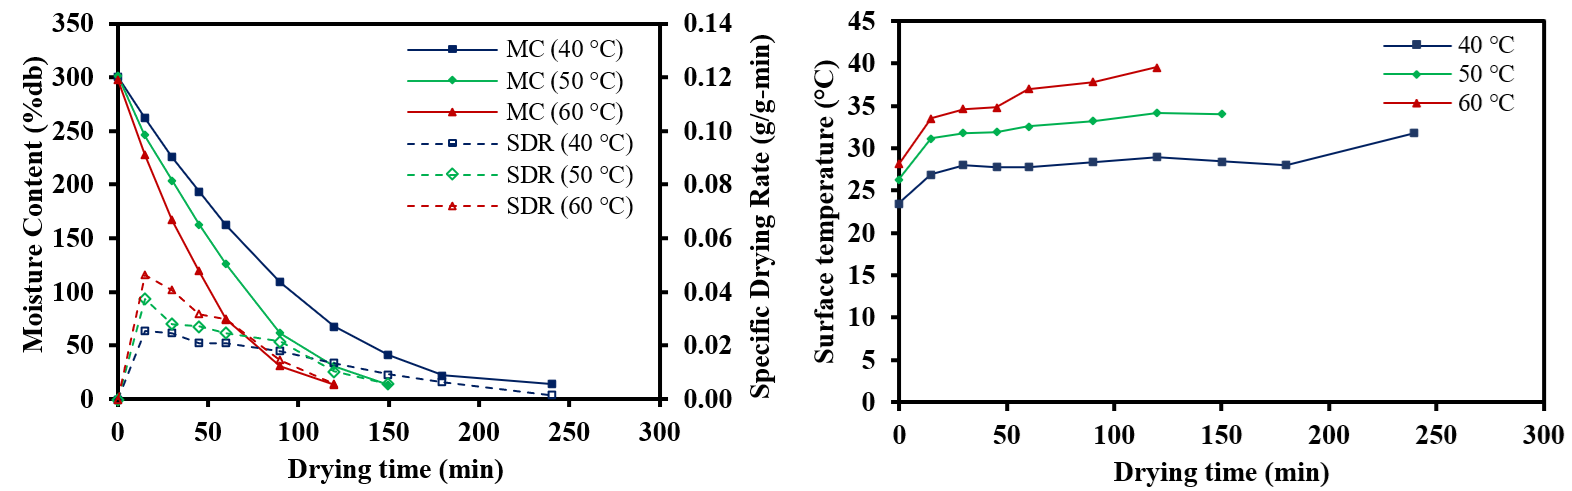
Figure 2 Drying characteristics of Thai rice noodles subjected to hot-air drying.
Hot-air drying
The
moisture content of Thai rice noodles dried using hot air decreased
exponentially (Figure
2).
Due to the initially high moisture content within the noodles, the
moisture significantly decreased during the first drying period. As
hot air contacted the noodle surface, the surface temperature
increased, enhancing water evaporation and resulting in a high mass
transfer rate Toward the end of drying, the internal moisture
content became very low due to structural shrinkage of the noodles,
leading to limited moisture diffusion and a reduced drying rate. As
such, the process predominantly occurred during the falling drying
rate period. The drying rate ranged from 0.0119 to 0.0236
,
with drying time ranging from 120 to 240 min.
Two-stage drying (infrared drying followed by hot-air drying)
The results of the 2-stage drying process are shown in Figure 3. In the first stage, infrared radiation was applied to the noodles with an initial high moisture content. The radiation caused water molecules to vibrate, generating internal heat and raising the temperature within the material above that of the surface. This promoted rapid internal moisture migration and enhanced mass transfer.
Drying
with infrared radiation at 200 W for 120 min resulted in a linear
decrease in moisture content, with an average drying rate of 0.0132
.
In the second stage, the partially dried samples were subjected to
hot-air drying. During this phase, the moisture content decreased
exponentially, and the drying rate ranged from 0.0074 to 0.0152
.
Overall, the drying rate across both stages ranged from 0.0096 to
0.0140
,
with drying times between 210 to 300 min (Figure
3(A)).
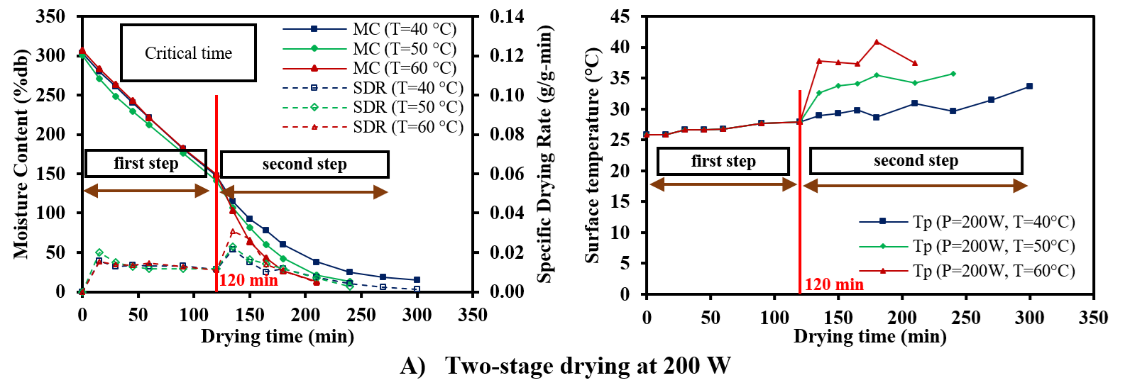
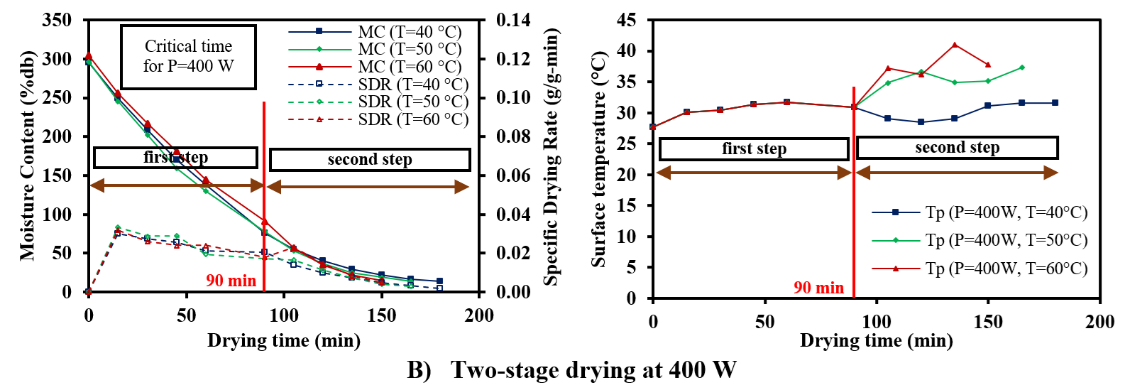
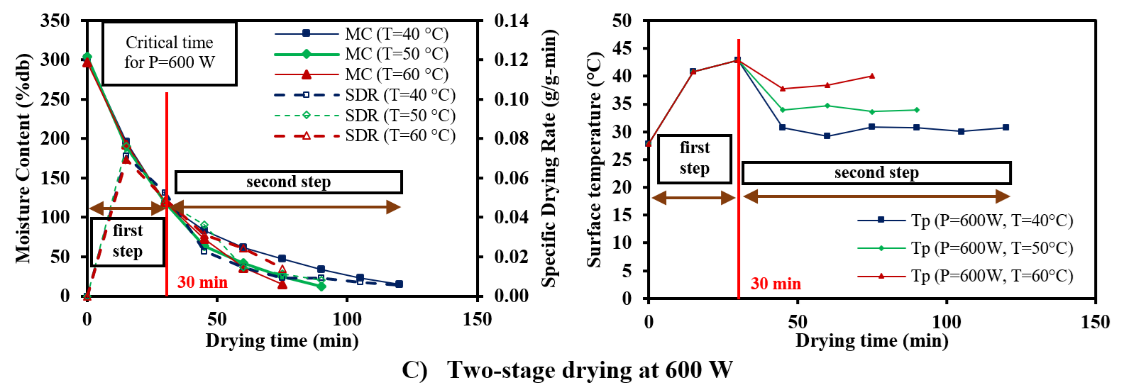
Figure 3 Drying characteristics of Thai rice noodles subjected to 2-stage drying.
Infrared
drying at 400 W for 90 min (Figure
3(B))
and 600 W for 30 min (Figure
3(C))
resulted in average drying rates of 0.0241 and 0.0611
,
respectively. In the second stage, the samples were further dried
using hot air, with corresponding drying rates ranging from 0.0069
to 0.0127 and 0.0114 to 0.0232
,
respectively. The drying rates across both stages ranged from 0.0156
to 0.0193 and 0.0240 to 0.0376
,
respectively, with the drying times ranging from 150 to 180 min
(Figure
3(B))
and 75 to 120 min (Figure
3(C)),
respectively. Higher infrared power in the first stage and elevated
drying temperature in the second stage were found to significantly
increase both the drying rate and the surface temperature of the
material.
Determination of effective moisture diffusivity
Figure
4 and
Table
3
illustrate the effective diffusion coefficient. As shown in Figure
4(A),
hot-air drying revealed that Thai rice noodles exhibited high
initial moisture content and relatively low sample temperatures
during the early stages of drying, resulting in in low moisture
diffusion. As the drying progressed, the sample temperature
increased along with internal vapor pressure, enhancing moisture
migration. Consequently, the diffusion coefficient ranged from
1.3378×
10–11
to 2.5796×10⁻¹¹
m2/s.
The Arrhenius factor and activation energy were 7.5763×10⁻⁷
m2/s
and 28,484.60 kJ/mol, respectively.
Table 3 Effective diffusion coefficient values derived from the diffusion model.
Drying process |
Infrared power (W) |
Drying temperature (℃) |
Diffusions value (m2/s) |
Do (m2/s) |
Ea |
R2 |
χ2 |
RMSE |
|
Hot-Air Drying |
- |
40 |
1.3378×10⁻¹¹ |
7.5763×10⁻⁷ |
28,484.60
|
0.8700 |
1.6410×10⁻² |
0.1215 |
|
- |
50 |
1.8967×10⁻¹¹ |
0.8606 |
1.7710×10⁻² |
0.1245 |
||||
- |
60 |
2.5796×10⁻¹¹ |
0.8922 |
1.3925×10⁻² |
0.1093 |
||||
Two-stage drying (Infrared follow by hot-air drying) |
First stage |
200 W for 120 min |
4.1045×10⁻¹² |
5.5059×10⁻¹¹ |
13.57
|
0.7977 |
7.7072×10⁻³ |
8.1279×10⁻² |
|
400 W for 90 min |
1.2017×10⁻¹¹ |
0.8497 |
1.1255×10⁻² |
9.6846×10⁻² |
|||||
600 W for 30 min |
2.6461×10⁻¹¹ |
0.9308 |
6.7377×10⁻³ |
6.7021×10⁻² |
|||||
Second stage |
200 W (120 min) |
40 |
1.5668×10⁻¹¹ |
8.0141×10⁻⁷ |
28,205.25
|
0.9355 |
6.6756×10⁻³ |
7.7031×10⁻² |
|
50 |
2.2519×10⁻¹¹ |
0.9283 |
7.9607×10⁻³ |
8.2604×10⁻² |
|||||
60 |
3.0007×10⁻¹¹ |
0.9289 |
8.7348×10⁻³ |
8.5317×10⁻² |
|||||
400 W (90 min) |
40 |
2.4503×10⁻¹¹ |
6.4119×10⁻¹⁰ |
8,474.46
|
0.9535 |
4.2927×10⁻³ |
6.0659×10⁻² |
||
50 |
2.7914×10⁻¹¹ |
0.9572 |
4.2712×10⁻³ |
5.9660×10⁻² |
|||||
60 |
2.9772×10⁻¹¹ |
0.9231 |
8.8976×10⁻³ |
8.4369×10⁻² |
|||||
600 W (30 min) |
40 |
2.4342×10⁻¹¹ |
4.0100×10⁻⁷ |
25,094.98
|
0.9286 |
7.0843×10⁻³ |
7.7925×10⁻² |
||
50 |
4.0751×10⁻¹¹ |
0.9675 |
4.1041×10⁻³ |
5.7300×10⁻² |
|||||
60 |
4.3220×10⁻¹¹ |
0.9210 |
1.1918×10⁻² |
9.4545×10⁻² |
|||||


Figures 4(B) - 4(D) illustrates the effective moisture diffusivity during 2-stage drying. In the first stage, where infrared radiation was applied, the noodles exhibited high initial moisture content. Water molecules absorbed the infrared energy and vibrated, generating internal heat and increasing internal vapor pressure. Prolonged exposure to the increased surface temperature resulted in an increase in the effective diffusion coefficient. An increase in infrared power further contributed to this effect. The effective diffusion coefficient ranged from 4.1045×10⁻¹² to 2.6461×10⁻¹¹ m2/s. The Arrhenius factor was 5.5059×10⁻¹¹ m2/s, while the activation energy was 13.57 W/g. In the second stage, which involved hot-air drying, increasing the drying temperature led to a corresponding rise in the diffusion coefficient, which ranged from 1.5668×10⁻¹¹ to 4.3220×10⁻¹¹ m2/s. The Arrhenius factor and activation energy ranged from 6.4119×10⁻¹⁰ to 8.0141×10⁻⁷ m2/s and 8,474.46 to 25,094.98 kJ/mol, respectively.
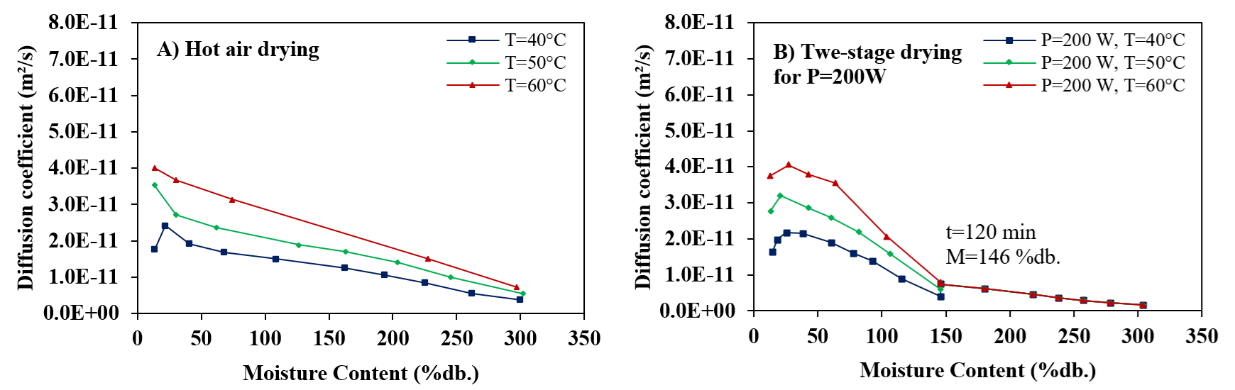
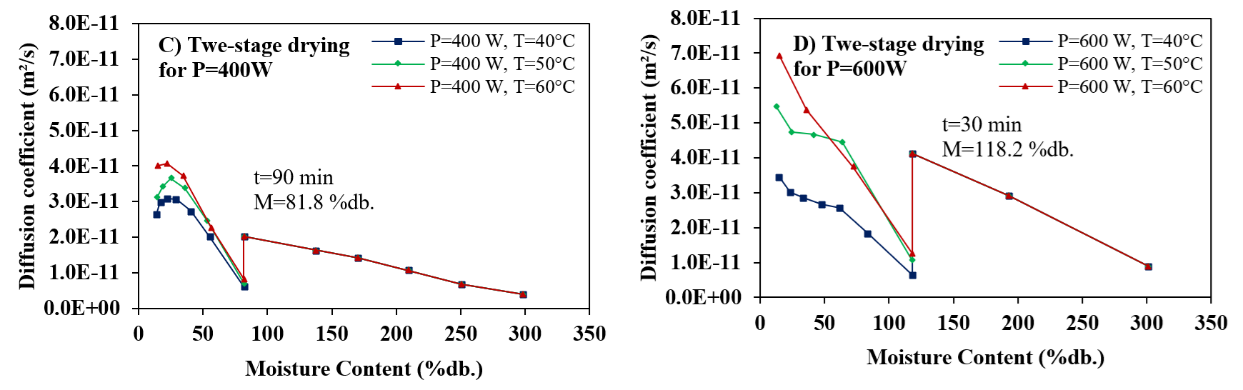
Figure 4 Effective moisture diffusion coefficient as a function of moisture content during the drying of Thai rice noodles.
Table 3 Effective diffusion coefficient values derived from the diffusion model.
Drying process |
Infrared power (W) |
Drying temperature (℃) |
Diffusions value (m2/s) |
Do (m2/s) |
Ea |
R2 |
χ2 |
RMSE |
||
Hot-Air Drying |
- |
40 |
1.3378×10⁻¹¹ |
7.5763×10⁻⁷ |
28,484.60
|
0.8700 |
1.6410×10⁻² |
0.1215 |
||
- |
50 |
1.8967×10⁻¹¹ |
0.8606 |
1.7710×10⁻² |
0.1245 |
|||||
- |
60 |
2.5796×10⁻¹¹ |
0.8922 |
1.3925×10⁻² |
0.1093 |
|||||
Two-stage drying (Infrared follow by hot-air drying) |
First stage |
200 W for 120 min |
4.1045×10⁻¹² |
5.5059×10⁻¹¹ |
13.57
|
0.7977 |
7.7072×10⁻³ |
8.1279×10⁻² |
||
400 W for 90 min |
1.2017×10⁻¹¹ |
0.8497 |
1.1255×10⁻² |
9.6846×10⁻² |
||||||
600 W for 30 min |
2.6461×10⁻¹¹ |
0.9308 |
6.7377×10⁻³ |
6.7021×10⁻² |
||||||
Second stage |
200 W (120 min) |
40 |
1.5668×10⁻¹¹ |
8.0141×10⁻⁷ |
28,205.25
|
0.9355 |
6.6756×10⁻³ |
7.7031×10⁻² |
||
50 |
2.2519×10⁻¹¹ |
0.9283 |
7.9607×10⁻³ |
8.2604×10⁻² |
||||||
60 |
3.0007×10⁻¹¹ |
0.9289 |
8.7348×10⁻³ |
8.5317×10⁻² |
||||||
400 W (90 min) |
40 |
2.4503×10⁻¹¹ |
6.4119×10⁻¹⁰ |
8,474.46
|
0.9535 |
4.2927×10⁻³ |
6.0659×10⁻² |
|||
50 |
2.7914×10⁻¹¹ |
0.9572 |
4.2712×10⁻³ |
5.9660×10⁻² |
||||||
60 |
2.9772×10⁻¹¹ |
0.9231 |
8.8976×10⁻³ |
8.4369×10⁻² |
||||||
600 W (30 min) |
40 |
2.4342×10⁻¹¹ |
4.0100×10⁻⁷ |
25,094.98
|
0.9286 |
7.0843×10⁻³ |
7.7925×10⁻² |
|||
50 |
4.0751×10⁻¹¹ |
0.9675 |
4.1041×10⁻³ |
5.7300v10–2 |
||||||
60 |
4.3220×10⁻¹¹ |
0.9210 |
1.1918×10⁻² |
|||||||
Drying kinetics
The drying constants were shown in Table 2. Newton’s model, is a simplified exponential model that describes moisture transfer in terms of the drying constant (k). The k values for hot air-drying of Thai rice noodles ranged from 1.1386×10⁻² to 2.1411×10⁻² min–1, with high R2 values (between 0.9848 and 0.9909) and low χ2 (between 1.1221×10⁻³ and 1.8205×10⁻³) and RMSE (between 3.1013×10⁻² and 3.9912×10⁻²). The k value increased with increasing drying temperature.
For 2-stage drying, the drying constant (k) value from infrared drying in the first stage ranged from 5.8030×10⁻³ to 3.0642×10⁻² min–1. The corresponding R2, χ2 and RMSE values ranged from 0.9931 to 0.9994, 5.7701×10⁻⁵ to 4.7524×10⁴ and 6.2022×10⁻³ to 1.9901×10⁻², respectively. The k value increased with higher infrared radiation. During the second stage of hot-air drying, the k values ranged from 1.4539×10⁻² to 3.8851×10⁻² min–1. As shown in Table 4, the models maintained high R2 values that ranged from 0.9879 to 0.9988, with the low χ2 and RMSE values ranging from 1.3372×10⁴ to 1.7722×10⁻³, and 1.0706×10⁻² to 3.6458×10⁻², respectively.
Table 4 Drying constant values derived from Newton’s Model.
Drying process |
Infrared power (W) |
Drying temperature (℃) |
Drying constant value (k, min–1) |
R2 |
χ2 |
RMSE |
|
Hot-Air Drying |
- |
40 |
1.1386×10⁻² |
0.9886 |
1.3669×10⁻³ |
3.5074×10⁻² |
|
- |
50 |
1.5548×10⁻² |
0.9848 |
1.8205×10⁻³ |
3.9912×10⁻² |
||
- |
60 |
2.1411×10⁻² |
0.9909 |
1.1221×10⁻³ |
3.1013×10⁻² |
||
Two-stage drying (Infrared follow by hot-air drying) |
First stage |
200 W for 120 min |
5.8030×10⁻³ |
0.9967 |
1.0854×10⁻⁴ |
9.6456×10⁻³ |
|
400 W for 90 min |
1.2963×10⁻² |
0.9931 |
4.7524×10⁻⁴ |
1.9901×10⁻² |
|||
600 W for 30 min |
3.0642×10⁻² |
0.9994 |
5.7701×10⁻⁵ |
6.2022×10⁻³ |
|||
Second stage |
200 W (120 min) |
40 |
1.4539×10⁻² |
0.9981 |
1.8965×10⁻⁴ |
1.2984×10⁻² |
|
50 |
2.0278×10⁻² |
0.9988 |
1.3372×10⁻⁴ |
1.0706×10⁻² |
|||
60 |
2.6908×10⁻² |
0.9965 |
4.1242×10⁻⁴ |
1.8539×10⁻² |
|||
400 W (90 min) |
40 |
2.2383×10⁻² |
0.9934 |
5.8931×10⁻⁴ |
2.2475×10⁻² |
||
50 |
2.5898×10⁻² |
0.9946 |
5.1842×10⁻⁴ |
2.0785×10⁻² |
|||
60 |
2.7982×10⁻² |
0.9963 |
4.1503×10⁻⁴ |
1.8222×10⁻² |
|||
600 W (30 min) |
40 |
2.1538×10⁻² |
0.9975 |
2.3615×10⁻⁴ |
1.4227×10⁻² |
||
50 |
3.6617×10⁻² |
0.9956 |
5.4713×10⁻⁴ |
2.0921×10⁻² |
|||
60 |
3.8851×10⁻² |
0.9879 |
1.7722×10⁻³ |
3.6458×10⁻² |
|||
Table 5 Drying constant values derived from Page’s model.
Drying process |
Infrared power (W) |
Drying temperature (℃) |
k (min–1) |
n |
R2 |
χ2 |
RMSE |
|
Hot-Air Drying |
- |
40 |
4.3956×10⁻³ |
1.2147 |
0.9990 |
1.2447×10⁻⁴ |
1.0584×10⁻² |
|
- |
50 |
5.7188×10⁻³ |
1.2422 |
0.9973 |
3.2464×10⁻⁴ |
1.6854×10⁻² |
||
- |
60 |
9.5720×10⁻³ |
1.2092 |
0.9993 |
8.5172×10⁻⁵ |
8.5443×10⁻³ |
||
Two-stage drying (Infrared follow by hot-air drying) |
First stage |
200 W for 120 min |
4.1622×10⁻³ |
1.0763 |
0.9989 |
3.7646×10⁻⁵ |
5.6805×10⁻³ |
|
400 W for 90 min |
7.2350×10⁻³ |
1.1468 |
0.9991 |
6.0375×10⁻⁵ |
7.0932×10⁻³ |
|||
600 W for 30 min |
2.4728×10⁻² |
1.0684 |
1.0000 |
1.0978×10⁻¹¹ |
2.7053×10⁻⁶ |
|||
Second stage |
200 W (120 min) |
40 |
1.7314×10⁻² |
0.9585 |
0.9987 |
1.3366×10⁻⁴ |
1.0900×10⁻² |
|
50 |
1.8500×10⁻² |
1.0236 |
0.9989 |
1.1825×10⁻⁴ |
1.0068×10⁻² |
|||
60 |
1.8944×10⁻² |
1.0963 |
0.9984 |
1.8883×10⁻⁴ |
1.2544×10⁻² |
|||
400 W (90 min) |
40 |
3.8476×10⁻² |
0.8591 |
0.9997 |
2.5774×10⁻⁵ |
4.7002×10⁻³ |
||
50 |
4.2130×10⁻² |
0.8681 |
0.9995 |
4.5778×10⁻⁵ |
6.1764×10⁻³ |
|||
60 |
1.8913×10⁻² |
1.1103 |
0.9988 |
1.3881×10⁻⁴ |
1.0538×10⁻² |
|||
600 W (30 min) |
40 |
2.2964×10⁻² |
0.9835 |
0.9951 |
4.6425×10⁻⁴ |
1.9948×10⁻² |
||
50 |
5.1856×10⁻² |
0.8991 |
0.9550 |
5.7464×10⁻³ |
6.7802×10⁻² |
|||
60 |
1.4209×10⁻² |
1.3055 |
0.6699 |
6.2841×10⁻² |
0.0217×10⁻² |
|||
Page’s, Singh et al., and Henderson and Pabis model, were applied to both hot-air and two-stage drying processes. For hot-air drying, all 3 drying models gave high R2 values ranging from 0.9871 to 0.9994, with low χ2 and RMSE values between 8.5172×10⁻⁵ to 1.8052×10⁻³, and 8.5443×10⁻³ to 3.6796×10⁻², respectively. During 2-stage drying, model performance in the first stage yielded R2, χ2, and RMSE values between 0.9944 to 1.0000, 4.8931×10⁻²⁰ to 1.0875×10⁻⁴, and 1.2771×10⁻¹⁰ to 1.7947×10⁻², respectively. In the second stage, during hot-air drying, model performance yielded R2, χ2, and RMSE values that ranged from 0.6699 to 0.9999, 1.5205×10⁻⁵ to 6.2841×10⁻², and 2.1700×10⁻⁴ to 6.7802×10⁻², respectively, as shown in Tables 5 - 7, respectively. All 3 models yielded large R2 values with low χ2 and RMSE values, with Page’s model emerging as most suitable for predicting the drying behavior of Thai rice noodles under hot-air drying conditions. For the 2-stage drying process, comprising infrared drying followed by hot-air drying, Singh et al. model provided the best predictive performance.
Table 6 Drying constant values derived from Singh et al. Model.
Drying process |
Infrared power (W) |
Drying temperature (℃) |
k |
a |
R2 |
χ2 |
RMSE |
|
Hot-Air Drying |
- |
40 |
−4.7878×10⁻³ |
1.2894×10⁻² |
0.9977 |
3.0638×10⁻⁴ |
1.5656×10⁻² |
|
- |
50 |
1.2784×10⁻² |
8.3882×10⁻⁴ |
0.9968 |
4.4599×10⁻⁴ |
1.8289×10⁻² |
||
- |
60 |
−9.1946×10⁻³ |
2.4638×10⁻² |
0.9994 |
3.5676×10⁻⁴ |
1.5963×10⁻² |
||
Two-stage drying (Infrared follow by hot-air drying) |
First stage |
200 W for 120 min |
−3.4731×10⁻³ |
8.6235×10⁻³ |
0.9995 |
2.0412×10⁻⁵ |
3.8184×10⁻³ |
|
400 W for 90 min |
−6.8861×10⁻³ |
1.7587×10⁻² |
0.9998 |
1.4612×10⁻⁵ |
3.1211×10⁻³ |
|||
600 W for 30 min |
2.7205×10⁻² |
1.6665×10⁻³ |
1.0000 |
4.8931×10⁻²⁰ |
1.2771×10⁻¹⁰ |
|||
Second stage |
200 W (120 min) |
40 |
−6.5594×10⁻³ |
1.7298×10⁻² |
0.9808 |
2.2014×10⁻³ |
4.1379×10⁻² |
|
50 |
−9.2459×10⁻³ |
2.4377×10⁻² |
0.9911 |
1.1504×10⁻³ |
2.8665×10⁻² |
|||
60 |
−1.2137×10⁻² |
3.2030×10⁻² |
0.9943 |
8.4359×10⁻⁴ |
2.3715×10⁻² |
|||
400 W (90 min) |
40 |
−1.1801×10⁻² |
2.9956×10⁻² |
0.9836 |
1.7601×10⁻³ |
3.5458×10⁻² |
||
50 |
−1.3908×10⁻² |
3.5179×10⁻² |
0.9879 |
1.4674×10⁻³ |
3.1277×10⁻² |
|||
60 |
−1.4812×10⁻² |
3.7479×10⁻² |
0.9993 |
1.0458×10⁻⁴ |
7.9212×10⁻³ |
|||
600 W (30 min) |
40 |
−1.0644×10⁻² |
2.7303×10⁻² |
0.9875 |
1.4324×10⁻³ |
3.1987×10⁻² |
||
50 |
3.8036×10⁻² |
-3.3105×10⁻⁴ |
0.9960 |
6.6711×10⁻⁴ |
2.0007×10⁻² |
|||
60 |
−1.7559×10⁻² |
4.6200×10⁻² |
0.9999 |
1.5205×10⁻⁵ |
2.7573×10⁻³ |
|||
Table 7 Drying constant values derived from Henderson and Pabis model.
Drying process |
Infrared power (W) |
Drying temperature (℃) |
a |
k (min–1) |
R2 |
χ2 |
RMSE |
|
Hot-Air Drying |
- |
40 |
1.0415 |
1.1965×10⁻² |
0.9915 |
1.1395×10⁻³ |
3.0193×10⁻² |
|
- |
50 |
1.0351 |
1.6191×10⁻² |
0.9871 |
1.8052×10⁻³ |
3.6796×10⁻² |
||
- |
60 |
1.0287 |
2.2088×10⁻² |
0.9924 |
1.1281×10⁻³ |
2.8387×10⁻² |
||
Two-stage drying (Infrared follow by hot-air drying) |
First stage |
200 W for 120 min |
1.0069 |
5.9042×10⁻³ |
0.9972 |
1.1140×10⁻⁴ |
8.9204×10⁻³ |
|
400 W for 90 min |
1.0173 |
1.3328×10⁻² |
0.9944 |
4.8314×10⁻⁴ |
1.7947×10⁻² |
|||
600 W for 30 min |
1.0025 |
3.0757×10⁻² |
0.9994 |
1.0875×10⁻⁴ |
6.0209×10⁻³ |
|||
Second stage |
200 W (120 min) |
40 |
0.9906 |
1.4365×10⁻² |
0.9983 |
1.9698×10⁻⁴ |
1.2378×10⁻² |
|
50 |
1.0014 |
2.0311×10⁻² |
0.9988 |
1.5996×10⁻⁴ |
1.0689×10⁻² |
|||
60 |
1.0147 |
2.7334×10⁻² |
0.9970 |
4.5094×10⁻⁴ |
1.7339×10⁻² |
|||
400 W (90 min) |
40 |
0.9767 |
2.1784×10⁻² |
0.9947 |
5.6892×10⁻⁴ |
2.0159×10⁻² |
||
50 |
0.9830 |
2.5396×10⁻² |
0.9954 |
5.6164×10⁻⁴ |
1.9350×10⁻² |
|||
60 |
1.0129 |
2.8388×10⁻² |
0.9967 |
4.8869×10⁻⁴ |
1.7123×10⁻² |
|||
600 W (30 min) |
40 |
0.9938 |
2.1388×10⁻² |
0.9976 |
2.7339×10⁻⁴ |
1.3974×10⁻² |
||
50 |
0.9890 |
3.6207×10⁻² |
0.9958 |
6.8522×10⁻⁴ |
2.0276×10⁻² |
|||
60 |
1.0177 |
3.9533×10⁻² |
0.9887 |
2.4879×10⁻³ |
3.5270×10⁻² |
|||
Drying kinetics
The quality of the dried Thai rice noodles, including color change, browning index (BI), rehydration ratio (RR), surface morphology, and texture, were investigated. The initial color values of the noodles were: L* = 75.96, a* = −1.34, b* = 2.56, and BI = 2.06.
Color characteristics of the dried Thai rice noodles
Changes in color quality during drying were assessed using the CIE parameters L*, a*, b*, and BI. In hot-air drying, the L* value decreased with increasing drying time and decreasing moisture content, while the a*, b*, and browning index values progressively increased. Drying at a constant temperature led to heat accumulation, resulting in caramelization reactions. These reactions, driven by the thermal degradation of sugars at elevated temperatures, resulted in the formation of brown pigments. As shown in Figure 5, increasing the drying temperature accelerated the process, resulting in a higher BI.
In the first stage of two-stage drying, infrared drying resulted in a reduction of the L* value as drying time increased and moisture content decreased, while the a*, b*, and BI values increased. This is attributed to the absorption of infrared radiation by the material, which caused water molecules to vibrate and generate internal heat. Infrared drying produces greater thermal energy than conventional hot-air drying. Prolonged exposure to this energy intensified browning reactions, particularly as infrared power and drying temperature increased, resulting in a higher BI value. In the second stage of the two-stage drying, hot-air drying showed that the L∗ value declined during the initial period, while the a* and b* values initially decreased and then gradually increased over time, as shown in Figure 6.
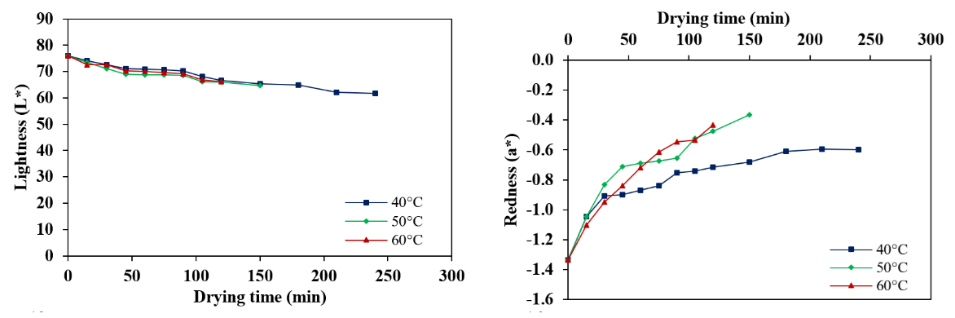
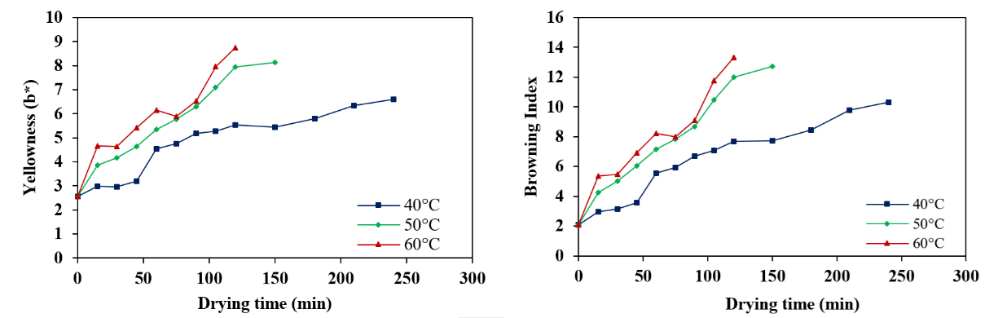
Figure 5 Color characteristics of Thai rice noodles saubjected to hot-air drying.
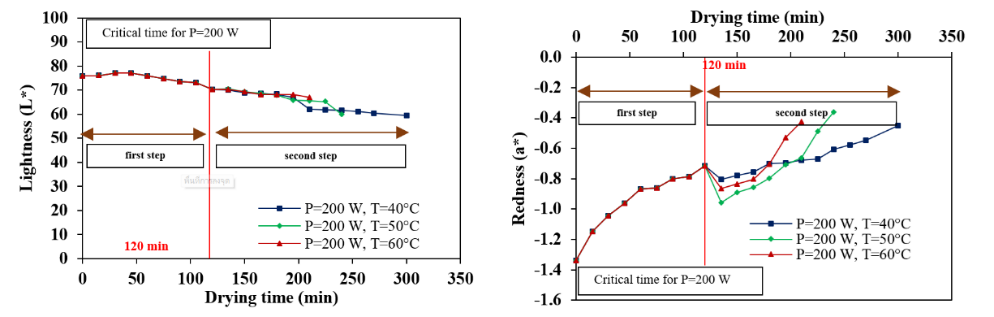
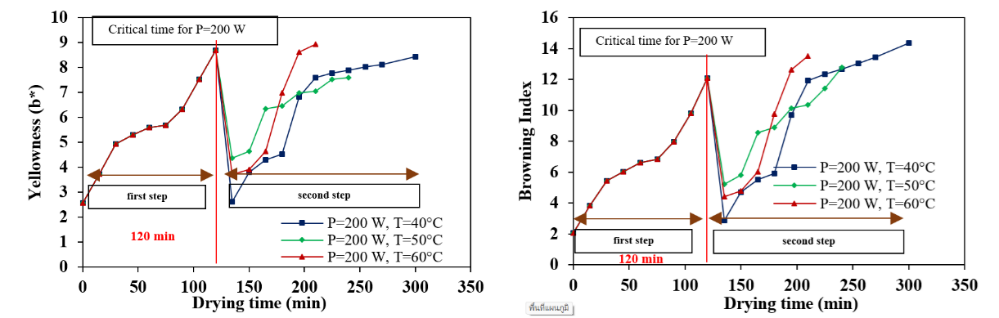
Figure 6 Color characteristics of Thai rice noodles with two-stage drying.
Two-stage drying (infrared drying followed by hot-air drying)
The dried noodles produced from both drying procedures evaluated based on L*, a*, b*, BI, RR, surface morphology, and texture. The quality was attributes were compared to those of a commercial product, which exhibited values of L* = 64.47, a* = −0.02, b* = 8.37, BI = 13.56, RR = 3.48, and hardness = 9.61 N.
The quality of noodles subjected to hot-air drying was comparable to that of commercial products. Specifically, the hot-air dried samples exhibited L*, a*, b*, BI, RR, and hardness of 61.61 to 66.16, −0.60 to −0.37, 6.59 to 8.74, 10.32 to 13.34, 3.39 to 3.85, and 8.91 to 9.42 N, respectively (Figure 7). SEM analysis revealed that drying at low temperatures produced surface morphologies similar to that of commercial samples. However, high-temperature drying increased porosity, resulting in a product with more voids capable of absorbing a large amount of water (Figure 8).
Two-stage drying yielded Thai rice noodles of comparable quality to commercial products. The samples exhibited L*, a*, b*, BI, RR, and hardnessvalues of 59.55 to 67.00, −0.72 to −0.24, 5.26 to 9.40, 8.41 to 15.47, 3.21 to 4.04, and 9.18 to 9.56 N, respectively (Figure 9). In terms of surface morphology, it was found that infrared drying, which was characterized by rapid water evaporation, resulted in the formation of numerous internal pores within the sample. This led to structural hardening and minimized the effect of shrinkage during the subsequent hot-air drying stage. As a result, the sample was very porous and capable of absorbing large amounts of water (Figures 10 and 11). Comparisons of BI and RR values indicated that infrared drying generated more heat than hot-air drying, resulting in improved quality. Furthermore, infrared drying demonstrated the ability to rapidly evaporate large amounts of moisture in a short period, which contributed to the development of excessive internal porosity.
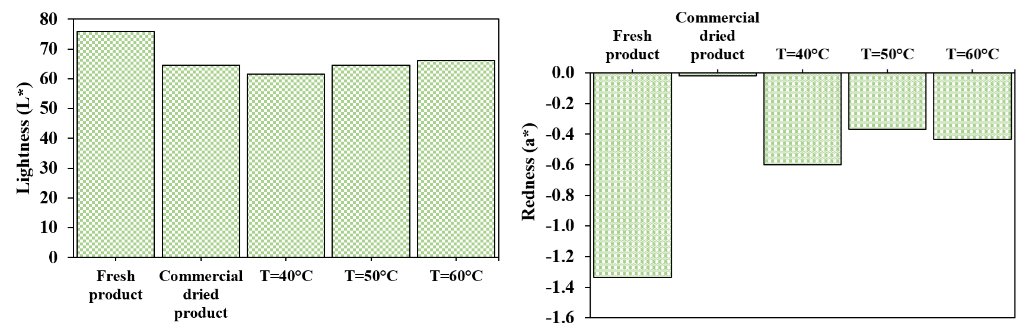
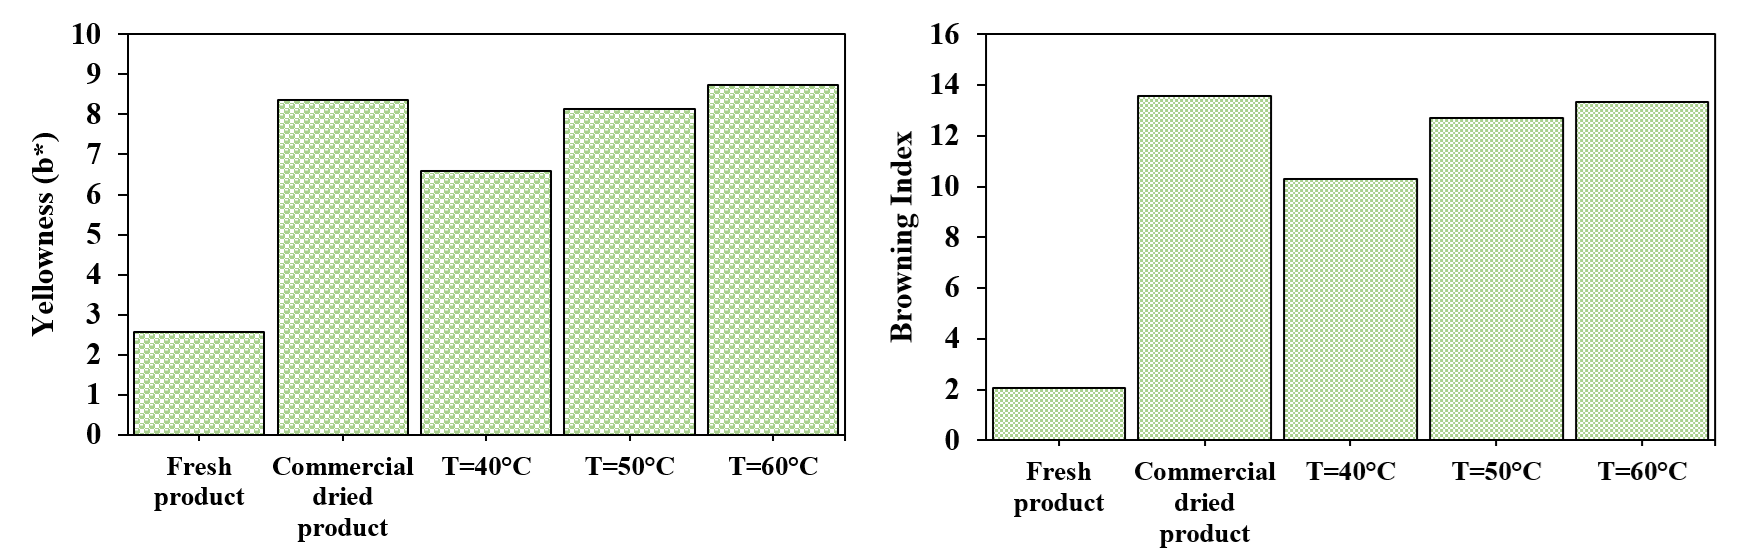
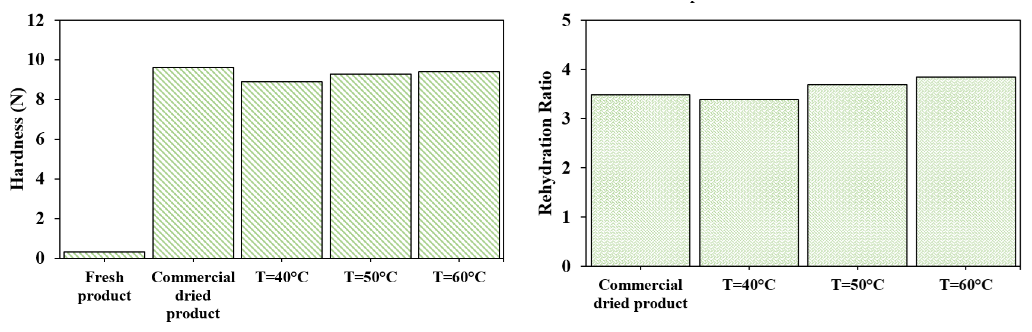
Figure 7 Qualities of the dried Thai rice noodles subjected to hot-air drying.
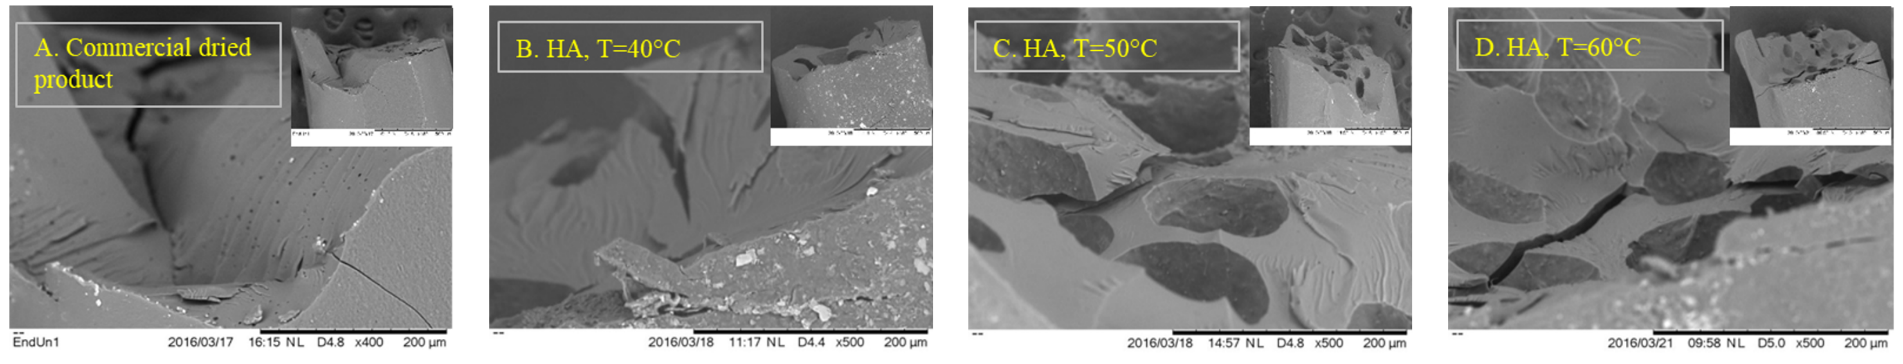
Figure 8 Surface morphology of the dried Thai rice noodles subjected to hot-air drying compared with the commercial dried product.
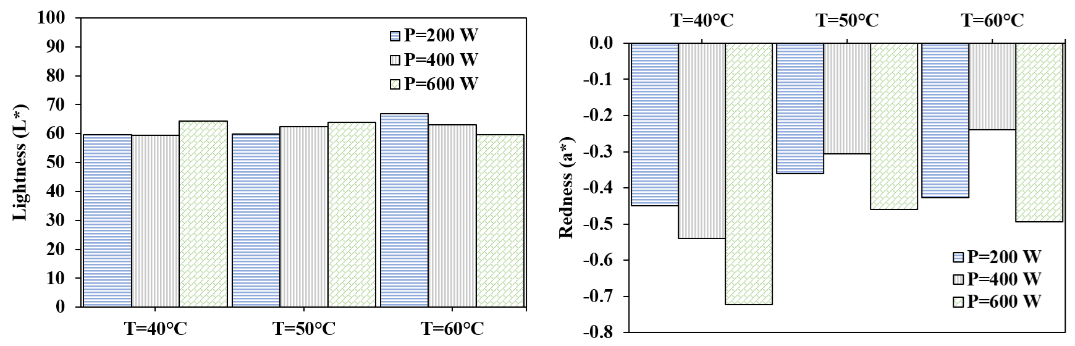
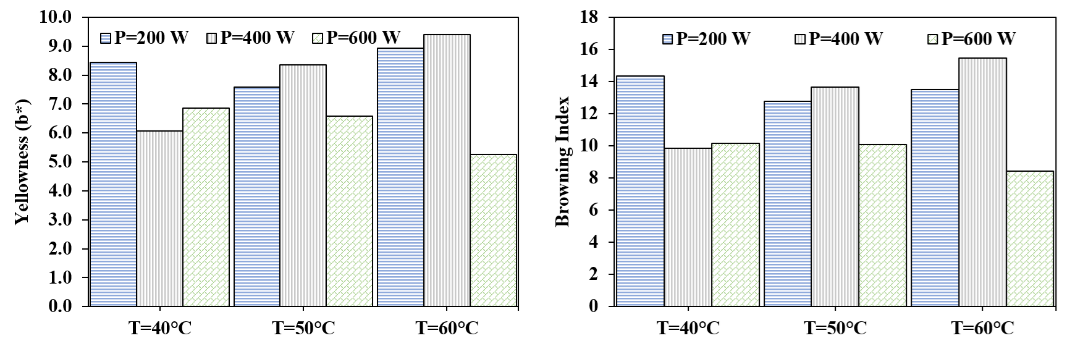
Figure 9 Color of the dried Thai rice noodles subjected to 2-stage drying.
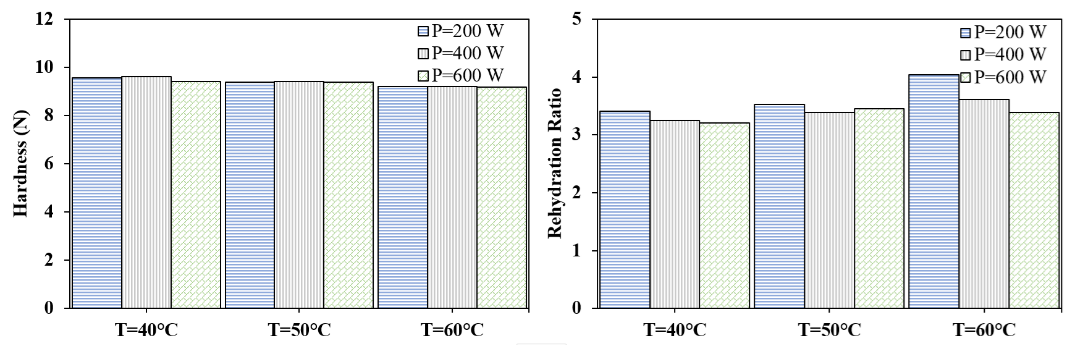
Figure 10 Hardness and rehydration ratio values of dried Thai-rice noodle subjected to 2-stage drying.
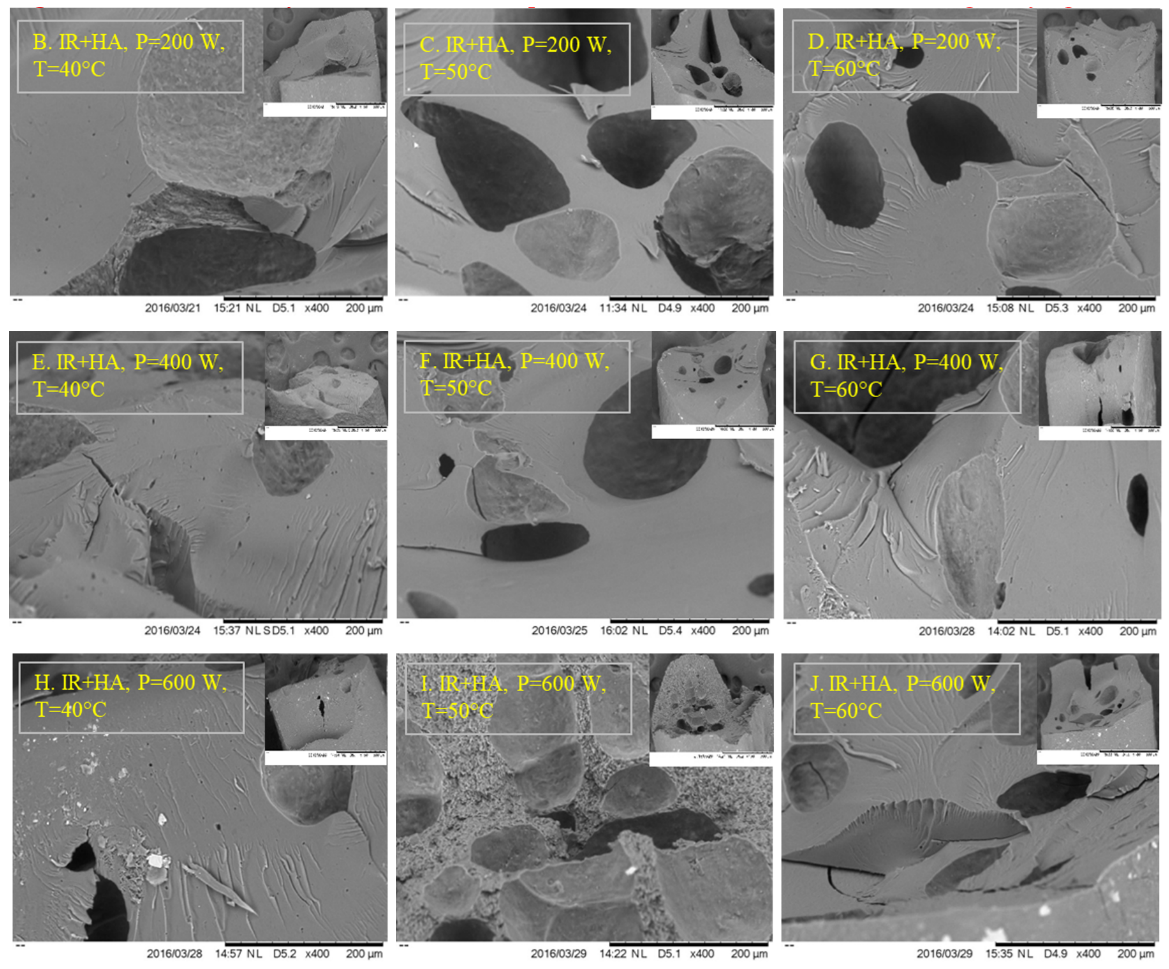
Figure 11 Surface Morphology of the dried Thai rice noodles subjected to 2-stage drying.
Conclusions
This
study aimed to investigate the thin-layer drying behavior of Thai
rice noodles, focusing on moisture reduction, color changes during
drying, and the quality of the dried product. Two drying methods
were employed: Hot-air drying (40, 50 and 60 °C), and 2-stage
drying (infrared drying at 200 W for 120 min, 400 W for 90 min, and
600 W for 30 min, followed by hot-air drying at 40, 50, and 60 °C).
The drying process effectively reduced moisture content from 303.36
± 5.43 to 13.88 ± 0.85 %d.b. In hot-air drying, the moisture
reduction followed an exponential trend, with drying rate and drying
time ranging from 0.0119 to 0.0236
and
120 to 240 min, respectively. In the 2-stage process, infrared
drying in the first stage showed a linear moisture reduction trend,
while the second-stage hot-air drying followed an exponential
pattern. The drying rate and time ranged from 0.0096 to 0.0376
and
75 to 300 min, respectively. The effective diffusion coefficients in
hot-air drying ranged from 1.3378×10⁻¹¹
to 2.5796×10⁻¹¹
m2/s,
with an Arrhenius factor of 7.5763×10⁻⁷
m2/s
and an activation energy of 28,484.60 kJ/mol. In the 2-stage drying,
the effective diffusion coefficient during infrared drying ranged
from 4.1045×10⁻¹²
to 2.6461×10⁻¹¹
m2/s,
with an Arrhenius factor of 5.5059×10⁻¹¹
m2/s
and an activation energy of 13.57 W/g. For the second-stage hot-air
drying, the effective diffusivity ranged from 1.5668×10⁻¹¹
to 4.3220×10⁻¹¹
m2/s
with the Arrhenius factor and activation energy ranging from
6.4119×10¹⁰
to 8.0141×10⁻⁷
m2/s
and 8,474.46 to 25,094.98 kJ/mol, respectively. The drying kinetics
analysis showed that Page’s model best described the moisture
behavior during hot-air drying, whereas the Singh et
al.
model was more appropriate for the 2-stage drying process. Color
changes during drying were assessed using the L*, a*, b*, and BI
values. The quality of dried Thai rice noodles included measurements
of L*, a*, b*, BI, RR, surface morphology, and hardness. In both
drying methods, increasing drying time resulted in a decrease in the
L* value and an increase in the a* and b* values, resulting in an
increase in the BI value. The overall quality of the dried Thai rice
noodles produced using both methods was comparable to that of
commercial items, although the experimental noodles exhibited a
higher RR value.
From this study, the hot-air drying took longer drying time than 2-stage drying. The quality of dried rice noodles from both in the first stage followed by hot-air drying at 60 °C was most suitable in terms of short drying time and good quality.
Acknowledgements
The Research and Development Institute of Rajamangala University of Technology Isan, Thailand, provided financial support for this effort. The researcher wished to thank the Faculty of Science and Liberal Arts for providing research facilities and equipment.
Declaration of Generative AI in Scientific Writing
The authors acknowledge utilizing generative AI tools (e.g., OpenAI’s ChatGPT) solely for language refinement and grammar correction during the preparation of this manuscript. The AI tool was not used for content creation or data interpretation. The authors assume full responsibility for all content and conclusions presented in this work.
CRediT Author Statement
Paradorn Nuthong: Conceptualization; Methodology; Supervision; Validation; Writing -Original draft preparation. Kunthikar Bunsupawong: Data curation; Formal analysis. Jittimon Wongsa: Investigation; Validation. Thanutyot Somjai: Formal analysis; Resources; Software; Validation; Visualization; Supervision; Writing - Reviewing and Editing.
References
P Muthukumar, DVN Lakshmi, P Koch, M Gupta and G Srinivasan. Effect of drying air temperature on the drying characteristics and quality aspects of black ginger. Journal of Stored Products Research 2022; 97, 101966.
T Wang, R Khir, Z Pan and Q Yuan. Simultaneous rough rice drying and rice bran stabilization using infrared radiation heating. LWT - Food Science and Technology 2017; 78, 281-288.
P Nuthong and T Somjai. Drying kinetics and quality evaluation of thai rice noodles using far-infrared radiation. Journal of Southwest Jiaotong University 2022; 57(1), 512-522.
WK Abdelbasset, SM Alrawaili, SM Elkholi, MM Eid, AA Abd-Elghany and MZ Mahmoud. The role of infrared waves in increasing the quality of food products. Food Science and Technology 2022; 42, e118421.
Q Chen, J Bi, X Wu, J Yi, L Zhou and Y Zhou. Drying kinetics and quality attributes of jujube (Zizyphus jujuba Miller) slices dried by hot-air and short- and medium-wave infrared radiation. LWT - Food Science and Technology 2015; 64, 759-766.
YX Wen, LY Chen, BS Li, Z Ruan and Q Pan. Effect of infrared radiation-hot-air (IR-HA) drying on kinetics and quality changes of star anise (Illicium verum.). Drying Technology 2020; 39(1), 90-103.
C Chen, C Venkitasamy, W Zhang, R Khir, S Upadhyaya and Z Pan. Effective moisture diffusivity and drying simulation of walnuts under hot-air. International Journal of Heat and Mass Transfer 2020; 150, 119283.
A Kumar, PKI Chakraborty and L Hangshing. Analysis of energy consumption, heat and mass transfer, drying kinetics and effective moisture diffusivity during foam-mat drying of mango in a convective hot-air dryer. Biosystems Engineering 2022; 219, 85-102.
AO Igbozulike, VIO Ndirika and KJ Simonyan. Influence of drying process variables on the effective moisture diffusivity and activation energy of African oil bean seed. Scientific African 2023; 22, e01895.
HS El-Mesery, M Qenawy, Z Hu and WG Alshaer. Evaluation of infrared drying for okra: Mathematical modelling, moisture diffusivity, energy activity and quality attributes. Case Studies in Thermal Engineering 2023; 50, 103451.
M Younis, D Abdelkarim and AZ El-Abdein. Kinetics and mathematical modeling of infrared thin-layer drying of garlic slices. Saudi Journal of Biological Sciences 2017; 25, 332-338.
SDF Mihindukulasuriya and HPW Jayasuriya. Drying of chilli in a combined infrared and hot-air rotary dryer. Journal of Food Science and Technology 2015; 52(8), 4895-4904.
DI Onwudea, N Hashima, K Abdana, R Janiusa and G Chend. The effectiveness of combined infrared and hot-air drying strategies for sweet potato. Journal of Food Engineering 2019; 241, 75-87.
Z Geng, M Torki, M Kaveh, M Beigi and X Yang. Characteristics and multi-objective optimization of carrot dehydration in a hybrid infrared /hot-air dryer. LWT-Food Science and Technology 2022; 172, 114229.
AOAC International. Official, method of analysis. 18th ed. AOAC Press, Maryland, USA, 2005.
S Sadaka. Impact of grain layer thickness on rough rice drying kinetics parameters. Case Studies in Thermal Engineering 2022; 35, 102026.
D Zhao, K An, S Ding, L Liu, Z Xu and Z Wang. Two-stage intermittent microwave coupled with hot-air drying of carrot slices: Drying kinetics and physical quality. Food and Bioprocess Technology2014; 7(8), 2308-2318.
DSA Delfiya, K Prashob, S Murali, PV Alfiya, MP Samuel and R Pandiselvam. Drying kinetics of food materials in infrared radiation drying: A review. Journal of Food Process Engineering 2021; 45(6), e13810.
W Xu, Y Pei, G Zhu, C Han, M Wu, T Wang, X Cao, Y Jiang, G Li, J Sun, J Tian, C Tang and Z Gao. Effect of far infrared and far infrared combined with hot-air drying on the drying kinetics, bioactives, aromas, physicochemical qualities of Anoectochilus roxburghii (Wall.) Lindl. LWT - Food Science and Technology 2022; 162, 113452.
Y Zhang, G Zhu, X Li, Y Zhao, D Lei, G Ding, K Ambrose and Y Liu. Combined medium- and short-wave infrared and hot-air impingement drying of sponge gourd (Luffa cylindrical) slices. Journal of Food Engineering 2020; 284, 110043.
DK Rabha, P Muthukumar and C Somayaji. Experimental investigation of thin layer drying kinetics of ghost chilli pepper (Capsicum Chinense Jacq.) dried in a forced convection solar tunnel dryer. Renewable Energy 2017; 105, 583-589.
J Wang, C Law, PK Nema, J Zhao, Z Liu, L Deng, Z Gao and H Xiao. Pulsed vacuum drying enhances drying kinetics and quality of lemon slices. Journal of Food Engineering 2018; 224, 129-138.
JVB de Souza, H Perazzini, RAB Lima-Correa and LDMS Borel. Combined infrared-convective drying of banana: Energy and quality considerations. Thermal Science and Engineering Progress 2024; 48, 102393.