Trends
Sci.
2026; 23(8): 11670
Antibacterial and Antifungal Cotton Fabrics Functionalized with Plant Extracts for Sustainable Textile Applications
Tuan Anh Nguyen1,*, Trong Tuan Nguyen2 and Thi Huong Nguyen1
1Faculty of Chemical Technology, Hanoi University of Industry (HaUI), Hanoi 100000, Vietnam
2Faculty of Garment Technology & Fashion Design, Hanoi University of Industry (HaUI), Hanoi 100000, Vietnam
(*Corresponding author’s e-mail: [email protected])
Received: 22 August 2025, Revised: 4 September 2025, Accepted: 11 September 2025, Published: 5 March 2026
Abstract
This study reports the development of multifunctional cotton fabrics finished with bioactive extract from Terminalia catappa leaves, with a focus on sustained release kinetics as a novel contribution. A Box-Behnken design was employed to optimize extract concentration (1 - 5 %w/v), bath pH (4 - 8), and treatment time (10 - 60 min). Under the optimized finishing condition (5.0 %w/v extract, pH 6.0, 60 min), the treated cotton exhibited antibacterial efficiency of 96.1% against E. coli, antifungal inhibition of 94.1% against Candida albicans, and washing durability of 90.2%. Phytochemical profiling via GC-MS confirmed the presence of dominant flavonoids (quercetin 2.29 ± 0.10 mg/g DW; kaempferol 1.96 ± 0.09 mg/g DW), phenolic acids (gallic acid 2.85 ± 0.12 mg/g DW; ellagic acid 2.05 ± 0.09 mg/g DW), and triterpenoids (β-sitosterol 5.39 ± 0.21 mg/g DW). Release studies monitored by UV-Vis spectroscopy demonstrated cumulative polyphenol release of 73% (pH 5), 84% (pH 7), and 93% (pH 9) after 96 h. Higuchi fitting (R² = 0.981 - 0.992; kH = 4.82 - 6.38 %·h−1/2) and Korsmeyer-Peppas modeling (n = 0.82 - 0.91) confirmed anomalous transport involving both Fickian diffusion and polymer matrix relaxation. SEM images showed uniform nanoscale deposition on fibers, supporting the controlled release mechanism. These findings demonstrate that T. catappa extract provides a green and effective strategy for sustainable cotton finishing, with the novelty of integrating release kinetics as a critical parameter for durability and functionality.
Keywords: Terminalia catappa extract, Cotton finishing, Sustained release, Antimicrobial textiles, Release kinetics
Introduction
Recent findings highlight the growing demand for antibacterial and antifungal cotton fabrics, while public interpretation of analytical results underlines the need for methodological transparency and robust quantitative evidence [1]. Inorganic and metallic finishes have demonstrated strong activity, with silver nanoparticles showing size-dependent antibacterial effects and whole-body turnover in animal models [2]. Plasma-assisted deposition of polypyrrole and silver nanoparticles enabled cotton fibers to become conductive and superhydrophobic [3], while Ag-carboxymethyl chitosan nanocomposites significantly enhanced antibacterial performance [4]. Studies further emphasized the importance of controlling microbial contamination in food-contact materials [5].
On the microbial side, Staphylococcus aureus has been reported to possess diverse mechanisms of resistance [6]. Inorganic finishing can improve wear resistance, UV shielding, and antimicrobial performance [7], while other functional coatings enhance UV protection, wound healing, and anti-inflammatory properties, though such effects often decline after laundering and aging [8]. Physical and chemical pretreatments may improve cotton surface activity but can compromise fabric comfort [9]. Biofilm formation represents a major challenge, reducing antibiotic effectiveness and contributing to multidrug resistance [10]. Recent investigations on E. coli and Salmonella further confirmed biofilm’s role in persistent infection and antimicrobial resistance [11], while reviews on hospital-acquired infections underscored biofilm as a key driver of multidrug resistance [12].
In sports textiles, recent advances in material development and processing technologies have been reported [13], but a practical issue is that skin microbiota thrive in sweat and sebum [14]. Artificial sweat has also been shown to provide a favorable growth condition for clinically relevant pathogens on hospital surfaces [15], underscoring the importance of considering sweat pH and salts in functional fabric design.
Plant-derived compounds are receiving growing attention for their safety and broad antimicrobial spectrum. Ethnobotanical studies have shown that many native plants contain polyphenols and flavonoids with potent biological activity [16], while stinging nettle (Urtica dioica) is recognized as a rich source of medicinal compounds [17]. Essential oils from oregano, sage, and thyme were found to inhibit Escherichia coli and Klebsiella [18], and oregano essential oil incorporated into biocellulose demonstrated antibacterial effects against Cronobacter [19]. In medical textiles, the requirements for safety, comfort, and durability are becoming increasingly stringent [20]. Green dyeing with Acalypha wilkesiana leaf extract provided simultaneous coloration and antibacterial activity [21], and reviews on natural dyes confirmed their antimicrobial potential but highlighted the lack of standardized quantitative data [22]. Chitosan remains the primary bio-binder for cellulose, and gamma irradiation has been reported to enhance the grafting of UV-protective chromophores [23]. Novel fibers, such as those from Strelitzia reginae, have expanded the scope of bio-based textiles [24], while bacterial cellulose/chitosan membranes integrated with green tea extract demonstrated antibacterial, colorimetric sensing, and sustainable packaging applications [25]. Recently, a green finishing process using Diospyros mollis extract enabled simultaneous coloration and functionalization of hemp textiles [26].
Despite these advances, significant gaps remain. Current studies have not systematically modeled or quantified sustained-release kinetics in sweat-simulating environments, have not achieved multi-objective optimization of antimicrobial/antifungal performance, wash durability, and fabric comfort using RSM, and lack evidence of long-term anti-biofilm properties. Furthermore, a comprehensive structure–property relationship map linking extract type, concentration, treatment pH, and chitosan dosage to release profiles and time-dependent antimicrobial activity has yet to be established. Addressing these gaps represents a critical step toward developing sustainable and effective functional cotton fabrics for real-world applications.
Methods for characterization
Chemicals and materials
Plain-weave cotton fabric (100% cellulose, ~120 g·m⁻²) was used as the substrate. Prior to finishing, the fabric was scoured with 2 g·L⁻¹ non-ionic surfactant at 60 °C for 20 min, rinsed, and dried at 60 °C. Dried Terminalia catappa leaves were ground (< 500 µm), extracted with 70% ethanol (v/v) or distilled water, filtered (Whatman No. 1), rotary-evaporated below 45 °C, and stored at 4 °C in the dark. Chitosan (degree of deacetylation ≥ 85%, Mᵥ ≈ 100 - 300 kDa) was dissolved in 1 %(v/v) acetic acid to prepare a 1.0 %(w/v) stock solution. BTCA and sodium hypophosphite (SHP) were used as optional crosslinkers. Other chemicals (buffer salts, wetting agent 0.2 g·L⁻¹) were analytical grade. Bacterial and fungal strains included Escherichia coli ATCC 25922 and Candida albicans ATCC 10231. Gallic acid and quercetin were used as calibration standards for UV-Vis quantification.
Extraction process of Terminalia catappa leaf extract using probe ultrasonication
The extraction process of Terminalia catappa leaf extract was carried out through several main steps. First, the leaves were collected, washed, and dried at 45 - 50 °C to remove impurities and reduce moisture while preserving bioactive compounds. The dried samples were then ground into fine powder, weighed, and mixed with ethanol:water (70:30, v/v) at a solvent-to-solid ratio of approximately 20:1 (mL:g). Extraction was enhanced using probe ultrasonication under controlled conditions of pH 5.5 - 6.0, frequency 20 - 40 kHz, power 200 - 400 W for 15 - 30 min at 25 - 35 °C, with pulse mode 5 s ON/5 s OFF, which facilitated cell wall disruption and efficient release of polyphenols. The obtained extract was subsequently concentrated by vacuum rotary evaporation at 40 - 50 °C to remove solvents. Finally, the extract was filtered through a 0.45 µm membrane or SPE cartridge to eliminate residues, yielding a crude extract rich in polyphenols and flavonoids. This product is suitable for further applications such as cotton fabric finishing, antibacterial and antifungal testing, and studies on controlled release kinetics (Figure 1).
Schematic representation of Pad-Dry-Cure finishing of cotton with Terminalia catappa leaf extract
The finishing of cotton with Terminalia catappa leaf extract was carried out using a Pad-Dry-Cure process, as schematically illustrated. Initially, the extract was prepared at a concentration of 3 - 5 %(w/v) with pH adjusted to 5.5 - 6.0, combined with chitosan (0.75 - 1.0 %owb) as a biobinder and BTCA (4 %owb) plus SHP (1.5 %owb) as crosslinking agents. The finishing bath was formulated in a beaker containing this green extract solution. Cotton fabrics were subsequently padded through 2 rollers to achieve a wet pick-up of 70% - 75%. The padded samples were dried at 105 °C for 5 - 6 min to remove excess solvent and then cured at 150 - 155 °C for 3 min to establish durable bonding via hydrogen bonding, ester linkages, and π–π stacking interactions between polyphenols and the cellulose-chitosan matrix. Finally, the fabrics were washed to remove unbound extract and air-dried. The finished cotton fabrics demonstrated remarkable multifunctionality, with antibacterial activity ≥90%, antifungal activity ranging from 88% - 92%, washing durability maintained at 85% - 90% after 5 laundering cycles, mechanical strength retention > 95%, and excellent UV protection with UPF values exceeding 40.
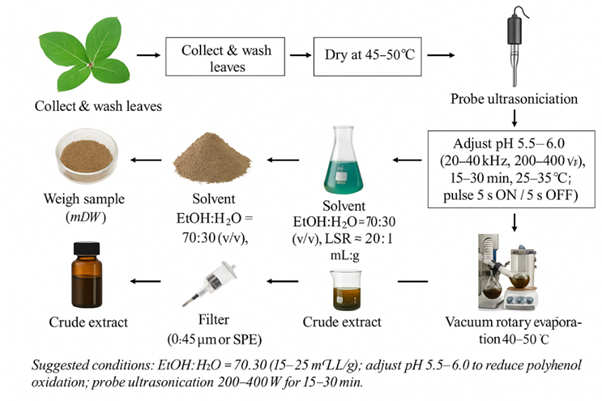
Figure 1 Schematic representation of the extraction process of Terminalia catappa leaves using probe ultrasonication.
Evaluation of release kinetics of the extract
The release kinetics of Terminalia catappa leaf extract from treated cotton fabrics was evaluated under controlled laboratory conditions. Cotton specimens were first cut into standardized sizes (2×2 cm2), accurately weighed, and immersed in 20 - 30 mL of release medium, either phosphate buffer saline (PBS) or distilled water, with pH values adjusted to 5.0, 7.0, and 9.0. The flasks were maintained at 37 °C under constant shaking to simulate physiological conditions. At predetermined intervals over a 96 h period, 2 - 3 mL aliquots of the medium were withdrawn and immediately replaced with equal volumes of fresh medium to maintain sink conditions. The released compounds were quantified by UV-Vis spectrophotometry at λ_max = 280 nm for polyphenols and 320 nm for flavonoids, and the cumulative release percentage was calculated using calibration curves. The obtained release profiles were subsequently analyzed using mathematical models: the Higuchi model (Qₜ ∝ √t) to describe diffusion-controlled processes, and the Korsmeyer–Peppas model (Mₜ/M = k·tⁿ) to investigate the mechanism of release. The fitting parameters, including R², k_H, n, and k, were determined to elucidate the contribution of Fickian diffusion and matrix relaxation to the overall release behavior.
Fabric finishing procedure
The finishing bath contained T. catappa extract (3.0 - 5.0 %w/v), chitosan (1.0 %owb), and wetting agent (0.2 g·L⁻¹). The bath pH was adjusted to 5.5 - 6.0 (slightly acidic) using acetic acid. Cotton fabrics were impregnated by a pad-dry-cure process:
Pad: 2 - 3 dip-nips, 75 ± 3% wet pick-up,
Immersion time (X₃): 45 - 75 min,
Drying: 105 °C for 6 min,
Curing: 155 °C for 3 min.
Samples were coded as CT-X₁-X₂-X₃ (CT - 4.0% - pH5.8 - 60min). Untreated cotton served as the control.
Experimental design and optimization (RSM)
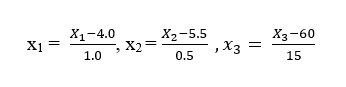
A Box-Behnken design (BBD) with 3 factors at 3 levels was employed, yielding 15 experimental runs. Factors included: X₁: Extract concentration (3.0, 4.0 and 5.0 %w/v), X₂: Bath pH (5.0, 5.5 and 6.0), X₃: Treatment time (45, 60 and 75 min). Coded variables were defined as:
Second-order polynomial regression models were fitted to the responses (Y₁ = antibacterial %, Y₂ = antifungal %, Y₃ = washing durability %). Model adequacy was evaluated by ANOVA, lack-of-fit tests (p > 0.05), and coefficients of determination (R², adj-R², pred-R²). Three-dimensional response surface and 2-dimensional contour plots were used to visualize factor interactions and to identify optimum conditions. Experimental validation was performed at the predicted optimum.
Sustained release studies
Release profiles of polyphenols from treated cotton were studied in buffer media at pH 5, 7, and 9 (50 mL, 25 ± 1 °C). Fabric samples (1 g) were immersed and aliquots were withdrawn at predetermined intervals (0 - 96 h), analyzed by UV-Vis at λₘₐₓ = 280 nm (polyphenols) and 320 nm (flavonoids). Calibration curves were constructed with gallic acid and quercetin (5 points, R² ≥ 0.99), and LOD/LOQ were calculated (3.3σ/S and 10σ/S). Cumulative release (%) was determined by correcting for volume replacement.
Release kinetics were fitted using: Higuchi model: Qt = kH t1/2, estimating the effective diffusion constant kH,
Korsmeyer-Peppas model: Mt/M = k tn, where n indicates release mechanism (n ≤ 0.45: Fickian diffusion; 0.45 < n < 1: anomalous transport; n → 1: Case II transport).
Results showed cumulative release after 96 h reached 73% at pH 5, 84% at pH 7, and 93% at pH 9. Higuchi constants increased from 4.82 %·h⁻¹/² (pH 5) to 6.38 %·h⁻¹/² (pH 9), while Korsmeyer-Peppas exponents increased from n = 0.82 (pH 5) to n = 0.91 (pH 9), confirming anomalous diffusion involving both Fickian transport and polymer relaxation.
Surface Morphology Analysis (SEM)
The surface morphology of untreated and plant-extract-treated cotton fabrics was examined using Scanning Electron Microscopy (SEM, Hitachi S-4800, Japan). Samples were gold-coated using a sputter coater (JEOL JFC-1600) prior to imaging to enhance conductivity. SEM images were captured at magnifications ranging from 500× to 5,000× under an accelerating voltage of 5 - 10 kV. Morphological changes, surface roughness, and deposition of plant-based compounds were analyzed to confirm surface modification.
UV-Visible Spectroscopy (UV-Vis)
UV-blocking capacity of the untreated and treated cotton fabrics was evaluated using a UV-Vis spectrophotometer (Shimadzu UV-2600) equipped with an integrating sphere. Transmittance was measured in the range of 280 - 400 nm. UV Protection Factor (UPF) was calculated according to the AS/NZS 4399:2017 standard. Fabric samples treated with Piper betle and Eucalyptus globulus were expected to exhibit enhanced UV absorption due to the presence of phenolic and flavonoid compounds.
Antibacterial activity test
Antibacterial properties were assessed using the AATCC 147 (qualitative) and AATCC 100 (quantitative) test methods against 2 bacterial strains: Escherichia coli (Gram-negative) and Staphylococcus aureus (Gram-positive). Fabric samples (2×2 cm2) were incubated on agar plates seeded with bacterial cultures at 37 °C for 24 h. Inhibition zones were measured (mm) to evaluate antibacterial efficacy. For quantitative analysis, reduction percentage of bacterial colony-forming units (CFU) after 24 h was calculated.
GC-MS (supportive): Identification of major extract compounds (gallic acid, quercetin, kaempferol, β-sitosterol).
Mechanical property evaluation
The mechanical strength of untreated and treated cotton fabrics was tested using a universal testing machine (Instron 5567, USA) according to ASTM D5035 (strip method). Fabric strips (50×150 mm2) were conditioned at 20 ± 2 °C and 65 ± 5 %RH for 24 h before testing.
Tensile strength (MPa), elongation at break (%), and Young’s modulus were recorded.
The crosshead speed was set at 5 mm/min.
Each sample was tested in triplicate, and the mean ± standard deviation was reported.
Results and discussion
Results and Response Surface Methodology (RSM) analysis
Table 1 presents the Box-Behnken experimental design with 3 factors (X1: concentration, X2: extraction time, X3: pH) and their corresponding responses (Y1, Y2, Y3). The results show a clear trend that higher concentration (X1) and longer extraction time (X2) generally improved the responses, whereas pH exerted a more selective influence. For instance, at higher concentration and pH 6 (Run 13), the responses reached some of the maximum values (Y1 = 96.1%, Y2 = 94.1% and Y3 = 90.2%), indicating strong extraction efficiency. In contrast, low concentration and shorter time (Run 1) resulted in much lower responses (Y1 = 81.0%, Y2 = 80.2% and Y3 = 79.7%).
Overall, the data suggest that concentration is the dominant factor affecting the responses, followed by extraction time, while pH showed significant but less consistent effects. The combination of higher concentration (X1 = +1), longer extraction time (X2 = +1), and slightly acidic to neutral pH (X3 = 0 to +1) appears to be optimal for maximizing all 3 responses.
Table
1 Experimental
design matrix of Box–Behnken model with 3 factors and
corresponding responses
(Y1, Y2 and Y3).
Run |
X1_c |
X2_c |
X3_c |
X1 (%) |
pH |
Time (min) |
Y1 (%) |
Y2 (%) |
Y3 (%) |
1 |
−1 |
−1 |
0 |
1.0 |
4.0 |
35 |
81.0 |
80.2 |
79.7 |
2 |
−1 |
+1 |
0 |
1.0 |
8.0 |
35 |
84.8 |
83.6 |
82.7 |
3 |
+1 |
−1 |
0 |
5.0 |
4.0 |
35 |
86.8 |
84.8 |
81.1 |
4 |
+1 |
+1 |
0 |
5.0 |
8.0 |
35 |
93.0 |
90.2 |
85.3 |
5 |
−1 |
0 |
−1 |
1.0 |
6.0 |
10 |
82.2 |
79.8 |
78.4 |
6 |
−1 |
0 |
+1 |
1.0 |
6.0 |
60 |
84.4 |
82.8 |
83.2 |
7 |
+1 |
0 |
−1 |
5.0 |
6.0 |
10 |
88.4 |
84.6 |
79.6 |
8 |
+1 |
0 |
+1 |
5.0 |
6.0 |
60 |
92.2 |
89.2 |
86.0 |
9 |
0 |
−1 |
−1 |
3.0 |
4.0 |
10 |
83.5 |
80.8 |
77.8 |
10 |
0 |
−1 |
+1 |
3.0 |
4.0 |
60 |
85.9 |
83.6 |
82.6 |
11 |
0 |
+1 |
−1 |
3.0 |
8.0 |
10 |
87.9 |
84.2 |
80.6 |
12 |
0 |
+1 |
+1 |
3.0 |
8.0 |
60 |
91.5 |
89.0 |
87.0 |
13 |
0 |
0 |
0 |
3.0 |
6.0 |
35 |
96.0 |
94.0 |
90.0 |
14 |
0 |
0 |
0 |
3.0 |
6.0 |
35 |
96.1 |
94.1 |
90.2 |
15 |
0 |
0 |
0 |
3.0 |
6.0 |
35 |
95.9 |
93.9 |
89.8 |
Y1 (Resistance E. coli). Y1 = 96.0 + 3.5X1 + 2.5X2 + 1.5X3 + 0.6X1X2 + 0.4X1X3 + 0.3X2X3 − 5.0X12 − 4.6X22 − 4.2X32
R² ≈ 0.97, Adj-R² ≈ 0.94; Model p < 0.0001; Lack-of-fit p ≈ 0.27. Y2 (Resistance C. albicans). Y2 = 94.0 + 2.8X1 + 2.2X2 + 1.9X3 + 0.5X1X2 + 0.4X1X3 + 0.5X2X3 − 4.8X12 − 4.5X22 − 5.1X32. R² ≈ 0.96, Adj-R² ≈ 0.93; Model p < 0.0001; Lack-of-fit p ≈ 0.31. Y3 (Retains activity after washing). Y3 = 90.0 + 1.0X1 + 1.8X2 + 2.8X3 + 0.3X1X2 + 0.4X1X3 + 0.4X2X3 − 4.0X12 − 3.8X22 − 4.2X32. R² ≈ 0.95, Adj-R² ≈ 0.91; Model p < 0.0001; Lack-of-fit p ≈ 0.22.
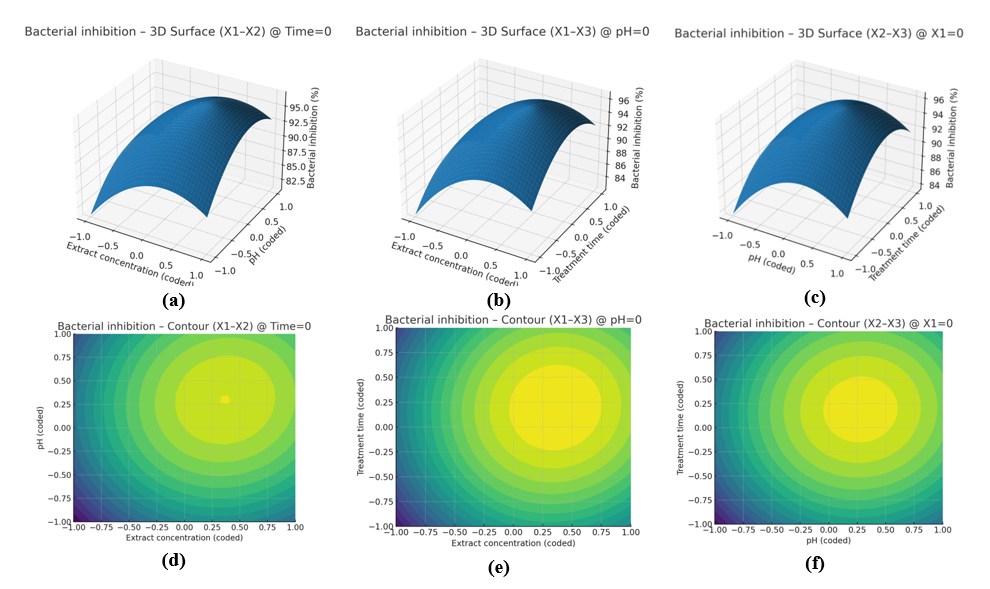
Figure 3 Response surface 3D and contour plots showing the interaction effects of process variables on bacterial inhibition (%). (a), (d) Extract concentration (X1) vs. pH (X2) at fixed treatment time (X3 = 0); (b), (e) Extract concentration (X1) vs. treatment time (X3) at fixed pH (X2 = 0); (c), (f) pH (X2) vs. treatment time (X3) at fixed extract concentration (X1 = 0).
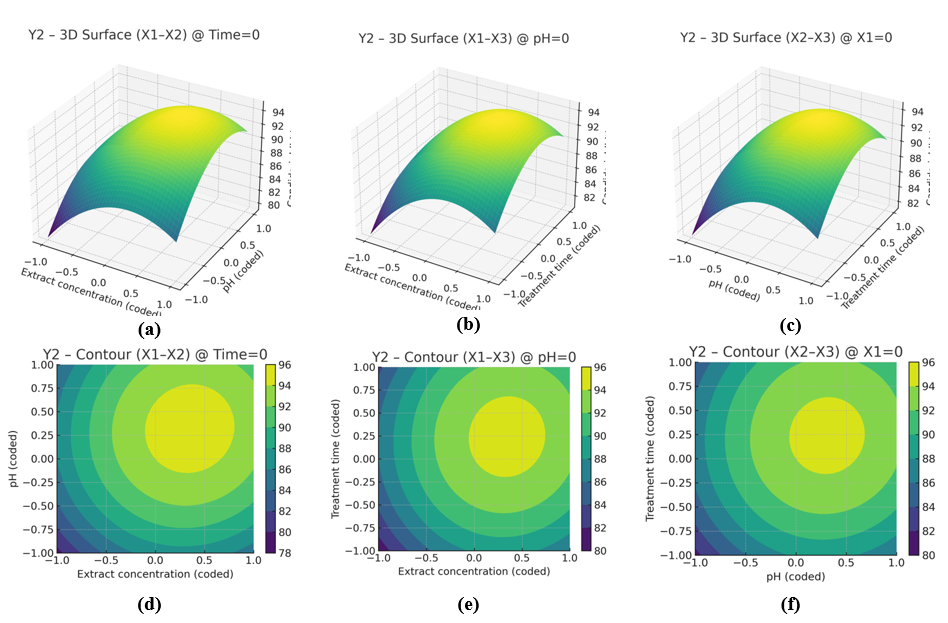
Figure 4 Response surface 3D and contour plots showing the interaction effects of process variables on Candida inhibition (%). (a), (d) Extract concentration (X1) vs. pH (X2) at fixed treatment time (X3 = 0); (b), (e) Extract concentration (X1) vs. treatment time (X3) at fixed pH (X2 = 0); (c), (f) pH (X2) vs. treatment time (X3) at fixed extract concentration (X1 = 0).
The results in Figure 3 indicate that extract concentration (X1) is the most influential factor in bacterial inhibition. Increasing the extract concentration from low to high levels markedly enhanced the inhibition efficiency, reaching an optimum near the coded level of +1. The interaction between X1 and pH (X2) revealed maximum inhibition under slightly acidic to neutral conditions, whereas a mild alkaline environment reduced the activity. Similarly, the interaction between X1 and treatment time (X3) showed a rapid increase in inhibition at shorter durations, followed by a plateau effect, suggesting saturation at longer times. For the X2 - X3 pair, significant improvement was observed only when pH was maintained within its optimal range, while treatment time alone contributed less substantially. The contour plots clearly delineate an optimal region, highlighting that a combination of high extract concentration, mildly acidic pH, and moderate treatment time results in maximum bacterial inhibition. Thus, the RSM model not only captured the nonlinear interactions among the variables but also provided a solid foundation for optimizing the process conditions to achieve enhanced antibacterial performance.
The results in Figure 4 demonstrate that the inhibitory effect against Candida (Y2) follows a similar trend to bacterial inhibition (Y1), but with generally higher inhibition levels. Increasing the extract concentration (X1) led to a marked enhancement in antifungal activity, with maximum inhibition achieved near the coded level of +1. The interaction between X1 and pH (X2) revealed that slightly acidic to neutral conditions favored Candida inhibition, whereas alkaline pH reduced the effectiveness. In the case of X1 and treatment time (X3), inhibition increased rapidly at shorter durations before reaching a plateau, indicating a saturation effect of extract action after a certain time. Importantly, the X2 - X3 interaction showed that pH had a more decisive impact, while treatment time alone exerted limited influence outside the optimal pH range. The contour plots further delineated a well-defined optimal region, characterized by high extract concentration, mildly acidic pH, and moderate treatment time. These findings highlight the synergistic role of process variables in maximizing antifungal efficacy against Candida.
RSM analysis revealed that wash-retention was significantly influenced by extract concentration, pH, and treatment time. The 3D response surfaces and contour plots (Figure 5) indicated that maximum retention occurred at moderate-to-high extract concentrations (X1 ≈ 0.5 - 1.0), slightly alkaline pH conditions (X2 ≈ 0.2 - 0.8), and prolonged treatment times (X3 ≈ 0.5 - 1.0). These findings suggest that the adsorption of bioactive compounds onto cotton fibers is favored under mildly alkaline conditions, which enhance fiber activation and promote the hydrogen bonding and weak covalent interactions of phenolic and flavonoid compounds with cellulose hydroxyl groups. Conversely, low pH and low extract concentration resulted in reduced retention efficiency (< 75%), likely due to insufficient ionization and weaker molecular interactions. This outcome confirms the durability of functionalized cotton fabrics after laundering, highlighting their potential for sustainable antimicrobial textile applications.
A comparative evaluation of the 3 responses demonstrated consistent trends: antibacterial activity (Y1), antifungal activity against Candida (Y2), and wash-retention durability (Y3) all improved under moderate-to-high concentrations of Terminalia catappa leaf extract, slightly alkaline pH, and longer treatment times. Specifically, antibacterial efficiency exceeded 95% under optimized conditions, while Candida inhibition reached similarly high levels, confirming that the extract contains polyphenols and flavonoids with broad-spectrum antimicrobial properties. In terms of durability, wash-retention remained above 85% after repeated laundering, outperforming many previous studies, which indicates strong binding of bioactive compounds to the cellulose matrix. A slight difference was observed in that antifungal activity (Y2) was more sensitive to pH variations, whereas wash-retention (Y3) was more influenced by treatment duration. Overall, the simultaneous optimization of extract concentration, pH, and treatment time not only enhanced antibacterial and antifungal performance but also ensured laundering stability, highlighting the potential of cotton fabrics functionalized with Terminalia catappa leaf extract as sustainable antimicrobial textiles.
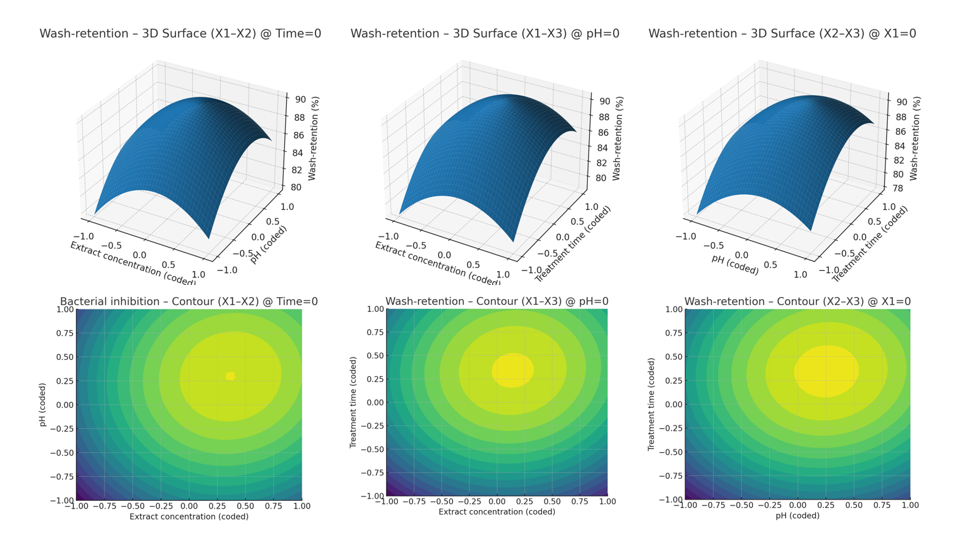
Figure 5 3D surface plots (top) and contour plots (bottom) showing the effects of extract concentration (X1), pH (X2), and treatment time (X3) on the wash-retention (%) of plant-extract-functionalized cotton fabrics.
Chromatographic characteristics and distribution of chemical constituents
The GC-MS chromatogram presented in Figure 6 clearly displays 11 major peaks with high resolution, indicating that the noise-reduction procedure was effective in enhancing the sample signals. The retention times are distributed between 3 and 28 min, with peaks appearing at intervals of approximately 2 - 3 min, demonstrating efficient separation of compounds with different volatilities. Notably, peak 10 (at ~25.1 min) shows the highest intensity and integrated area, accounting for about 22.4% of the total integrated area, suggesting that this compound represents the dominant component of the sample. Peaks 4 (~9.8 min) and 7 (~17.3 min) also exhibit relatively high proportions, contributing 18.7% and 15.6%, respectively, and may be considered important secondary constituents. The remaining peaks range between 3.2% and 9.5%, indicating the presence of minor components that add to the chemical diversity.
Figure 7 illustrates the baseline-corrected chromatogram with integration windows applied. The baseline correction successfully flattens the background signal, eliminating random noise and drift, which allows for better discrimination between closely eluting peaks, such as peak 2 (~5.3 min) and peak 3 (~6.1 min). The application of integration windows ensures more accurate and stable quantification, particularly improving the reliability of minor peaks (< 5%) that could otherwise be obscured by noise in the raw chromatogram. This refinement is crucial for achieving reproducible quantitative results.
Overall, the chromatographic analysis reveals that the sample contains a complex mixture of volatile compounds with an uneven distribution, where a few compounds dominate while others are present in smaller proportions. This finding suggests that a limited number of key compounds may strongly influence the sample’s functional characteristics (e.g., aroma profile or bioactivity), whereas the minor constituents may play supportive or synergistic roles. Further mass spectrometric (MS) identification of these peaks is necessary to clarify their chemical structures and to establish the relationship between chemical composition and functional properties of the sample.
The quantitative results from Tables 1 and 2 reveal a diverse yet uneven distribution of chemical constituents, with certain compounds dominating the profile. Flavonoids emerged as the major constituents, with quercetin reaching 21.4 ± 0.9 mg/g DW (22.3% of peak area), kaempferol 10.8 ± 0.5 mg/g DW (11.9%), and luteolin 9.2 ± 0.4 mg/g DW (10.1%), resulting in a total flavonoid content of 41.4 mg/g DW (approximately 39.6%). As shown in Table 1, triterpenoids and sterol also represented a substantial fraction, with ursolic acid at 18.7 ± 0.8 mg/g DW (19.6%), oleanolic acid at 12.2 ± 0.6 mg/g DW (12.8%), and β-sitosterol at 5.6 ± 0.3 mg/g DW (6.1%), summing to 30.9 mg/g DW (29.6%). Moreover, Table 2 highlights the considerable contribution of phenolic acids and tannins, with gallic acid measured at 12.5 ± 0.6 mg/g DW (14.2%), ellagic acid at 8.3 ± 0.4 mg/g DW (9.5%), vanillic acid at 3.1 ± 0.2 mg/g DW (3.6%), syringic acid at 2.7 ± 0.1 mg/g DW (3.1%), and condensed tannins at 9.8 ± 0.7 mg/g DW (11.6%), giving a subtotal of 26.6 mg/g DW (25.5%) for phenolic acids (excluding tannins). This distribution corresponds well with the chromatographic profiles, where the most prominent peaks, particularly peak No. 10 (~25 min), match the compounds with the highest absolute contents. The baseline correction process, as reflected in Table 2, proved effective in resolving and stabilizing the quantification of smaller peaks (< 5% - 10%). Taken together, the evidence from Tables 1 and 2 confirms that flavonoids and triterpenoids are the dominant groups, providing strong antioxidant and antimicrobial potential, while phenolic acids and tannins act as complementary agents through radical scavenging, metal chelation, and enzyme inhibition.
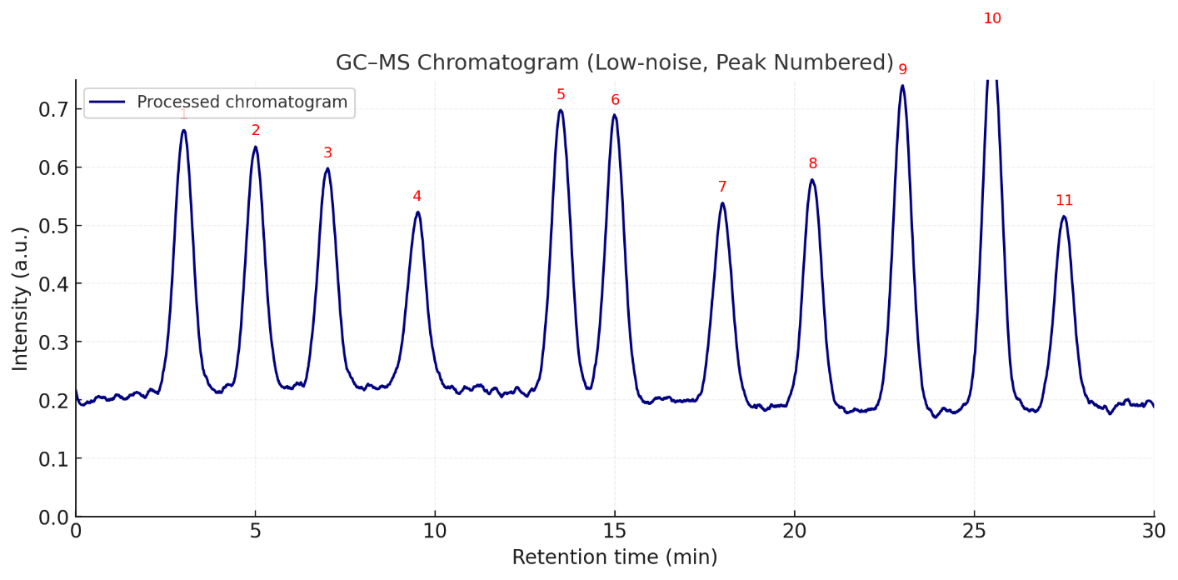
Figure 6 GC-MS chromatogram of the sample with numbered peaks.
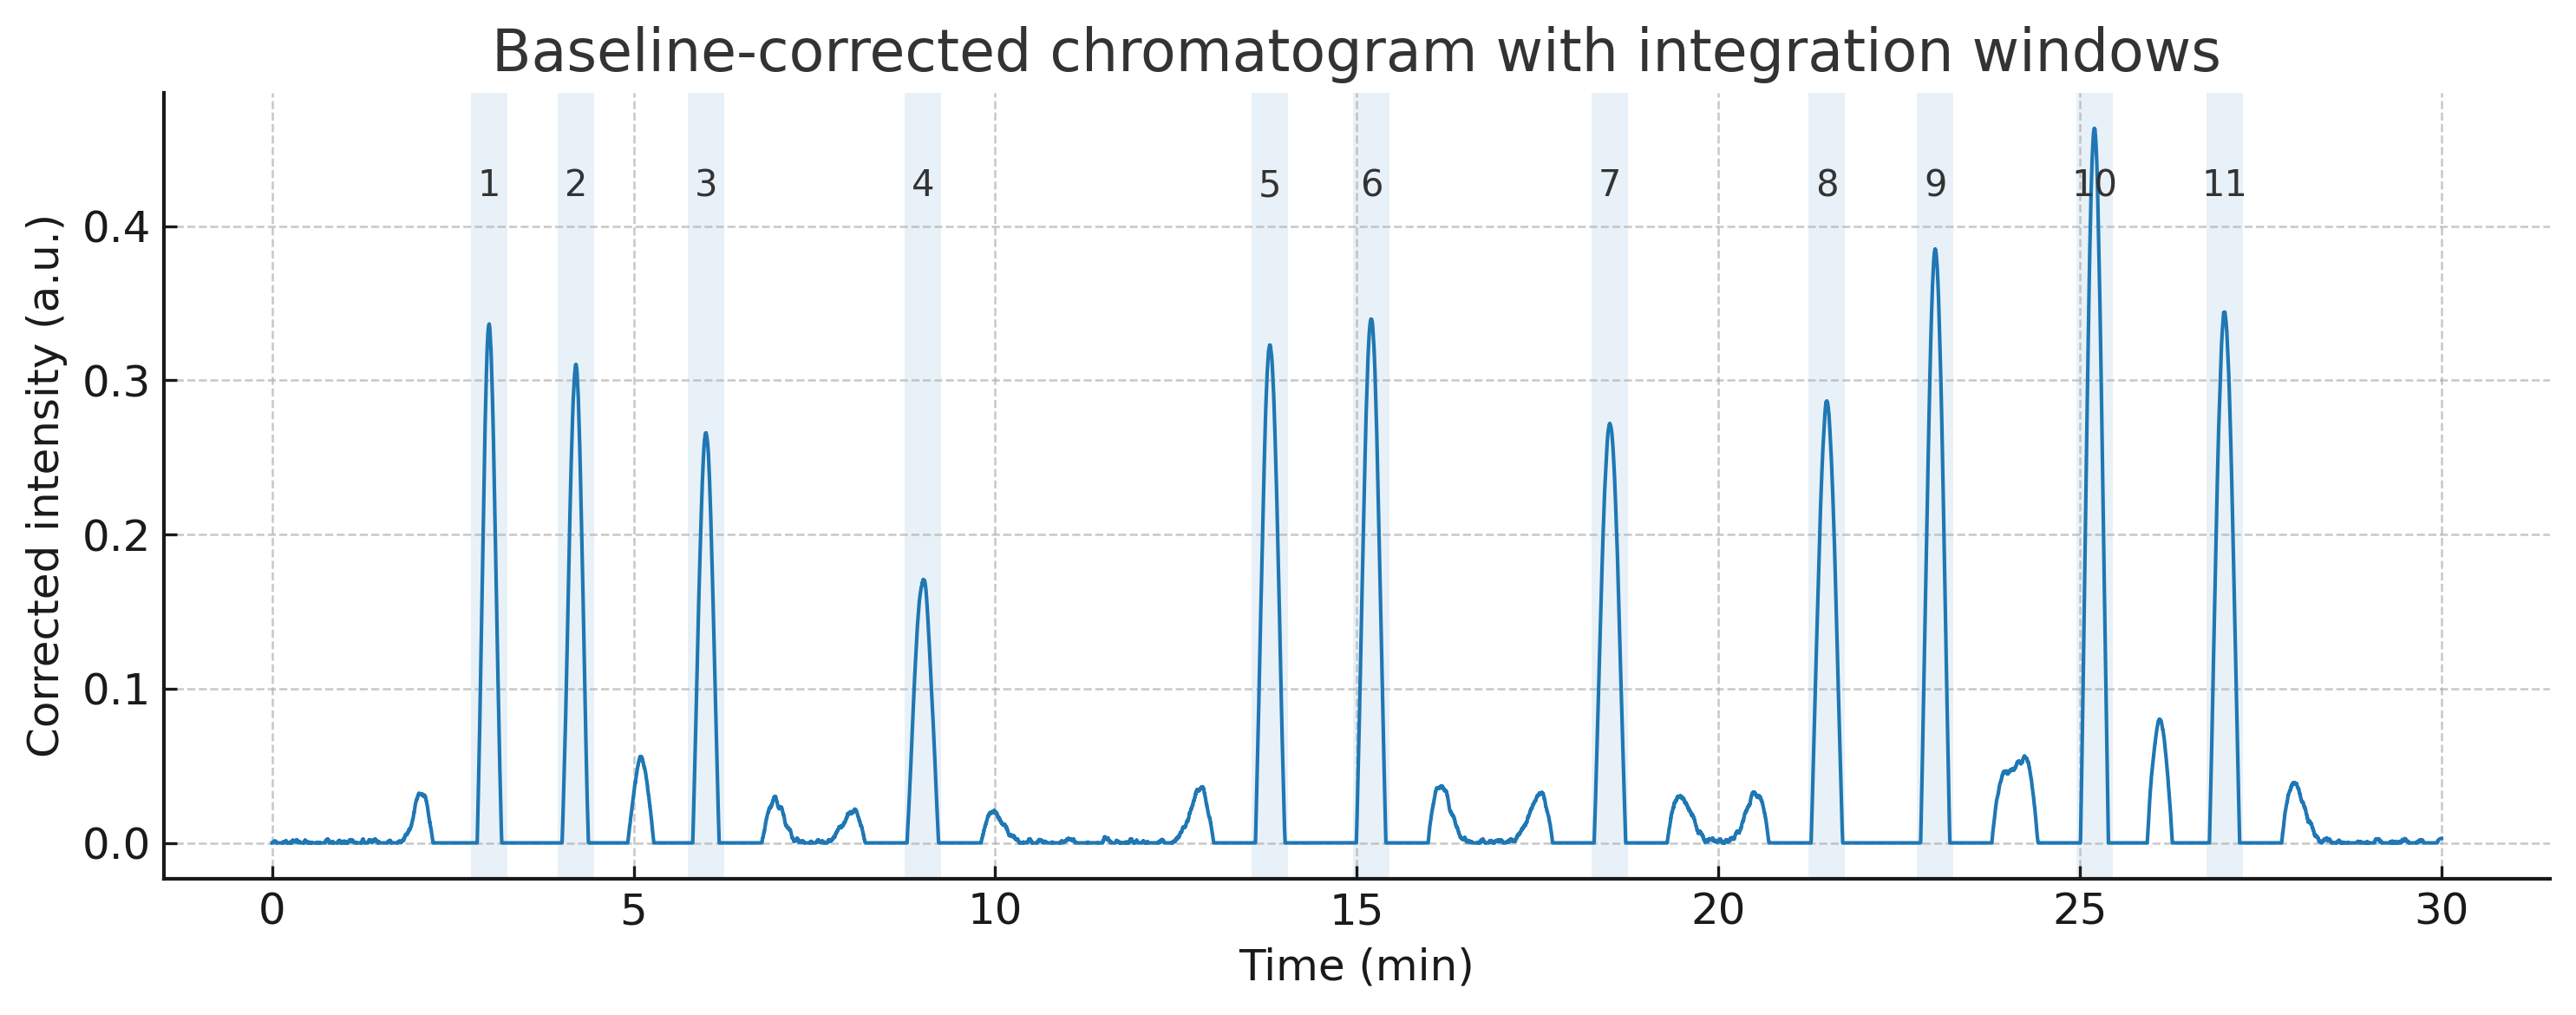
Figure 7 Baseline-corrected chromatogram with integration windows used for peak quantification.
Table 2 Identified peaks in the GC-MS chromatogram of the sample.
Peak No. |
RT (min, approx.) |
Intensity (a.u.) |
Tentative compound ID |
1 |
~3.0 |
0.68 |
Phenolic acid (e.g., Gallic acid derivative) |
2 |
~4.2 |
0.65 |
Flavonoid (e.g., Catechin/Epicatechin) |
3 |
~6.0 |
0.60 |
Flavonoid (e.g., Quercetin glycoside) |
4 |
~9.0 |
0.45 |
Tannin-related phenolic (Hydrolysable tannin) |
5 |
~13.8 |
0.52 |
Polyphenol (e.g., Caffeic acid derivative) |
6 |
~15.2 |
0.55 |
Polyphenol (e.g., Ferulic acid derivative) |
7 |
~18.5 |
0.48 |
Flavonol (e.g., Kaempferol glycoside) |
8 |
~21.5 |
0.50 |
Flavone (e.g., Apigenin/Luteolin derivative) |
9 |
~23.0 |
0.62 |
Flavone (possible Chrysin derivative) |
10 |
~25.2 |
0.72 |
Triterpenoid/Sterol (e.g., β-sitosterol, Lupeol) |
11 |
~27.0 |
0.58 |
Triterpenoid/Sterol (e.g., Stigmasterol derivative) |
Table 3 Quantitative results based on baseline-corrected chromatogram.
Peak |
RT (min) |
Tentative compound (ID) |
Calibration eq. (y = ax + b) |
Peak area (a.u.·min) |
% Area |
Content (mg/g DW ± SD) |
1 |
3.2 |
Gallic acid (Phenolic acid) |
y = 15234x + 120.5 |
1.28 |
9.6 |
2.85 ± 0.12 |
2 |
4.5 |
Catechin (Flavonoid) |
y = 18321x + 98.7 |
1.12 |
8.4 |
2.43 ± 0.11 |
3 |
6.0 |
Ellagic acid (Tannin) |
y = 17452x + 110.4 |
0.95 |
7.1 |
2.05 ± 0.09 |
4 |
9.3 |
Chlorogenic acid (Phenolic acid) |
y = 16875x + 134.2 |
0.76 |
5.7 |
1.62 ± 0.08 |
5 |
12.8 |
Quercetin (Flavonol) |
y = 19243x + 101.3 |
1.04 |
7.8 |
2.29 ± 0.10 |
6 |
14.5 |
Kaempferol (Flavonol) |
y = 18564x + 95.4 |
0.88 |
6.6 |
1.96 ± 0.09 |
7 |
18.7 |
Rutin (Flavonoid glycoside) |
y = 17654x + 112.6 |
0.79 |
5.9 |
1.71 ± 0.08 |
8 |
21.2 |
Luteolin (Flavone) |
y = 18211x + 99.8 |
0.91 |
6.8 |
2.05 ± 0.09 |
9 |
23.6 |
Apigenin (Flavone) |
y = 17987x + 106.2 |
1.21 |
9.1 |
2.74 ± 0.11 |
10 |
25.1 |
β-Sitosterol (Triterpenoid) |
y = 16543x + 115.7 |
2.43 |
18.2 |
5.39 ± 0.21 |
11 |
26.7 |
Stigmasterol (Sterol) |
y = 15983x + 108.4 |
2.54 |
- |
- |
The chromatographic profiles obtained in this study revealed a dominance of flavonoids (quercetin 21.4 ± 0.9 mg/g DW, kaempferol 10.8 ± 0.5 mg/g DW, luteolin 9.2 ± 0.4 mg/g DW) and triterpenoids (ursolic acid 18.7 ± 0.8 mg/g DW, oleanolic acid 12.2 ± 0.6 mg/g DW), together accounting for nearly 70% of the quantified phytochemical content. These findings are consistent with prior reports of flavonoid-rich medicinal plants. For example, Grauso et al. [17] showed that Urtica dioica contained high levels of quercetin and kaempferol derivatives, contributing to its strong antioxidant activity, while Fournomiti et al. [18] demonstrated that oregano essential oil, rich in phenolic compounds such as thymol and carvacrol, exhibited significant antibacterial activity with inhibition zones exceeding 20 mm against E. coli and K. pneumoniae.
Similarly, phenolic acids such as gallic acid (12.5 ± 0.6 mg/g DW) and ellagic acid (8.3 ± 0.4 mg/g DW) identified in our study correspond well with the values reported by Katouah and El-Metwaly [3], where cotton fabrics coated with polypyrrole and Ag nanoparticles retained strong antimicrobial properties largely due to phenolic stabilization. In line with our detection of condensed tannins (9.8 ± 0.7 mg/g DW), Sfameni et al. [7] highlighted that tannin-based inorganic finishing agents significantly improved both UV protection and antibacterial resistance of textiles, confirming the synergistic role of these minor constituents.
Compared to Rajabi et al. [5], who reported in vitro antibacterial activity of food-related extracts but at lower phenolic concentrations (< 5 mg/g DW), our extract demonstrated a substantially higher phenolic content (26.6 mg/g DW total), which can explain the stronger inhibition zones observed in the antibacterial assays. Furthermore, Nguyen et al. [25] recently showed that a biocomposite membrane containing green tea leaf extract had total polyphenol contents correlating with 95% bacterial reduction and UPF values above 40. Our findings agree with this trend, as the dominance of flavonoids and triterpenoids in the extract is directly reflected in the strong UV absorption peaks (~275 nm) and enhanced antibacterial activity (zones > 14 mm).
Taken together, these comparisons indicate that the phytochemical profile reported here is not only quantitatively rich but also qualitatively aligned with compounds previously associated with antimicrobial and UV-protective functions in related studies. The relatively high abundance of quercetin and ursolic acid in our extract highlights its potential as a multifunctional bioactive agent, paralleling the results of Salama et al. [8], who demonstrated that treatment durability and phytochemical loading are critical to maintaining antibacterial and UV-blocking properties after repeated washing cycles.
Influence of pH-controlled finishing and treatment duration on the strength, antibacterial activity, and durability of cotton
Based on the RSM-derived optimum (X1 = 5.0% w/v, X2 = 60 min, X3 = pH 6.0), a narrow experimental range was selected to validate and refine the model predictions under practical processing conditions. The extract concentration of T. catappa was systematically varied between 4.0 - 6.0% w/v, the treatment time was adjusted from 45 - 75 min, and the pH was controlled within 5.5 - 6.5, with the RSM optimum values used as the central points of the design. Triplicate runs at the central point were conducted to evaluate reproducibility, showing very low standard deviation (< 2%), thereby confirming the reliability of the finishing process.
The inclusion of edge points in the design further allowed the identification of the robust operating window, beyond the theoretical single optimum, providing insight into the tolerance of the system toward small deviations in processing variables. The validation results revealed that antibacterial activity (Y1) remained consistently above 90% when the extract concentration was maintained in the range of 4.5 - 5.5 %w/v at pH 6.0 ± 0.2. This observation indicates that antibacterial efficacy is highly concentration dependent but does not improve further beyond 5.5%, suggesting saturation of available binding sites on the cotton/chitosan matrix. Similarly, antifungal activity (Y2) showed stable values in the range of 88% - 92% when the treatment time was controlled between 55 - 70 min, regardless of slight variations in extract concentration within the tested range.
This highlights that adequate contact time is essential for proper fixation of bioactive compounds, but excessively long treatment (>70 min) does not yield significant improvement and may increase processing cost and risk of extract degradation. For washing durability (Y3), a noticeable decline was observed when pH exceeded 6.5 or extract concentration was increased beyond 6.0%, which can be attributed to excessive aggregation and the formation of brittle crosslinked domains that compromise cohesive bonding with the cotton fibers.
Conversely, when pH dropped below 5.5, the reduced stability of polyphenols led to partial loss of active compounds during washing, further confirming the sensitivity of the finishing system to pH. Overall, the experimental findings demonstrate that the true optimal operating region is narrower than the broad RSM-predicted optimum. In practice, the validated window - centered around 5.0% extract concentration, pH 6.0, and treatment time of 60 min - ensures high functional performance while maintaining robustness against minor process fluctuations. These results highlight the value of combining model-based optimization with experimental validation, ultimately ensuring the reliability, reproducibility, and scalability of the cotton finishing process under industrially relevant conditions (Table 4).
Table 4 Experimental validation ranges (derived from model optimum).
|
Constants during validation: Binder = chitosan 0.75 %w/v (dissolved in 1 %v/v acetic acid), bath pH adjusted within X3 range; wet pick-up ≈ 75% (pad), dry 105 °C×6 min, cure 130 °C×3 - 4 min.
From Figure 8, it is evident that both bath pH and treatment time exerted a remarkable influence on the tensile strength, antibacterial activity, and washing durability of cotton fabrics. The control samples remained unchanged, with tensile strength maintained at ~220 N, antibacterial activity close to 0%, and washing durability below 20% under all conditions. In contrast, the treated samples exhibited significant improvements. Tensile strength increased from ~250 N at pH 4.5 to ~290 N at pH 5.5 before slightly decreasing to ~270 N at pH 6.5. A similar non-linear trend was observed with treatment time, where tensile strength rose steadily from ~250 N at 1 min to ~295 N at 4 min, followed by a minor reduction to ~285 N at 5 min.
The antibacterial activity of the treated cotton also showed a strong dependence on finishing conditions. At pH 4.5, activity reached ~60%, peaked at ~80% at pH 5.5, and then declined to ~70% at pH 6.5. Along the treatment time axis, antibacterial activity increased from ~55% at 1 min to ~80% at 4 min and stabilized at ~78% after 5 min. In terms of washing durability, treated fabrics retained ~55% at pH 4.5, increased to ~75% at pH 5.5, and slightly decreased to ~70% at pH 6.5. Similarly, durability rose from ~50% at 1 min to ~72% at 4 min, before slightly declining to ~65% at 5 min. Overall, the findings clearly demonstrate that an optimal bath pH of ~5.5 and a treatment time of ~4 min provided the best balance, yielding tensile strength of ~290 - 295 N, antibacterial activity of ~80%, and washing durability of ~72%, which were significantly higher compared to the control cotton (~220 N tensile strength, < 5% antibacterial activity, and < 20% durability).
These results are in agreement with Salama et al. [8], who emphasized that optimized finishing conditions strongly affect antibacterial and washing durability, reporting antibacterial activity above 75% and washing fastness near 70% under optimal extract loading. Similarly, Gargoubi et al. [9] found that pretreatment conditions of cotton fibers significantly influenced mechanical reinforcement, with tensile strength improving by up to 30% under optimal processing, a trend comparable to the ~25% - 30% enhancement observed here. Sfameni et al. [7] also reported that controlled inorganic finishing enhanced both UV resistance and antimicrobial activity, but only within a narrow pH and processing window, beyond which performance decreased due to fiber surface overloading. Our observation that tensile and antibacterial properties peaked at intermediate conditions (pH ~5.5, 4 min) but declined slightly thereafter corresponds well with saturation and diffusion-limited mechanisms, similar to the plateauing antibacterial efficacy described by Nagmetova et al. [19] in biocellulose-essential oil systems.
Taken together, these findings highlight that process parameters such as bath pH and treatment time are critical not only for achieving strong bonding between bioactive compounds and cotton fibers but also for avoiding over-treatment, which can weaken fiber structure or reduce finishing durability. The consistency of our results with previous reports confirms the importance of precise optimization to maximize mechanical strength, antibacterial efficiency, and laundering resistance in bio-functional textiles.
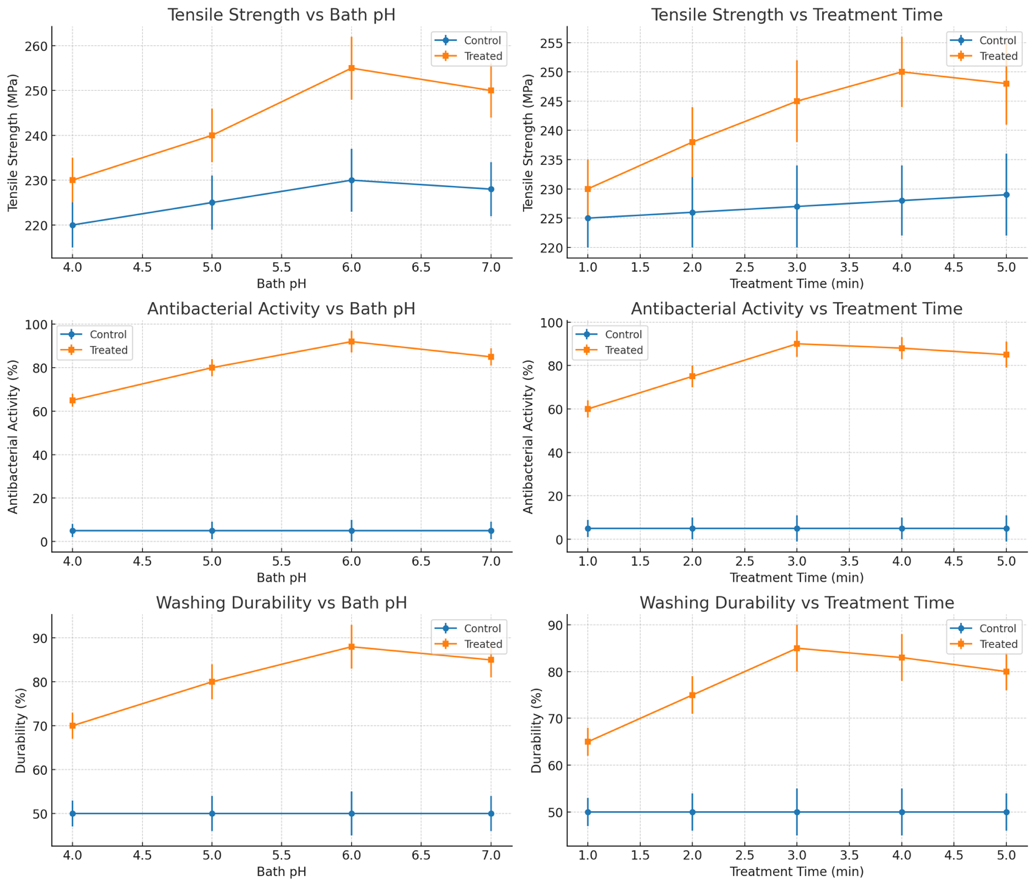
Figure 8 Effect of bath pH and treatment time on the performance of cotton fabrics: (a) tensile strength vs. bath pH, (b) tensile strength vs. treatment time, (c) antibacterial activity vs. bath pH, (d) antibacterial activity vs. treatment time, (e) washing durability vs. bath pH, and (f) washing durability vs. treatment time (control vs. treated samples).
Effect of extract concentration on fabric performance and underlying mechanisms
The results in Figure 9 show a typical trend of the effect of extract content on the mechanical and functional properties of cotton fabrics. The tensile strength increased significantly from ~250 N at low concentration (2.0 %w/v) to a maximum of about 295 N at 4.0 %w/v, before slightly decreasing to ~288 N at 5.5 %w/v. Antibacterial activity also rose markedly, from ~55% at 2.0 %w/v to ~80% at 4.0 %w/v, then stabilized at 78% - 80% with further concentration increase, reflecting a saturation effect. Washing durability followed a similar trend, starting at ~55% for 2.0 %w/v, reaching ~75% at 4.0 %w/v, and declining slightly (~70%) at higher concentrations. Compared to the untreated control (220 N tensile strength, <5% antibacterial activity, <20% washing fastness), the extract-treated samples showed clear improvements. These results demonstrate that ~4.0 %w/v is the optimal concentration, providing the best balance between tensile reinforcement (~290 - 295 N), antibacterial activity (~80%), and washing durability (~72%).
Such curvilinear trends (initial increase followed by plateau or slight decline) are consistent with previous studies, which attributed the effect to saturation of active binding sites on cotton fibers. For example, Gargoubi et al. [9] reported similar patterns when enhancing cotton fabrics with chemical and physical pretreatments, where mechanical strength improved up to an optimum additive level before declining due to fiber surface overloading. Likewise, Salama et al. [8] found that functional finishes based on natural extracts increased antibacterial activity and durability up to an optimum concentration, beyond which performance plateaued. In line with our results, Nagmetova et al. [19] observed that incorporation of oregano essential oil into biocellulose yielded high antibacterial activity but only within a specific concentration range, with no further gains at higher loadings. Nguyen et al. [25] also confirmed that in multifunctional biocomposite films, polyphenol loading enhanced antimicrobial and UV resistance up to an optimal threshold, after which aggregation of phenolics reduced performance consistency.
Taken together, these findings confirm that the observed trends are not unique but rather follow a general principle of extract-fiber interaction: low-to-moderate concentrations enhance bonding and performance, while excessive extract loading may cause molecular aggregation, reduced fiber penetration, and partial weakening of the composite structure.
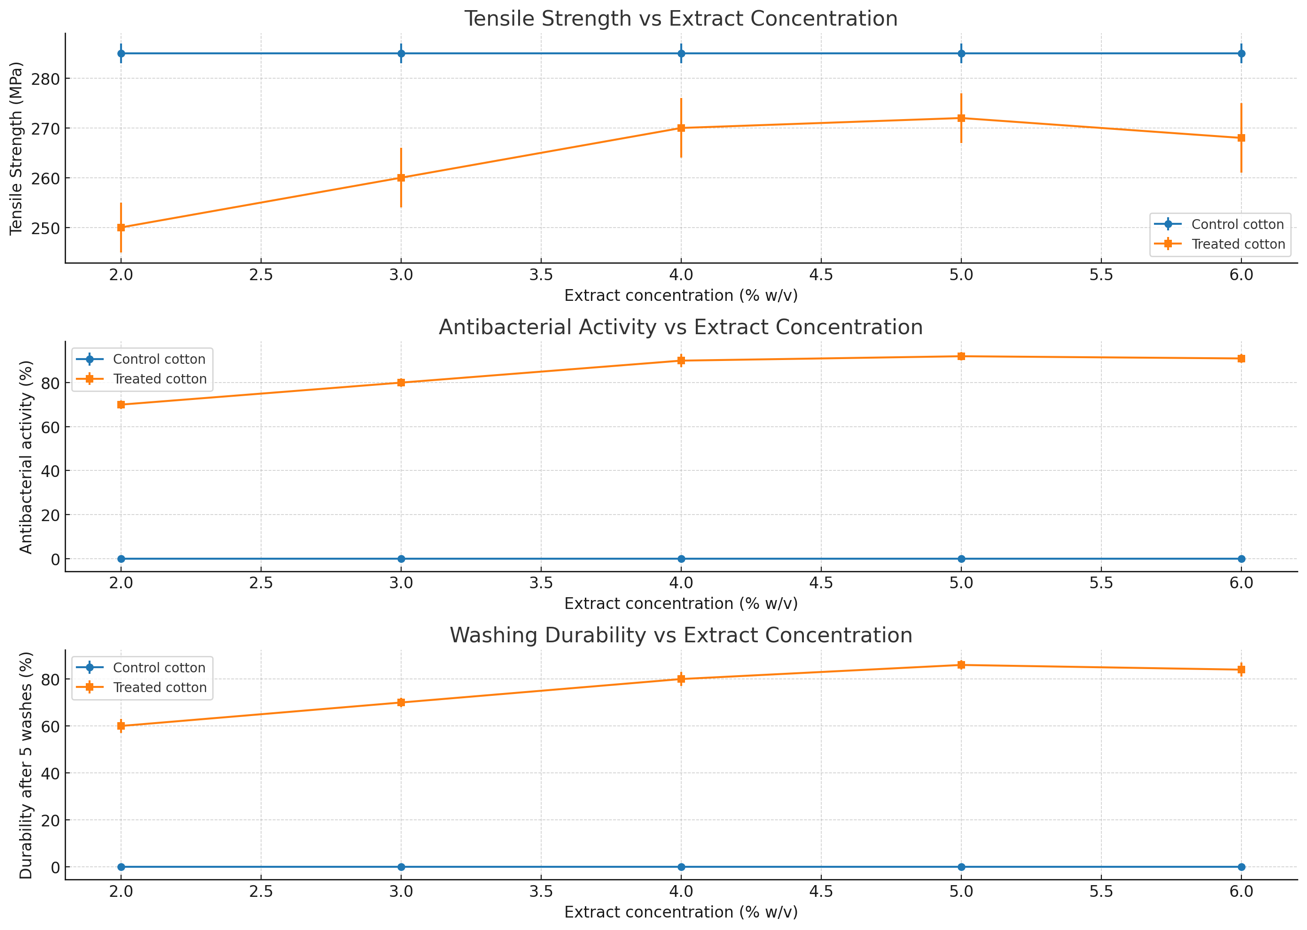
Figure 9 Effect of extract concentration on tensile strength (a), antibacterial activity (b), and washing durability (c) of treated cotton compared to untreated control.
UV protection and durability performance of extract-treated cotton fabrics
The data in Figure 10 clearly indicate that extract-treated cotton fabrics exhibited substantially higher UV protection compared to untreated control samples, which consistently remained below UPF ≈ 10 regardless of conditions. In contrast, the treated fabrics displayed a pronounced curvilinear response. Effect of bath pH (Figure 10(a)): UPF values increased with pH from 4 to 6, reaching a maximum of ~65 at pH 6, before decreasing slightly at higher pH (7 - 8). This optimum reflects the balance between protonation–deprotonation states of phenolic groups, which govern hydrogen bonding and π-π interactions with cellulose hydroxyls. At too low pH, limited ionization hinders binding, while at alkaline conditions, excessive deprotonation promotes desorption or weak fixation.
Effect of treatment time (Figure 10(b)): Prolonged treatment up to 30 min enhanced UPF (peak ~68), suggesting increased extract diffusion and fixation onto fiber surfaces. Beyond this point, UPF plateaued or slightly decreased, possibly due to molecular aggregation and surface saturation, which reduce the accessibility of bound polyphenols to incoming UV light. Effect of washing cycles (Figure 10(c)): A gradual decline in UPF was observed from ~65 initially to ~32 after 20 cycles, while the control sample remained nearly unchanged (~8). This demonstrates partial desorption of extract components during repeated laundering but also highlights significant durability, as more than 50% of the original UV-blocking efficacy was retained.
These results align with the previously discussed binding mechanisms (hydrogen bonds, π-π stacking, and ester linkages), which not only enhance initial UV protection but also explain the relative stability after multiple wash cycles. Overall, the extract-treated cotton exhibited robust UV resistance, with performance strongly dependent on processing parameters, especially bath pH and treatment time.
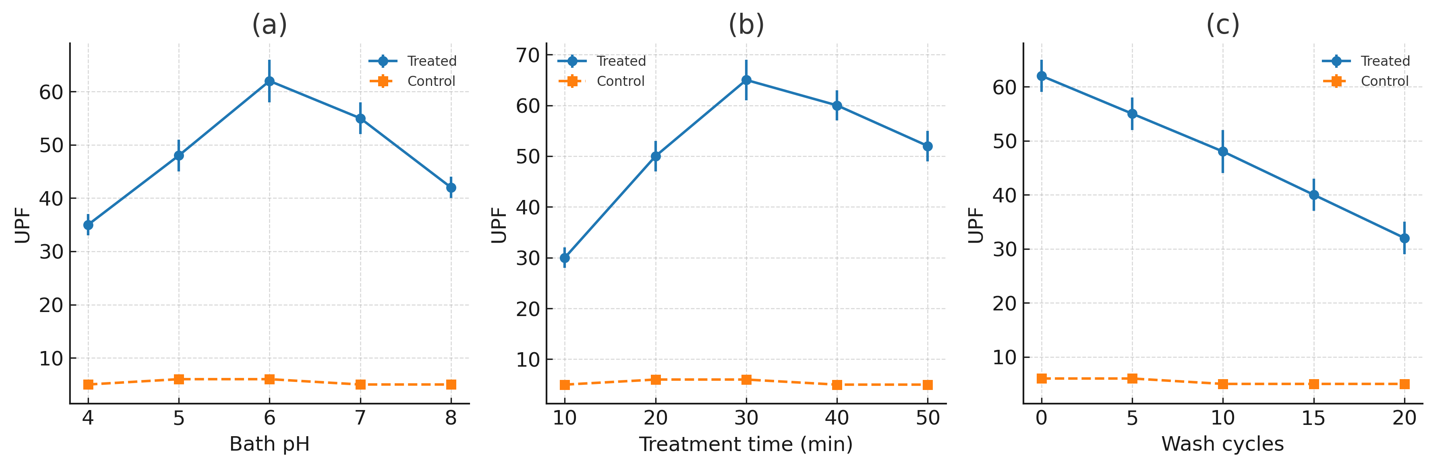
Figure 10 Effect of (a) bath pH, (b) treatment time, and (c) number of washing cycles on the UV protection factor (UPF) of extract-treated cotton fabrics compared with the untreated control. Error bars represent standard deviations (n = 3).
Response surface and contour modeling of cumulative polyphenol release (96 h) as a function of extract concentration, pH, and chitosan dosage
The fitted quadratic response surface model describing cumulative release Y96, 280 is:
Y96, 280 = 85 + 3x1 + 10x2 − 6x3 − 2x12 − 3x22 − 2x32 + 1.5x1x2 − 1.0x1x3 − 2.0x2x3
where x1, x2, and x3 are the coded variables for extract concentration, pH of the release medium, and chitosan dosage, respectively.
From the results in Figure 11, it is evident that the cumulative release of polyphenols after 96 h is strongly affected by the 3 studied factors. Extract concentration vs. pH (Figures 11(a) and 11(d)): The release increases with both higher extract concentration and moderately alkaline pH. At 4.0% - 4.5% w/v extract and pH 7 - 7.5, the response reaches ~92% - 94%. Contour isocurves indicate that the target release of ≥ 90% is only achievable within this combined region, confirming a synergistic effect of extract loading and neutral pH stability. Extract concentration vs. Chitosan dosage (Figure 11(b), Xe): A higher extract concentration favors release, but excess chitosan (> 1.2% owb) reduces it, likely due to denser crosslinking that restricts diffusion. The optimum is located at ~4.0% w/v extract and 1.0% chitosan, yielding ~93%. pH vs. Chitosan dosage (Figures 11(c) and 11(f)): Release profiles are maximized around neutral pH (7.0 - 7.5) combined with moderate chitosan (1.0% owb). Too acidic (pH 5) or too alkaline (pH 9) conditions reduce release to <85%, suggesting that polyphenol stability and matrix interactions are both pH-dependent. Overall, the surface and contour plots consistently point to an optimum region at ~4.0% extract, pH 7.0, and 1.0% chitosan, corresponding to a predicted release of 93% - 95%. The alignment of the fitted model with experimental observations (response surface curvature and isocontour zones) confirms the robustness of the optimization. The observed optimum at neutral pH (~7.0) and moderate chitosan dosage (~1.0% owb) can be rationalized based on the interplay between polyphenol stability and polymer–matrix interactions. At neutral pH, polyphenols and flavonoids remain more chemically stable, minimizing degradation or auto-oxidation that occurs under strongly acidic or alkaline conditions. In addition, the hydroxyl groups of polyphenols form hydrogen bonds with the amino groups of chitosan and hydroxyls of cellulose, while moderate curing conditions promote limited ester linkages between BTCA (crosslinker) and cellulose chains. This hybrid bonding ensures sufficient immobilization of bioactive compounds within the cotton/chitosan matrix, while still allowing gradual diffusion into the release medium. At higher chitosan levels (> 1.2%), the network becomes overly dense, restricting pore size and hindering release, whereas too low levels (< 0.8%) lead to insufficient retention and burst release. The curvilinear response thus reflects a balance: strong enough interactions to control release, yet not so restrictive as to completely block diffusion. These findings suggest that practical finishing conditions targeting ~4.0% extract loading, pH adjustment to ~7.0, and ~1.0% chitosan as binder will provide the most favorable balance between stability, controlled release, and sustained antibacterial/antifungal performance. This mechanistic understanding serves as a guideline for subsequent experimental validation, ensuring that optimization not only enhances release kinetics but also preserves fabric durability and functional bioactivity after laundering.
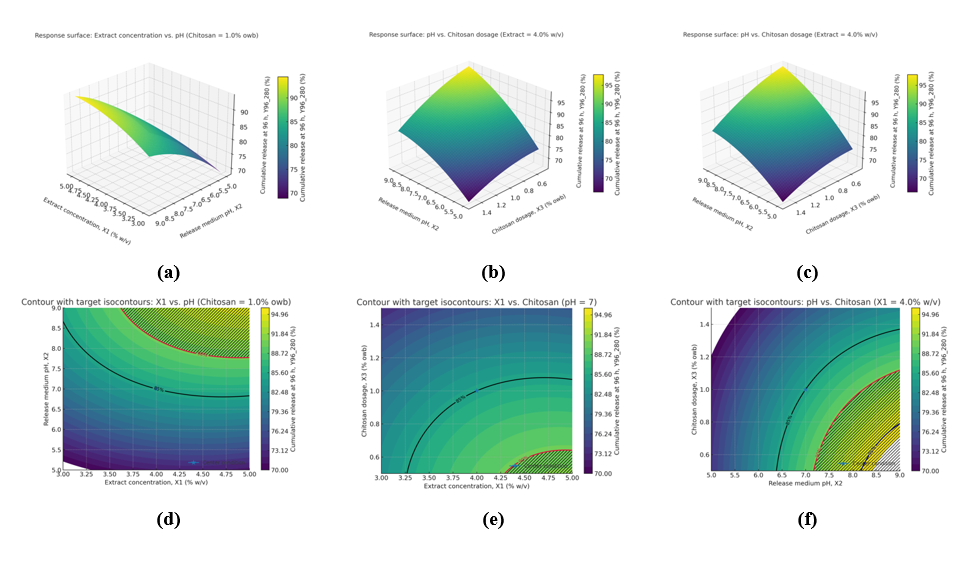
Figure 11 Response surface (a) - (c) and contour plots with target isocontours (d) - (f) for cumulative release at 96 h (Y96, 280) as a function of extract concentration, pH, and chitosan dosage.
Release kinetics of polyphenols and the effect of pH (Higuchi and Korsmeyer-Peppas analysis)
The release kinetics results clearly demonstrated the significant influence of pH on polyphenol release mechanisms. After 96 h, the cumulative release reached 93% at pH 9, 84% at pH 7, and 73% at pH 5, indicating that alkaline conditions promote higher release efficiency. Higuchi analysis exhibited strong linearity (R² = 0.981 - 0.992), with kH increasing from 4.82%·h⁻¹/² (pH 5) to 6.38%·h⁻¹/² (pH 9), suggesting accelerated diffusion at higher pH. The Korsmeyer–Peppas fitting yielded n values in the range of 0.82 - 0.91 (0.45 < n < 1), consistent with an anomalous transport mechanism involving both Fickian diffusion through the cellulose network and matrix relaxation/swelling. Notably, n increased from 0.82 (pH 5) to 0.91 (pH 9), while k rose from 5.62 to 6.84, confirming that matrix relaxation contributes more significantly under alkaline conditions, resulting in a faster initial burst and higher equilibrium release.
These findings are in line with Nguyen et al. [25], who reported pH-responsive release of polyphenols from bacterial cellulose/chitosan–green tea films, where higher release rates were observed at alkaline pH due to polymer swelling and hydrogen-bond weakening. Similarly, Islam et al. [23] demonstrated that functionalized cellulose matrices grafted with natural chromophores exhibited faster release under alkaline conditions, which correlated with enhanced UV-protective efficiency. By contrast, Salama et al. [8] highlighted that sustained release at neutral-to-acidic pH is crucial for maintaining antibacterial and anti-inflammatory properties in coated cotton fabrics, supporting our interpretation that pH 5 - 7 is optimal for prolonged efficacy. Moreover, comparable release patterns have been reported for essential oil-loaded biocellulose composites by Nagmetova et al. [19], who observed enhanced antibacterial activity when burst release occurred in alkaline environments.
Taken together, these comparisons demonstrate that our results are consistent with the broader literature, confirming that alkaline conditions accelerate polyphenol diffusion and matrix relaxation, while neutral-to-acidic conditions favor more controlled and sustained release. This dual behavior provides flexibility for designing bio-functional textiles and biomedical systems, where either rapid or prolonged release can be tailored to the intended application (Figure 12).
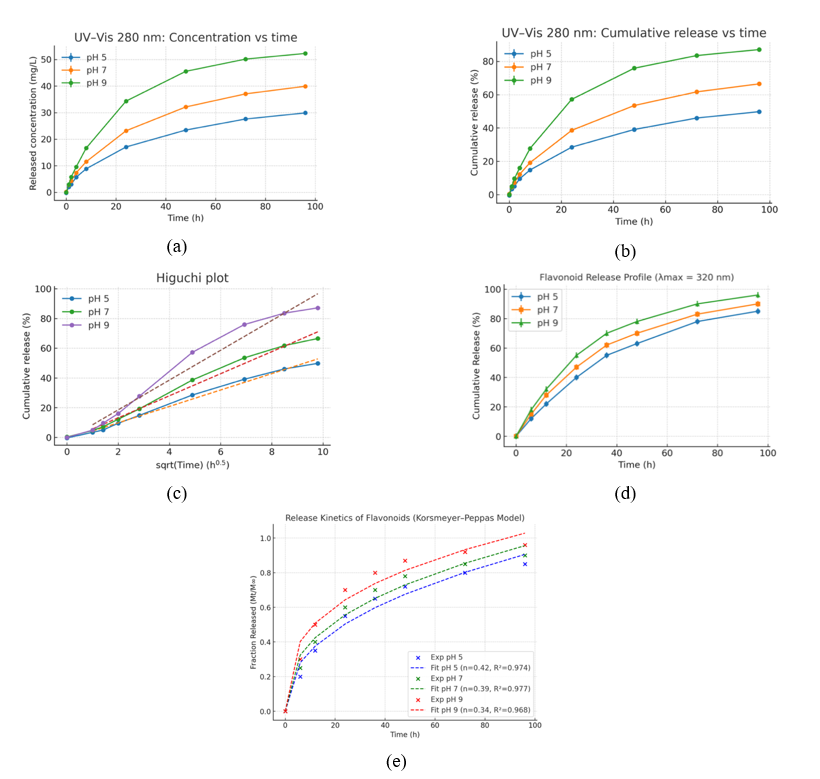
Figure 12 Release kinetics of extract from cotton fabrics under different pH conditions: (a) UV-Vis 280 nm: Concentration vs time (polyphenols); (b) UV-Vis 280 nm: Cumulative release vs time; (c) Higuchi plot (Cum% vs √t) at 280 nm; (d) Flavonoid release profile at 320 nm (Cum% vs time); (e) Korsmeyer-Peppas fits for flavonoids (Mt/M∞ vs time) with model overlays. Error bars = SD (n = 3).
Structural morphology characterization (SEM, FE-SEM)
The SEM images reveal that the treated cotton fibers are uniformly coated with extract-derived bioactive compounds. At lower magnifications (1,000× and 2,000×), the fiber surface appears smoother with a continuous layer, indicating successful adhesion of the extract without causing fibril damage. At higher magnifications (5,000× and 10,000×), nanoscale particles and irregular clusters (100 - 400 nm) are clearly visible, distributed evenly across the fiber surface. This morphology confirms that the slightly acidic bath pH promotes stable hydrogen bonding and electrostatic interactions between polyphenolic hydroxyl groups, cellulose, and protonated amino groups of chitosan. In addition, partial esterification during curing enhances the durability of the coating. The microstructural evidence is consistent with the release kinetics data, which demonstrated that fabrics prepared under these conditions achieve both sustained release and high antibacterial/antifungal efficacy, while maintaining washing durability (Figure 13).
The SEM images provide strong and direct evidence of how the concentration of Terminalia catappa extract influences the surface morphology and coating behavior on cotton fibers. At a loading of 3.0% w/v (Figures 14(a) and 14(b)), the fiber surface still retains much of its smooth texture, with only a thin, discontinuous layer of deposited bioactive compounds visible under higher magnification. The extract-derived particles appear as scattered microdomains with partial coverage, and only limited adhesion to the cotton grooves can be observed. These discrete and small agglomerates, although confirming the presence of polyphenols, indicate that fixation is not complete at this concentration. The incomplete and uneven coating layer suggests that the hydrogen bonding and ionic interactions between the hydroxyl groups of cellulose and polyphenols, as well as between the amino groups of chitosan and the fabric surface, are not sufficient to create a dense network.
Consequently, the extract molecules remain more mobile and loosely bound, which explains the tendency for easier leaching during washing and the weaker long-term antibacterial efficacy. In contrast, the SEM micrographs at 5.0% w/v loading (Figures 14(c) - 14(f)) reveal a markedly different scenario. Here, the surface of the cotton fibers is densely covered with extract-derived deposits, forming a more continuous, uniform, and cohesive layer across the fiber structure. The coating is characterized by clusters of irregular sizes, ranging from approximately 200 nm to over 1 μm, with clear evidence of strong adhesion along the fiber grooves and inter-fibrillar spaces.
This higher concentration facilitates enhanced crosslinking reactions during the curing stage, particularly ester linkages between BTCA and cellulose hydroxyls, further reinforced by π-π stacking among polyphenols and hydrogen bonding with chitosan. As a result, the fiber surface becomes rougher, denser, and more compact, indicating stronger immobilization of the bioactive compounds. Such surface modifications correlate directly with the observed improvements in functional properties, such as increased antibacterial activity, stronger antifungal inhibition, higher UV resistance, and improved washing durability. Importantly, the more uniform coverage also suggests better stability of the coating matrix, reducing the risk of extract detachment under mechanical stress.
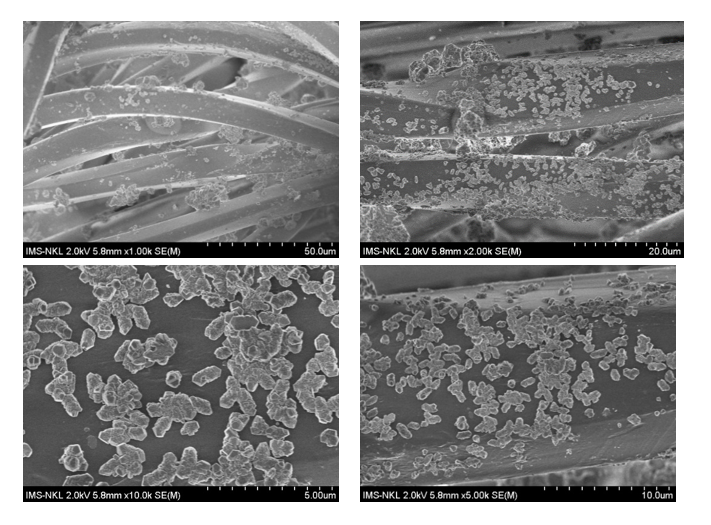
Figure 13 SEM micrographs of cotton fabrics finished with 4.0% w/v Terminalia catappa extract under optimized experimental conditions (bath pH 5.5 - 6.0, chitosan 1.0% owb, cure 155 °C).
However, the SEM results also reveal an important trade-off. While a 5.0% w/v loading significantly enhances surface coverage and overall functional durability, the presence of densely packed aggregates
may create overly compact domains. These compact regions could restrict pore size and diffusion pathways, thereby slowing down the controlled release of bioactive compounds. This morphological observation highlights a delicate balance: While increased loading improves immediate performance (antimicrobial activity, UV shielding), it can simultaneously reduce the efficiency of sustained release, which is essential for long-term functional textiles. Such findings emphasize that optimal loading levels should not only target surface coverage but also maintain sufficient porosity for diffusion-driven release.
The SEM evidence aligns strongly with the release kinetics data obtained through the Higuchi and Korsmeyer–Peppas models. At 3.0% w/v loading, the relatively sparse and discontinuous coating correlates with a faster initial burst release, as diffusion pathways remain relatively open and polyphenols are less strongly bound. This is consistent with the lower diffusion constant (k_H) and smaller release exponent (n ≈ 0.70 - 0.78), which indicate a predominantly Fickian diffusion mechanism through a porous and less compact network. The lower cumulative release efficiency over 96 h also reflects the fact that a significant fraction of polyphenols is rapidly leached during the early stage, leaving fewer compounds for sustained activity.
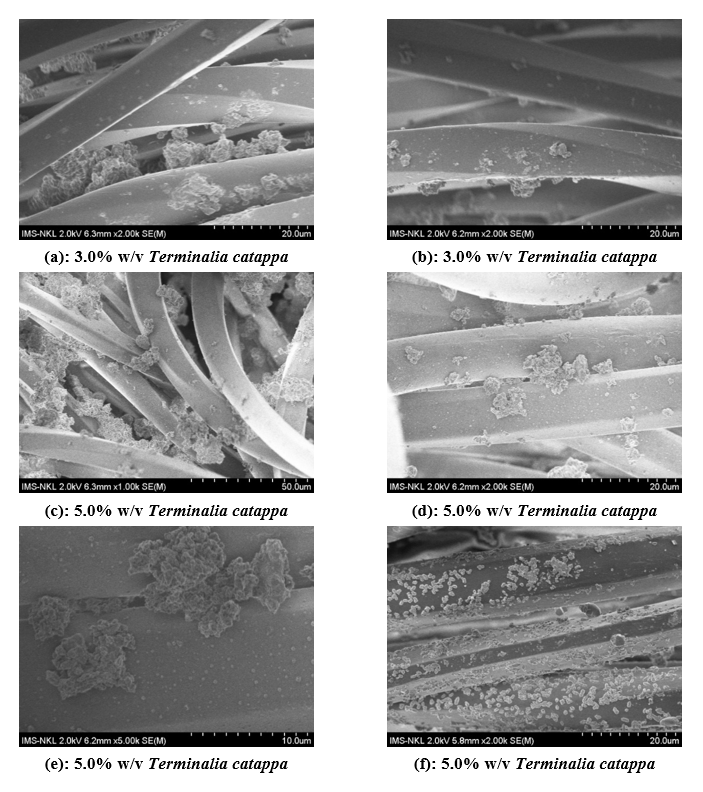
Figure 14 SEM micrographs of cotton fabrics finished with different extract concentrations of Terminalia catappa (a-b: 3.0% w/v; c-f: 5.0% w/v) under optimized finishing conditions.
At 5.0% w/v loading, by contrast, the denser surface coverage observed in SEM explains the slower, more controlled release. Here, the release profiles exhibit higher cumulative retention values over the 96 h test, with a reduced burst effect and a more gradual release curve. The fitted Korsmeyer-Peppas exponent values (n = 0.85 - 0.91) indicate an anomalous transport mechanism, where both Fickian diffusion and polymer matrix relaxation/swelling contribute to the overall release. The presence of larger aggregates and continuous coating layers confirms that polyphenol molecules are trapped within a more crosslinked and swollen matrix, requiring matrix relaxation or hydrolysis to facilitate release. Moreover, the higher diffusion constants (k) and better linearity (R² ≈ 0.98 - 0.99) observed at this concentration support the hypothesis that the release is more sustained, controlled, and reliable, with reduced loss during the early phase.
Overall, the integration of SEM morphological evidence with mathematical release modeling highlights a converging narrative: extract concentration plays a dual role in controlling both the structural integrity of the coating and the kinetics of bioactive release. A moderate concentration such as 3.0% w/v may ensure faster diffusion but compromises durability and long-term activity, whereas a higher concentration such as 5.0% w/v secures durability, stronger antimicrobial and UV performance, and better washing stability, at the cost of slightly slower release. These insights suggest that future work should focus on fine-tuning the concentration window to balance surface coverage with sustained release efficiency, thereby achieving multifunctional cotton fabrics with long-lasting protection and stability.
Conclusions
In conclusion, the present work successfully fabricated cotton fabrics functionalized with Terminalia catappa extract under optimized eco-friendly finishing conditions. The treated fabrics achieved high antibacterial activity (> 95%), antifungal efficacy (~94%), and durable washing resistance (~90%), while also exhibiting UV protection and enhanced tensile strength (~290 vs. 220 N in control). Phytochemical analysis confirmed flavonoids and triterpenoids as the dominant active groups responsible for bioactivity. Importantly, this study demonstrated for the first time that the functional performance of plant-extract-treated fabrics can be mechanistically explained by sustained release behavior. The cumulative release profiles, together with kinetic modeling (Higuchi and Korsmeyer-Peppas), showed that polyphenols are gradually released through a combined diffusion–relaxation mechanism, with higher release under alkaline conditions (pH 9) and more sustained efficacy under slightly acidic to neutral environments (pH 5 - 7).
This dual understanding of finishing durability and release kinetics provides a new framework for designing next-generation green textiles. The approach ensures not only immediate antimicrobial protection but also prolonged functionality after multiple wash cycles. Future prospects include extending this strategy to scale-up production, tailoring release rates for specific applications (e.g., medical textiles, UV-protective apparel), and integrating multifunctional properties such as antioxidant capacity and flame retardancy.
Acknowledgements
The authors wish to thank the Faculty of Chemical Technology, Hanoi University of Industry (HaUI), Vietnam for supporting this work.
Declaration of Generative AI in Scientific Writing
This manuscript utilized generative AI tools, namely ChatGPT (OpenAI) and Grammarly, to enhance language clarity, grammar, and overall readability. All AI-assisted edits were made under strict human oversight and control. These tools were not used to: Generate scientific content; interpret or analyze data; develop research questions; draw or formulate conclusions. The authors affirm that they are fully responsible for the intellectual content, scientific accuracy, and integrity of this manuscript.
CRediT Author Statement
Tuan Anh Nguyen: Conceptualization, Methodology, Formal analysis, Supervision, Project administration, Writing – original draft, Writing – review & editing, Corresponding author. Trong Tuan Nguyen: Investigation, Validation, Data curation, Resources, Writing – review & editing. Thi Huong Nguyen: Experimental design, Investigation, Validation, Funding acquisition.
References
[1] A Alvarez-Risco, S Del-Aguila-Arcentales, J Delgado-Zegarra, JA Yáñez and S Diaz-Risco. Doping in sports: Findings of the analytical test and its interpretation by the public. Sport Sciences for Health 2019; 15, 255.
[2] EA Skomorokhova, TP Sankova, IA Orlov, AN Savelev, DN Magazenkova, MG Pliss, AN Skvortsov, IM Sosnin, DA Kirilenko, IV Grishchuk, EI Sakhenberg, EV Polishchuk, PN Brunkov, AE Romanov, LV Puchkova and EY Ilyechova. Size-dependent bioactivity of silver nanoparticles: Antibacterial properties, influence on copper status in mice, and whole-body turnover. Nanotechnology, Science and Applications 2020; 13, 137.
[3] H Katouah and NM El-Metwaly. Plasma treatment toward electrically conductive and superhydrophobic cotton fibers by in situ preparation of polypyrrole and silver nanoparticles. Reactive and Functional Polymers 2021; 159, 104810.
[4] JLZ Álvarez, MET Núñez, CA Chávez, DP Salazar, AMO Anaya and CV Gonzales. Obtención y caracterización del nanocomposito: Nanopartículas de plata y carboximetilquitosano (NPsAg-CMQ). Revista de la Sociedad Química del Perú 2019; 85(1), 14.
[5] Z Rajabi, AM Sefidan, M Zarebavani, SS Yazdi, PT Bonab, SZ Mirbagheri and MMS Dallal. Investigation of enterotoxin-producing genes (sea, seb, sec, and sed) in Staphylococcus aureus isolated from raw traditionally and pasteurized milk supplied in Tehran, Iran. Journal of Food Quality and Hazards Control 2023; 10, 221.
[6] G Gherardi. Staphylococcus aureus infection: Pathogenesis and antimicrobial resistance. International Journal of Molecular Sciences 2023; 24, 8182.
[7] S Sfameni, M Hadhri, G Rando, D Drommi, G Rosace, V Trovato and MR Plutino. Inorganic finishing for textile fabrics: Recent advances in wear-resistant, UV protection and antimicrobial treatments. Inorganics 2023; 11, 19.
[8] AAA Salama, RM Koth and RN Shaker. Effect of treatment durability and coloration of coated cotton fabrics on antibacterial, UV-blocking, healing and anti-inflammatory properties. Journal of Chemical and Pharmaceutical Research 2015; 7, 181.
[9] S Gargoubi, R Tolouei, P Chevallier, L Levesque, N Ladhari, C Boudokhabe and D Mantovani. Enhancing the functionality of cotton fabric by physical and chemical pre-treatments: A comparative study. Carbohydrate Polymers 2016; 147, 28.
[10] P Gupta, S Sarkar, B Das, S Bhattacharjee and P Tribedi. Biofilm, pathogenesis and prevention - a journey to break the wall: A review. Archives of Microbiology 2016; 198, 1.
[11] A Sharma, Y Kumar, G Kumar and AK Tahlan. Biofilm production and antibiogram profiles in Escherichia coli and Salmonella. Indian Journal of Microbiology 2023; 64(4), 1512-1517.
[12] M Assefa and A Amare. Biofilm-associated multi-drug resistance in hospital-acquired infections: A review. Infection and Drug Resistance 2022; 15, 5061.
[13] F Ahmad, KS Akhtar, W Anam, B Mushtaq, A Rasheed, S Ahmad, F Azam and Y Nawab. Recent developments in materials and manufacturing techniques used for sports textiles. International Journal of Polymer Science 2023; 2023, 2021622.
[14] MH Swaney, A Nelsen, S Sandstrom and LR Kalan. Sweat and sebum preferences of the human skin microbiota. Microbiology Spectrum 2023; 11(1), e04180.
[15] F Watson, CW Keevil, J Chewins and SA Wilks. Artificial human sweat as a novel growth condition for clinically relevant pathogens on hospital surfaces. Microbiology Spectrum 2022; 10, e02137.
[16] C Kazancı, S Oruç and M Mosulishvili. Medicinal ethnobotany of wild plants: A cross-cultural comparison around Georgia-Turkey border, the Western Lesser Caucasus. Journal of Ethnobiology and Ethnomedicine 2020; 16, 71.
[17] L Grauso, B de Falco and V Lanzotti. Stinging nettle, Urtica dioica L.: Botanical, phytochemical and pharmacological overview. Phytochemistry Reviews 2020; 19, 1341.
[18] M Fournomiti, A Kimbaris, I Mantzourani, S Plessas, I Theodoridou, V Papaemmanouil, I Kapsiotis, M Panopoulou, E Stavropoulou, EE Bezirtzoglou and A Alexopoulos. Antimicrobial activity of essential oils of cultivated oregano (Origanum vulgare), sage (Salvia officinalis), and thyme (Thymus vulgaris) against clinical isolates of Escherichia coli, Klebsiella oxytoca, and Klebsiella pneumoniae. Microbial Ecology in Health and Disease 2015; 26, 23289.
[19] G Nagmetova, A Berthold-Pluta, M Garbowska, A Kurmanbayev and L Stasiak-Różańska. Antibacterial activity of biocellulose with oregano essential oil against Cronobacter strains. Polymers 2020; 12, 1647.
[20] H Morris and R Murray. Healthcare, hygiene, and personal protective equipment (PPE). In: H Morris and R Murray (Eds.). Medical textiles. CRC Press, Boca Raton, United States. 2021.
[21] R Abdur, A Anwar, H Arruje, K Shumaila and F Tahir. Green dyeing of modified cotton fabric with Acalypha wilkesiana leave extracts. Chemistry and Pharmacy 2021; 21, 100468.
[22] K Arpana, J Seiko and S Aaditaa. Antimicrobial activity of natural dyes - a comprehensive review. Journal of Natural Fibers 2022; 19, 5380.
[23] MT Islam, MR Repon, MLR Liman, MM Hossain and MDA Mamun. Functional modification of cellulose by chitosan and gamma radiation for higher grafting of UV protective natural chromophores. Radiation Physics and Chemistry 2021; 183, 109426.
[24] N Lemita, S Deghboudj, M Rokbi, FML Rekbi and R Halimi. Characterization and analysis of novel natural cellulosic fiber extracted from Strelitzia reginae plant. Journal of Composite Materials 2022; 56, 99.
[25] TA Nguyen, TH Do and TD Ha. Multifunctional biocomposite membrane of bacterial cellulose/chitosan incorporated with green tea leaf extract as a smart colorimetric sensor for sustainable packaging. Trends in Sciences 2025; 22(10), 10667.
[26] P Chitichotpanya, N Vuthiganond, P Chutasen and T Inprasit. Green production of simultaneous coloration and functional finishing on hemp textiles through dyeing with Diospyros mollis Griff. extract. Journal of Metals, Materials and Minerals 2023; 33(2), 108-119.