Trends
Sci.
2026; 23(8): 12823
Analytical Validation of A 101 Germline miR-SNP Ion AmpliSeq Panel for Breast Cancer-Related Genetic Studies
Thuy
Thi Chung Duong1,3,
![]() ,
Hue Thi Nguyen1,2,3,
,
Hue Thi Nguyen1,2,3,
![]() ,
Nga Thi Nguyen1,3,
,
Nga Thi Nguyen1,3,
![]() ,
,
Luan Huu Huynh1,2,3, Thinh Hung Nguyen4, Tuan Huu Ngoc Nguyen4
and Thanh Thi Ngoc Nguyen1,2,3,*
1Human Genetics Laboratory, Faculty of Biology and Biotechnology, University of Science, Ho Chi Minh, Vietnam
2Department of Physiology and Animal Biotechnology, Faculty of Biology and Biotechnology, University of Science,
Ho Chi Minh, Vietnam
3Vietnam National University, Ho Chi Minh, Vietnam
4Medical Biochemistry & Molecular Biology Department, Fundamental Sciences and Basic Medical Sciences,
Pham Ngoc Thach University of Medicine, Ho Chi Minh, Vietnam
(*Corresponding author’s e-mail: [email protected])
Received: 27 November 2025, Revised: 26 December 2025, Accepted: 2 January 2026, Published: 10 March 2026
Abstract
Massively parallel sequencing (MPS) technology enables simultaneous genotyping of many SNPs across multiple samples with high depth and accuracy. Such technology has become increasingly valuable for studies investigating genetic variants, including miRNA-related SNPs (miR-SNPs), that may contribute to cancer susceptibility. In this study, we designed a customized Ion AmpliSeq panel targeting 101 candidate breast cancer-associated miR-SNPs and evaluated its sequencing performance and analytical reliability on the Ion S5 XL system. Sequencing metrics, including depth of coverage (DoC), locus coverage balance (LCB), frequency of major allele reads (FMAR), and locus strand balance (LSB), were assessed across all loci. Across 50 DNA samples, the sequencing achieved a mean of 85,194 (95% CI: 79,904 - 101,503), with 91.44% (95% CI: 90.68 - 94.45) on-target reads, an average depth of 515.1× (95% CI: 488.9 - 592.9), and uniformity of 88.77% (95% CI: 88.76 - 89.64), indicating high-quality and consistent performance across libraries. Among 101 miR-SNPs, 97 loci yielded valid genotypes, while four loci resulted in no-calls due to low coverage. Genotypes obtained from the customized miR-SNP panel were fully concordant with those verified by Sanger sequencing. The panel demonstrated stable performance and high reproducibility, with consistent variant calling across replicate runs. Furthermore, reliable and complete genotyping profiles were obtained from as little as 1 ng of input DNA. Collectively, these results indicate that the customized miR-SNP MPS panel provides robust analytical performance and high accuracy, supporting its applicability for large-scale genetic and breast cancer association studies.
Keywords: miRNA-SNP, Breast cancer, Ion AmpliSeq, MPS, Genotyping, Validation
Introduction
MicroRNAs (miRNAs) are small non-coding RNAs that play crucial roles in post-transcriptional regulation of gene expression by binding to target messenger RNAs and influencing their stability or translational efficiency [1]. Increasing evidence suggests that dysregulation of miRNAs is implicated in the initiation and progression of various human diseases,
including breast cancer [2,3]. Consequently, miRNAs have attracted growing attention as potential biomarkers for diagnosis, prognosis, and therapeutic response monitoring [4].
Genetic variations within miRNA genes, particularly single nucleotide polymorphisms (miR-SNPs), may influence the maturation, expression, or binding capacity of miRNAs [5]. Such variants can alter downstream regulatory networks, thereby contributing to interindividual differences in cancer susceptibility [6,7]. Numerous association studies have reported that specific miR-SNPs are linked to breast cancer risk, prognosis, and treatment response [8-10]. However, findings across populations remain inconsistent, and many SNPs in miRNA genes have not been systematically investigated.
Massively parallel sequencing (MPS) technology enables comprehensive profiling of genetic abnormalities, including SNP [11,12]. In breast cancer, MPS has been widely applied to characterize driver mutations, identify susceptibility-associated SNPs, and discover novel biomarkers with prognostic or therapeutic value [13,14]. Compared with traditional molecular methods, MPS offers unparalleled sensitivity and resolution, allowing simultaneous interrogation of hundreds of genes across multiple samples [15]. However, conventional MPS platforms often require large batch sizes, extended turnaround times, and dedicated bioinformatics support, which limit their accessibility in many hospital laboratories [16].
Among available platforms, the Ion Torrent S5 System (Thermo Fisher Scientific) enables rapid and flexible targeted sequencing suitable for both research and clinical applications [17]. Its streamlined workflow allows efficient analysis of multiple samples within 24 - 48 h, making it feasible for hospital-based laboratories to implement molecular testing for cancer-associated variants [18].
Despite the growing application of MPS in somatic mutation profiling [19], the analytical validation of germline miR-SNP panels remains underexplored. Only a few studies have evaluated their performance in accordance with established quality frameworks such as those proposed by the Association for Molecular Pathology (AMP), the Clinical and Laboratory Standards Institute (CLSI), or the College of American Pathologists (CAP) [20]. At the same time, the systematic characterization of germline miR-SNPs, particularly in population-based contexts, has been limited [21] . Most previous investigations have focused on a small set of candidate variants, lacking validated tools capable of parallel genotyping across a broader spectrum of miR-SNPs [22-24].
This gap is even more pronounced in Vietnamese populations, for which comprehensive data on germline miR-SNPs and their association with breast cancer risk are largely unavailable [25, 26]. The absence of standardized analytical validation and population-specific data hinders accurate assessment of cumulative genetic effects, gene-gene interactions, and the development of localized risk prediction models.
In this study, we developed a customized MPS panel targeting 101 miR-SNP loci previously implicated in breast cancer based on our prior evidence [27]. Using the Ion S5 XL System, we conducted analytical validation to evaluate sequencing performance, concordance, reliability, and sensitivity of the panel. These assessments aimed to establish whether the assay could generate consistent and accurate results, thereby providing a validated platform for large-scale germline investigations of miR-SNPs and their contribution to breast cancer susceptibility in the Vietnamese population.
Materials and methods
Marker selection and MPS primer design
Candidate SNPs located within the mature miRNA coding regions were selected through a stepwise approach [26]. First, SNPs were retrieved from the miRNASNP-v3 database and cross-validated with dbSNP (MAF > 1%) and miRBase release 22 to confirm genomic coordinates and sequence annotation. Second, functional relevance was assessed using miRDB, where both reference and alternative miRNA sequences were evaluated, and only predicted targets with scores ≥ 80 were retained. KEGG enrichment analysis of these targets in the breast cancer pathway (hsa05224) was further applied to prioritize biologically significant variants. Third, expression data of target genes were examined in the GENT2 database; genes significantly upregulated in tumors (Log2FC > 0, p < 0.05) were defined as oncogenes, whereas those downregulated (Log2FC < 0, p < 0.05) were considered tumor suppressors, allowing classification of corresponding miRNAs as oncogenic or tumor-suppressive. Fourth, priority was given to SNPs located in seed regions or predicted to alter miRNA-target interactions. Binding sites were identified with TargetScan 8.0, and changes in minimum free energy (ΔG) between alleles were used as indicators of altered binding affinity [27]. Finally, only SNPs that allowed successful primer design with amplicon sizes shorter than 200 bp were retained for sequencing.
Based on these criteria, a total of 101 SNPs were chosen to represent functionally relevant variants in mature. miRNA coding regions linked to breast cancer susceptibility. The genomic positions of these SNPs were compiled into a BED file and submitted to the Ion AmpliSeq Designer (Thermo Fisher Scientific, USA; ID: IAD249282, type: 236 accessed on March 18, 2024) for customized panel development. The design was generated using the Ion AmpliSeq Designer database, version 7.81, based on the GRCh38.p2 human reference genome (db = hg38, refGene v99).
Sample preparation
Peripheral blood samples were collected with approval from the Ethics Committee of the Oncology Hospital, Ho Chi Minh City, Vietnam (ethical no: 310/BVUB-HĐĐĐ/2025). Written informed consent was obtained from 50 participants prior to sampling. Genomic DNA was extracted from whole blood using the salting-out method as described by Hue et al. [28] DNA concentration and purity were first assessed by spectrophotometry using a NanoDrop 1000 (Thermo Fisher Scientific, USA), and samples with concentrations below 10 ng/μL were further quantified using a Qubit Fluorometer. DNA samples were stored at –20 °C until amplification.
MPS: Library construction, template preparation, and sequencing
For library preparation, 10 - 20 ng of genomic DNA was processed according to Ion AmpliSeq Designer recommendations using the VAHTS® AmpSeq Library Prep Kit V3 (Vazyme, China). PCR amplification was performed on a 96-well thermal cycler (Bio-Rad) under the following conditions: 99 °C for 2 min; 20 cycles of 99 °C for 15 s and 60 °C for 4 min; followed by 72 °C for 10 min. Amplicons were then partially digested with 2.5 µL VAHTS Digest Mix (50 °C for 10 min, 55 °C for 10 min, and 60 °C for 20 min). Adapter ligation was performed with barcode adapters, ligation enhancer, and DNA ligase at 22 °C for 30 min, followed by 68 °C for 5 min and 72 °C for 10 min. Purified libraries were re-amplified (5 cycles) with the HiFi Amplification Kit (Vazyme), cleaned using DNA Clean Beads, and quantified by the Qubit® dsDNA HS Assay kit (Thermo Fisher Scientific).
A total of 36 libraries were normalized to 30 pM and pooled in equal volumes, and 25 µL of the pooled mixture was loaded for automated template preparation using the Ion 510/520/530 Kit on the Ion Chef System (Thermo Fisher Scientific). Sequencing was performed on the Ion S5 XL platform using an Ion 510 chip, which was selected to provide sufficient throughput (~80 Mb per run) and optimal read length (~200 bp) for targeted SNP analysis.
Sequencing data acquisition and analysis
Library preparation and template loading were performed using the Ion Chef System (IC 5.12.3). Sequencing data were processed using Torrent Suite Software V5.12.3 (Thermo Fisher Scientific) on the Ion S5 XL System. Raw sequence reads were aligned to the human reference genome (hg38) using the Torrent Mapping Alignment Program V5.12.3 with default parameters. Variant calling was performed using the Torrent Variant Caller Plugin V5.12.28 under the germline low-stringency configuration. The Coverage Analysis Plugin V5.12.63 was applied to extract run-level sequencing metrics for each sample [29]. Sequencing quality was assessed according to manufacturer recommendations, with acceptance thresholds of on-target rate ≥ 90%, uniformity ≥ 85%, and mean depth ≥ 500× to ensure high analytical performance for subsequent variant analysis [21,30]
Variants were filtered based on the following key quality criteria: minimum read depth (≥ 20×), base quality score (≥ 20), and mapping quality (≥ 30). Genotypes were assigned based on Variant Allele Frequency (VAF) thresholds as follows: homozygous reference (VAF < 0.1), heterozygous (0.1 ≤ VAF ≤ 0.9), and homozygous alternate (VAF > 0.9) [31].
For data validation, the binary alignment map (BAM) and index (BAI) files were manually inspected using Integrative Genomics Viewer (IGV) v2.19.7 [32] and verified in R v4.5.1 with the Rsamtools and GenomicAlignments packages [33].
Sequencing performance and concordance study
To assess the performance and concordance of the customized germline miRNA-SNP panel for breast cancer risk analysis, Human Reference DNA Female 5190-3797 (Agilent Technologies) together with 50 independent samples were analyzed. Run-level quality metrics, including total mapped reads, on-target percentage, coverage uniformity, mean and median depth of coverage, and the percentage of target regions achieving ≥ 100× and ≥ 2 00× coverage, were extracted.
Sequencing quality and reliability were evaluated using four statistical parameters: depth of coverage (DoC), locus coverage balance (LCB), frequency of major allele reads (FMAR), and locus strand balance (LSB). The DoC, or read depth, was defined as the number of effective reads mapped within each locus. LCB was calculated as the ratio of coverage at a given locus to the average coverage across all loci in a single sample, with an ideal value of 1 indicating uniform amplification. FMAR was calculated as the ratio of reads supporting the major allele to the total reads at each SNP position, expected to range between 90% and 100%. LSB was measured as the proportion of forward strand reads relative to total reads.
To confirm genotype accuracy, genotype calls obtained from the miR-SNP MPS were validated by Sanger sequencing for selected loci showing uncertain or low-confidence calls in the MPS data. Genotype agreement was summarized in a confusion matrix, and analytical accuracy was expressed as percent concordance with corresponding 95% confidence intervals (CI) calculated using the Wilson method.
Analytical performance evaluation
The analytical performance of the customized miR-SNP panel was comprehensively assessed in terms of reliability, sensitivity, stability, and reproducibility.
To evaluate inter-locus reliability, 3 replicates of the reference DNA at an input of 20 ng were sequenced within a single run. The inter-locus balance (ILB) was calculated as the ratio of the lowest to the highest locus coverage, with all replicates processed under identical conditions to minimize run-to-run variation.
Sensitivity was determined using serial dilutions of the reference DNA at input amounts of 20, 5, 1, 0.1 and 0.05 ng, each tested in triplicate. Libraries were constructed using 20 PCR cycles and sequenced in one run to assess the lowest input DNA concentration yielding reliable genotyping results.
Panel stability and reproducibility were further examined using DNA extracted from a single blood sample tested in triplicate. Intra-run repeatability was estimated from ILB values across replicates within the same sequencing run. To assess reproducibility, the same DNA sample was independently processed and sequenced on 2 separate days. All steps, including library preparation and sequencing, were performed using the same instrument and reagent lot. Reproducibility was evaluated as the percentage concordance of genotype calls across all target loci, with a predefined acceptance criterion of ≥ 99%, in accordance with analytical validation guidelines [21].
Results and discussion
Panel design
A total of 101 miR-SNPs were initially selected and submitted to the Ion AmpliSeq Designer (https://www.ampliseq.com/) for custom panel generation. Detailed information for each SNP, including the reference SNP identifier (rsID), chromosomal position based on the hg38 human genome build, and the corresponding mature miRNA symbol, is summarized in Table S1.
The final design comprised a 2-pool DNA panel containing 182 amplicons (91 per pool), achieving 100% target coverage across all 101 miR-SNP loci. Amplicon lengths ranged from 67 to 140 bp, with an average of 117.5 ± 12.8 bp, meeting the design requirements for optimal amplification and sequencing uniformity. Of the 101 SNPs, 18 were covered by a single amplicon, 79 were represented by 2 amplicons distributed across both pools, and 4 were covered by 3 amplicons in each pool (Table S1). This distribution reflects a balanced and redundant design strategy intended to ensure reliable target representation and minimize potential dropout across loci. Within these, 2 SNP pairs located in the same mature miRNA coding regions shared identical amplicon coverage (rs112489955 with rs149912461 in hsa-miR-501-3p, and rs7162033 with rs7183051 in hsa-miR-806), while another pair located in the same pre-miRNA region (rs115772313 in hsa-miR-3130-3p and rs2241347 in hsa-miR-3130-5p) also shared overlapping amplicons (Table S1). Allele frequency analysis revealed that the minor allele frequencies (MAFs) of the targeted miR-SNPs ranged from 0.005 to 0.995 (Table S1). More than half of these SNPs had MAFs above 0.05, indicating common polymorphisms in the KHV population. The remaining loci showed very low or fixed MAFs, reflecting rare variants or allele fixation.
Hierarchical clustering analysis of 101 miR-SNP loci was conducted using pairwise Euclidean distances to evaluate genetic relatedness across miRNA genes (Figure 1). The observed divergence patterns suggest that miRNA-encoding regions harbor varying degrees of polymorphism, which may contribute to their differential roles in gene regulation and disease susceptibility.
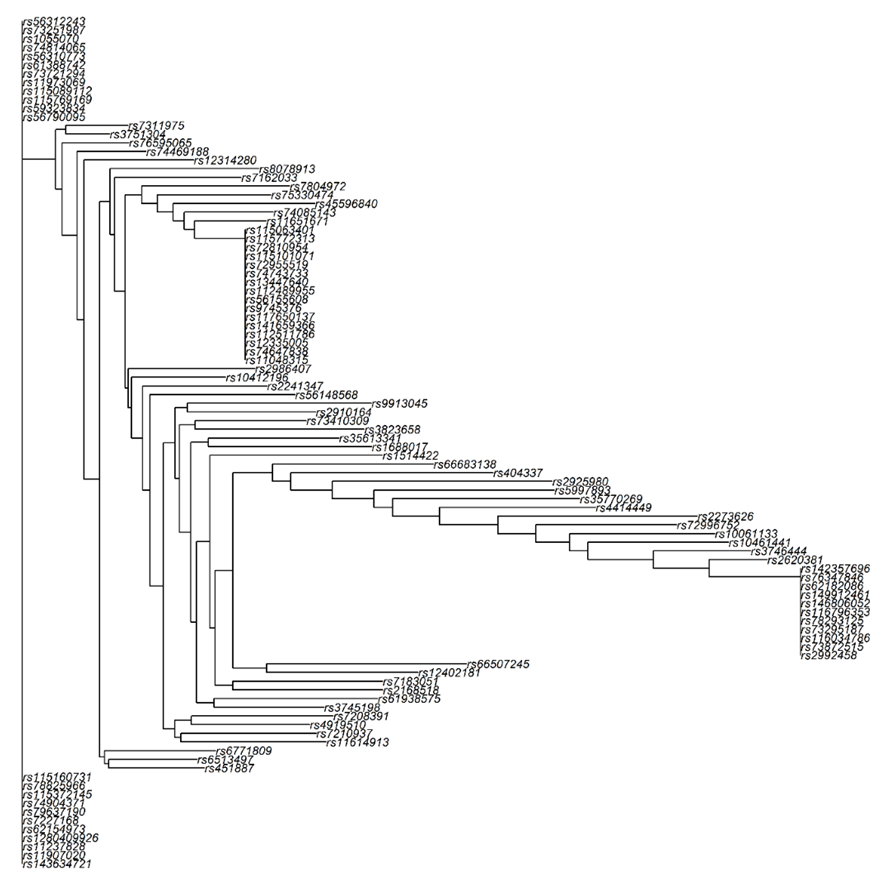
Figure 1 Hierarchical clustering constructed from 101 miR-SNP genotypes.
Performance evaluation of the miR-SNP panel
Sequencing performance of control and sample DNA libraries
Two chips were used to sequence control DNA and 50 sample DNA libraries. Chip 1 generated 6,133,229 reads with 94% ISP loading, while Chip 2 generated 3,475,795 reads with 96% ISP loading (Figure S1). Detailed sequencing metrics are summarized in Table S2. For the control DNA, the mean number of mapped reads was 170,108 (95% CI: 105,750 - 219,237). The proportion of on-target reads was 97.26% (95% CI: 97.24 - 97.29). The mean sequencing depth reached 1077× (95% CI: 670.1 - 1,395), with a uniformity of 88.96% (95% CI: 88.65 - 89.47). For the 50 DNA samples, the mean number of mapped reads was 85,194 (95% CI: 79,904 - 101,503). On-target reads accounted for 91.44% (95% CI: 90.68 - 94.45). The mean sequencing depth was 515.1× (95% CI: 488.9 - 592.9), and uniformity was 88.77% (95% CI: 88.76 - 89.64) (Table 1). Overall, these results demonstrate that the sequencing performance was consistent and of high quality across both control and sample libraries.
Table 1 Summary of sequencing metrics for control and sample DNA libraries.
Sample |
Mean (95% CI) |
||||
Mapped reads |
On-target |
Mean depth |
Uniformity |
|
|
Control DNA |
170,108 (105,750 - 219,237) |
97.26 (97.24 - 97.29) |
(670.1 - 1,395) |
88.96 (88.65 - 89.47) |
|
Sample DNAs |
85,194 (79,904 - 101,503) |
91.44 (90.68 - 94.45) |
515.1 |
88.77 (88.76 - 89.64) |
|
Locus coverage balance
To assess sequencing uniformity, LCB was calculated for all targeted miR-SNPs. As shown in Figure 2, LCB values ranged from 0.00017 ± 0.00083 (rs12473206, hsa-miR-4433a-5p) to 1.164 ± 0.0301 (rs115089112, hsa-miR-580-5p). Most loci achieved an LCB close to the ideal value of 1, indicating balanced allelic representation and consistent sequencing performance across the panel. Four loci, rs72810954, rs12473206, rs266435, and rs2155248, did not meet the quality thresholds, resulting in “No Call” assignments. Among these SNPs, rs72810954 showed low coverage (DoC = 26.15 ± 22.10×) but a balanced allelic distribution. This pattern suggests a higher likelihood of no-call rather than inaccurate genotyping, which may be mitigated by optimizing primer concentration in the library pool. In contrast, the remaining 3 loci failed to amplify, reflecting missing data rather than allelic bias or misgenotyping. These findings collectively support the robustness of the panel design, with only a small subset of loci requiring optimization.
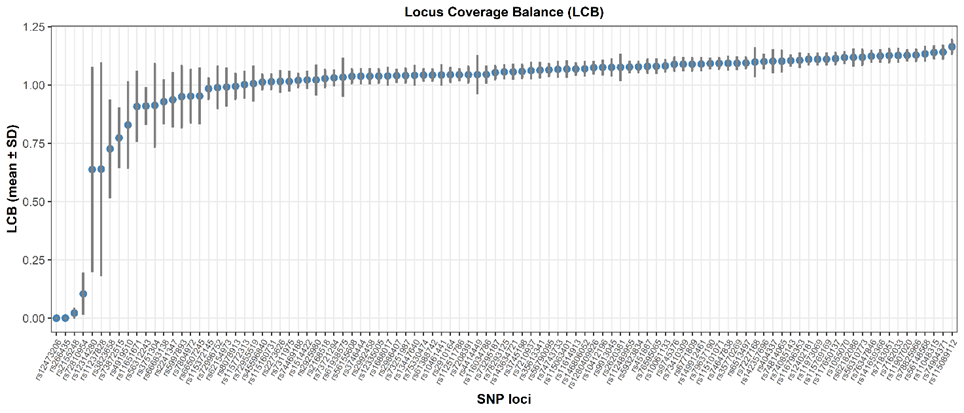
Figure 2 Locus coverage balance of 101 miR-SNP.
Frequency of major allele reads
Given the diploid nature of autosomal miR-SNPs, accurate genotyping was based on FMAR thresholds, with values > 90% required for homozygous calls and ~50% for heterozygous calls. In our dataset, miR-SNPs displayed FMAR values > 90% for homozygous sites and approximately 50% for heterozygous sites, consistent with expected genotypes (Table S3). The only exception was rs11237828 (hsa-miR-5579-3p), which showed an FMAR of 88.89%, slightly below the threshold (Figure 3). Lower sequencing coverage likely accounted for non-allelic genotype calls, leaving 3 miR-SNPs (rs12473206, rs266435, and rs2155248) unclassified (Table 2).
Occasional deviations were observed at loci located near homopolymeric tracts, which are known to affect Ion Torrent sequencing [34]. As summarized in Table 2, 5 SNPs (rs1688017, rs2273626, rs404337, rs78293125, and rs12473206) were situated within or near homopolymeric runs [(6G), (6A), (6C), and 6(C), respectively]. Notably, rs12473206 coincided directly with a homopolymeric (6C) stretch at the SNP position itself. The presence of these homopolymers likely contributed to minor read misalignment, particularly evident at rs2273626, as detailed in Table S3.
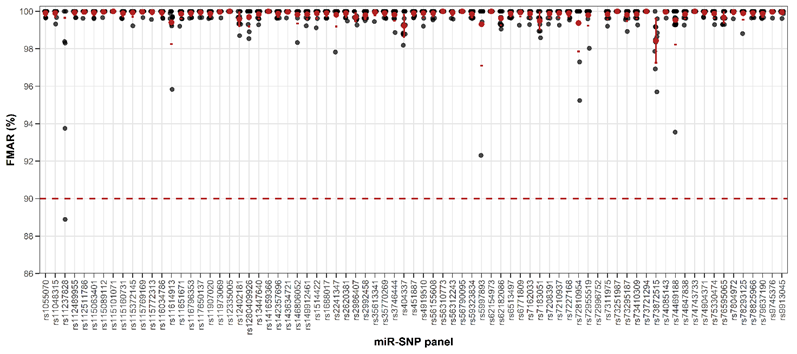
Figure 3 Allelic performance of homozygous miR-SNPs.
Locus strand balance
LSB defined as the proportion of forward strand coverage relative to total coverage, was used to assess the uniformity of sequencing reads between strands. The average LSB across all miR-SNP loci was 0.4858 ± 0.1403, indicating an overall balanced strand representation. Most loci fell within the acceptable range of 0.25 - 0.75, suggesting minimal strand-specific bias.
Apart from 3 loci with low total coverage, five SNPs displayed mild strand imbalance, including rs62154973 (hsa-miR-4772-5p), rs66507245 (hsa-miR-4731-3p), rs73872515 (hsa-miR-548t-3p), rs3823658 (hsa-miR-5090), and rs8078913 (hsa-miR-4520-3p) (Figure 4). This imbalance may be partially attributed to the presence of homopolymeric tracts on either the forward or reverse strands, which can interfere with nucleotide extension efficiency during sequencing reactions.
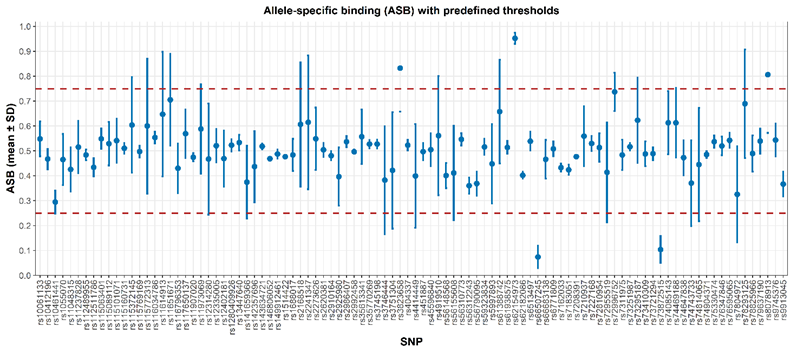
Figure 4 Distribution of Amplicon strand bias values across miR-SNP panel.
Concordance study
Using the customized miR-SNP panel, 97 out of 101 targeted loci were successfully sequenced in both the control DNA and 50 unrelated female samples. Following data processing and variant calling, high-quality genotypes were obtained for these 97 loci, while four loci with low coverage were assigned a no-call status.
To further assess genotyping accuracy, ten representative SNPs showing uncertain allele calls, homopolymeric interference, or mild strand bias were selected for validation by Sanger sequencing. Primer details are provided in Table S4. The Sanger sequencing results were fully consistent with those obtained from the customized panel (Table 2, Figure S2). Based on these findings, both the sensitivity and specificity for these ten loci were calculated to be 100% (95% CI: 72.3% - 100%).
Collectively, these results confirm the analytical reliability and robustness of the customized miR-SNP panel. The panel accurately genotypes multiple loci, including those located in technically challenging regions such as homopolymeric tracts or unbalanced amplicons.
Table 2 Problematic miR-SNPs identified through analyses.
MiRNA |
SNP |
Flanking Sequence (±15 bp) |
Performance |
Genotype by MPS |
Genotype by Sanger |
hsa-miR-1304-3p |
rs2155248 |
AGCCCAGGGGTTCGA[G/A/C/T]GCTACAGTGAGATGT |
Low coverage |
NN |
NA |
hsa-miR-4804-5p |
rs266435 |
GTCAGTGTATTTGGA[C/A/G/T]GGTAAGGTTAAGC |
Low coverage |
NN |
NA |
hsa-miR-4679 |
rs72810954 |
TGTTAGAAACAAAAA[G/A]CAAAGAATCTCTATC |
Low coverage |
NN |
NA |
hsa-miR-4433a-5p |
rs12473206 |
TTACGTCCCACCCCC[C/A/G/T]ACTCCTGTTTCTGGT |
Low coverage, homopolymer (6C) |
NN |
NA |
hsa-miR-5579-3p |
rs11237828 |
GGTGATTTGATCTGG[T/C]ACTCCTTAAGCTAAT |
Uncertain allele call (FMAR < 90%) |
NN |
TT |
hsa-miR-4772-5p |
rs62154973 |
AGGCAAAATTGCAGA[C/T]TGTCTTCCCAAATAG |
Strand bias |
CC |
CC |
hsa-miR-4731-3p |
rs66507245 |
AGTGTTGGGGGCCAC[T/A/C]TGTGTGTGGATGACT |
Strand bias |
TA |
TA |
hsa-miR-548t-3p |
rs73872515 |
TTTTTAATGACAAAA[A/C]CCACAATTACTTTTG |
Strand bias |
AA |
AA |
hsa-miR-5090 |
rs3823658 |
CCTTCTGAGGTACCC[G/A/T]GGGCAGATTGGTGTA |
Strand bias |
GA |
GA |
hsa-miR-4520-3p |
rs8078913 |
GGTTGATTCCTTCTT[C/A/G/T]CTGCGTGTTTTCTGT |
Strand bias |
CT |
|
hsa-miR-4707-3p |
rs2273626 |
GAACCTCGGCTGGGG[C/A/T]GGGCTGGCCAGCAGC |
Homopolymer (7G) |
CA |
CA |
hsa-miR-6887-5p |
rs1688017 |
ATGGGGGGACAGATG[G/A]AGAGGACACAGGCTG |
Homopolymer (6G) |
GG |
GG |
hsa-miR-8084 |
rs404337 |
TAAATAGAATACTAA[G/A/T]TAAAAAATCAGTATG |
Homopolymer (6A) |
AA |
AA |
hsa-miR-6885-5p |
rs78293125 |
TGGCTTTGCTTGCGC[A/G]GTGCCCCCCTCCAGG |
Homopolymer (6C) |
AA |
NN: No call; NA: Not Applicable.
Reliability study
The performance of the customized SNP panel using MPS was further examined through reproducibility and repeatability testing using Control DNA. Consistent and complete genotype calls were obtained from all sequencing runs with 20 ng input DNA. In the reliability evaluation, except for five SNPs (rs12473206, rs266435, rs2155248, rs11237828 and rs72810954), 3 independent replicates of reference DNA generated concordant results across all analyzed loci, with mean DoC of 846.1 ± 464.7×, 1,491 ± 988.1× and 1,770 ± 970× (Table S5). Inter-locus balance, defined as the ratio between the lowest and highest-covered loci, was also assessed among these replicates. Except for 3 non-amplified loci (rs12473206, rs266435 and rs2155248), the locus rs72810954 exhibited the lowest DoC (31.00 ± 8.72×), while rs116034786 showed the highest mean DoC (2,985 ±1,282×). These observations were in line with the general sequencing performance trends described above.
Sensitivity study
Serial dilutions of control DNA (20, 5, 1, 0.1 and 0.05 ng) were analyzed to evaluate the impact of template quantity on genotype calling rate and sequencing depth under standard library preparation conditions (20 PCR cycles). Concordant genotype rates were 96.67% (95% CI: 90 - 100) for 20 ng, 97.78% (95% CI: 96.67 - 100) for 5 ng, 100% (95% CI: 100 - 100) for 1 ng, 76.67% (95% CI: 30 - 100) for 0.1 ng, and 90.00% (95% CI: 80.00 - 96.67) for 0.05 ng (Figure 5(a)). Full genotype profiles were achievable at 1 ng, although coverage at some loci was slightly reduced compared with higher inputs (20 and 5 ng). Below 1 ng, both genotype calling rate and mean sequencing depth progressively declined (Figures 5(a) and 5(c)). At 0.1 ng, concordant genotype rates varied substantially among replicates (100%, 100% and 30%), suggesting stochastic amplification and allelic dropout at ultra-low template levels. The apparent recovery observed at 0.05 ng likely reflects random variation rather than true assay robustness. Overall, DNA inputs below 1 ng showed inconsistent performance due to limited template availability and amplification bias.
Logistic regression modeling demonstrated a statistically significant positive association between DNA input and probability of correct genotype calls (β = 0.103, p = 0.012). The model indicated that DNA inputs ≥ 1 ng were sufficient to achieve ≥ 95% callability (Figure 5(b)). In contrast, inputs below 1 ng were associated with reduced coverage and an increased risk of false-negative calls, particularly at 0.1 - 0.05 ng. Segmented regression identified a breakpoint at 0.99 ng, with stable genotype concordance above this threshold and a sharp decline below it. Moreover, sequencing coverage showed a strong positive correlation with input DNA amount (Pearson’s r = 0.89) (Figure 5(d)).
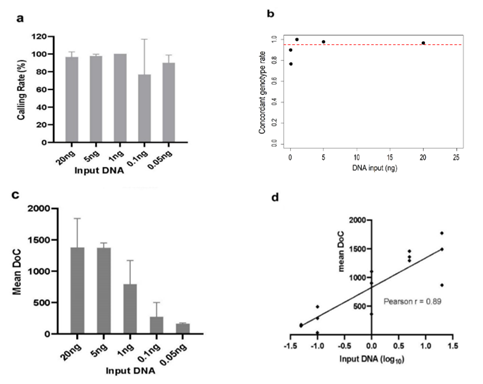
Figure 5 Sensitivity analysis using serial dilutions of control DNA; (a) Variant calling rate, (b) Logistic curve of genotype callability by DNA input, (c) Mean coverage depth and (d) Correlation between input DNA amount and mean coverage depth.
Stability and reproducibility study
To assess the consistency of the customized 101 miR-SNP panel, a blood sample was sequenced in 3 independent replicates. Except for rs12473206, rs266435, rs2155248 and rs72810954, complete genotype profiles were obtained across all runs, and the results were concordant across the 101 loci examined (Table S6). The mean DoC was 1,737 ± 1,122×, 1,892 ± 984× and 902.6 ± 493.6× in the 3 replicates. Similarly, the calling rates were comparable between replicates (97.03%, 96.04% and 96.04%), indicating consistent sequencing performance.
The intraclass correlation coefficient (ICC) and Bland-Altman plot were used to evaluate the reproducibility of sequencing depth between 2 independent runs. Complete genotype profiles were successfully obtained for all loci across both sequencing runs, except for five miR-SNPs (rs11237828, rs12473206, rs2155248, rs266435 and rs72810954) that exhibited low coverage (Table S7). The mean depth and calling rate were highly comparable between Run 1 (mean DoC = 232.6 ± 62.82×; callability = 95.05%) and Run 2 (mean DoC = 152.1±73.73×; callability = 95.05%) (Table S7), suggesting consistent sequencing performance. The single-measure ICC for fixed raters (ICC (3,1) was 0.70 (95% CI: 0.59 - 0.79), indicating good consistency between runs (Table 3). When the mean value of both runs was considered (ICC (3,2), the reproducibility improved to 0.83 (95% CI: 0.74 - 0.88) (Table 3), demonstrating high reliability of depth measurements across sequencing runs. As shown in Figure 6, the Bland-Altman plot illustrates that most data points fell within the 95% limits of agreement, with a minimal mean bias between Run 1 and Run 2, indicating no substantial systematic deviation.
Table 3 Inter-run reproducibility of sequencing depth between 2 independent runs.
Type |
ICC |
F |
df1 |
df2 |
p_value |
Lower bound |
Upper bound |
ICC(3,1) |
0.70 |
5.77 |
100 |
100 |
3.59E-17 |
0.59 |
0.79 |
ICC(3,2) |
0.83 |
5.77 |
100 |
100 |
3.59E-17 |
0.74 |
0.88 |
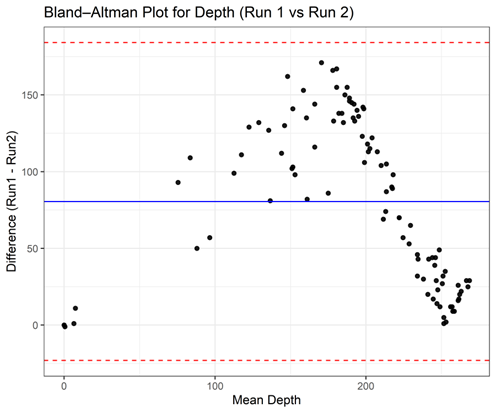
Figure 6 Bland-Altman plot showing agreement of sequencing depth between 2 independent runs.
Together, these findings confirm that the custom 101-miR-SNP AmpliSeq panel yields consistent sequencing performance across runs. The high reproducibility of depth measurements suggests that the assay is technically robust and suitable for downstream applications, including large-scale case–control studies assessing germline miR-SNP associations with breast cancer risk.
Compared with conventional genotyping methods such as SNaPshot or single-plex PCR–based assays, the customized MPS panel allows simultaneous interrogation of a larger number of loci [35], thereby improving throughput and operational efficiency. By contrast, most commercially available SNP panels are optimized for ancestry inference or somatic mutation profiling [36]. The present panel was specifically designed to target germline miR-SNPs with potential relevance to breast cancer. As such, it fulfills a distinct methodological need in population-based genetic association studies.
Nevertheless, four loci exhibited suboptimal performance. In particular, rs72810954 showed consistently low coverage, suggesting that further optimization may be required. Adjusting primer concentrations within the multiplex library preparation could improve its amplification efficiency. In contrast, 3 loci failed to amplify reproducibly and were therefore excluded from downstream analyses. Future panel optimization may incorporate redesigned primers or alternative amplicon strategies to improve overall locus coverage.
Conclusions
In this study, we developed and validated a custom MPS assay targeting 101 miR-SNPs previously reported to be associated with breast cancer. Sequencing on the Ion S5 XL System demonstrated high accuracy and resolution across nearly all loci, with four showing suboptimal performance. The assay also achieved stable and reproducible results with as little as 1 ng of input DNA. Overall, the customized miR-SNP MPS panel represents a robust and reliable tool for high-throughput genotyping in breast cancer association studies.
Acknowledgements
This research is funded by Vietnam National University, Ho Chi Minh City (VNU-HCM), Vietnam under grant number 562-2024-18-11.
Declaration of Generative AI in Scientific Writing
We acknowledge the use of ChatGPT (OpenAI) to assist in improving the English language and readability of the manuscript. No content generation or data interpretation was performed by AI. The authors take full responsibility for the content and conclusions of this work.
CRediT Author Statement
Thuy Thi Chung Duong: Conceptualization, Data curation, Investigation, Methodology, Software, Writing -original draft. Hue Thi Nguyen: Conceptualization, Methodology, Data curation, Software, Supervision, Writing -review & edicting. Nga Thi Nguyen: Conceptualization, Investigation, Methodology, Visualization, Writing -review & edicting. Luan Huu Huynh: Conceptualization, Investigation, Methodology, Software, Writing -review & edicting. Thinh Hung Nguyen: Conceptualization, Investigation, Formal analysis, Software, Writing -review & edicting. Tuan Huu Ngoc Nguyen: Conceptualization, Investigation, Formal analysis, Software, Writing -review & edicting. Thanh Thi Ngoc Nguyen: Conceptualization, Methodology, Data curation, Software, Resource, Validation, Project administration, Writing - review & edicting.
References
[1] S Ding and P Wang. The life of microRNAs: Biogenesis, function and decay in cancer. Biomolecules 2025; 15(10), 1393.
[2] A Syeda, SSS Langden, C Munkhzul, M Lee and SJ Song. Regulatory mechanism of microRNA expression in cancer. International Journal of Molecular Sciences 2020; 21(5), 1723.
[3] HY Loh, BP Norman, KS Lai, N Rahman, NBM Alitheen and MA Osman. The regulatory role of microRNAs in breast cancer. International Journal of Molecular Sciences 2019; 20(19), 4940.
[4] W Jelski, S Okrasinska and B Mroczko. MicroRNAs as biomarkers of breast cancer. International Journal of Molecular Sciences 2025; 26(9), 4395.
[5] S Chauhan, R Mathur and AK Jha. The impact of microRNA SNPs on breast cancer: Potential biomarkers for disease detection. Molecular Biotechnology 2024; 67(3), 845-861.
[6] Y Chhichholiya, AK Suryan, P Suman, A Munshi and S Singh. SNPs in miRNAs and target sequences: Role in cancer and diabetes. Frontiers in Genetics 2021; 12, 793523.
[7] Y Wang and GC Hon. Towards functional maps of non-coding variants in cancer. Frontiers in Genome Editing 2024; 6, 1481443.
[8] T Arancibia, S Morales-Pison, E Maldonado and L Jara. Association between single-nucleotide polymorphisms in miRNA and breast cancer risk: An updated review. Biological Research 2021; 54(1), 26.
[9] T Kongton, S Sanguansin, P Saelee, A Thongmee and W Pongstaporn. The association of pri-miR34 b/c gene polymorphism and clinicopathologic data in breast cancer patients. Asian Pacific Journal of Cancer Prevention 2024; 25(7), 2415-2420.
[10] G Hina, N Khan, ST Muntaha, A Ullah, S Khan, A Alanzi, I Ali and T Chen. Association analysis of miRNA-146a and miRNA-196a polymorphism with breast cancer risk in Khyber Pakhtunkhwa, Pakistan: A preliminary study. Molecular Biology Reports 2024; 51(1), 827.
[11] AM McInerney-Leo and EL Duncan. Massively parallel sequencing for rare genetic disorders: Potential and pitfalls. Frontiers in Endocrinology 2020; 11, 628946.
[12] F Guo, J Yu, L Zhang and J Li. Massively parallel sequencing of forensic STRs and SNPs using the Illumina® ForenSeq™ DNA Signature Prep kit on the MiSeq FGx™ Forensic Genomics system. Forensic Science International: Genetics 2017; 31, 135-148.
[13] CKY Ng, AM Schultheis, FC Bidard, B Weigelt and JS Reis-Filho. Breast cancer genomics from microarrays to massively parallel sequencing: Paradigms and new insights. Journal of the National Cancer Institute 2015; 107(5), djv015.
[14] C Kraus, J Hoyer, G Vasileiou, M Wunderle, MP Lux, PA Fasching, M Krumbiegel, S Uebe, M Reuter, MW Beckmann and A Reis. Gene panel sequencing in familial breast/ovarian cancer patients identifies multiple novel mutations also in genes others than BRCA1/2. International Journal of Cancer 2017; 140(1), 95-102.
[15] JR Bradford, Y Hey, T Yates, Y Li, SD Pepper and CJ Miller. A comparison of massively parallel nucleotide sequencing with oligonucleotide microarrays for global transcription profiling. BMC Genomics 2010; 11(1), 282.
[16] LJ Semenuk, BA Kartolo, HE Feilotter, SM Lee, CA Savage, AH Boag, GC Digby and M Mates. Implementing next-generation sequencing process changes to increase capacity and improve timeliness of molecular biomarker profiling for lung cancer patients. The Journal of Applied Laboratory Medicine 2023; 9(2), 284-294.
[17] S Shin, Y Kim, SC Oh, N Yu, ST Lee, JR Choi and KA Lee. Validation and optimization of the Ion Torrent S5 XL sequencer and Oncomine workflow for BRCA1 and BRCA2 genetic testing. Oncotarget 2017; 8(21), 34858-34866.
[18] M Mehrotra, DY Duose, RR Singh, BA Barkoh, J Manekia, MA Harmon, KP Patel, MJ Routbort, LJ Medeiros, II Wistuba and R Luthra. Versatile ion S5XL sequencer for targeted next generation sequencing of solid tumors in a clinical laboratory. PLoS One 2017; 12(8), e0181968.
[19] M Ivanov, K Laktionov, V Breder, P Chernenko, E Novikova, E Telysheva, S Musienko, A Baranova and V Mileyko. Towards standardization of next-generation sequencing of FFPE samples for clinical oncology: Intrinsic obstacles and possible solutions. Journal of Translational Medicine 2017; 15(1), 22.
[20] T Huebner, M Steffens and C Scholl. Current status of the analytical validation of next generation sequencing applications for pharmacogenetic profiling. Molecular Biology Reports 2023; 50(11), 9587-9599.
[21] LJ Jennings, ME Arcila, C Corless, S Kamel-Reid, IM Lubin, J Pfeifer, RL Temple-Smolkin, KV Voelkerding and MN Nikiforova. Guidelines for validation of next-generation sequencing-based oncology panels: A joint consensus recommendation of the Association for Molecular Pathology and College of American Pathologists. The Journal of Molecular Diagnostics 2017; 19(3), 341-365.
[22] JT Bensen, CK Tse, SJ Nyante, JS Barnholtz-Sloan, SR Cole and RC Millikan. Association of germline microRNA SNPs in pre-miRNA flanking region and breast cancer risk and survival: The carolina breast cancer study. Cancer Causes & Control 2013; 24(6), 1099-1109.
[23] D Chacon-Cortes, RA Smith, LM Haupt, RA Lea, PH Youl and LR Griffiths. Genetic association analysis of miRNA SNPs implicates MIR145 in breast cancer susceptibility. BMC Medical Genetics 2015; 16, 107.
[24] J Gong, Y Tong, HM Zhang, K Wang, T Hu, G Shan, J Sun and AY Guo. Genome-wide identification of SNPs in microRNA genes and the SNP effects on microRNA target binding and biogenesis. Human Mutation 2012; 33(1), 254-263.
[25] LH Huu, T Nguyen and N Hue. Association between single nucleotide polymorphism rs4919510 (c > g) in miRNA-608 and breast cancer in Vietnamese population. International Research Journal of Obstetrics and Gynecology 2019; 2, 11.
[26] TTH Minh, NTN Thanh, TV Thiep and NT Hue. Association between single nucleotide polymorphism rs11614913 (C>T) on miR-196a2 and breast cancer in Vietnamese population. In: TV Van, TAN Le and TN Duc (Eds.). 6th international conference on the development of biomedical engineering in Vietnam (BME6). Springer, Singapore, 2018, p. 381-386.
[27] TTN Thi Ngoc Nguyen, THN Nguyen, LH Huynh, HN Phan and HT Nguyen. Predicting SNPs in mature microRNAs dysregulated in breast cancer. In: L Tutar (Ed.). Recent advances in noncoding RNAs. IntechOpen, London, 2022.
[28] NT Hue, NDH Chan, PT Phong, NTT Linh and NDT Giang. Extraction of human genomic DNA from dried blood spots and hair roots. International Journal of Bioscience, Biochemistry and Bioinformatics 2012; 2(1), 21-26.
[29] S Roy, C Coldren, A Karunamurthy, NS Kip, EW Klee, SE Lincoln, A Leon, M Pullambhatla, RL Temple-Smolkin, KV Voelkerding, C Wang and AB Carter. Standards and guidelines for validating next-generation sequencing bioinformatics pipelines: A joint recommendation of the Association for Molecular Pathology and the College of American Pathologists. The Journal of Molecular Diagnostics 2018; 20(1), 4-27.
[30] TF Scientific. Ion AmpliSeq™ designer performance specifications for custom DNA panel, Available at: https://www.ampliseq.com/otherContent/help-content/help_html/GUID-5193AC77-0A80-488E-B26A-1CD138BE1D21.html?utm_source=chatgpt.com, accessed October 2025.
[31] F Muyas, M Bosio, A Puig, H Susak, L Domènech, G Escaramis, L Zapata, G Demidov, X Estivill, R Rabionet and S Ossowski. Allele balance bias identifies systematic genotyping errors and false disease associations. Human Mutation 2019; 40(1), 115-126.
[32] H Thorvaldsdóttir, JT Robinson and JP Mesirov. Integrative Genomics Viewer (IGV): High-performance genomics data visualization and exploration. Briefings in Bioinformatics 2012; 14(2), 178-192.
[33] W Huber, VJ Carey, R Gentleman, S Anders, M Carlson, BS Carvalho, HC Bravo, S Davis, L Gatto, T Girke, R Gottardo, F Hahne, KD Hansen, RA Irizarry, M Lawrence, MI Love, J MacDonald, V Obenchain, AK Oleś, H Pagès, A Reyes, …, M Morgan. Orchestrating high-throughput genomic analysis with Bioconductor. Nature Methods 2015; 12(2), 115-121.
[34] LM Bragg, G Stone, MK Butler, P Hugenholtz and GW Tyson. Shining a light on dark sequencing: Characterising errors in Ion Torrent PGM data. PLoS Computational Biology 2013; 9(4), e1003031.
[35] D Ballard, J Winkler-Galicki and J Wesoły. Massive parallel sequencing in forensics: Advantages, issues, technicalities, and prospects. International Journal of Legal Medicine 2020; 134(4), 1291-1303.
[36] I Avent, AG Kinnane, N Jones, I Petermann, R Daniel, ME Gahan and D McNevin. The QIAGEN 140-locus single-nucleotide polymorphism (SNP) panel for forensic identification using massively parallel sequencing (MPS): An evaluation and a direct-to-PCR trial. International Journal of Legal Medicine 2019; 133(3), 677-688.