
Trends
Sci.
2026;
23(9):
13444
The Dynamic Changes of Chlorogenic Acids and Alkaloids in Coffee Processing and Brewing: A Systematic Literature Review
Nazwa Nurhaliza1,2, Dian Herawati1,2 and Nuri Andarwulan1,2,*
1Division of Food Science and Technology, Faculty of Engineering and Technology, IPB University,
IPB Dramaga Campus, Bogor 16680, Indonesia
2South-East Asia Food & Agricultural Science and Technology (SEAFAST) Center, IPB University,
IPB Dramaga Campus, Bogor 16680, Indonesia
(*Corresponding author’s e-mail: [email protected])
Received: 25 January 2026, Revised: 26 March 2026, Accepted: 2 April 2026, Published: 15 April 2026
Abstract
Coffee is one of the most consumed beverages worldwide, and its quality and health-related properties are strongly influenced by bioactive compounds such as chlorogenic acids (CQAs) and alkaloids (caffeine, trigonelline, theobromine). Their concentrations vary considerably depending on processing steps, including postharvest, roasting, and brewing. This systematic review, conducted following PRISMA 2020 guidelines, evaluated the stability and changes of CQAs and alkaloids in Arabica (Coffea arabica) and Robusta (Coffea canephora) across green beans, roasted beans, and brewed coffee. Articles were retrieved from multiple databases using specific keywords, and quantitative data were extracted and analyzed using Microsoft Excel and R Studio. Results showed that Arabica green beans contained 12.50 - 160.10 mg/g CQAs, which de-creased by up to 99% after roasting and brewing, while Robusta initially contained 32.10 - 185.60 mg/g with reductions of 56% - 92%. Caffeine was more stable, averaging 22.15 ± 15.22 mg/g in Arabica and 45.58 ± 22.14 mg/g in Robusta green beans, with moderate reductions through processing. Trigonelline consistently decreased by 80% - 94% in Ara-bica and 68% - 77% in Robusta, while theobromine remained at low levels with further reductions. Overall, roasting and brewing significantly degrade CQAs and trigonelline, while caffeine shows relative stability, providing insight into processing strategies that may optimize coffee’s bioactive profile.
Keywords: Caffeine, Chlorogenic acids, Coffea arabica, Coffea canephora, Trigonelline, Theobromine, Roasting, Brewing
Abbreviations
a.s.l Above sea level
CQAs Total chlorogenic acids
CQA Chlorogenic acid
Cf Caffeine
 Concentration
initial
Concentration
initial
 Concentration
final
Concentration
final
DAD Diode Array Detector
diCQA Dicaffeoylquinic acids
db Dry basis
HPLC High-Performance Liquid Chromatography
Med Median
Min Minimal
PDA Photodiode Array
PRISMA Preferred Reporting Items for Systematic Reviews and Meta-Analyses
SD Standard Deviation
Tr Trigonelline
Th Theobromine
UV Ultra Violet
Introduction
Coffee is one of the most widely consumed and traded food commodities in the world, ranking second only to oil in terms of global trade [1]. Beyond its economic importance, coffee has attracted increasing scientific attention due to its complex chemical composition and its potential implications for human health and sensory quality. In recent years, growing consumer demand for specialty coffee, functional beverages, and evidence-based health claims has intensified the need to understand how bioactive compounds dynamically change throughout the coffee processing chain. In the 2023/2024 period, Arabica coffee production reached 102.2 million 60 kg bags, while Robusta accounted for 75.8 million 60 kg bags [2]. These 2 species differ significantly in cultivation conditions and chemical characteristics. Arabica is typically cultivated at higher altitudes (1,000 - 2,000 m a.s.l.) and is appreciated for its smooth and complex flavor, while Robusta is more tolerant to lower altitudes (400 - 700 m a.s.l.), produces a more bitter taste, and contains higher levels of caffeine [1,3].
The functional and sensory qualities of coffee are strongly influenced by its bioactive compounds, primarily chlorogenic acids (CQAs) and alkaloids such as caffeine, trigonelline, and theobromine. Chlorogenic acids are esters of hydroxycinnamic acids (caffeic, ferulic, or p-coumaric acid) and quinic acid, accounting for approximately 4% - 12% of dry weight depending on species and origin [4]. Importantly, these compounds are chemically unstable and do not remain static; their concentrations continuously change in response to environmental exposure, fermentation, thermal treatment, and extraction conditions. CQAs are susceptible to degradation through isomerization, pyrolysis, hydrolysis into quinic acid, and further transformation into phenolic derivatives during roasting [5]. They contribute to antioxidant capacity, acidity, and bitterness, while also being associated with potential protective effects against metabolic disorders [6].
Caffeine, a purine alkaloid derived from xanthine, ranges from 0.9% - 1.3% in Arabica and 1.5% - 2.5% in Robusta [4]. Unlike CQAs, caffeine is relatively thermally stable, although slight reductions under severe roasting have been reported [7,8]. Trigonelline, a niacin-related alkaloid, occurs at higher levels in Arabica (0.6% - 2.0%) compared to Robusta (0.6% - 0.7%) [4]. During roasting, trigonelline undergoes degradation to form volatile compounds such as pyridines and nicotinic acid, contributing to aroma formation [7]. Theobromine is present in smaller amounts and exhibits inconsistent behavior during roasting, with some studies reporting increases due to demethylation reactions and others reporting degradation [9,10]. These transformations demonstrate that alkaloids and CQAs follow distinct kinetic pathways across processing stages, leading to complex compositional shifts rather than simple linear degradation trends.
Post-harvest processing (dry, semi-washed, or full-washed methods) significantly influences the bioactive profile of green coffee beans. Extended fermentation and soaking steps may promote leaching, enzymatic hydrolysis, and oxidation of CQAs and alkaloids [10-12]. Environmental variables such as altitude, rainfall, temperature, and soil composition further modulate precursor accumulation [13]. Thus, the chemical composition of coffee reflects a continuous transformation process that begins with cultivation conditions and extends through post-harvest, roasting, and ultimately brewing.
Roasting represents the most critical transformation stage in shaping the chemical and sensory characteristics of coffee. During roasting, complex thermochemical reactions occur, including Maillard reactions, caramelization, Strecker degradation, and pyrolysis, which collectively reshape the chemical matrix of coffee beans [14]. Chlorogenic acids may decrease by more than 80% - 90% at dark roast levels [8,15], partly due to conversion into chlorogenic acid lactones and other volatile compounds. The degradation of trigonelline contributes to the formation of volatile compounds associated with aroma complexity [9], whereas caffeine remains comparatively stable under thermal conditions [8,15,16]. These chemical transformations directly influence sensory attributes such as bitterness, aroma complexity, and body, and may also affect physiological activity, as degradation products can exhibit different bioavailability or bioactivity compared with their precursor compounds.
Brewing further determines the final concentration of bioactives in the cup. Extraction efficiency depends on physicochemical parameters such as water temperature, pressure, grind size, brewing time, and coffee-to-water ratio [17]. High-temperature percolation methods may accelerate extraction kinetics of CQAs and alkaloids, whereas cold brew methods favor selective extraction of less polar compounds. Consequently, variations in brewing conditions generate substantial variability in reported compound concentrations.
Despite numerous studies, reported values for chlorogenic acid and alkaloids vary widely across studies. This variation is not only biological but also methodological. Differences in roast classification, analytical approach, reporting units (mg/g, %, mg/mL), moisture correction, and extraction basis often hinder direct comparisons. Some studies report concentrations per dry weight of coffee beans, others per brew volume, and some studies do not include green coffee bean composition as a reference at all. As a result, data are sometimes contradictory, particularly regarding the optimal roasting or brewing conditions for maximizing retention of bioactive compounds.
Although several narrative reviews have discussed coffee bioactives, there is currently no systematic review that quantitatively harmonizes concentration data across all major processing stages from post-harvest treatment to roasting and brewing while simultaneously comparing Arabica and Robusta. Existing reviews generally focus on health effects roasting chemistry or individual compounds rather than integrating the full transformation pathway [14,18]. In addition previous reviews rarely address data standardization challenges or evaluate methodological heterogeneity among studies which limits their ability to draw robust comparative conclusions. This gap highlights the need for a structured quantitative synthesis approach.
The present systematic review therefore aims to systematically collect and harmonize reported concentrations of chlorogenic acids and major alkaloids across processing stages analyze compositional shifts along the transit pathway from green bean to brewed coffee and identify key processing parameters influencing compound stability. Unlike narrative summaries this review applies unit standardization and cross stage comparison to improve interpretability of heterogeneous datasets.
The inclusion of studies within a defined recent timeframe was intended to ensure that the data reflect contemporary analytical standards in compound quantification, where improvements in separation efficiency, detection sensitivity, and validation rigor have enhanced measurement accuracy and reproducibility. By synthesizing data generated under these more consistent conditions and harmonizing concentrations across species and processing stages, this study provides a quantitative integration that moves beyond descriptive reporting toward a more coherent understanding of bioactive transformation in coffee processing.
Materials and methods
Literature search
This review followed Preferred Reporting Items for Systematic Reviews and Meta-Analyses (PRISMA) 2020 guidelines [19] with precisely specified keywords, inclusion criteria, and exclusion criteria. The review protocol was not registered in PROSPERO because the study does not evaluate clinical outcomes; however, the methodology followed PRISMA 2020 guidelines with predefined eligibility criteria and extraction strategy. The systematic screening process resulted in the inclusion of 50 eligible articles, as illustrated in the PRISMA flowchart (Figure 1).

Figure 1 PRISMA (Preferred Reporting Items for Systematic Reviews and Meta-Analyses) flow diagram illustrating the systematic literature selection process for this review. 50 Articles included in the review presents 242 data points in the content of total chlorogenic acids (3-CQA, 4-CQA, 5-CQA, 3,4-diCQA, 3,5-diCQA, 4,5-diCQA) and alkaloids (caffeine, trigonelline, theobromine) of Arabica and Robusta Coffee. The list of articles included in the review is presented in supplementary materials.
Further data is processed and analyzed using Microsoft Excel 2021 and R Studio. All studies including data present data about chlorogenic acids (3-CQA, 4-CQA, 5-CQA, 3,4-diCQA, 3,5-diCQA, 4,5-diCQA) and alkaloids (caffeine, trigonelline, theobromine) in Arabica and Robusta Coffee. The unit used for data processed is mg/g dry basis, with some studies requiring unit conversion. Publication searches were conducted using several scientific databases and search engines, including Google Scholar, ScienceDirect, Springer, MDPI, and PubMed, using specific keywords. ResearchGate was used only as a supplementary platform to access full-text articles that had already been identified through these databases. The keyword list is presented in Table 1. Inclusion and Exclusion Criteria are presented in Table 2.
Table 1 Specific keywords and search terms used in the database search
No |
Keyword |
1 |
Coffea arabica “AND” postharvest “AND” chlorogenic acid “OR” caffeine “OR” trigonelline “OR” theobromine |
2 |
Arabica coffee “AND” postharvest “AND” chlorogenic acid “OR” caffeine “OR” trigonelline “OR” theobromine |
3 |
Coffea canephora “AND” postharvest “AND” chlorogenic acid “OR” caffeine “OR” trigonelline “OR” theobromine |
4 |
Robusta coffee “AND” postharvest “AND” chlorogenic acid “OR” caffeine “OR” trigonelline “OR” theobromine |
5 |
Coffea arabica “AND” roasted “AND” chlorogenic acid “OR” caffeine “OR” trigonelline “OR” theobromine |
6 |
Arabica coffee “AND” roasted “AND” chlorogenic acid “OR” caffeine “OR” trigonelline “OR” theobromine |
7 |
Coffea canephora “AND” roasted “AND” chlorogenic acid “OR” caffeine “OR” trigonelline “OR” theobromine |
8 |
Robusta coffee “AND” roasted “AND” chlorogenic acid “OR” caffeine “OR” trigonelline “OR” theobromine |
9 |
Coffea arabica “AND” brewed “AND” chlorogenic acid “OR” caffeine “OR” trigonelline “OR” theobromine |
10 |
Arabica coffee “AND” brewed “AND” chlorogenic acid “OR” caffeine “OR” trigonelline “OR” theobromine |
11 |
Coffea canephora “AND” brewed “AND” chlorogenic acid “OR” caffeine “OR” trigonelline “OR” theobromine |
12 |
Robusta coffee “AND” brewed “AND” chlorogenic acid “OR” caffeine “OR” trigonelline “OR” theobromine |
Table 2 Inclusion and exclusion criteria.
Inclusion criteria |
Exclusion criteria |
Articles in Bahasa or English |
Articles not in Bahasa or English |
Full-text research articles |
Articles without full-text |
Studies on chlorogenic acids/alkaloids in Arabica or Robusta Coffee |
Studies on Liberica or blended Arabica-Robusta |
Articles published within the last 10 years |
Articles published more than 10 years ago |
Quantitative data provided |
Qualitative data provided |
Analysis method using HPLC with UV-based detector (Uv-Vis, PDA, DAD) |
|
Data processing
Data on the concentrations of total chlorogenic acids (CQAs) and their isomers, caffeine (Cf), trigonelline (Tr), and theobromine (Th) were grouped according to coffee processing stages: green beans, roasted beans, and brewed coffee. Reported concentrations of CQAs, Cf, Tr, and Th across the reviewed studies were expressed in various units, including μg/g, mg/g, mg/mL, mg/100 mL, mg/100 g, mg/L, mg/kg, g/100 g, and g/kg. For consistency, all values were converted to mg/g dry basis for green beans, roasted beans, and brewed coffee.
In addition to concentration data extraction, methodological transparency regarding analytical performance was evaluated. Although no predefined minimum inclusion criteria were established for analytical validation parameters (e.g., limit of detection (LOD), limit of quantification (LOQ), recovery, and linearity), the reporting of these parameters was documented when available. Variability in analytical sensitivity and validation reporting across studies was considered as a potential source of inter-study heterogeneity. Furthermore, the risk of bias of each included study was assessed across 5 domains: Selection bias, performance bias, detection bias, attrition bias, and reporting bias. Each domain was evaluated based on the clarity of methodological descriptions and reporting completeness.
For green and roasted beans, concentrations were converted to mg/g dry basis (db) using reported moisture content. When moisture values were unavailable, reference moisture ranges were applied (green beans ≈ 12% [13]; roasted beans ≈ 1.34% - 3.41%) [13]. Conversion followed:
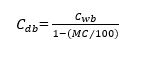
where
 represents the concentration on a dry basis (mg/g),
 represents the concentration on wet basis, and MC presents moisture
content (%).
represents the concentration on wet basis, and MC presents moisture
content (%).
For brewed coffee, concentrations originally reported on a volumetric basis (mg/mL, mg/100 mL or mg/L) were first standardized to mg/mL. To enable cross-stage comparison on a uniform dry mass basis, brewed coffee concentrations were subsequently expressed relative to the dry mass of coffee powder used during preparation. When brewing parameters were reported, the actual coffee-to-water ratio and serving volume were applied. The dry basis conversion for brewed coffee was calculated as:
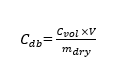
where
 represents the compound concentration in the beverage (mg/mL), V
presents beverage volume (mL), and
represents the compound concentration in the beverage (mg/mL), V
presents beverage volume (mL), and
 represents the dry mass coffee powder used (g).
The standardized dataset was processed using Microsoft Excel 2021, and box plots for CQAs, Cf, Tr, and Th were generated using R Studio. Prior to comparative statistical analysis, normality and homogeneity of variance were assessed using the Shapiro-Wilk test and Levene’s test, respectively. Because unequal variances were observed between groups, differences in chlorogenic acids and alkaloid levels between Arabica and Robusta coffee were subsequently evaluated using Welch’s t-test implemented in R Studio. The percentage of compound degradation was calculated from the relative difference between concentrations at each processing stage using the following equation:
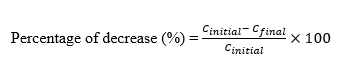
where
represents the concentration in green beans and
represents the concentration in roasted beans or brewed coffee.
Daily intake was estimated based on beverage concentration, serving volume, and assumed consumption frequency. Intake was calculated using the following equation:

Results and discussion
Number of publication coffee origin
The literature search was limited to publications from 2015 to July 2025. Eligible studies that met the inclusion criteria comprised references within this time frame. Furthermore, during the screening process, publications reporting non-quantitative data on chlorogenic acids and alkaloids were excluded. The search and screening process resulted in a total of 50 articles being included. The number of studies published on Arabica and Robusta coffee, as well as the countries of origin of the respective samples, are presented in Figures 2(a) and 2(b).
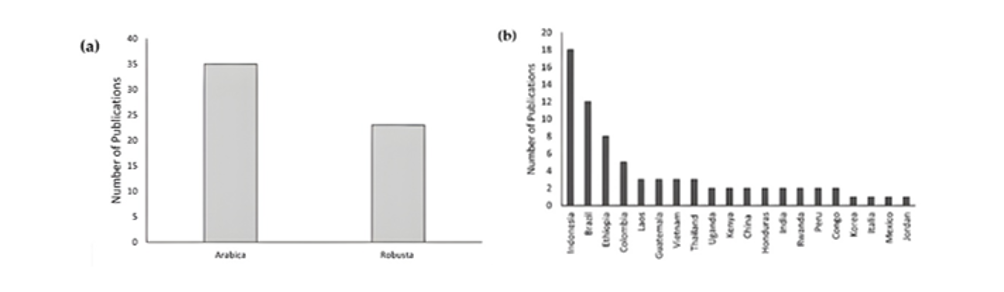
Figure 2 Distribution of included studies based on coffee species (a) and geographical origin of coffee samples by country (b) for publications published between 2015 and 2025.
Figure 2(a) shows the number of publications on Arabica and Robusta coffee included in this review during the period 2015 - 2025, indicating an increasing scientific interest in these species and their bioactive compounds. In the last 10 years, research has been dominated by Arabica coffee (60%) compared to Robusta coffee (40%). This predominance is noteworthy because the 2 species differ substantially in biochemical composition, genetic background, and ecological determinants, all of which shape their adaptive responses and baseline bioactive profiles. Robusta generally contains higher levels of caffeine and total chlorogenic acids than Arabica, which may be linked to ecological adaptation to greater pest pressure and more extreme environmental conditions, where caffeine functions as a natural defense compound [20]. In contrast, Arabica typically exhibits lower caffeine levels and distinct chlorogenic acid profiles influenced by cultivation at higher altitudes. In this review, Arabica and Robusta data were analyzed separately to maintain comparative accuracy, ensuring that differences in study proportion do not bias interspecies interpretation.
Figure 2(b) illustrates the origin of the coffee samples analyzed for chlorogenic acids and alkaloids (caffeine, trigonelline, and theobromine). The majority of the coffee samples included in this review originate from 3 major regions: Asia, Latin America, and Africa. Within Asia, Indonesia is the most frequently reported country of origin, followed by Laos, Vietnam, Thailand, China, India, Korea, and Jordan. In Latin America, the samples predominantly originate from Brazil and Colombia, along with Guatemala, Honduras, Peru, and Mexico. In Africa, the represented countries include Ethiopia, Uganda, Kenya, Rwanda, and the Democratic Republic of Congo. Geographical origin plays a critical role in determining the baseline composition of bioactive compounds prior to processing. Terroir-related factors such as soil composition, altitude, temperature regime, and rainfall patterns significantly influence the biosynthesis and accumulation of chlorogenic acids and alkaloids in green coffee beans [13]. Therefore, regional grouping of sample origins helps explain part of the inter-study variability observed in reported compound concentrations.
Altitude is one of the most consistently reported environmental determinants affecting coffee chemistry. Several studies have shown that coffee cultivated at higher elevations tends to accumulate higher concentrations of certain chlorogenic acids, potentially due to slower maturation rates and increased environmental stress responses [21,22]. Temperature gradients associated with altitude may also modulate enzymatic pathways involved in phenolic metabolism.
In addition to altitude, other pre-harvest factors such as rainfall distribution and nitrogen fertilization practices also play a central role in shaping alkaloid biosynthesis and nitrogen metabolism. Increased nitrogen availability has been associated with enhanced caffeine synthesis, whereas water stress may alter phenolic accumulation patterns. Under nitrogen-deficient conditions, caffeine may partially function as a recyclable nitrogen pool through limited degradation into allantoin, while this pathway appears less active when nitrogen is sufficient [23]. These findings highlight that pre-processing compositional differences are often established at the cultivation stage rather than during roasting or brewing alone.
Chlorogenic acids and alkaloid in green bean
The total chlorogenic acid content in green coffee beans analyzed from the literature included in this review is presented in Figure 3. The analysis showed that the mean total chlorogenic acids in Arabica green beans ranged from 45.39 to 71.97 mg/g db, while in Robusta green beans it ranged from 50.40 to 142.88 mg/g db.
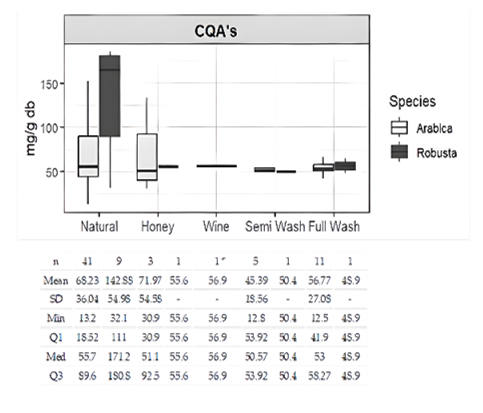
Figure 3 Total chlorogenic acids content in green beans at various post-harvest processes in Arabica and Robusta coffee; *data of Robusta coffee.
These findings show that the CQAs content in Robusta coffee was higher than in Arabica coffee, consistent with the results reported by Jeszka-Skowron et al. [13]. This difference was particularly evident in natural-processed Robusta (142.88 mg/g db), which contained nearly twice the amount of CQAs compared to Arabica (68.23 mg/g db). In Arabica coffee, the honey and natural processes showed similar ranges and similar mean CQA levels, whereas the wine, semi-washed, and full-washed processes exhibited comparable but slightly lower concentrations. Differences in CQAs content among post-harvest procedures are associated with the loss of compounds during fermentation and their solubilization in water during the washing process, as well as the degradation of components caused by sun-drying [10].
Figure 4 showed that the mean caffeine content in Arabica coffee ranged from 11.29 to 25.43 mg/g db, while in Robusta it ranged from 23.90 to 56.40 mg/g db. Trigonelline content in Arabica coffee was between 7.20 and 12.95 mg/g db, whereas in Robusta it ranged from 5.00 to 9.74 mg/g db. Theobromine content in Arabica coffee was relatively low, ranging from 0.12 to 0.18 mg/g db, while in Robusta it was only detected in the natural process at 0.03 mg/g db.
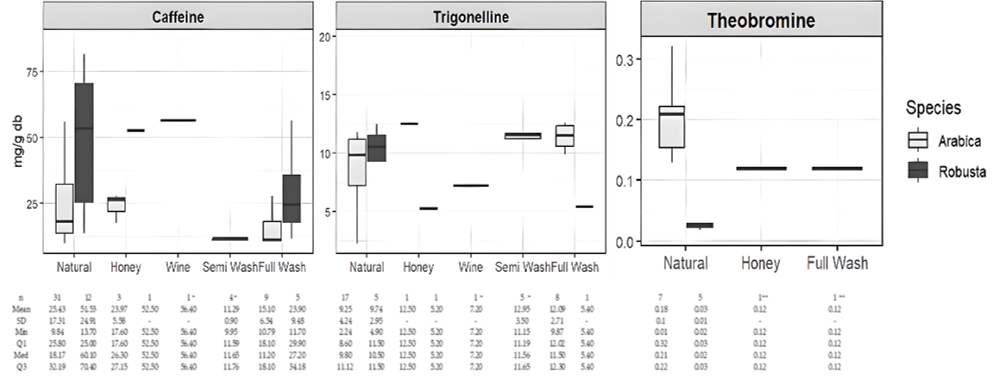
Figure 4 Alkaloid contents (caffeine, trigonelline, theobromine) in green beans at various post-harvest processes in Arabica and Robusta coffee; *data of Robusta coffee; **data of Arabica coffee.
The highest caffeine content in Arabica coffee was found in the natural process (25.43 mg/g db), while in Robusta it was observed in the wine process (56.40 mg/g db). According to the findings of Halagarda and Obrok [24], coffees processed using natural and anaerobic fermentation methods showed higher caffeine levels compared to those processed with full-wash methods. These results indicate that natural and wine processing methods are more effective in preserving caffeine content in coffee beans.
Overall, the variability in chlorogenic acid and alkaloid concentrations observed in green coffee beans across studies reflects the combined influence of geographic origin, agronomic conditions, and post-harvest practices. Beyond cultivation factors, differences in post-harvest processing methods (dry, semi-washed, or full washed) can further modify the basic composition of green coffee beans through microbial fermentation, leaching, and enzymatic transformations. Consequently, the chemical profile established at the green bean stage represents the baseline from which subsequent transformations occur, and therefore plays an important role in shaping the compositional changes observed during roasting and brewing.
Chlorogenic acids and alkaloid in roasted bean
Figure 5 shows the changes in total chlorogenic acid (CQAs) content in Arabica and Robusta coffee at different roasting levels. At light roasting, Robusta showed higher CQAs content (56.3 mg/g db) compared to Arabica (average 32.69 mg/g db). At medium roasting, Arabica showed higher levels (36.86 mg/g db) than Robusta (12.26 mg/g db). A similar pattern was observed at the dark level, where Arabica (11.7 mg/g db) showed higher CQAs than Robusta (8.25 mg/g db), before sharply decreasing at very dark roasting (11.17 mg/g db).
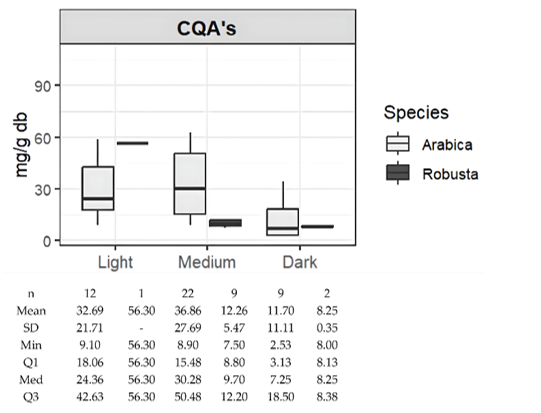
Figure 5 Total chlorogenic acids content in roasted beans at various roasting levels (light, medium, dark) of Arabica and Robusta Coffee.
These findings indicate that Robusta consistently showed a reduction in CQAs content as roasting progressed, while Arabica showed a slight increase at medium roasting before dropping sharply at very dark roasting. These findings indicate that Robusta consistently shows a decrease in CQAs content with roasting, while Arabica shows a slight increase at medium roasts before declining sharply at very dark roasts. A similar trend was also observed in Arabica coffee from Ethiopia showed 21% increase in chlorogenic acid content from light to medium roasting [25]. These trends reflect the thermal instability of chlorogenic acids during roasting. Increasing roasting temperature and duration promote several reactions, including isomerization, hydrolysis, and thermal degradation of CQAs. Among the various isomers, 5-CQA is considered the most thermally susceptible, leading to a progressive reduction in total CQAs as roasting intensity increases [18]. During roasting, chlorogenic acids can undergo ester bond cleavage, producing caffeic acid and quinic acid, which subsequently participate in further reactions such as oxidation, decarboxylation, and condensation reactions. In addition, CQAs can also undergo lactonization, forming chlorogenic acid lactones that contribute to the bitterness and complexity of roasted coffee flavor. Further thermal degradation may generate volatile phenolic compounds such as guaiacol and 4-vinylguaiacol, which play important roles in the aroma profile of roasted coffee [16].
Figure 6 illustrates the variation in alkaloid content of Arabica and Robusta coffees across different roasting levels. The average caffeine content in Arabica ranged from 11.29 to 25.43 mg/g db, compared to 23.90 to 56.40 mg/g db in Robusta, indicating consistently higher levels in the latter. Trigonelline concentrations in Arabica varied be-tween 7.20 and 12.95 mg/g db, with the highest levels observed at medium roast, com-pared to 5.00 to 9.74 mg/g db in Robusta. Theobromine content was relatively low in both species, ranging from 0.53 to 0.02 mg/g db in Arabica and from 0.03 to 0.01 mg/g db in Robusta.
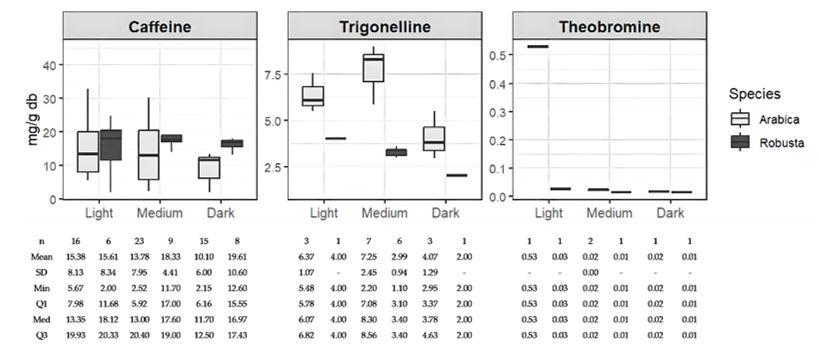
Figure 6 Alkaloid contents (caffeine, trigonelline, theobromine) in roasted beans at various roasting levels of Arabica and Robusta Coffee.
Caffeine content decreased slightly with increasing roasting level, a trend consistent with previous findings [26]. As an odorless and bitter compound, caffeine is considered highly stable during roasting, with only minor losses attributable to sublimation or thermal degradation. Trigonelline in Arabica coffee exhibited a pattern similar to chlorogenic acids, increasing from light to medium roast before declining sharply at dark roast. In contrast, Robusta coffee showed a consistent decrease in trigonelline content across all roasting levels.
The coffee roasting process induces several chemical reactions that significantly affect the stability of bioactive components, particularly chlorogenic acids and trigonelline. The thermal degradation pathways of these compounds are illustrated in Figures 7 and 8.
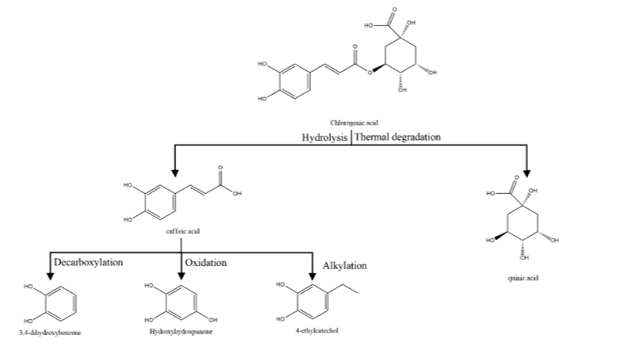
Figure 7 Proposed thermal degradation pathway of chlorogenic acid during coffee roasting with formation of non-volatile compounds (modified from Gigl et al. [27]). Drawn using Chem Draw Ultra 12.0.
Chlorogenic acid, an ester between caffeic acid and quinic acid, which undergoes thermal degradation during roasting. According to Gigl et al. [27], heating causes the cleavage of the ester bond, resulting in caffeic acid and quinic acid as the primary products. Caffeic acid subsequently undergoes further reactions such as decarboxylation, oxidation, and alkylation, producing 3,4-dihydroxybenzene, hydroxyhydroquinone, and 4-ethylcatechol, respectively. These transformations contribute to the development of brown colored compounds and the characteristic flavor profile of roasted bean coffee.
Meanwhile, trigonelline also undergoes significant thermal degradation. According to Stadler et al. [28], the main reactions involved include N-demethylation and de-carboxylation. The N-demethylation pathway produces nicotinic acid. Meanwhile, the decarboxylation pathway produces 1-methylpyridinium, which can undergo further reactions through nucleophilic reactions, methyl rearrangements, and methyl dis-placement, resulting in the formation of various pyridine derivatives such as 2-hydroxy-1-methyl-1,2-dihydropyridine, 2- and 4-methylpyridine, and 1,2-, 1,3-, and 1,4-dimethylpyridinium. These products are known to contribute to the formation of volatile compounds in roasted bean coffee.
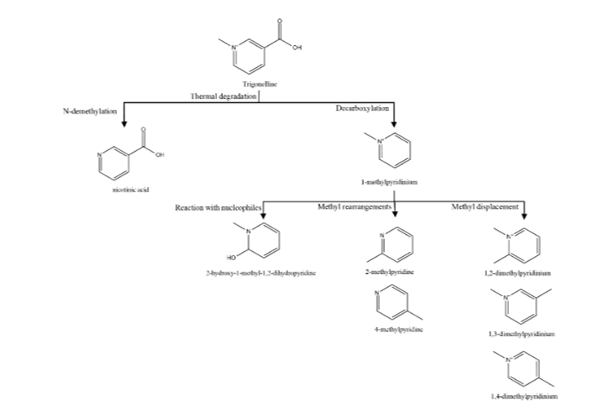
Figure 8 Proposed thermal degradation pathway of trigonelline during coffee roasting with formation of non-volatile compounds (modified from Stadler et al. [28]). Drawn with Chem Draw Ultra 12.0.
Chlorogenic acids and alkaloid in brewed coffee
Figure 9 presents the total chlorogenic acid and alkaloid levels in Arabica and Robusta coffees prepared using different brewing methods. In Arabica coffee, espresso yielded the highest total chlorogenic acid (4.20 mg/g db) and caffeine content (1.64 mg/g db). In contrast, Robusta coffee brewed as cold brew showed the highest levels of chlorogenic acid (4.04 mg/g db), caffeine (1.94 mg/g db), and trigonelline (0.58 mg/g db). For Arabica, both trigonelline (0.76 mg/g db) and theobromine (0.26 mg/g db) were also highest in cold brew. Robusta, however, exhibited detectable theobromine only in boiled, at 0.01 mg/g db.
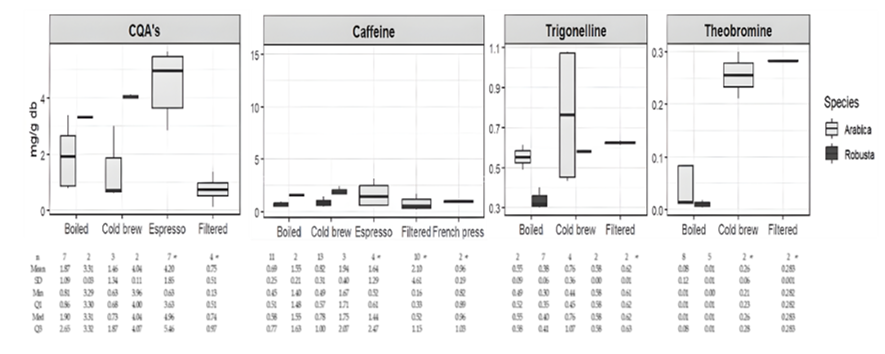
Figure 9 Total chlorogenic acids (CQA’s) and alkaloid contents (caffeine, trigonelline, theobromine) in brewed coffee prepared using various brewing methods of Arabica and Robusta coffee; *data of Arabica coffee.
Brewed coffee retains suspended compounds such as chlorogenic acids and alkaloids, with their concentrations being affected by factors including filtration, pressing, and the grind size of the coffee grounds [29]. The type of extraction method and the length of extraction are the main drivers of variation across different brewing techniques. As a result, adjustments in brewing parameters lead to differences in the levels of these bioactive compounds present in the final cup of coffee.
Changes in Chlorogenic acids and alkaloid from coffee bean to brew
Figure 10 illustrates the variation in total chlorogenic acids (CQAs) and their major isomers (3-CQA, 4-CQA, and 5-CQA) in Arabica and Robusta coffees, from green beans to roasted beans and brewed coffee. In green beans, Robusta exhibited substantially higher CQAs content (107.99 mg/g db) compared to Arabica (64.41 mg/g db). Following roasting, CQAs levels decreased markedly in both species, with Arabica retaining 30.43 mg/g db, while Robusta showed a sharp decline to 15.26 mg/g db. In brewed coffee, only trace amounts of CQAs were detected, averaging 0.87 mg/g db in Arabica and 0.32 mg/g db in Robusta. These results demonstrate that although Robusta initially contains more CQAs, Arabica tends to retain a greater proportion after roasting and brewing.
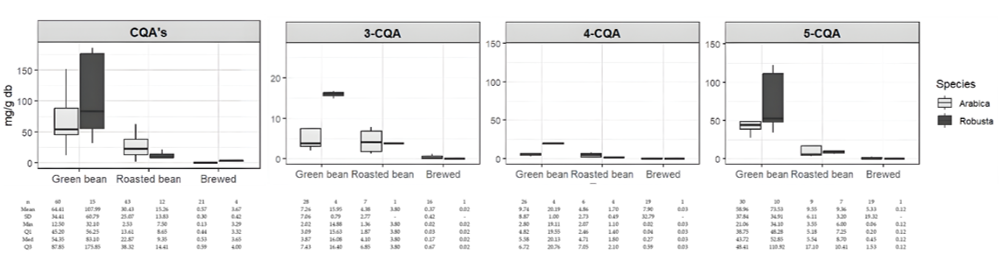
Figure 10 Total chlorogenic acids (CQA’s) and mono-caffeoylquinic acids (3-CQA, 4-CQA, 5-CQA) content across green beans, roasted beans, and brewed coffee of Arabica and Robusta coffee.
Figure 11 and Table 3 summarize the average concentration of dicaffeoylquinic acid (diCQA) isomers (3,4-diCQA, 4,5-diCQA, and 3,5-diCQA) in green beans, roasted beans, and brewed Arabica coffee.
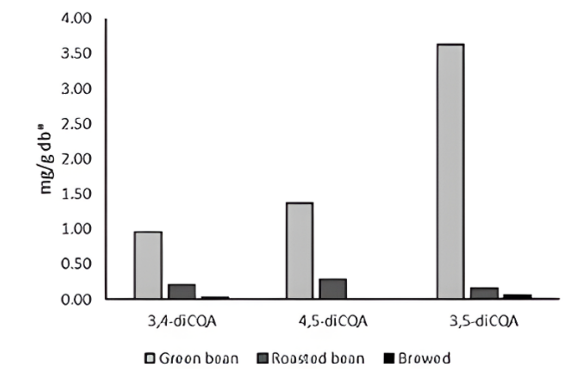
Figure 11 Dicaffeoylquinic acids (di-CQAs) content in green beans, roasted beans, and brewed coffee of Arabica samples (n = 27) *mean value.
Table 3 Change dicaffeoylquinic acids of Arabica coffee
Bean |
3,4-diCQA |
4,5-diCQA |
3,5-diCQA |
|||
Mean (mg/g db) |
Change (%) |
Mean (mg/g db) |
Change (%) |
Mean (mg/g db) |
Change (%) |
|
Green bean |
0.96 |
- |
1.37 |
- |
3.62 |
- |
Roasted bean |
0.20 |
78.82* |
0.28 |
79.81 |
0.16 |
95.58 |
Brewed |
0.002 |
97.49** |
na |
- |
0.06 |
98.26 |
* Change after roasting process (green bean – roasted bean); ** change after brewing (green bean - brewed).
In green beans of Arabica coffee, diCQAs were consistently present at relatively high levels, with 3,5-diCQA reported as the dominant isomer (3.62 mg/g db), followed by 4,5-diCQA (1.37 mg/g db) and 3,4-diCQA (0.96 mg/g db). Across the literature, roasting was associated with pronounced reductions in diCQA content, reaching 78.82%, 79.81%, and 95.58% losses for 3,4-diCQA, 4,5-diCQA, and 3,5-diCQA, respectively, indicating that 3,5-diCQA is the most heat-sensitive isomer. Further decreases were consistently observed in brewed coffee, where only trace amounts of 3,4-diCQA (0.02 mg/g db, 97.49% reduction) and 3,5-diCQA (0.06 mg/g db, 98.26% reduction) remained, while 4,5-diCQA was no longer detectable.
Figure 12 shows the variation in caffeine, trigonelline, and theobromine content in Arabica and Robusta coffees from green beans to roasted beans and brewed beverages.
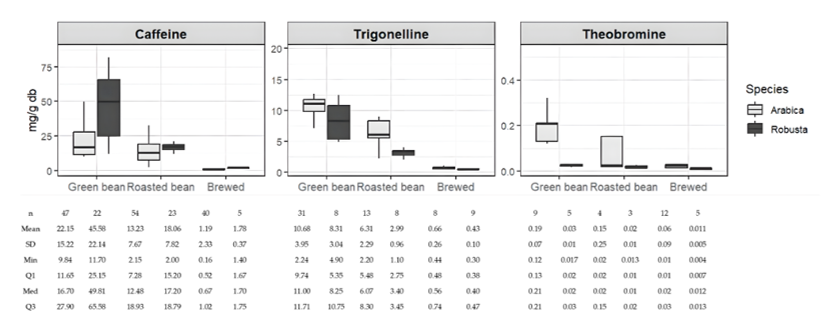
Figure 12 Alkaloid contents (caffeine, trigonelline, theobromine) across green beans, roasted beans, and brewed coffee of Arabica and Robusta coffee.
Based on the analyzed literature included in the review, in green beans, Robusta contained a markedly higher caffeine concentration (mean 45.58 mg/g db) compared to Arabica (22.15 mg/g db). After roasting, caffeine levels declined significantly in both species, with Arabica retaining 13.28 mg/g db and Robusta 18.06 mg/g db. In brewed coffee, only trace levels were detected, averaging 1.19 mg/g db in Arabica and 1.78 mg/g db in Robusta.
Trigonelline followed a similar trend, with Arabica green beans containing 10.68 mg/g db compared to 8.31 mg/g db in Robusta. Roasting reduced these values to 6.31 mg/g db in Arabica and 2.99 mg/g db in Robusta, while brewed coffee contained less than 1 mg/g db in both species 0.66 mg/g db in Arabia and 0.43 mg/g db in Robusta. Theobromine levels were low in both coffees, with Arabica showing slightly higher concentrations. Green beans of Arabica averaged 0.19 mg/g db, which decreased to 0.15 mg/g db in roasted beans and 0.06 mg/g db in brewed coffee. Robusta, by contrast, exhibited negligible levels across all stages, ranging from 0.03 to 0.02 mg/g db.
Table 4 presents the changes in total chlorogenic acids and alkaloids in Arabica and Robusta coffee during roasting and after brewing. The contents of total chlorogenic acids and trigonelline showed significant differences between Arabica and Robusta in green beans, roasted bean, and brewed coffee (p < 0.05), except for theobromine, which showed no significant variation (p > 0.05). Caffeine also exhibited significantly differences between the 2 species in green and roasted beans (p < 0.05), although no significant difference was observed in brewed coffee (p > 0.05). The average decrease in chlorogenic acids and alkaloids across processing stages is illustrated in Figure 13.
Table 4 Concentration of total chlorogenic acid and alkaloid of Arabica and Robusta coffee.
Bioactive compond |
Arabica |
Robusta |
p < 0.05 |
||||
Content (mg/g db) (Mean ± SD) |
Content (mg/g db) (Min - Max) |
Changes (%) |
Content (mg/g db) (Mean ± SD) |
Content (mg/g db) (Min - Max) |
Changes (%) |
||
Greean bean |
|||||||
Total chlorogenic acids |
64.41 ± 34.41a |
12.50 - 160.10 |
- |
107.99 ± 60.79b |
32.10 - 185.6 |
- |
0.008 |
Caffeine |
22.15 ± 15.22a |
9.84 - 87.00 |
- |
45.58 ± 22.14b |
11.70 - 81.70 |
- |
< 0.001 |
Trigonelline |
10.68 ± 3.95b |
2.24 - 19.7 |
- |
8.31 ± 3.04a |
4.90 - 12.5 |
- |
0.04 |
Theobromine |
0.19 ± 0.07a |
0.12 - 0.32 |
- |
0.03 ± 0.01a |
0.017 - 0.045 |
- |
2.01 |
Roasted bean |
|||||||
Total chlorogenic acids |
30.43 ± 25.07b |
2.53 - 108.90 |
31. 98 - 79.76* |
15.26 ± 13. 83a |
7.50 - 56.30 |
69.66 - 76.63 |
0.004 |
Caffeine |
13.23 ± 7.67a |
2.15 - 32.77 |
62.23 - 78.18 |
18.06 ± 7.82b |
2.00 - 45.40 |
44.43 82.90 |
0.008 |
Trigonelline |
6.31 ± 2.29b |
2.20 - 8.98 |
1.78 - 54.41 |
2.99 ± 0.96a |
1.10 - 4.00 |
1.78 - 54.41 |
<0.001 |
Theobromine |
0.15 ± 0.25a |
0.02 - 0.53 |
0 - 85.83 |
0.02 ± 0.01a |
0.013 - 0.027 |
22.57 - 40.17 |
0.19 |
Brewed |
|||||||
Total chlorogenic acids |
0.57 ± 0.30a |
0.13 - 1.34 |
99.00 - 99.16** |
3.67 ± 0.42b |
3.29 - 4.11 |
56.13 - 92.69 |
<0.001 |
Caffeine |
1.19 ± 2.33a |
0.16 - 15.15 |
53.76 - 92.54 |
1.78 ± 0.37a |
1.40 - 2.39 |
88.03 - 97.06 |
0.07 |
Trigonelline |
0.66 ± 0.26b |
0.44 -1.08 |
80.58 - 94.51 |
0.43 ± 0.10a |
0.30 - 0.58 |
68.00 - 77.55 |
0.02 |
Theobromine |
0.06 ± 0.09a |
0.01 - 0.30 |
6.86 - 91.03 |
0.01 ± 0.005a |
0.004 - 0.017 |
62.25 - 78.17 |
0.052 |
* Change after roasting process (green bean – roasted bean); ** Change after brewing (green bean – brewed); Value with different superscript in the same row are significantly different (p > 0.05) (t-Test).
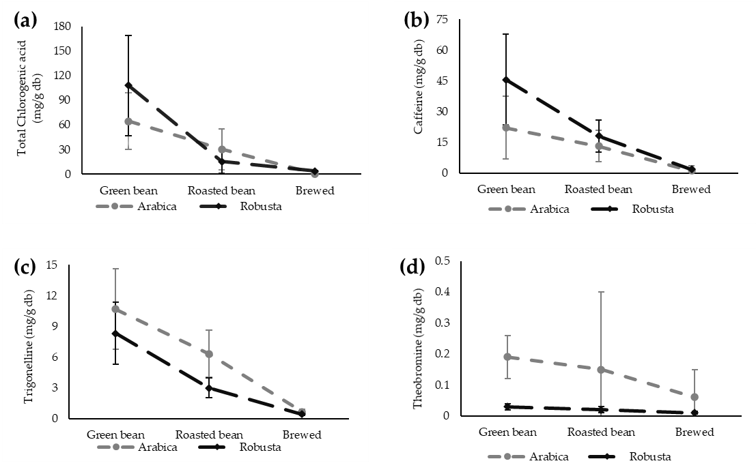
Figure 13 Changes in total chlorogenic acids (a), caffeine (b), trigonelline (c), and theobromine (d) of Arabica and Robusta across processing stages. Values are the mean and standard deviation.
As presented in Table 4, the percentage reduction of total chlorogenic acids from green beans to roasted beans ranged from 31.98% - 79.76% in Arabica and 69.66% - 76.63% in Robusta. Caffeine decreased by 62.33% - 78.18% in Arabica and 44.43% - 82.90% in Robusta. Trigonelline showed reductions of 1.78% - 54.41% in both Arabica and Robusta, while theobromine decreased by 85.83% in Arabica and 22.57% - 40.17% in Robusta. In brewed coffee, total chlorogenic acids in Arabica were reduced by 99.00% - 99.16%, caffeine by 53.76% - 92.54%, trigonelline by 80.58% - 94.51%, and theobromine by 6.86% - 91.03%. Mean-while, in Robusta brews, total chlorogenic acids decreased by 56.13% - 92.69%, caffeine by 88.03% - 97.06%, trigonelline by 68.00% - 77.55%, and theobromine by 62.25% -78.17%. These values highlight that although both species undergo substantial losses of bioactive compounds during roasting and brewing, Robusta generally shows greater reductions compared to Arabica.
Processing conditions also play a crucial role. Roasting intensity represents the main driver of chlorogenic acid degradation, whereas brewing parameters such as coffee-to-water ratio, extraction time, and temperature influence the final concentration of bioactive compounds in the beverage. Analytical variability across studies, including differences in extraction procedures and chromatographic detection methods, may also contribute to the dispersion of reported values.
In addition, methodological quality across the included studies was evaluated through a risk of bias assessment covering selection, performance, detection, attrition, and reporting domains. Most studies showed a low risk of bias in the selection and attrition domains, reflecting adequate reporting of sample sources and replication procedures. However, detection bias was frequently categorized as unclear due to limited reporting of analytical validation parameters, particularly the absence of limit of detection (LOD) and limit of quantification (LOQ) values in several studies. Detailed assessments are provided in Supplementary Table S2.
Despite these sources of heterogeneity, the compiled evidence indicates that the transformation of coffee bioactive compounds during processing follows predictable compound-specific stability patterns. Chlorogenic acids are highly sensitive to thermal degradation, trigonelline acts as a precursor of roasting derived aroma compounds, and caffeine remains chemically stable. These patterns suggest that processing intensity rather than extraction alone is the primary determinant of phenolic losses in coffee.
Contribution of coffee brew to the daily intake of chlorogenic acid and caffeine
The contents total of chlorogenic acids (CQAs) and caffeine in coffee are influenced by both the coffee species and the brewing method used. These variations affect the estimated daily intake required to obtain potential health benefits. Table 5 presents the range of CQAs and caffeine compositions in various types of Arabica and Robusta brews, as well as the estimated daily intake values.
Table 5 Concentration of total chlorogenic acid and alkaloid of Arabica and Robusta coffee.
Species |
Brew |
Consumption |
Daily intake (mg/day) |
|
Cup/day |
Chlorogenic acid |
Caffeine |
||
Arabica |
Boileda |
1 |
81.00 - 337.70 |
45.15 - 126.70 |
2 |
162.00 - 675.40 |
90.30 - 253.40 |
||
Cold brewa |
1 |
63.10 - 301.00 |
48.50 - 142.00 |
|
2 |
126.20 - 602.00 |
97.00 - 284.00 |
||
Filtereda |
1 |
13.00 - 137.00 |
31.00 - 166.80 |
|
2 |
26.00 - 274.00 |
48.00 - 333.60 |
||
Espressob |
1 |
18.90 - 169.44 |
15.60 - 95.40 |
|
2 |
37.80 - 338.88 |
31.20 - 190.8 |
||
Robusta |
Boileda |
1 |
329.00 - 333.00 |
140.00 - 170.00 |
2 |
658.00 - 666.00 |
280.00 - 340.00 |
||
Cold brewa |
1 |
396.00 - 411.00 |
167.00 - 239.60 |
|
2 |
792.00 - 822.00 |
334.00 - 479.20 |
||
aCoffee brewed with a serving volume of 100 mL/cup; bCoffee brewed with a serving volume of 30 mL/cup; Values represents the minimum-maximum range.
Based on the data in Table 5, Arabica brews coffee shows total chlorogenic acids levels ranging from 13.00 - 337.70 mg/cup and Robusta brews coffee has CQAs levels between 329.00 - 411.00 mg/cup. Accordingly, the estimated intake of chlorogenic acids and alkaloids from brewed coffee remains within ranges commonly associated with potential health benefits when coffee is consumed in moderate amounts. Previous studies have reported that the intake of CQAs in the range of approximately 13.5 - 1,200 mg/day, which can be achieved through moderate coffee consumption, has been associated with several beneficial physiological effects. These include reduce fasting blood glucose levels, improved glucose tolerance, weight control, and improved blood pressure in hypertensive patients [30]. The metabolic benefits of coffee are largely attributed to the biological activity of chlorogenic acids, which are known to influence glucose metabolism and insulin sensitivity [31]. Therefore, moderate coffee consumption may serve as a practical dietary source of bioactive compounds, particularly CQAs, that may contribute to metabolic health while remaining within the recommended daily safety limits for caffeine intake [32].
Conclusions
This review indicates that variations in chlorogenic acid, caffeine, trigonelline, and theobromine concentrations between Arabica and Robusta coffees are influenced by several factors, particularly roasting and brewing processes. On average, the total concentrations of chlorogenic acids and caffeine in green Robusta beans are higher than those in Arabica. The total chlorogenic acids decreased by 52% - 99% in Arabica and 86% - 97% in Robusta during roasting and brewing. Trigonelline levels declined by 41% - 94% in Arabica and 64% - 95% in Robusta, while caffeine decreased by 40% - 95% and 60% - 96% in Arabica and Robusta, respectively. Theobromine exhibited smaller changes, with re-ductions of 21% - 68% in Arabica and 33% - 67% in Robusta. Selecting an appropriate brewing method can greatly influence the levels of bioactive compounds and, consequently, the overall quality of coffee. By optimizing the brewing process, coffee can be made to better align with consumer preferences and health considerations.
This systematic review synthesized quantitative evidence on the dynamic changes of chlorogenic acids and major alkaloids (caffeine, trigonelline, and theobromine) in Arabica and Robusta coffee across key processing stages, including green beans, roasting, and brewing. The compiled data confirm that species differences strongly influence the baseline composition of coffee beans, with Robusta generally exhibiting higher concentrations of caffeine and total chlorogenic acids than Arabica. Among the processing stages, roasting represents the most influential transformation step, leading to substantial degradation of several bioactive compounds. Total chlorogenic acids decreased by approximately 52% - 99% in Arabica and 86% - 97% in Robusta, while trigonelline declined by 41% - 94% and 64% - 95%, respectively. Caffeine showed comparatively greater stability, with reductions of 40% - 95% in Arabica and 60% - 96% in Robusta, whereas theobromine exhibited smaller changes, ranging from 21% - 68% in Arabica and 33% - 67% in Robusta. These results highlight that roasting intensity and brewing conditions play critical roles in determining the final concentration of bioactive compounds in brewed coffee.
Despite this, considerable variability was observed across studies. Differences in geographical origin, agronomic conditions, post-harvest processing, roasting levels, brewing parameters, and analytical reporting practices contribute to substantial heterogeneity in the collected dataset. Although concentration values were aligned to a common dry-basis unit, synthesis remains limited by inconsistent experimental designs and the absence of formal heterogeneity modeling across studies. Therefore, future research should prioritize standardized reporting of processing parameters and analytical methodologies, while integrating advanced molecular approaches such as targeted metabolomics and isotopic tracing to further elucidate the biochemical transformation pathways of coffee bioactive compounds throughout the processing chain.
Acknowledgements
This research was financial support provided by the Ministry of Higher Education, Science, and Technology of the Republic of Indonesia with the Grant No. 006/C3/DT.05.00/PL/2025 is grate-fully acknowledged.
Declaration of Generative AI in Scientific Writing
The authors acknowledge the assistance of generative AI tools for language refinement and grammatical editing only. No part of the content, data analysis, or interpretation was generated by AI. The authors remain fully responsible for the originality, accuracy, and conclusions presented in this manuscript.
CRediT Author Statement
Nazwa Nurhaliza: Conceptualization; Methodology; Software; Validation; Formal analysis; Investigation; Resources; Data curation; Writing - Original draft preparation; Visualization; Supervision; Project administration; Funding acquisition. Dian Herawati: Conceptualization; Methodology; Software; Validation; Formal analysis; Investigation; Resources; Data curation; Writing - Review and editing; Visualization; Supervision; Project administration; Funding acquisition. Nuri Andarwulan: Conceptualization; Methodology; Software; Validation; Formal analysis; Investigation; Resources; Data curation; Writing - Review and editing; Visualization; Supervision; Project administration; Funding acquisition.
References
[1] N Farhaty and Muchtaridi. Tinjauan kimia dan aspek farmakologi senyawa asam klorogenat pada biji kopi: Review (in Indonesian). Jurnal Farmaka 2016; 14(1), 214-227.
[2] International Coffee Organization. Coffee report and outlook. International Coffee Organization, London, 2023.
[3] HL Wachamo. Review on health benefit and risk of coffee consumption. Medicinal & Aromatic Plants 2017; 6(4), 1-12.
[4] A Farah. Coffee: Emerging health effect and disease prevention. 1st ed. John Wiley and Sons, New Jersey, 2012.
[5] LT Anh-Dao, T Chi-Thien, N Nhut-Truong, T Tu-Chi, D Minh-Huy, N Thanh-Nho and N Cong-Hau. Changes in the total phenolic contents, chlorogenic acid, and caffeine of coffee cups regarding different brewing methods. Food Research 2024; 8(6), 71-79.
[6] S Mangiwa and YR Yabansabra. Kadar trigonelin dalam biji kopi Arabika (Coffea arabica) asal Wamena, Kabupaten Jayawijaya, Papua. SAINS: Jurnal MIPA Dan Pengajarannya 2016; 16(1), 29-34.
[7] PC Ayu. 2017, Pengembangan model penentuan kandungan kimia utama pembentuk flavour biji kopi java preanger menggunakan FT-NIRS (in Indonesian). Graduate’s Thesis. Institut Pertanian Bogor, Bogor, Indonesia.
[8] CF Tsai and IPJ Jioe. The analysis of chlorogenic acid and caffeine content and its correlation with coffee bean color under different roasting degree and sources of coffee (Coffea arabica typica). Processes 2021; 9(11), 2040.
[9] M Jeszka-Skowron, R Frankowski and A Zgola-Grzeskowiak. Comparison of methylxantines, trigonelline, nicotinic acid and nicotinamide contents in brews of green and processed Arabica and Robusta coffee beans-Influence of steaming, decaffeination and roasting processes on coffee beans. LWT 2020; 125, 109344.
[10] Y Yulianti, N Andarwulan, DR Adawiyah, D Herawati and D Indrasti. Physicochemical characteristics and bioactive compound profiles of Arabica Kalosi Enrekang with different postharvest processing. Food Science and Technology 2022; 42, 67622.
[11] KM Santosa, S Supriyadi and Y Rahmadian. Sensory analysis, caffeine, chlorogenic acid and non-volatile taste compounds of arabica coffee (Coffea arabica) fermented with sugar addition for brew taste. Indonesian Food and Nutrition Progress 2020; 17(2), 37-44.
[12] M Reza, D Herawati and F Kusnandar. Perbandingan asam fenolat dan total fenolik kopi Arabika Bogor pengolahan pascapanen dan tingkat sangrai berbeda (in Indonesian). Jurnal Mutu Pangan 2023; 10(2), 93-99.
[13] M Jeszka-Skowron, A Sentkowska, K Pryzynska and MPD Pena. Chlorogenic acids, caffeine content and antioxidant properties of green coffee extracts: Influence of green coffee bean preparation. European Food Research and Technology 2016; 242(8), 1403-1409.
[14] DS da Costa, TG Albuquerque, HS Costa and APA Bragotto. Thermal contaminants in coffee induced by roasting: A review. International Journal of Environmental Research and Public Health 2023; 20(8), 5586
[15] FBR Yeison, NG Guzman and JG Hernandez. Effect of the postharvest processing method on the biochemical composition and sensory analysis of arabica coffee. Engenharia Agrícola 2020; 40(2), 177-183.
[16] R Rusinek, B Dobrzanski, M Gawrysiak-Witulska, A Siger, A Zytek, H Karami, A Umar, T Lipa and M Gancarz. Effect of the roasting level on the content of bioactive and aromatic compounds in Arabica coffee beans. International Agrophysics 2024; 38(1), 31-42.
[17] D Herawati, MS Armawan, N Nurhaliza, FA Mu’Arij, D Hunaefi and S Noviasari. Impact of bean origin and brewing methods on bioactive compounds, bioactivities, nutrition, and sensory perception in coffee brews: An Indonesian coffee gastronomy study. International Journal of Gastronomy and Food Science 2024; 35, 100892.
[18] K Socala, A Szopa, A Serefko, E Poleszak and P Wlaz. Neuroprotective effects of coffee bioactive compounds: A review. International Journal of Molecular Sciences 2020; 22(1), 107.
[19] PRISMA 2020. PRISMA statement, Available at: http://www.Prisma-Statement.Org/, accessed March 2025
[20] P Orpong, W Sriwiang, S Chookaew, J Eamsiri, Saengkorakot, K Kehemthong, K Kamdee, R Photinam and R Picha. Comprehensive analysis of elemental profiles, caffeine and chlorogenic acid contents, antioxidant activities, and isotope ratios in Thai single-origin green coffee beans. Measurement: Food 2025; 20, 100265.
[21] RCE Dias, SEW Opitz and C Yeretzian. Bioactive compounds in blends of coffee defects originating from the harvesting. Coffee Science 2022; 17, e172027.
[22] RCE Dias, SEW Opitz and C Yeretzian. Bioactive compounds in blends of coffee defects originating from the harvesting. Coffee Science 2022; 17, e172027.
[23] MF Pompelli, GM Pompelli, AF de Oliveira and WC Antunes. The effect of light and nitrogen availability on the caffeine, theophylline and allantoin contents in the leaves of Coffea arabica L. AIMS Environmental Science 2013; 1(1), 1-11.
[24] M Halagarda and P Obrok. Influence of post-harvest processing on functional properties of coffee (Coffea arabica L.). Molecules 2023; 28(21), 7386.
[25] M Bolka and S Emire. Effects of coffee roasting technologies on cup quality and bioactive compounds of specialty coffee beans. Food Science & Nutrition 2020; 8(11), 5765-6297.
[26] M Gorecki and E Hallmann. The antioxidant content of coffee and its in vitro activity as an effect of its production method and roasting and brewing time. Antioxidants 2020; 9(4), 308
[27] M Gigl, O Frank, L Irmer and T Hofmann. Identification and quantitation of reaction products from chlorogenic acid, caffeic acid, and their thermal degradation products with odor-active thiols in coffee beverages. Journal of Agricultural and Food Chemistry 2022; 70(17), 5427-5437.
[28] RH Stadler, N Varga, J Hau, FA Vera and DH Welti. Alkylpyridinium. 1. Formation in model system via thermal degradation of trigonelline. Journal of Agricultural and Food Chemistry 2002; 50, 1192-1199.
[29] A Santanatoglia, E Schievano, I Menegazzo, L Fioretti, G Caprioli, S Vittori, G Sagratini and L Alessandroni. Cafestol and Kahweol content in different specialty coffee brews: Exploration by NMR analysis and evaluation of brewing parameters. Journal of Food Composition and Analysis 2025; 137, 106929.
[30] Y Yu, Z Zhang and C Chang. Chlorogenic acid intake guidance: Sources, health benefits, and safety. Asia Pacific Journal of Clinical Nutrition 2022; 31(4), 602-610.
[31] H Lu, Z Tian, Y Cui, Z Liu and X Ma. Chlorogenic acid: A comprehensive review of the dietary sources, processing effects, bioavailability, beneficial properties, mechanisms of action, and future directions. Comprehensive Reviews in Food Science and Food Safety 2020; 19(6), 3130-3158.
[32] European Food Safety Authority. Scientific opinion on the safety of caffeine. Efsa Journal 2015; 13(5), 4102.
[33] G Angeloni, L Guerrini, P Masella, M Innocenti, M Bellumori and A Parenti. Characterization and comparison of cold brew and cold drip coffee extraction methods. Journal of the Science of Food and Agriculture 2019; 99(1), 391-399.
[34] D Bauer, J Abreu, N Jordao, JSD Rosa, O Freitas-Silva and A Teodoro. Effect of roasting levels and drying process of Coffea canephora on the quality of bioactive compounds and cytotoxicity. International Journal of Molecular Sciences 2018; 19(11), 3407.
[35] M Worku, B De Meulenaer, L Duchateau and P Boeckx. Effect of altitude on biochemical composition and quality of green arabica coffee beans can be affected by shade and postharvest processing method. Food Research International 2018; 105, 278-285.
[36] Z Asfew and A Dekebo. Determination of caffeine content in Wollega Zones, Ethiopian coffee bean, pulp and leaves by high performance liquid chromatography. Trend in Phytochemical Research 2019; 3(4), 261-274.
[37] CA Pinheiro, LL Pereira, DB Fioresi, DD Oliveira, VM Osorio, JA da Silva, UA Pereira, MAG Ferrao, EM Riva-Souza, AFA da Fonseca and PF Pinheiro. Physico-chemical properties and sensory profile of Coffea canephora genotypes in high-altitudes. Australian Journal of Crop Science 2019; 13(12), 2046-2052.
[38] P Wongsa, N Khampa, S Horadee, J Chaiwarith and N Rattanapanone. Quality and bioactive compounds of blends of Arabica and Robusta spray-dried coffee. Food Chemistry 2019; 283, 579-587.
[39] N Chindapan, S Soydok and S Devahastin. Roasting kinetics and chemical composition changes of Robusta coffee beans during hot air and superheated steam roasting. Journal of Food Science 2019; 84(2), 292-302.
[40] IW Budiastra, M Sutrisno, S Widyotomo and PC Ayu. Determination of trigonelline and chlorogenic acid (CGA) concentration in intact coffee beans by NIR spectroscopy. AgricEbgInt: CIGR Journal 2020; 22(1), 162-168
[41] S Jung, S Gu, SH Lee and Y Jeong. Effect of roasting degree on the antioxidant properties of espresso and drip coffee extracted from Coffea arabica cv. Java. Applied Sciences 2021; 11(15), 7025.
[42] S Awwad, R Issa, L Alnsour, D Albals and I Al-Momani. Quantification of caffeine and chlorogenic acid in green and roasted coffee samples using HPLC-DAD and evaluation of the effect of degree of roasting on their levels. Molecules 2021; 26(24), 7502.
[43] J Montenegro, LS dos Santos, RG de Souza, LGB Lima, DS Mattos, BPPB Viana, ASCF Bastos, L Muzzi, CA Conte-Junior, EPR Gimba, O Freitas-Silva and AJ Teodoro. Bioactive compounds, antioxidant activity and antiproliferative effects in prostate cancer cells of green and roasted coffee extracts obtained by microwave-assisted extraction (MAE). Food Research International 2021; 140, 110014.
[44] MC Espindula, FJE Botelho, ADS Clemente, AL Teixeira, GQF Alves and RME Oliveira. Quality evaluation of Coffea canephora ‘Apoata’ seeds for rootstock production. Coffee Science 2018; 13(1), 1.
[45] A Duangjai, S Saokaew, BH Goh and P Phisalprapa. Shifting of physicochemical and biological characteristics of coffee roasting under ultrasound-assisted extraction. Frontiers in Nutrition 2021; 8, 724591.
[46] A Muzykiewicz-Szymanska, A Nowak, D Wira and A Klimowicz. The effect of brewing process parameters on antioxidant activity and caffeine content in infusions of roasted and unroasted Arabica coffee beans originated from different countries. Molecules 2021; 26(12), 3681.
[47] N Cordoba, FL Moreno, C Osorio, S Velasquez and Y Ruiz. Chemical and sensory evaluation of cold brew coffees using different roasting profiles and brewing methods. Food Research International 2021; 141, 110141.
[48] A Analianasari, EW Kenali, D Berliana, M Yulia and S Shintawati. Evaluasi pasca panen, cacat mutu dan atribut kimia (kafein, asam klorogenat) kopi robusta Lampung Barat (in Indonesian). Jurnal Teknologi & Industri Hasil Pertanian 2022; 27(1), 42-52.
[49] CDS Portela, IF de Almeida, TADD Reis, BRB Hickmann and MDT Benassi. Effects of brewing conditions and coffee species on the physicochemical characteristics, preference and dynamics of sensory attributes perception in cold brews. Food Research International 2022; 151, 110860.
[50] MC Espindula, FJE Botelho, ADS Clemente, AL Teixeira, GQF Alves and RME Oliveira. Quality evaluation of Coffea canephora ‘Apoata’ seeds for rootstock production. Coffee Science 2018; 13(1), 1.
[51] A Prasetya, MA Moulina, HM Arif and R Nofriansyah. Chemical quality, preference, and business analysis of Kepahiang Robusta coffee by roasting equipment type. SINTA Journal (Science, Technology, and Agricultural) 2022; 3(1), 33-40.
[52] LE Yulianti, DP Putri, IF Azizah, S Witman, MA Karim and A Rahayuningtyas. Physicochemical properties of ‘Cisalak’ Robusta coffee with hot air based roasting method. BIO Web of Conferences 2023; 69, 03014.
[53] A Santanatoglia, S Angeloni, D Bartolucci, L Fioretti, G Sagratini, S Vittori and G Caprioli. Effect of brewing methods on acrylamide content and antioxidant activity: Studying eight different filter coffee preparations. Antioxidants 2023; 12(10), 1888.
[54] AF Ramadhani and FC Nisa. Differences in chemical characteristics due to different roasting of robusta coffee beans. Coffee Science 2023; 18, e182116.
[55] R Dong, M Zhu, Y Long, Q Yu, C Li, J Xie, Y Huang and Y Chen. Exploring correlations between green coffee bean components and thermal contaminants in roasted coffee beans. Food Research International 2023; 167, 112700.
[56] AA Oksari, N Hasanah and RTM Sutamihardja. Characteristics of ground coffee quality on variations in temperature and roasting time for Robusta coffee (Coffea canephora Pierre Ex A.Froehner) green bean. Indonesian Journal of Applied Research 2023; 4(1), 11-16.
[57] J Gallardo-Ignacio, A Santibanez, O Oropeza-Mariano, R Salazar, RM Montiel-Ruiz, S Cabrera-Hilerio, M Gonzales-Cortazar, F Cruz-Sosa and P Nicasio-Torres. Chemical and biological characterization of green and processed coffee beans from Coffea arabica varieties. Molecules 2023; 28(12), 4685.
[58] AP Arum, SB Patricia, OF Alit, B Kusmanadhi, Setiyono and DA Savitri. Study of organic acid and caffeine content of Arabica coffee beans (Coffea arabica) processing of the Java Ijen Sukosari Bondowoso Farmers Group. IOP Conference Series: Earth and Environmental Science 2025; 1497(1), 012023.
[59] M Linda, F Bastian, M Mahendradatta, AB Tawali and A Laga. The effect of several postharvest processing on the quality of Robusta Coffee (Coffea canephora). IOP Conference Series: Earth and Environmental Science 2023; 1200, 012011.
[60] M Misto, S Indarti, Y Safitri, M Mutmainnah, T Mulyono and DD Alawiyah. Identification of chlorogenic acid, caffeine, melanoidin, sucrose, and protein content of local Indonesia Arabica coffee base on its cupping and variety variation. BIO Web of Conferences 2024; 101, 01003.
[61] Y Abubakar, MR Alya, A Karim and YD Fazlina. Effect of variety and farm altitude on chemical content of Arabica coffee (Coffea arabica) grown in Gayo Highland, Indonesia. IOP Conference Series: Earth and Environmental Science 2024; 1356, 012030.
[62] RA Firnabillah, E Mustaro and E Marwani. Biochemical composition and volatile profile analysis of three varieties of Coffea arabica and their correlation with the microclimate of Mount Tangkuban Perahu, West Java, Indonesia. Journal of Biological Diversity 2024; 25(2), 3264-3276.
[63] LB Acre, T Viencz, JS Francisco, RB Rocha, EA Alves and MT Benassi. Composition of Coffea canephora varieties from the Western Amazon. Journal of the Brazilian Chemical Society 2024; 35(8), e-20240031.
[64] LF Echeverri-Giraldo, VO Perez, CT Arboleda, LJV Gutierrez and LCI Quinchua. Content of acidic compounds in the bean of Coffea arabica L., produced in the Department of Cesar (Colombia), and its relationship with the sensorial attribute of acidity. Separations 2024; 11(2), 52.
[65] I Rahmawati and SH Asrori. Comparative analysis of caffeine content in cold and hot brewed robusta coffee using high-performance liquid chromatography (HPLC). JKPK 2024; 9(1), 15.
[66] YA Jeon, P Natraj, SC Kim, JK Moon and YJ Lee. Comparative analysis of phytochemical and functional profiles of Arabica coffee leaves and green beans across different cultivars. Foods 2024; 13(23), 3744.
[67] N Fitri, N Nurhaliza, ES Anggraeni, D Herawati, D Hunaefi and S Noviasari. Chemical composition, antioxidant activity, and sensory profile of espresso-based Arabica coffee from different bean origins. Beverage Plant Research 2024; 5(1), e008.
[68] BW Duke, MA Mokonon, ND Mekonin and KD Kuffi. Effects of roasting degree and grinding size on caffeine content and sensorial quality of coffee. Journal of Food Quality 2025; 2025, 2405668.
[69] LC Souza, MAG Ferrao, AFAD Fonseca, PS Volpi, M Comerio, LL Pereira, JAM Carvalho, SH Saraiva, PF Pinheiro, ALD Silva Junior and TCB Soares. An interdisciplinary approach for evaluating beverage quality in Coffea canephora. Anais da Academia Brasileira de Ciencias 2025; 97(2), e20240084.
[70] RS Katarzyna, AP Anna, B Maciej, SM Lidia, S Tomasz and SS Kinga. Roasting temperature as a factor modifying the caffeine and phenolic content of Ethiopian coffee. Processes 2025; 13(7), 2037.
Supplementary Materials
Table S1 Articles included in the review.
No |
Year |
Author |
Title |
1 |
2016 |
Jeszka-Skowron et al. [13] |
Chlorogenic acids, caffeine content and antioxidant properties of green coffee extracts: influence of green coffee bean preparation |
2 |
2018 |
Angeloni et al. [33] |
Characterization and comparison of cold brew and cold drip coffee extraction methods |
3 |
2018 |
Bauer et al. [34] |
Effect of roasting levels and drying process of Coffea canephora on the quality of bioactive compounds and cytotoxicity |
4 |
2021 |
Worku et al. [35] |
Shade and postharvest processing effects on arabica coffee quality and biochemical composition in lowland and midland coffee-growing areas of Southwestern Ethiopia |
5 |
2019 |
Asfew and Dekebo [36] |
Determination of caffeine content in Wollega Zones, Ethiopian coffee bean, pulp and leaves by high performance liquid chromatography |
6 |
2019 |
Pinheiro et al. [37] |
Physico-chemical properties and sensory profile of Coffea canephora genotypes in high-altitudes |
7 |
2019 |
Wongsa et al. [38] |
Quality and bioactive compounds of blends of Arabica and Robusta spray-dried coffee |
8 |
2019 |
Chindapan et al. [39] |
Roasting kinetics and chemical composition changes of Robusta Coffee beans during hot air and superheated steam roasting |
9 |
2020 |
Budiastra et al. [40] |
Determination of trigonelline and Chlorogenic Acid (CGA) concentration in intact coffee beans by NIR spectroscopy |
10 |
2020 |
Mengistu et al. [22] |
Biochemical compounds of Arabica coffee (Coffea arabica L.) varieties grown in northwestern highlands of Ethiopia |
11 |
2020 |
Bolka and Emire [25] |
Effects of coffee roasting technologies on cup quality and bioactive compounds of specialty coffee beans |
12 |
2020 |
Yeison et al. [15] |
Effect of the postharvest processing method on the biochemical composition and sensory analysis of Arabica Coffee |
13 |
2020 |
Jeszka-Skowron et al. [9] |
Comparison of methylxantines, trigonelline, nicotinic acid and nicotinamide contents in brews of green and processed Arabica and Robusta coffee beans – Influence of steaming, decaffeination and roasting processes on coffee beans |
14 |
2021 |
Jung et al. [41] |
Effect of roasting degree on the antioxidant properties of espresso and drip coffee extracted from Coffea arabica cv. Java |
15 |
2021 |
Awwad et al. [42] |
Quantification of caffeine and chlorogenic acid in green and roasted coffee samples using HPLC-DAD and evaluation of the effect of degree of roasting on their levels |
16 |
2021 |
Montenegro et al. [43] |
Bioactive compounds, antioxidant activity and antiproliferative effects in prostate cancer cells of green and roasted coffee extracts obtained by Microwave-Assisted Extraction (MAE) |
17 |
2021 |
Espindula et al. [44] |
Quality evaluation of Coffea canephora ‘Apoatã’ seeds for rootstock production |
18 |
2021 |
Duangjai et al. [45] |
Shifting of physicochemical and biological characteristics of coffee roasting under Ultrasound-Assisted Extraction |
19 |
2021 |
Muzykiewicz-Szymanska et al. [46] |
The effect of brewing process parameters on antioxidant activity and caffeine content in infusions of roasted and unroasted Arabica coffee beans originated from different countries |
20 |
2021 |
Tsai and Jioe [8] |
The analysis of chlorogenic acid and caffeine content and its correlation with coffee bean color under different roasting degree and sources of coffee (Coffea arabica Typica). |
21 |
2021 |
Cordoba et al. [47] |
Chemical and sensory evaluation of cold brew coffees using different roasting profiles and brewing methods |
22 |
2022 |
Santosa et al. [11] |
Sensory analysis, caffeine, chlorogenic acid and non-volatile taste compounds of Arabica Coffee (Coffea arabica) Fermented with sugar addition for brew taste |
23 |
2022 |
Yulianti et al. [10] |
Physicochemical characteristics and bioactive compound profiles of Arabica Kalosi Enrekang with different postharvest processing |
24 |
2022 |
Analianasari et al. [48] |
Evaluasi pasca panen, cacat mutu dan atribut kimia (kafein, asam klorogenat) kopi robusta Lampung Barat (studi kasus gapoktan di Lampung Barat |
25 |
2022 |
Portela et al. [49] |
Effects of brewing conditions and coffee species on the physicochemical characteristics, preference and dynamics of sensory attributes perception in cold brews |
26 |
2022 |
Dias et al. [21] |
Bioactive compounds in blends of coffee defects originating from the harvesting |
27 |
2022 |
Lemos et al. [50] |
Chlorogenic acid and caffeine contents and anti-inflammatory and antioxidant activities of green beans of conilon and arabica coffees harvested with different degrees of maturation |
28 |
2022 |
Prasetya et al. [51] |
Chemical quality, preference, and business analysis of Kepahiang Robusta Coffee by roasting equipment type |
29 |
2023 |
Yulianti et al. [52] |
Physicochemical properties of ‘Cisalak’ Robusta Coffee with hot air based roasting method |
30 |
2023 |
Santantoglia et al. [53] |
Effect of brewing methods on acrylamide content and antioxidant activity: studying eight different filter coffee preparations |
31 |
2023 |
Ramadhani et al. [54] |
Differences in chemical characteristics due to different roasting of Robusta coffee beans |
32 |
2023 |
Dong et al. [55] |
Exploring correlations between green coffee bean components and thermal contaminants in roasted coffee beans |
33 |
2023 |
Oksari et al. [56] |
Characteristics of ground coffee quality on variations in temperature and roasting time for Robusta coffee (Coffea Canephora Pierre Ex A.Froehner) green bean |
34 |
2023 |
Gallardo-Ignacio et al. [57] |
Chemical and biological characterization of green and processed coffee beans from Coffea arabica varieties |
35 |
2023 |
Arum et al. [58] |
Study of organic acid and caffeine content of Arabica coffee beans (Coffea arabica) Processing of the Java Ijen Sukosari Bondowoso Farmers Group |
36 |
2023 |
Linda et al. [59] |
The effect of several postharvest processing on the quality of Robusta Coffee (Coffea canephora) |
37 |
2024 |
Anh-Dao et al. [5] |
Changes in the total phenolic contents, chlorogenic acid, and caffeine of coffee cups regarding different brewing methods |
38 |
2024 |
Misto et al. [60] |
Identification of Chlorogenic Acid, Caffeine, Melanoidin, Sucrose, and Protein Content of Local Indonesia Arabica Coffee base on its cupping and variety variation |
39 |
2024 |
Herawati et al. [17] |
Impact of bean origin and brewing methods on bioactive compounds, bioactivities, nutrition, and sensory perception in coffee brews: An Indonesian coffee gastronomy study |
40 |
2024 |
Rusinek et al. [16] |
Effect of the roasting level on the content of bioactive and aromatic compounds in Arabica coffee beans |
41 |
2024 |
Abubakar et al. [61] |
Effect of variety and farm altitude on chemical content of Arabica coffee (Coffea arabica) grown in Gayo Highland, Indonesia |
42 |
2024 |
Firnabillah et al. [62] |
Biochemical composition and volatile profile analysis of 3 varieties of Coffea arabica and their correlation with the microclimate of Mount Tangkuban Perahu, West Java, Indonesia |
43 |
2024 |
Acre et al. [63] |
Composition of Coffea canephora Varieties from the Western Amazon |
44 |
2024 |
Echeverri-Giraldo et al. [64] |
Content of acidic compounds in the bean of Coffea arabica L., Produced in the Department of Cesar (Colombia), and its relationship with the sensorial attribute of acidity |
45 |
2024 |
Rahmawati and Asrori [65] |
Comparative analysis of caffeine content in cold and hot brewed Robusta coffee using High-Performance Liquid Chromatography (HPLC) |
46 |
2024 |
Jeon et al. [66] |
Comparative analysis of phytochemical and functional profiles of Arabica coffee leaves and green beans across different cultivars |
47 |
2025 |
Fitri et al. [67] |
Chemical composition, antioxidant activity, and sensory profile of espresso-based Arabica coffee from different bean origins |
48 |
2025 |
Duke et al. [68] |
Effects of roasting degree and grinding size on caffeine content and sensorial quality of coffee |
49 |
2025 |
Souza et al. [69] |
An interdisciplinary approach for evaluating beverage quality in Coffea canephora |
50 |
2025 |
Katarzyna et al. [70] |
Roasting temperature as a factor modifying the caffeine and phenolic content of Ethiopian Coffee |
Table S2 Risk of Bias Assessment of included in the review.
No |
Author |
Domain |
Risk Level |
Justification (Quote from study) |
Interpretation |
1 |
Jeszka-Skowron et al. [13] |
Selection bias |
Low |
Twelve green coffee beans of different origin Coffea arabica: Brazil (TG), Rwanda (Ordinary), China, Laos a Coffea robusta: Vietnam (Gr2), Vietnam (Gr2) decaffeinated by dichloromethane and Vietnam (Gr2) steamed (3 bar pressure for 30 min), India (Cherry), Indonesia, Laos (FAQ), Uganda (Sc) and Uganda (Bugishu), were obtained from a producer (Strauss Café, Poland). The geographical origin of the samples and their types were confirmed by the supplier. The moisture content of coffee beans was above 12 %. |
The study clearly described the types and geographical origins of the coffee samples analyzed, including different species and producing countries. This detailed description of sample characteristics reduces the risk of bias related to sample selection. |
Performance bias |
Low |
0.5 g of milled beans was extracted by 20 mL of distilled water (94 °C) for 10 min. Then, the solution was cooled to room temperature, centrifuged (5 min, 4500 rpm) and decanted. The extracts were lyophilized (Lyophilizator Alpha 1-2 LD plus; Martin Christ, Germany). Before analysis, extracts were dissolved in 1 mL of Millipore water and filtered through 0.2-μm polytetrafluoroethylene syringe filter from Agilent Technologies (Santa Clara, CA, USA). |
The extraction and sample preparation procedures were clearly described, including solvent volume, extraction temperature, and time, allowing reproducibility of the analytical process. |
||
Detection bias |
Unclear |
Caffeine was determined using chromatographic system equipped with analytical HPLC automated sample injector and DAD lamp (Agilent Technologies, CA, USA)… Detection was accomplished with a diode array detector (DAD), and chromatograms were recorded at 325 nm for chlorogenic acids and 276 nm for caffeine. Identification of 5-CQA was performed by comparing the retention time and the photodiode array spectra with those of its reference standard compound |
The analytical method was described in detail; however, validation parameters such as limit of detection or limit of quantification were not reported. |
||
Attrition bias |
Low |
Results are expressed as mean ± standard deviation (at least three replicates) |
The study reported replicate measurements and statistical analyses, indicating completeness and reliability of the experimental data. |
||
Reporting bias |
Low |
The levels of caffeine… are given in Table 1… Three major chlorogenic acids were determined by chromatographic analysis |
The study reported quantitative concentrations of caffeine and chlorogenic acids and presented the results in tables, indicating transparent reporting of analyzed compounds. |
||
2 |
Angeloni et al. [33] |
Selection bias |
Low |
The same batch of coffee was used for all extractions (Illy Rosso 100% Arabica) |
The type and source of coffee samples were clearly described and all analyses were performed using the same batch of beans. |
Performance bias |
Low |
“Each pack of coffee beans (250 g) was opened immediately before brewing to avoid oxidative damage… all samples were prepared using the same commercial brand of mineral water”, “For cold drip method, samples were prepared using 25 g coffee powder and 250 mL mineral water… Extraction was performed at room temperature (22°C) and at refrigerator temperature (5°C)” “French press were prepared with coarse-ground coffee (25 g) and hot water (250 g at 95°C)… brewed for 5 min” |
The study provided detailed descriptions of sample preparation and brewing procedures, including coffee-to-water ratio, extraction time, temperature, and brewing equipment for different extraction methods. The use of the same coffee batch and consistent brewing parameters helps ensure controlled experimental conditions and reproducibility |
||
Detection bias |
Unclear |
CGAs were evaluated by HPLC/DAD using a five-point calibration curve of chlorogenic acid (purity 99%) (Extrasynthèse, Genay, France) at 330 nm (r2 = 0.999), and caffeine content was determined by HPLC/DAD using a six-point calibration curve from Extrasynthèse (purity 95%) at 278 nm (r2 = 0.999) |
The calibration curve showed good linearity; however, validation parameters such as limit of detection and limit of quantification were not reported. |
||
Attrition bias |
Low |
Differences between means were assessed using a 3-way ANOVA… Tukey HSD test (p<0.05). |
The study clearly reported the statistical analyses used to evaluate differences among experimental factors, indicating that the experimental data were analyzed systematically |
||
Reporting bias |
Low |
Caffeine and CGA content (mg/mL) are shown in Table 5 |
The study reported quantitative results for caffeine and chlorogenic acids, including mean values, standard deviations, and statistical significance. |
||
3 |
Bauer et al. [34] |
Selection bias |
Low |
The green coffee beans from Coffea canephora used in this study were purchased from coffee producers in Colatina, Espírito Santo, Brazil |
The study clearly reported the species and geographical origin of the coffee samples used, including the location where the beans were obtained and the facilities where the samples were stored and processed. This information helps ensure transparency in sample selection.
|
Performance bias |
Low |
Green coffee beans were sorted to remove filth and bad beans… light roasting was performed at 230 °C for 12 min, medium roasting at 240 °C for 14 min and dark roasting at 245 °C for 15 min… coffee powders were sieved (710 µm)… extraction was performed in hot water (90–95 °C) for 10 min with ultrasound treatment |
The study described the sample preparation and processing steps in detail, including sorting, roasting conditions, grinding, particle size standardization, and extraction parameters. These controlled experimental conditions help ensure consistency in sample treatment and improve reproducibility of the analytical results. |
||
Detection bias |
Unclear |
The caffeine content was measured by the HPLC method adapted by Perrone et al. using a Waters Alliance 2695 chromatograph with PDA detector… Detection was performed at 272 nm. was performed at 320–325 nm using external standards. |
The chromatographic method was described; however, method validation parameters such as LOD and LOQ were not reported |
||
Attrition bias |
Low |
Results are presented as mean with the corresponding standard deviation of duplicates of two different experiments (n = 6). |
The study reported replicate measurements and statistical analyses, indicating completeness and reliability of the experimental data. |
||
Reporting bias |
Low |
The caffeine content was affected by roasting (Table 3)… |
The study reported quantitative results for caffeine, including mean values, standard deviations, and statistical significance. |
||
4 |
Worku et al. [35] |
Selection bias |
Low |
Samples of green arabica coffee beans were collected from ten sites located at two elevation ranges in southwestern Ethiopia… Geographical and environmental details of each sampling location are shown in Table 1 |
The sampling locations and environmental characteristics of the coffee samples were clearly described, indicating transparent sample selection. |
Performance bias |
|
From the six samples of ripe-red coffee cherries collected from shade and no shade per site, three samples were subjected to wet processing... Consequently, the washed-parchment-beans were sun-dried on raised drying-beds until a moisture content of ca. 11.5 %. Then, clean beans of each sample were packed in 1 kg plastic bags and stored at room temperature until quality and chemical analyses were carried out. |
Controlled experimental conditions and standardized sample preparation were applied. |
||
Detection bias |
Low |
Quantification was performed by reporting the measured integration areas in the calibration equation of the standard, Limits of detection (LOD) and quantification (LOQ) respectively were 0.8 and 1.6 µg g-1 of sample for CGAs, and 1.5 and 3.0 µg g-1 of sample for caffeine. |
The study described the analytical instrumentation, chromatographic conditions, and calibration procedures used for compound determination. |
||
Attrition bias |
Unclear |
The analysis was conducted using the Mixed procedure of SAS 9.4 (SAS, 2014For significant (p < 0.05) effects, multiple means comparison was conducted using the least square means (lsmeans) statement of Proc Mixed at the 5 % level of significance. |
The study reported mean values for the analyzed compounds; however, measures of variability such as standard deviation or information on replicate analyses were not provided. |
||
Reporting bias |
Low |
Means (based on the main effect of postharvest processing nested in elevation range) of bean physical quality, total preliminary quality and contents of caffeine and CGAs (3-CQA, 5-CQA, 3,5diCQA, FQA, FCQA and TCGAs) are presented in Table 6 |
Results were presented transparently, including numerical values and statistical significance. |
||
5 |
Asfew and Dekebo [36] |
Selection bias |
Low |
Based on the above selection, coffee samples were collected from Anfilo, Sayyo and Gidami for Kelem Wollega, Nole, Gimbi (Gambela) and Begi for West Wollega and Sasiga, Harolimu and finally Nunukumba for East Wollega. Coffee beans, pulp and leaves were tracted from commercial Arabica variety |
The study clearly described the species and geographical origin of the coffee samples used in the analysis. |
Performance bias |
Low |
0-g portions of ach coffee beans, pulp and leaves were roasted using a local coffee roasting machine. Each of the roasted samples were ground and screened through 250 μm sieves to get a uniform texture. In the next step, 2.5 g of sample powder was measured and added into 100 mL beaker. Then, 50 mL of the boiled water was added over the coffee bean powder… |
The sample preparation and extraction procedures were clearly described, allowing reproducibility of the experimental process. |
||
Detection bias |
Low |
Caffeine in the filtered beverages of coffee samples was analyzed using column German (Zobax-SB-C8) HPLC and detected by UV/Vis detector at the wavelength of 272 nm and quantified using a calibration graph… The limit of detection (LOD) is defined as the lowest concentration of an analyte in a sample that can be detected but not quantified.. |
The study described the analytical instrumentation, chromatographic conditions, and calibration procedures used for compound determination. |
||
Attrition bias |
Low |
All measurements and analyses were carried out in triplicates. The results were expressed as mean ± standard error of three parallel replicates. Analysis of variance was performed by using one way ANOVA. The results with p < 0.05 were regarded to be statistically significant. |
The study reported replicated measurements and applied appropriate statistical analyses. |
||
Reporting bias |
Low |
As shown in Fig. 3, the caffeine level of coffee beans, pulp and leaves. |
The concentrations of the analyzed compounds were clearly reported with variability measures. |
||
6 |
Pinheiro et al. [37] |
Selection bias |
Low |
Twenty-two genetic materials of Coffea canephora from the Incaper breeding program were analyzed… Grain samples, obtained in the 2016 harvest… During the harvest, in July-August 2016, 3.0 kg of cherry coffee were harvested from each plot for post-harvest evaluations regarding sensory and physicochemical analysis. The samples of cherry coffee were dried on covered ground until reaching 11-12% humidity (natural processing). |
Detailed information about the sampling sites and sample characteristics was provided, ensuring transparency in sample selection. |
Performance bias |
Low |
For the simultaneous determination of chlorogenic acid, trigonelline and caffeine, 0.5 g of ground coffee was dissolved in 100 mL of Mili-Q water at 80oC under magnetic stirring for 15 minutes. After this time, simple filtration was carried out and the filtrate was collected in a 100 mL volumetric flask. After the filtrate cooled to room temperature, it was filtered through a syringe membrane filter (0.45µm pore size) and the aqueous coffee extracts were placed in 1-mL vials |
The sample preparation and extraction procedures were clearly described, allowing reproducibility of the experimental process. |
||
Detection bias |
Unclear |
These extracts were analyzed by high-performance liquid chromatography (HPLC) using a Shimadzu Chromatograph … The system was coupled to a Shimadzu UV-Visible spectrophotometric detector… The external standard method was used in the simultaneous quantification of chlorogenic acid, trigonelline and caffeine contents in C. canephora coffee samples… The calibration curves were obtained with R2> 0.99 from the peak areas obtained in the chromatograms for each standard substance at different concentrations. |
The chromatographic method was described; however, method validation parameters such as LOD and LOQ were not reported |
||
Attrition bias |
Unclear |
Data was submitted to analysis of variance for each response variable and, in significant cases (P <5%), the ScottKnott averages group test (P <5%) was applied. Analyses were performed using the GENES software (Cruz, 2016). |
The reported results lacked variability indicators such as standard deviation, making it unclear whether replicate analyses were performed. |
||
Reporting bias |
Low |
The levels of chlorogenic acid (5-ACQ) found for C. canephora coffee samples presented a statistical difference. The values found ranged from 2.60 to 3.65%... There was no significant difference in the values of trigonelline found for the 21 samples of C. canephora coffee. The total average value found was 0.93%, which is in accordance with the literature. |
The study provided detailed quantitative results with statistical comparisons among samples. |
||
7 |
Wongsa et al. [38] |
Selection bias |
Low |
Green Arabica coffee (Coffea arabica L. cv. Catimor) beans were kindly donated by Chang Mountain Coffee Ltd, Chiang Rai province (19° 54′ 30″ N, 99° 49′ 56″ E, 580m above sea level), in the northern part of Thailand. The coffee beans were produced from wet processing… Green Robusta coffee (Coffea canephora L. cv. Chumphon 84-4) beans were purchased from HillKoff Thai Hill Tribe Coffee Ltd, Chiang Mai. This dry processed green coffee. The medium roasting process started when the temperature of roasting beans reached 210°C. |
The study specified the source and geographical origin of the coffee beans, reducing the risk of bias in sample selection. |
Performance bias |
Low |
Coffee extract was prepared by grinding roasted Robusta and green Arabica coffee beans according to the mixing ratios shown in Table 1. Blended coffee beans were then extracted with boiling water at a mixing ratio between coffee beans and boiling water of 1:5 (w/w) for 10min before filtrating through double layers of cheesecloth…. and stored in a desiccator prior to analysis. |
The study provided detailed descriptions of the roasting, grinding, and extraction procedures used in the experiment. |
||
Detection bias |
Unclear |
All HPLC analyses were performed on a bridged ethylene hybrid (BEH) C18 analytical column (100 mm×2.1mm, 1.7µm, Waters Pacific Pte Ltd, Singapore) and set thermostatically to 25 °C… The UV detection wavelength was set at 272nm for caffeine, 280nm for caffeic, p-coumaric and ferulic acids and 320nm for chlorogenic acid. Peaks were identified by comparing their retention times and spectral characteristics with those of reference standard |
The chromatographic method was described; however, method validation parameters such as LOD and LOQ were not reported |
||
Attrition bias |
Low |
Results were expressed as mean ± standard deviation. All results were statistically analysed by conducting ANOVA and Duncan tests (p > 0.05) to find significant differences between the samples. |
The results were reported as mean ± standard deviation, indicating that replicate measurements were performed. |
||
Reporting bias |
Low |
The bioactive content of spray-dried coffee samples is shown in Table 2. |
The study provided detailed quantitative results with statistical comparisons among samples. |
||
8 |
Chindapan et al. [39] |
Selection bias |
Low |
Green coffee beans of Robusta variety (Coffea canephora) with an initial moisture content in the range of 12.5 ± 0.5 (%d.b.) … Defective beans were manually removed and the rest was sieved through a screen having diameters of 6 to 7 mm. The prepared green beans were kept in a plastic box at room temperature until the time of a roasting experiment. |
Detailed information about the sampling sites and sample characteristics was provided, ensuring transparency in sample selection. |
Performance bias |
Low |
One kg of green Robusta coffee beans (which resulted in an initial bed height within the roasting chamber of 10 cm) was dropped into the roasting chamber when the chamber was well conditioned at 190, 210, 230, and 250 °C. A superficial roasting medium velocity of 1.5 times the minimum fluidization velocity (Umf) was used in all cases. In the case of superheated steam roasting... For hot air roasting, the experiments were conducted at the air velocity of 2.83 m/s in all case |
Experimental conditions such as extraction temperature, time, and sample preparation were clearly reported. |
||
Detection bias |
Unclear |
The caffeine content of the beans was determined based on the AOAC Official Method 960.25 … Twenty microliters of the sample was injected into a highperformance liquid chromatograph (1200 Infinity; Agilent, Waldbronn, Germany) equipped with a diode array detector (Agilent) and UV detector operated at 254 nm. Standard caffeine was analyzed at the same conditions to prepare the standard curve with R2 of 1.00. Analytical procedures were duplicated for each sample. The coefficient of variation (CV) was lower than 15% in all cases. |
The chromatographic method was described; however, method validation parameters such as LOD and LOQ were not reported |
||
Attrition bias |
Low |
All experiments were performed in triplicate and the results are presented as mean values with standard deviations. All statistical calculations were performed using SPSS 16.0 for Windows |
The study reported replicated measurements and applied appropriate statistical analyses |
||
Reporting bias |
Low |
Table 2 lists the changes in the caffeine content of coffee beans during roasting at different conditions |
The study reported quantitative results for the analyzed compounds in tables |
||
9 |
Budiastra et al. [40] |
Selection bias |
Low |
A batch of samples of Arabica Java Preanger green coffee bean (water content 11% – 12%) from Indonesian Coffee and Cocoa Research Institute (ICCRI) were used for this experiment. |
Detailed information about the sample was provided |
Performance bias |
Unclear |
10 g out of 96 g was grounded using grinder, and then the ground coffee bean were used for trigonelline and CGA measurement |
Extraction conditions were not clearly described |
||
Detection bias |
High |
Analysis detail are not explained |
Analysis for trigonelline and CQA are not explained |
||
Attrition bias |
Low |
The calibration model performance was evaluated based on their correlation coefficient (r), standard error (SE) |
The study reported replicated measurements and applied appropriate statistical analyses |
||
Reporting bias |
Unclear |
Trigonelline and CGA concentration in Java Preanger green coffee bean were around 0, 9% and 6%, respectively (Table 1) |
|
||
10 |
Mengistu et al. [22] |
Selection bias |
Low |
Coffee beans were collected from coffee trees grown in research sites of Adet, and Woramit Agricultural Research Centers which were planted in 2010 with Randomized Complete Block Design and three replication Eight coffee varieties were grown in Adet and Woramit Agricultural Research sites which were planted in 2010 for adaptation trail. |
The study specified the source and geographical origin of the coffee beans, reducing the risk of bias in sample selection. |
Performance bias |
Low |
Caffeine, chlorogenic acids, and trigonelline were extracted and purified according to the methodof Ky et al. (2001). Half a gram of each ground coffee sample (8 x 3 replications) was accurately weighed in 100 ml Erlenmeyer flask and... Extracts were filtered using Whitman filter paper and … for caffeine, chlorogenic acids, and trigonelline determination |
Controlled experimental conditions and standardized sample preparation were applied. |
||
Detection bias |
Unclear |
Caffeine, trigonelline, and chlorogenic acid contents of the sample coffee beans were determined using the HPLC system consisting of the Discovery C 18 column with an Isocratic flow of 1 ml/min. A calibration curve was made using the standard concentration and area of the sample |
Chromatographic conditions and calibration procedures were mentioned; however, the sensitivity of the analytical method could not be assessed because LOD and LOQ were not reported. |
||
Attrition bias |
Unclear |
The collected data were subjected to Analysis of Variance (ANOVA) using the general linear model (GLM) Statistical Software Program (SAS 9.4). Whenever ANOVA showed significant variation |
Although ANOVA was applied for statistical analysis, the number of replicate measurements or sample size used for the analysis was not specified. |
||
Reporting bias |
Low |
At Woramit, the highest TRG content was obtained from Ageze local coffee (1.11%) variety followed byYachi (1.07%) while the lowest value was recorded from the variety 741 (0.87%) as indicated in Table 3… In Woramit, the highest CGA concentration was obtained from a variety of 7440(4.96%) followed by Ababuna (4.95%) variety while the lowest was recorded from Merdacheriko(2.95%) variety (Table 3)… In Woramit, the highest caffeine concentration was obtained from Ageze local coffeevariety (1.60%) while the lowest was from Merdacheriko (1.13%) variety (Table 3) |
The concentrations of the analyzed compounds were clearly reported with variability measures |
||
11 |
Bolka and emire [25] |
Selection bias |
Low |
Three Ethiopian specialty green coffee beans (coffee Arabica species) were collected from Yirgacheffe, Harar, and Sidama coffee growing areas due to their unique sensory characteristics and high global market value. … Furthermore, all the samples were chosen to be unwashed or dry processed for wholesome coffee quality |
The study clearly described the origin of coffee beans and the selection criteria (processing method and quality characteristics), indicating transparent sample selection. |
Performance bias |
Low |
Each coffee sample was roasted at light, medium, and dark degree of roast using drum roaster (BRZ 4, Probat®, 2009), fluidized bed roaster (V3, IKAWA® Pro, 2018), and traditional oven top roaster. The roasting temperature was set to a maximum of 200°C, and the roasting time was limited to 15 min to ensure a dark roast at the end of each roasting process |
Roasting conditions and equipment were clearly described, suggesting standardized experimental procedures across samples. |
||
Detection bias |
Unclear |
The caffeine, trigonelline, and total chlorogenic acids (5-CQA) content of the roasted and ground coffee samples were simultaneously determined using a high-performance liquid chromatography method adopted from Vignoli et al. (2014). The analysis was performed using an HPLC system (Agilent 1,260 Infinity II) with a diode array detector (DAD). |
The analytical instrument and method were reported; however, validation parameters such as LOD or LOQ were not described. |
||
Attrition bias |
Low |
The experimental design was completely randomized, with a maximum of three observations. The obtained experimental results or data were analyzed and interpreted by using analysis of variance (ANOVA) at a level of 5% significance using Design Expert software version 6.0. |
Replicate observations and experimental design were reported, indicating that data variability was considered. |
||
Reporting bias |
Low |
Caffeine content (Figures 1-3) of roasted coffee beans, trigonelline content (Figures 4-6) of coffee beans varieties roasted by means of various roasters and total CGAs content (Figures 7-9) of coffee samples roasted by various roasters were presented consequently. |
The outcomes of interest were clearly reported and presented in figures |
||
12 |
Yeison et al. [15] |
Selection bias |
Low |
Forty kilograms of coffee cherries of the Castillo variety (Coffea arabica) were harvested at an altitude of 1650 m above sea level; only beans with an intense red coloration were selected…20 kg of coffee cherries were processed with the wet method, and the remaining 20 kg were processed using the semi-dry method, and in both cases the fermentation process was carried out at room temperature (27 ± 4 °C). |
Sample selection criteria and harvesting conditions were clearly described |
Performance bias |
High |
Not explained |
Extraction and preparation procedures were not described. |
||
Detection bias |
Unclear |
The determination of chlorogenic acid (CGA) and caffeine content was performed by HPLC… The separation was carried out for 24 min with a C18 column (150 × 4.6 mm i.d. 5 μm) (Scharlab, Barcelona, Spain). In the mobile phases a gradient of MeOH, water, and glacial acetic acid was used. Readings were made for chlorogenic acid at 324 nm and for caffeine at 280 nm; in both cases, 200 μl was injected at a flow rate of 1 ml/min. |
Analytical procedure and chromatographic conditions were described, but method validation parameters were not reported. |
||
Attrition bias |
Unclear |
The results of the analytical and sensory determinations were processed from an analysis of the variance (one-way or multifactor ANOVA) with a confidence level of 95%. Mean comparison analyses were performed to identify statistically significant differences of the parameters evaluated between the different categories. The statistical procedures were carried out with Statgraphics Centurion XVI |
Statistical analysis was described, but the number of replicate measurements underlying the analysis was not specified. |
||
Reporting bias |
Low |
Table 1 shows the mean values and the standard deviation for the physicochemical parameters… Mean values ± standard deviation of color parameters L*: lightness, a*: redness, b*: yellowness, pH, titratable acidity, CGA, and caffeine, in green and roasted samples. |
Results were clearly reported with variability measures. |
||
13 |
Jeszka-Skowron et al. [9] |
Selection bias |
Low |
Twenty six samples of green and roasted coffee beans from different regions/continents of the world were provided by Strauss Café Poland (Swadzim/Poznań, Poland): Robusta beans from Vietnam Gr2 (green and roasted beans Gr2, decaffeinated green and roasted Gr2, steamed green and roasted Gr2), Laos, Indonesia, Uganda and Uganda Bugishu as well as Arabica coffee beans: Brazil (TG), Congo, Guatemala (SGH), Honduras (HG), Laos, and Peru (HB). The geographical origin of the samples and their types were confirmed by the supplier. The roasting process of green coffee beans was performed at temperature 170–190 °C in 8 min |
The geographical origin and types of samples were described and verified by the supplier. |
Performance bias |
Low |
1 g of milled beans/leaves (Ika mill, IKA Works GmbH & Co. KG, Staufen, Germany and liquid nitrogen) or powder were extracted by 100 mL of distilled water (94 °C) for 10 min (Jeszka-Skowron, Sentkowska et al., 2016). Then the solution was decanted, cooled to room temperature and filtered through 0.45 μm polytetrafluoroethylene syringe filter from Agilent Technologies (Santa Clara, CA, USA) and finally diluted to proper volume with distilled water. |
Extraction conditions were clearly described, indicating standardized sample preparation. |
||
Detection bias |
Unclear |
The determination of nicotinamide, nicotinic acid, trigonelline, theophylline, theobromine and caffeine was done according to the previously described method (Jeszka-Skowron, Zgoła-Grześkowiak, & Frankowski, 2018) |
Analytical method was referenced but detailed chromatographic conditions were not provided in the text. |
||
Attrition bias |
Low |
All the results in the study (carried out in at least three replicates) were expressed as mean ± standard deviation (dry mass basis – dm). |
Replicate measurements and variability were clearly reported. |
||
Reporting bias |
Low |
The highest level of theobromine, the second methylxantine determined in the beverages, was found in mate teas and it was even 100 fold higher than in coffee brews (Table 1, Table 2, Table 3). |
The results of the analyzed compounds were clearly presented. |
||
14 |
Jung et al. [41] |
Selection bias |
Low |
Green coffee beans were Coffea arabica cv. Java species (Natural processed, Grade AA), collected in Laos from December 2017 to March 2018 and supplied by Moi Coffee Company (Yongin, Korea). Green coffee beans (250 g) were added to a roaster (Bullet R1, Aillio, Taipei, Taiwan) preheated to 170 °C. By varying the temperature at the end of roasting, four types of coffee beans with different roasting degrees were prepared. |
Sample origin and supplier were clearly described. |
Performance bias |
Low |
From 7 g of coffee powder, espresso coffee was extracted with distilled water up to 30 mL using a semi-automatic espresso machine. Samples were stored at −70 °C until analysis. From 15 g of coffee powder, drip coffee was extracted with distilled water up to 210 mL using A Clever Dripper (Mr. Clever, EK, Int’l Co., Ltd., Taipei, Taiwan). Samples were stored at −70 °C until analysis. |
Brewing procedures and sample preparation were clearly described. |
||
Detection bias |
Unclear |
The contents of chlorogenic acid and caffeine were analyzed by the HPLC system (Ultimate 3000, Thermo Fisher Scientific, Waltham, MA, USA) equipped with a UV–Vis detector…. The calibration curves were prepared using chlorogenic acid (Sigma Aldrich, St. Louis, MO, USA) and caffeine. |
Analytical method and calibration procedure were reported, although validation parameters were not mentioned. |
||
Attrition bias |
Low |
All measurements were carried out in triplicate. Results are expressed as mean ± standard deviation (SD). |
Replicate analysis and variability reporting indicate complete data reporting. |
||
Reporting bias |
Low |
In this study, the contents of chlorogenic acid of coffee extracts were significantly lowered as the roasting degree increased in both extracts (p < 0.05) (Table 4). n this study, we observed that caffeine content was the lowest at Light-medium roasting and was the highest at Very dark roasting, regardless of the extraction method (Table 4). |
The outcomes of interest were clearly reported with statistical analysis. |
||
15 |
Awwad et al. [42] |
Selection bias |
Low |
A total 52 samples of ground coffee beans (Coffea Arabica), which consisted of light-roasted (14 samples), medium-roasted (11 samples), dark-roasted (16 samples), and green coffee (11 samples) from various origins, were acquired from several stores in Jordan. |
Sample size and source were described, indicating transparent sample selection. |
Performance bias |
Low |
he extraction of coffee samples was performed according to the extraction procedure that was described by Hernandez et al. [26], but with minor modifications. All coffee samples were extracted using hot water at 75–85 °C at a ratio of 1:100 (coffee-to-solvent ratio)… Lastly, the coffee extracts were preserved in the freezer at a temperature of −20 °C until the analysis day. |
Extraction conditions and sample preparation were described. |
||
Detection bias |
Unclear |
HPLC instrumental setup comprised products of Hitachi Technologies (Tokyo, Japan). All analyses were performed in an air-conditioned laboratory (18 ± 2 °C)…. and UV detection was performed at 274 nm for caffeine and 330 nm for CGA. calibration standard solutions for caffeine (10, 50, 100, 200, 500, 1000 ppm) were prepared from the standard stock solution (1000 ppm) by appropriate dilution processes using the mobile phase. Calibration standard solutions for CGA (10, 50, 100, 200, 500, 1000 ppm) were prepared from the standard stock solution (1000 ppm) by appropriate dilution processes using methanol. |
Analytical instrumentation and calibration standards were reported, but LOD/LOQ were not described. |
||
Attrition bias |
Low |
The measurements of the coffee sample were performed in triplicates. The results were expressed as mean ± standard deviation for all the replicate measurements. The data obtained were statistically analyzed by using SPSS software. |
Replicate measurements and variability were reported. |
||
Reporting bias |
Low |
The concentrations of caffeine and CGA in percentage (C, %) and mg/L in green and roasted coffee beans based on roasting degree are reported in Table 1. |
The measured outcomes were clearly presented in tables. |
||
16 |
Montenegro et al. [43] |
Selection bias |
Low |
Green Coffea arabica (Arabica coffee) beans were purchased from growers in the Rio de Janeiro state, Brazil. The green coffee beans (GCB) were processed by three different roasting degrees… These roasting levels were classified by their color according to the Agtron Scale |
The origin of the coffee beans and roasting conditions were clearly described, indicating transparent sample selection. |
Performance bias |
Low |
To prepare the coffee extracts to be tested against prostate cancer cells, the milled samples were prepared using distilled water (aqueous extract - AE) and 50% ethanol (ethanolic extract - EE) as solvents... The MAE conditions were 40 s, at 240 W power at 50 ◦ C in an 8:1 liquid- solid ratio, as previously reported for effective extraction of phenolic compounds…. |
Extraction procedures and microwave-assisted extraction conditions were clearly reported, suggesting standardized sample preparation. |
||
Detection bias |
Unclear |
The determination of chlorogenic acid (5-CQA) was performed using a BDS Hypersil C18 column (5 cm × 4.6 mm and 2.6 μ m - Thermo Scientific, Massachusetts, USA). The mobile phase gradient consisted of the initial composition of 5% methanol (phase A) and 95% of a 0.5% formic acid solution (phase B), maintained for 6 min…. Samples were filtered through rapid filtration filter paper and microfiltered in disposable hydrophilic Teflon filters with a porosity of 0.22 μ m. The caffeine external standard was prepared by weighing approximately 30 mg of caffeine in a 30 mL volumetric flask, solubilized, and swelled with the mobile phase. Samples were read at 280 nm with a mobile phase flow rate of 0.5 mL/min, with 20 μ volume |
Chromatographic conditions and standards were described; however, validation parameters such as LOD or LOQ were not reported. |
||
Attrition bias |
Low |
All assays were performed in triplicate and results are expressed by mean ± standard deviation. Data were analyzed using GraphPad Prism |
Experiments were performed in triplicate and results were expressed as mean ± standard deviation. |
||
Reporting bias |
Low |
The content of phytochemical compounds is depicted in Fig. 2. Alterations in the content of bioactive compounds can be associated with the original content in the samples and with extraction efficiency |
The phytochemical results were presented in figures describing the variation in compound contents. |
||
17 |
Espindula et al. [44] |
Selection bias |
Low |
Seeds of C. canephora ‘Apoatã’ derived from crops with 15 years of age were used, located in the experimental field of Embrapa, in the municipality of Ouro Preto do Oeste, RO, Brazil… A total of 30 genotypes of late maturation cycle were selected, from which fruits were harvested manually in the “cherry” stage. The fruits were pulped in horizontal pulpers model DPMM-02 (Pinhalense®) and the seeds were dried under shade until reaching 13% moisture. After drying, the seeds were packed in paper bags and kept in air conditioned rooms at 25±2 °C. |
The source of seeds, cultivation conditions, and harvesting stage were clearly described. |
Performance bias |
Low |
The seeds were processed (elimination of the endocarp) and divided into two batches, being one of 500 g and another of 100 g. The first batch was sent to the Seed Laboratory of the Embrapa Rondônia where the tests were performed in order to evaluate the physiological and physical quality. The second batch was sent to the Laboratory of the Seed Sector of the Federal University of Lavras where the chemical components of seeds were determined. |
Sample processing and handling procedures were described across laboratories, suggesting standardized experimental preparation. |
||
Detection bias |
Unclear |
Total chlorogenic acids were evaluated according to the methodology proposed by Clifford and Wight (1976), and the caffeine content was determined by spectrophotometry according to methodology proposed by Li, Berguer and Hartland (1990). |
Analytical methods for chlorogenic acids and caffeine were referenced but detailed analytical parameters were not described. |
||
Attrition bias |
Low |
Tests were performed using completely randomized design with four replicates. Data were subjected to analysis of variance (p≤0.05) and the averages were grouped by Scott-Knott test (p≤0.05) through the SISVAR software (Ferreira, 2008). |
Replicate experiments and statistical analysis using ANOVA were clearly reported. |
||
Reporting bias |
Low |
Regarding the results of the chlorogenic acid contents, significant differences were observed among the genotypes (Table 2), |
Significant differences in chlorogenic acid content were presented in tables. |
||
18 |
Duangjai et al. [45] |
Selection bias |
Low |
Green coffee beans (Coffea arabica) were obtained from the Chao-Thai-Pukao Factory, Chiang Mai, Thailand. A voucher specimen of the coffee tree was deposited in the PNU herbarium of the Faculty of Biology, Naresuan University, Phitsanulok, Thailand, under collection number NU003806. Green coffee beans were roasted at distinct temperatures and time periods to obtain light, medium, and dark roasts under 10 to 20 min and 350 to 450°F (176.7-232.2°C). |
The origin of coffee beans and botanical identification were clearly documented with a voucher specimen. |
Performance bias |
Low |
Roasted coffee beans (light, medium, and dark) were subjected to extraction with water (1:5 w/v sample to water) using an ultrasonic bath operating at 35 kHz at 20, 40, or 80°C for 5, 10, or 20 min. After sonication, the solution was filtered and freeze-dried (ScanVac CoolSafe 110-4 Pro, Electronex, India). The crude light coffee (LC), medium coffee (MC), and dark coffee (DC) extracts were stored at −20°C until further analysis. |
Extraction conditions including solvent ratio, temperature, and sonication time were clearly described. |
||
Detection bias |
Unclear |
Coffee roast extracts were subjected to high-performance liquid chromatography (HPLC) to determine the levels of caffeine and chlorogenic acid. The HPLC separation was performed on a C18 column using mobile phase A (15% methanol) and mobile phase B (85% methanol:distilled water [30:70], 2% acetic acid; pH 3.4), at a flow rate of 0.5 ml/min with detection at 320 nm for chlorogenic acid and at 280 nm for caffeine. The peaks were identified by the reference standards. |
HPLC analysis and reference standards were reported; however, method validation parameters were not provided. |
||
Attrition bias |
Unclear |
Results were presented as the mean ± SEM. Data was evaluated using one-way ANOVA as appropriate by utilizing the Stat Plus data analysis package in Microsoft Excel Version 15 |
Results were expressed as mean ± SEM but the number of replicates was not clearly stated. |
||
Reporting bias |
Unclear |
The typical chromatograms and the amount of caffeine and chlorogenic acid in coffee roast extracts are shown in Figure 1 and Table 3 |
Results were reported in tables and chromatograms; however, variability indicators such as SD were not clearly provided. |
||
19 |
Muzykiewicz-Szymanska et al. [46] |
Selection bias |
Low |
Unroasted and roasted Arabica coffee beans from Brazil, Colombia, India, Peru, and Rwanda were used to prepare the infusions. The region of coffee from individual countries and the degree of roasting are summarized in Table 5 |
Coffee beans from multiple countries and roasting levels were described in detail. |
Performance bias |
Low |
The ground beans were poured over with boiled tap water at different temperatures (hot-brew and cold-brew method) and subjected to different brewing times. The details of the various brewing methods are presented in Table 2. The completed brews were filtered through filter papers. Prepared 5% (w/w) infusions were filtered through Whatman’s filter papers no. 4. All the extracts were stored at +4 °C until the analysis. |
Brewing methods and preparation procedures were clearly reported. |
||
Detection bias |
Low |
The concentration of caffeine in all coffee infusions was determined by high-performance liquid chromatography (HPLC-UV, Knauer, Germany). The tested compound was separated on a 125 × 4 mm column containing Hyperisil ODS (C18), particle size 5 μm. The mobile phase consisted of 0.5 M H3PO4 (pH 2.5), acetonitrile and MeOH in the ratio 180:20:10 (v/v/v), flow rate was 1 mL/min 20 µL of the analyzed sample was injected on the column. The determinations were carried out at 272 nm. The correlation coefficient of the calibration curve was r = 0.999 (y = 370683x + 32.205, retention time—2.05 min). |
The HPLC system and calibration curve were described, indicating appropriate analytical procedures. |
||
Attrition bias |
Low |
Each sample was analyzed in triplicate, and the results are presented as arithmetic mean ± standard deviation (SD). |
Replicate analyses were performed and results were reported as mean ± SD. |
||
Reporting bias |
Low |
The caffeine content in studied infusions is presented in Table 3, whereas the chromatogram presenting the analysis of the selected infusion (unroasted beans from Peru—86 °C, 4 min) in Figure 4. |
Caffeine concentrations were clearly presented in tables and chromatograms. |
||
20 |
Tsai and Jioe [8] |
Selection bias |
Low |
This experiment used Coffea arabica typica from Dongshan (23°17′ N 120°26′ E), Gukeng (23°37′ N 120°35′ E), and Sumatra’s Indonesian rain forest (0°59′ N 99°23′ E). |
Coffee bean origins and geographic coordinates were clearly specified. |
Performance bias |
Low |
Ground coffee beans (0.2 g) were extracted with 20 mL of 70% methanol for 10 min. After filtration, the suspension was centrifuged at 13,000 rpm for 10 min and the supernatant was collected and stored in a refrigerator until required |
Extraction conditions including solvent composition and centrifugation were described. |
||
Detection bias |
Unclear |
the sample was analyzed with a high-performance liquid analyzer (HPLC) Nexera XR LC-20AD (Shimadzu Corporation, Kyoto, Japan), auto sampler Nexera XR SIL 21-ACXR (Shimadzu Corporation, Kyoto, Japan), and Diode Array Detector SPD-M30A (Shimadzu Corporation, Kyoto, Japan). For chromatographic separation, we used a Mightysil RP-18 GP 250-4.6 (5 μm) column. B (80%–80%); and 15–20 min: A (85%–85%) B (15%–15%) at a flow rate of 1 mL/min. |
Detailed HPLC instrumentation and chromatographic conditions were reported, although method validation parameters were not specified. |
||
Attrition bias |
Unclear |
Determination of roasting levels, bean colors, chlorogenic acid, and caffeine content in coffee extracts was performed in triplicate, and the mean values were calculated. |
Measurements were performed in triplicate; however, only mean values were reported without clear variability indicators. |
||
Reporting bias |
Unclear |
The investigation of chlorogenic acid and caffeine contents of raw coffee beans from different sources showed that Indonesian raw coffee beans have the highest caffeine and chlorogenic acid contents of about 7.48 and 8.81 mg/g, respectively; while Gukeng and Dongshan raw coffee beans showed a slight difference in caffeine (5.06 and 4.35 mg/g, respectively) and chlorogenic acid (5 and 5.7 mg/g, respectively) contents (Figure 1A,B). |
Results describing compound contents were reported in figures, but variability measures such as SD were not clearly provided. |
||
21 |
Cordoba et al. [47] |
Selection bias |
Low |
Specialty Arabica coffee (Coffea arabica) from Linares-Nari˜ no (Colombia) was used in all experiments. Green coffee beans were processed by smallholder coffee growers in 2018 and roasted according to the methodology described in section 2.3. Roasted coffees were ground in a commercial mill (BUNN®, Mexico D.F.) until coarse grinding (701–900 μ m). Grinding level was determined according to the Colombian National Standard NTC 244 |
The origin of specialty Arabica coffee beans and grinding standards were clearly described, indicating transparent sample selection. |
Performance bias |
Low |
Cold brew coffee samples were prepared by dripping (CD) and immersion (CI). The operating variables of the coffee BM were adjusted according to preliminary studies… Cold drip coffees were prepared using Cold Bruer® equipment (Bruer, Santa Cruz, California, USA). The flow water average was fixed in 9.0 ± 1.0 drops every 30 s, for an average extraction time of 6.5 h. Filtered hot water (250 mL, 90 ± 3 ◦ C) was poured over the ground coffee (22.5 g) placed in the French press glass. After 5 min, the plunger was pressed over the coffee grounds until it reached the bottom of the vessel. |
Brewing procedures (cold drip, cold immersion, and French press) including extraction time, temperature, and coffee-to-water ratios were clearly reported. |
||
Detection bias |
Unclear |
The content levels of caffeine, trigonelline, and caffeoylquinic acids (CQAs, 4- and 5-caffeoylquinic) were determined by reversed-phase high-performance liquid chromatography (RP-HPLC), according to the study of Moreno, Ravent´ os, Hern´andez, & Ruiz (2014). The non-volatile compounds were quantitated by using the external standard method in the HPLC-PDA equipment. Concentrations were calculated using the regression equation with good linearity (R2 >0.994) of the external standard |
The RP-HPLC system, chromatographic conditions, and calibration with external standards were reported, although method validation parameters such as LOD/LOQ were not specified. |
||
Attrition bias |
Low |
All samples were analyzed in triplicate |
All samples were analyzed in triplicate. |
||
Reporting bias |
Low |
. These phenomena could explain the significantly higher TDS and extraction efficiency (mg/g ground coffee) of CQAs when the HTST profile was used (Table 3-IIB) |
Results explaining variations in CQAs and extraction efficiency were reported in tables. |
||
22 |
Santosa et al. [11] |
Selection bias |
Low |
Coffea arabica beans were harvested from selected cherries and then soaked for 12 hours. After that, the coffee beans were pulped using a vis-pulper (Honda GX 160-5.5 HP, Indonesia). Depulped coffee beans (no later than 2 hours) were added with D-fructose, D-glucose and sucrose at the concentration of 0.55%, 1.1% and 1.65%, respectively while honey and fullwash beans were without any addition sugars. |
Coffee cherries and processing methods were clearly described, including sugar addition treatments during fermentation. |
Performance bias |
Low |
Green beans (1 kg) were roasted using a machine (William Edison W600) following the method of Baggenstoss et al. (2008)… A total of 8.25 g of coffee powder was brewed with 150 mL of hot water temp (93 °C) for 4 min |
Roasting and brewing conditions were clearly described with standardized procedures. |
||
Detection bias |
Unclear |
Caffeine and chlorogenic acid were analyzed with a C18 column (5 μm 4.6 x 150 mm) and mobile phase A (0.3% formic acid in H2O) and mobile phase B (methanol). The elution gradient was set as follows: 15% B to 28% B in 10 minutes; 28% B to 30% B in 15 minutes; 30% B to 100% B in 3 minutes; 100% B maintained within 2 min and 100% B to 5% B in 5 minutes. The analysis time for 35 min at a flow rate of 0.2 mL/min |
Chromatographic separation conditions were described; however, calibration procedures or validation parameters were not clearly detailed. |
||
Attrition bias |
Low |
The data were summarized as means ± standard deviation (SD) and all results were in triplicate experiments. |
Results were expressed as mean ± SD with triplicate experiments. |
||
Reporting bias |
Low |
Table 3 shows that the (FW) caffeine content was lower than (H) and (F-0.55). Caffeine content in samples (F-0.55), (H) and (FW) in green beans were respectively 2.59 ± 0.04 mg/g, 2.63 ± 0.04 mg/g and 2.37 ± 0.20 mg/g. The content of chlorogenic acid in all coffee samples was demonstrated in Table 3 |
Quantitative results of caffeine and chlorogenic acid were reported with mean ± SD in tables. |
||
23 |
Yulianti et al. [10] |
Selection bias |
Low |
Coffee cherry “Arabica kalosi Enrekang” was harvested in May 2021, then processed under different methods, i.e. natural, full-washed, and honey… |
Coffee origin, harvest period, and postharvest processing methods were clearly reported. |
Performance bias |
Low |
Befero extraction, the green bean was added with liquid nitrogen before grinding. The grinding of green bean and roasted bean was conducted by coffee grinder (Gemilai crm905, China). Extraction of green and roasted bean followed procedures of Herawati et al. (2019). Bean powder (5 g) was dissolved in 100 mL of boiling distilled water under constant stirring for 1 min… |
Grinding and extraction procedures were described, suggesting standardized sample preparation. |
||
Detection bias |
Low |
Quantification of CQA conformed to method of Herawati et al. (2019) with modification… Detection was performed using PDA SPD-M40 at 320 nm. Standard curve plotting 5 points of 3-CQA, 4-CQA, and 5-CQA at concentration of 5-83 mg/L (triplicates: 3-CQA = LoD 4.78 mg/L, LoQ 1.43 mg/L, r2 0.99; 4-CQA = LoD 2.39 mg/L, LoQ 0.72 mg/L, r2 0.99; and 5-CQA = LoD 0.65 mg/L, LoQ 0.20 mg/L, r2 0.99)… |
HPLC analysis included calibration curves, LOD, LOQ, and linearity values, indicating validated analytical procedures. |
||
Attrition bias |
Unclear |
Means were analyzed using single factor ANOVA. Significant difference between means was verified using Duncan test at P < 0.05 and T-Test between green beans and roasted beans with the same post-harvest processing (significant P < 0.05) |
Statistical analysis using ANOVA and post-hoc tests was described; however, replicate measurements underlying the analysis were not clearly stated. |
||
Reporting bias |
Low |
As exhibited in Table 2, postharvest processing did not affect level of 3-CQA and 5-CQA (P > 0.05), but significantly altered content of 4-CQA and total CQAs (P < 0.05)… |
Results for CQA and total CQAs were presented in tables with statistical significance. |
||
24 |
Analianasari et al. [48] |
Selection bias |
Unclear |
Biji hijau kopi robusta dan kopi bubuk dari masing-masing pengolahan natural, honey, dan full wash… |
The types of robusta coffee samples and processing methods were described but with limited detail regarding sample source. |
Performance bias |
Unclear |
Penyangraian secara semi mekanis menggunakan drum stainlees dengan bahan bakar kayu, dan mesin penyangraian mekanis menggunakan alat sangrai |
Roasting procedures were described but without detailed control parameters for experimental consistency. |
||
Detection bias |
Unclear |
Asam klorogenat diabakisis dengan HPLC dengan kolom fase reverse-ODS, detector fotodioda arraypada 278 nm.. kandungan diperoleh dengan membandingkan kromatografi standar dan sampel |
HPLC analysis was mentioned but detailed chromatographic conditions and calibration procedures were not clearly described. |
||
Attrition bias |
Unclear |
Perbedaan pada taraf 5% dengan uji duncan |
Statistical testing using Duncan test was reported but replicate numbers were not specified. |
||
Reporting bias |
Unclear |
Gambar 5 menunjukkan kandungan kafein dan asam klorogenat pada proses penyangraian semi mekanis dan mekanis |
Results were mainly presented in figures without detailed numerical variability measures. |
||
25 |
Portela et al. [49] |
Selection bias |
Low |
High cup quality coffees of both species with a medium roast degree (L* ≅ 37) were bought in coffee shops. They are both harvested in 2018, sun-dried (natural coffees), and commercialized as specialty Arabica e fine Robusta coffees (SCA Score ≥ 80 points) (Lingle & Menon, 2017). C. arabica cv. Mundo Novo was produced in St. Maria farm in Monte Carmelo, state of Minas Gerais, Brazil. C. canephora cv. Robusta was from Rio Lim˜ao farm in Cacoal, State of Rondˆ onia, Brazil; it was awarded fourth place in the quality contest Coffee of the Year Brazil in 2018. |
The origin and quality classification of Arabica and Robusta coffees were clearly described. |
Performance bias |
Low |
Cold brews were prepared by static immersion at a ratio of 1:10 coffee:water (w/v). Mineral water pH 8.45 (Crystal, Bauru, SP, Brazil) was used for all beverages and solutions in sensory analysis. Roasted and ground coffee (15 g) was placed in a glass container with 150 mL water at the set infusion temperature. Based on the results reported by Portela et al. (2021), it was selected brewing conditions that led to high differences in the composition: beverages prepared with a finer grind were extracted at 15 ◦ C, and those with a coarser grind at 5 ◦ C… |
Cold brew preparation conditions including grind size, temperature, and water composition were reported. |
||
Detection bias |
Unclear |
The contents of trigonelline, caffeine, and total chlorogenic acids (CGA) were determined based on Corso, Vignoli, and Benassi (2016). The chromatographic system comprised an ultra-performance liquid chromatography (Waters Acquity, Waters, Milford, CT, USA) equipped with an automatic sample injector, a quaternary solvent pumping system, a column heater/cooler module, and a diode array detector… CGA content was estimated by the sum of compounds detected at 320 nm using 5-CQA as the standard |
The UPLC chromatographic system and detection wavelengths were described, although detailed validation parameters were not reported. |
||
Attrition bias |
Low |
Mean (*n =18. genuine sextuplicate with analytical triplicate; **n =24). genuine sextuplicate with analytical duplicate and duplicate injections) ± standard deviation of six preparation repetitions (CV %) |
Multiple preparation repetitions and analytical replicates were reported with mean ± SD values. |
||
Reporting bias |
Low |
caffeine (167 to 175 mg 100 mL 1), CGA (396 to 411 mg 100 mL 1), and melanoidin (713 to 836 mg 100 mL 1) content (Table 1) |
Quantitative results of caffeine and CGA were reported in tables with variability indicators. |
||
26 |
Dias et al. [21] |
Selection bias |
Low |
Samples of healthy and whole Arabica coffee beans, healthy and whole Robusta coffee beans and five selections from the Arabica crop were evaluated (Table 1). The selections were chosen from a panel of 25 blends with different proportions of defects. |
Coffee samples (Arabica, Robusta, and Arabica selections) were clearly described and selected from blends with different defect proportions |
Performance bias |
Low |
Extraction with water and HPLC-DAD-ESI-MS analysis were used to determine caffeine, chlorogenic acids, trigonelline and nicotinic acid. previously developed and validated method was used (Alves et al., 2006), where 0.500 g of roasted and ground (RG) coffee was submitted to hot extraction in 30.0 mL of purified water (Milli-Q® Reference Water Purification System) (resistivity 18.2 MΩ.cm at 25 °C), dilution (factor 5), filtration (Millipore®, Billerica, USA; 0.45 μm), and injection into the HPLC |
Extraction procedure and preparation prior to chromatographic analysis were clearly described
|
||
Detection bias |
Unclear |
The chromatographic column (Phenomenex Kinetex®2.6 μm, C18, 100 Å, 100 x 2.1 mm) was shorter and had smaller stationary phase particles compared to that used in the original method (Al calibration curves for caffeine and 5-CQA showed R2 of 0.99. |
analysis and calibration curves were reported, but LOD/LOQ or other validation parameters were not provided. |
||
Attrition bias |
Low |
The average (triplicate) of HPLC-DAD-ESI-MS measurements was used. Analysis of variance and the Tukey test (p ≤ 0.05) were applied for group means comparison using a randomized split-plot design of Statistica 7.0 |
Measurements were performed in triplicate with ANOVA and Tukey test |
||
Reporting bias |
Low |
… For 3-CQA, concentrations did not differ between coffee species. However, among the selections, there was a significant discrepancy, with the highest content for E16 and the lowest for E1 and E25, similar to that observed for 5-CQA (Figure 2). |
Differences in chlorogenic acid concentrations among samples were reported with statistical comparison. |
||
27 |
Lemos et al. [50] |
Selection bias |
Low |
Green coffee beans were harvested at the INCAPER experimental farms, in Espı´rito, Santo, Brazil. A single Arabica cultivar (Catuaı´ 81: AC) (latitude: 20 22038.5600 S; longitude: 41 110 54.2400 W) was harvested, along with nine conilon genotypes… All genotypes were harvested with three degrees of maturation (60%, 80%, and 100%), accounting for a total of 33 samples of green coffee beans. |
Coffee beans from a defined experimental farm including one Arabica cultivar and nine conilon genotypes harvested at different maturities. |
Performance bias |
Low |
The extraction was conducted at room temperature in ultrasonic water bath (Elmasonic P 80 Hz– Elma)…. After two cycles of 30 min, the extracts were filtered with filter paper... In order to thoroughly dry the extracts, they were stored in an oven (TE 394/2 MP, 1500 W, Tecnal) for 24 h at 40 C. The dried extracts were then allocated in amber glass, covered with aluminum foil and stocked under refrigeration until further analysis |
Extraction and preparation procedures were clearly described
|
||
Detection bias |
Low |
Prior to the injections into the HPLC, the extracts were filtered with a 0.45 lm membrane and the chromatographic conditions were based on the methodology by Brunetto et al. [13]. The analyses were performed in an HPLC (Breeze, Waters) coupled to a UV detector (Waters 2489)… Calibration curves were also used to assess the linearity range. Limits of detection (LOD) and quantification (LOQ) were calculated by the signal-to-noise ratio (SNR), in which LOD and LOQ were defined respectively as the concentration of the analyte that yields SNR = 3 and SNR = 10 GL Sciences) |
HPLC analysis included calibration curves, linearity, and LOD/LOQ values
|
||
Attrition bias |
Unclear |
Statistical variations among maturations of every genotype and among genotypes at the same maturation were determined using analysis of variance (ANOVA), followed by Tukey’s post hoc test, in which values of p 0.05 were considered statistically significant. |
Statistical analysis was reported but replication details were not clearly stated. |
||
28 |
Prasetya et al. [51] |
Selection bias |
Low |
Biji kopi robusta hasil pengolahan kering klon sintaro dari ketingggian 500 mdpl-700 mdpl dari Desa Penanjung Panjang hingga Desa Taba Air Pauh Kabupaten Kepahiang. Kopi yang digunakan berkadar air 14% |
Robusta coffee beans were collected from defined locations and altitude ranges. |
Performance bias |
Low |
proses penyangraian dengan 3 jenis penyangraian yaitu light roasted, medium roasteddan dark roasted terhadap alat penyangraian semi otomatis dan alat penyangraian otomatis sehingga diperoleh 6 perlakuan |
Roasting treatments and roasting equipment were described. |
||
Detection bias |
High |
Analysis detail are not explained |
Analytical method for caffeine determination was not described. |
||
Attrition bias |
Unclear |
Rata rata nilai dianalis ANOVA |
ANOVA was applied but replication details were not reported. |
||
Reporting bias |
Unclear |
Tabel 7 Rata-rata nilai kadar kafein kopisangrai |
Only mean values were reported without standard deviation |
||
29 |
Yulianti et al. [52] |
Selection bias |
Low |
Samples of green robusta coffee were obtained from coffee farmers in Cisalak, Subang, WestJava |
Coffee samples were obtained from identified farmers in a specific region. |
Performance bias |
Low |
Coffee samples were roasted at two speeds: slow roast and fast roast. The samples at each speed were roasted in three levels: light, medium and dark roast. Each treatment was repeated three times. A quantity of green beans weighing up to 300 grams was introduced into the roaster chamber when the temperature reaches 180C. |
Roasting treatments and repetitions were described. |
||
Detection bias |
Unclear |
Caffeine content was determined using the spectrophotometric method at a maximum absorption wavelength of 276nm |
Spectrophotometric analysis was reported but LOD/LOQ or validation parameters were not described. |
||
Attrition bias |
Unclear |
Variance (ANOVA) was analyzed to ascertain the average disparity between the various samples. A post hoc analysis was performed using a Duncan Multiple Range Test (DMRT) |
ANOVA and Duncan test were reported but measurement replication was unclear |
||
Reporting bias |
Unclear |
The study observed a variation in the caffeine level of roasted coffee, ranging from 0.96% to 1.36% (Table 2) |
Only mean values were reported without standard deviation. |
||
30 |
Santantoglia et al. [53] |
Selection bias |
Low |
Three different coffees with varying degrees of roast were applied for each of the eight extraction methods: Gardelli Specialty’s natural, non-classic anaerobic Ethiopia Uraga for a light roast, Gardelli Specialty’s washed Kenya Thiriku for a medium roast, and roasted Starbucks Blond 100% Arabica for a dark roast. These coffees were selected to provide a realistic picture of the world of “filter” and “specialty” coffee. |
Coffee samples from different origins and roast levels were clearly described. |
Performance bias |
Low |
A specific routine was used for each of the eight preparation methods, keeping some parameters as constant as possible, but without distorting the beverage recipes. Three replicates were made for each brewing method. The data are reported in Table 1. |
Brewing procedures were standardized and performed in triplicate |
||
Detection bias |
Unclear |
Analysis of chlorogenic acids and caffeine was performed according to a previously developed and validated method by Santanatoglia et al., 2023 [23]; using an Agilent 1100 (Agilent Technologies, Santa Clara, CA, USA) consisting of a diode array detector (DAD),. The wavelength used was always 325 nm for chlorogenic acids and 270 nm for caffeine |
HPLC-DAD analysis based on a validated method, but validation parameters such as LOD/LOQ were not reported in the study. |
||
Attrition bias |
Low |
All analytical measurements on the coffee samples were performed in triplicate, and the results obtained were subjected to statistical analysis. |
Analytical measurements were performed in triplicate |
||
Reporting bias |
Low |
Table 3 and Table 4 show the results of HPLC-DAD analysis of chlorogenic acids and caffeine, and Figure S1B,C shows the corresponding histograms |
Results were reported in tables and histograms |
||
31 |
Ramadhani et al. [54] |
Selection bias |
Low |
The main raw material used in this study was red pick robusta coffee beans obtained from Sidomulyo Village, Jember Regency with fullwash post-harvest treatment and then sorted |
Robusta coffee beans with defined post-harvest treatment were used |
Performance bias |
Low |
This research method used a randomized block design (RBD) which was arranged in a factorial 3 x 3, totaling 9 treatments and each combination was repeated four times. The treatments were obtained by combining temperature and drying time (roasting time). The first factor is the roasting temperature which consists of three levels (185, 190, and 195 o C). The second factor is the roasting time which consists of three levels (7, 10, and 13 minutes) |
Roasting temperature and time treatments were clearly described in a factorial design. |
||
Detection bias |
Unclear |
Caffeine analysis was carried out using a spectrophotometric method… at wavelength of 275 nm. From the results obtained, the standard curve that represents a standard solution of caffeine as an equation is y = ax + b and produces a correlation coefficient value in each equation. |
Spectrophotometric analysis was described but LOD/LOQ or validation parameters were not reported. |
||
Attrition bias |
Unclear |
Statistical analysis with ANOVA |
ANOVA was applied but replication details were not specified. |
||
Reporting bias |
Low |
Table 3 shows an increasein caffeine content in Robusta coffee beans with the highest caffeine content of 2.494 ± 0.015% at 195 °C roasting for 16 minutes |
Results were reported with mean ± SD values. |
||
32 |
Dong et al. [55] |
Selection bias |
Low |
Arabica coffee, as an economical crop cultivated in many countries, provide>95% of the world’s coffee, and it more preferred than Robusta coffee. Therefore, a total of 16 commercially available Arabica coffee beans (Coffea arabica L.) were used for this study from multi-production regions worldwide, including Brazil (B1, 2), Colombia (G1, 2), Ethiopia (A1, 2)… |
Sixteen Arabica coffee samples from multiple countries and harvest years were clearly described |
Performance bias |
Low |
The 0.5 g of green coffee bean powder were weighted in a 20 mL clear headspace vial (23 mm × 75 mm, rounded bottom, Agilent Technologies, USA), sealed with an 18 mm magnetic crimp cap with a silicone-PTFE septum. Experiments were carried out in triplicate by using three reaction vessels, which were simultaneously heated in a silicon oil bath at 190℃ for 13 min (Lee et al., 2017; Zhu et al., 2021). After heating, the vials were cooled immediately in an ice bath for 30 min for further analyses. |
Sample preparation and heating procedures were described and performed in triplicate. |
||
Detection bias |
Unclear |
Determination of chlorogenic acids, caffeine and trigonelline. Coffee extracts in green coffee beans from different countries were obtained by previous studies with some change (Heˇ cimovi´c et al., 2011; Tomac et al., 2020). The quantitation of these compounds was performed on an Agilent 1290 HPLC system installed with a DAD detector, an autosampler, and a thermostatically controlled column The detection wavelength of chlorogenic acids was 325 nm, while caffeine and trigonelline were 272 nm. Quantification was based on the external calibration curve. |
analysis with calibration curves was reported but LOD/LOQ were not provided. |
||
Attrition bias |
Low |
All experiments were performed in triplicate (n =3) for statistical analysis. |
Experiments were performed in triplicate.
|
||
Reporting bias |
Low |
It can be seen from Table 4 that the concentrations of major mono-derivatives of CQAs followed this order: chlorogenic acid (5-CQA) > cryptochlorogenic acid (4-CQA) > neochlorogenic acid (3-CQA) in green coffee beans. |
Quantitative compound concentrations were reported in tables. |
||
33 |
Oksari et al. [56] |
Selection bias |
Unclear |
Wet Robusta coffee beans weighing 6 kg are washed with running water. Wet coffee beans are dried in the sun for 14 days, and the epidermis is peeled using a huller (coffee rice/green bean). Robusta green bean of as much as 250 g is roasted on the stove using a stainlesssteel skillet and an iron thermometer. The roasting temperatures used were 170°C, 180°C, and 190°C for 10 and 15 minutes. The coffee produced comes from samples ground using a blender and then filtered using a 60-mesh filter. |
Sample origin and sampling procedures were not clearly described. |
Performance bias |
Low |
As much as 1 g of ground coffee sample was put into a beaker, added 150 mL of hot water and stirred for 2 minutes. The coffee solution is filtered through a funnel with filter paper into the Erlenmeyer. 1.5 grams of CaCO3 powder and coffee solution were put into a separatory funnel and then extracted with 25 mL of chloroform four times…. |
Extraction procedures were described.
|
||
Detection bias |
Unclear |
The absorbance of the sample solution was measured at the maximum wavelength 275 |
Calibration and validation parameters were not described. |
||
Attrition bias |
High |
No replication reported |
Replication of measurements was not reported. |
||
Reporting bias |
Unclear |
The caffeine content of the ground coffee sample can be seen in Figure 7. |
Results were presented in figures without variability indicators. |
||
34 |
Gallardo-Ignacio et al. [57] |
Selection bias |
Low |
The cherries of Coffea arabica varieties Typica, Bourbon, and Oro Azteca employed in the present study were harvested in the 2020–2021 and 2021–2022 cycles in the plantations of the Cooperative Cafeticultores Mephaa “Region de La Montaña”, at the localities of La Soledad and Paraje Montero, municipality of Malinaltepec (longitude: 98.704167 and latitude: 17.164167), Guerrero, Mexico (Figure 3). |
Coffee cherries from three Arabica varieties were collected from defined plantations and harvest seasons. |
Performance bias |
Low |
Infusions of each coffee were prepared in the laboratory in triplicate at room temperature with 13.2 g of ground coffee beans in 200 mL of boiling water to 98 °C in a French press for 5 min. The infusions were filtered, and the pH was measured with a potentiometer Oakton pH 510; subsequently, the infusions were concentrated at reduced pressure in a rotatory evaporator (Heidolph Laborota 4000). Then, the extracts were freeze-dried (Heto Drywinner DW3), and the powders were stored in amber glass containers at room temperature. |
Infusion preparation was standardized and performed in triplicate. |
||
Detection bias |
Unclear |
The concentrations of chlorogenic acid (CGA) and caffeine (CAF) … were determined by High-Performance Liquid Chromatography (HPLC) in Waters equipment consisting of a separation module (Waters 2695) and a photodiode detector (Waters 2696).. The CGA and caffeine concentrations were calculated according to external standards for CGA (3-(3,4-Dihydroxycinnamoyl) quinic acid; ≥95% purity, Sigma-Aldrich) and caffeine (≥99% purity, Sigma-Aldrich). The calibration curves of CGA and caffeine were constructed using a lineal square model y =mx +b with the Microsoft Office Excel 365 Software (Microsoft® Excel V.16.70) with correlation coefficients ≥ 0.9995… |
HPLC analysis with calibration curves was reported but LOD/LOQ were not described. |
||
Attrition bias |
Low |
The CGA and CAF contents were expressed in mg/g of coffee beans as the mean of nine analyses and their standard deviation (SD). |
Results were reported as mean with standard deviation from multiple analyses |
||
Reporting bias |
Low |
Among the green beans of C. arabica varieties analyzed (Table 3), the Typica variety has the lowest contents of CGA (36.81 mg/g) and caffeine (1.16 mg/g) |
Quantitative results were presented in tables
|
||
35 |
Arum et al. [58] |
Selection bias |
Low |
The Arabica coffee bean processing was conducted in the Product Processing Unit "Java Ijen Coffee" (Coffee Processing Plant "Java Ijen"), it belongs to Java Ijen Sukosari Bondowoso farmers group (Sukosari District, Bondowoso Regency, East Java, Indonesia). |
Coffee beans were obtained from a clearly identified processing facility. |
Performance bias |
High |
The preparation and extraction processes are not explained |
Extraction and preparation procedures were not described. |
||
Detection bias |
Unclear |
For the determination of organic acid and caffeine content in the Arabica coffee samples, laboratory analysis was performed at Saraswanti Indo Genetech Inc. in Bogor, Indonesia. The samples were analyzed using High-Performance Liquid Chromatography (HPLC) for organic acids and caffeine content, following standardized protocols. The compounds were detected by UV at 325 nm for organic acids and 280 nm for caffeine. Calibration curves for caffeine and organic acids were prepared using known standards. The concentrations of these compounds in the coffee samples were calculated by comparing the sample peaks to the standards (Rodrigues et al., 2007). |
HPLC analysis was mentioned but validation parameters such as LOD/LOQ were not reported. |
||
Attrition bias |
High |
Not explained |
Replication of measurements was not described. |
||
Reporting bias |
Unclear |
Based on the table 2 showed that specialty Arabica coffee (P3) and Blue Mountain Arabica coffee (P1) are processed naturally (50 days fermentation) have a caffeine content of 1.18% and 1.17% lower |
Results were reported without clear variability indicators.
|
||
36 |
Linda et al. [55] |
Selection bias |
Low |
The materials used in this study were Robusta coffee (Coffea canephora) obtained from Lembang Mesakada Village, Pinrang Regency, South Sulawesi, 2022 with four postharvest treatment methods namely natural method, semi-wet method, wet method and farmer's method. |
Robusta coffee beans were obtained from a clearly identified location in Lembang Mesakada Village, South Sulawesi, with four defined postharvest processing methods. |
Performance bias |
Low |
Post-harvest processing is carried out using four different methods, namely the natural method, semiwet method, wet method and the method commonly practiced by the community/farmer method. The natural method begins with separation by size and then proceeds with washing to separate the floating coffee. Drying is done directly under direct sunlight until the moisture content is around 12%. After drying, stripping the horns/shells and epidermis with coffee beans is carried out to obtain green beans which are obtained ready for further testing… |
Post-harvest processing procedures (natural, semi-wet, wet, and farmer methods) and drying conditions were described. |
||
Detection bias |
Unclear |
Determination of caffeine levels was carried out with reference to previous research. Determination of Chlorogenic Acid Levels was carried out based on research that has been done. |
Determination of caffeine and chlorogenic acid was based on previously published methods, but analytical validation parameters such as LOD/LOQ were not reported. |
||
Attrition bias |
Low |
Data analysis of quality change parameters in four treatments with three replications was processed using the Statistical Product and Service Solution Analysis application (SPSS IBM 25). If the results are significantly different, it is continued with the Duncan test. |
Statistical analysis was performed using SPSS with three replications and Duncan test for significant differences. |
||
Reporting bias |
Unclear |
The results of the caffeine test on Robusta coffee beans can be seen in Figure 1. The test results for chlorogenic acid compounds can be seen in Figure 2. Not with standard deviation |
Results were presented in figures without reporting standard deviation or variability indicators. |
||
37 |
Anh-Dao et al. [59] |
Selection bias |
Low |
In the present study, two coffee varieties used were Arabica and Robusta, obtained from coffee suppliers in the Di Linh district, Lam Dong province. The coffee samples were roasted using three different roasting levels: light, medium, and dark. The light roast was conducted from 195°C to 210°C for 10 to 15 mins. The medium roast was performed between 210°C and 220°C for 20 mins. The dark roast lasted from 230°C to 240°C for 20 mins. |
Arabica and Robusta coffee samples were obtained from a specific supplier in Lam Dong province with defined roasting levels. |
Performance bias |
Low |
For the complete extraction of total phenolic compounds, caffeine, and chlorogenic acid, the reference extraction condition was applied, i.e., total phenolic compounds: 0.200 g of the coffee sample was extracted in 10 mL of a methanol: water mixture (70:30, v/v) for 20 mins at 70°C (Thanh-Nho et al., 2021; Anh-Dao et al., 2022); caffeine and chlorogenic acid: 0.200 g of coffee was extracted in 10 mL of deionized water at 90℃ for 60 mins (Anh-Dao, Minh-Huy, Quoc-Duy et al., 2023). |
Extraction conditions for phenolics, caffeine, and chlorogenic acid were clearly described based on reference methods. |
||
Detection bias |
Unclear |
The first-order derivative spectra were employed to determine the levels of caffeine and chlorogenic acid… |
validation parameters such as LOD/LOQ were not reported. |
||
Attrition bias |
Low |
All samples were conducted in triplicates (n = 3) to ensure favorable precision |
All measurements were conducted in triplicate (n = 3). |
||
Reporting bias |
Low |
Table 1 shows that the Robusta had higher caffeine, chlorogenic acid, and total phenolic contents/compounds (TPCs) than the Arabica, with the highest levels observed in the Robusta-Light coffee sample. |
Quantitative results were reported in tables comparing Arabica and Robusta samples. |
||
38 |
Misto et al. [60] |
Selection bias |
Low |
The materials used were local Indonesia Arabica coffee of three varieties (Lini S, Sigararutang, and Ateng |
Arabica coffee varieties (Lini S, Sigararutang, Ateng) clearly identified |
Performance bias |
Low |
In a beaker glass, each 2 g coffee sample was placed and dissolved in 150 ml of hot distilled water. Filter paper and a funnel were used to filter the coffee solution… |
Brewing and filtration procedures described. |
||
Detection bias |
Unclear |
quantify the absorbance between 200 and 300 nm in wavelength. |
UV absorbance measurement described but no validation parameters (LOD/LOQ). |
||
Attrition bias |
Low |
measurements were taken with three repetitions. |
Measurements conducted in triplicate. |
||
Reporting bias |
Low |
The compound content of three Arabica coffee varieties and their cupping notes were processed by semi-washed and roasted at 210°C for 10 minutes (Table 3) |
Results were reported with statistical values including mean and standard deviation (SD), indicating adequate reporting of variability. |
||
39 |
Herawati et al. [17] |
Selection bias |
low |
Arabica coffee samples from natural processes (Gayo and Toraja) were collected from coffee processors and farmers. Arabica Gayo was directly procured from a coffee processor in Takengon (Central Aceh Regency, Aceh, Sumatra Island, Indonesia), whereas Arabica Toraja was obtained from a coffee processor in Rantepao (North Toraja Regency, South Sulawesi, Indonesia). The beans (1000 g) were roasted in a roaster machine (IKRI, Jember, Indonesia) under the following conditions: initial temperature of 180 °C, final temperature of 220 °C, and duration of 8-9 min |
Arabica Gayo and Toraja samples obtained from identified processors |
Performance bias |
Low |
Roasted beans (15 g) were ground using a HeyCafe H1 coffee grinder (Changzhou, China) with a scale of 5 to have a medium grind size. Ground coffee (10 g) was placed in a transparent glass. Subsequently, it was brewed by pouring 150 mL of hot water (93 °C)… |
Grinding and brewing procedures clearly described |
||
Detection bias |
Low |
CQA quantification of coffee beverage samples was performed with a method developed by Herawati et al. (2022) For linearity, a 6-point concentration of mixed 3-CQA, 4-CQA, and 5-CQA (16–500 mg/L) was used as the standard curve of the CQA compound (triplicate; limit of detection (LoD) of 3-CQA = 13.3 mg/L with R2 = 0.997; LoD of 4-CQA = 15.4 mg/L with R2 = 0.996; LoD of 5-CQA = 4.5 mg/L with R2 = 0.996). |
Calibration curve and LOD values reported for compounds. |
||
Attrition bias |
Low |
The data on bioactive compounds, bioactivities, and nutrition content were analyzed using a general linear model for two factors and a Duncan test. Bioactive compound values were average ± SD (n = 3) |
Data reported as mean ± SD (n=3). |
||
Reporting bias |
Low |
The three popular manually prepared coffee brews in Indonesia (tubruk, V60, and cold brew) selected from the previous step were used to evaluate the impact of bean origin and brewing methods on the bioactive compounds and bioactivities of Arabica coffee brews (Table 2) |
Quantitative data presented in tables. |
||
40 |
Rusinek et al. [16] |
Selection bias |
Low |
The study was carried out on Arabica coffee beans cv.‘Typica’ from a plantation located at an altitude of 1680 m a.s.l. in Huehuetenango, Guatemala. Typica is a variety of Arabica species, which is grown in many regions of the world… |
Arabica Typica beans sourced from a defined plantation |
Performance bias |
Low |
Coffee beans (150 g) were ground in a Russell Hobbs grinder to achieve a grind size of 250-380 μm, with the largest proportion (75%) of particles with a maximum size of 320 μm (obtained using the sieve method). The ground samples were stored at a temperature of approximately 4°Cin tightly closed polyethylene bags |
Grinding, particle size, and storage conditions described |
||
Detection bias |
Unclear |
The separation and identification of phenolic com-pounds was performed using high performance liquid chromatography (HPLC – Waters Milford. The measurements were made with the use of a UV-Vis photodiode detector (Waters 2998) at a wave-length of 320 nm. The content of each CGA was calculated from the peak areas and standard curves and converted into chlorogenic acid equivalents |
HPLC method described but LOD/LOQ not reported. |
||
Attrition bias |
Low |
Principal component analysis (PCA), analysis of variance, and determination of correlations were performed at a significance level of α = 0.05. The PCA data matrix for the statistical analysis of the results of the tests had 28 columns (volatile compounds, tocopherols, caffeine contents, volatile emission intensity, and bioactive compounds) and 9 rows (Cinnamon, American, and Italian roast). |
Statistical analysis and PCA described |
||
Reporting bias |
Low |
The results of the analysis of the effect of the Cinnamon, American, and Italian roast processes on the content of bio-active compounds are presented in Tables 1-3. |
Results presented in tables. |
||
41 |
Abubakar et al. [61] |
Selection bias |
Low |
The materials used in this research were Arabica coffee beans (green beans) obtained from farmers in the Gayo Highlands (Central Aceh and Bener Meriah Regencies). The bean came from fully ripe cherry processed by semi washed method |
Arabica beans sourced from Gayo Highlands farmers. |
Performance bias |
Low |
the samples were roasted at medium temperature (204oC) at the Gayo Cupper Team (GCT) Mini Laboratory. Samples that have been roasted were placed in an airtight container and stored until the time of analysis |
Roasting and storage conditions described. |
||
Detection bias |
High |
Not detail explained |
Detection method not clearly described |
||
Attrition bias |
Low |
The results were analysed statistically, by using ANOVA (Analysis of variance) to see the influence of the two factors and their interactions on the observed physical and chemical quality parameters. |
ANOVA used for statistical analysis. |
||
Reporting bias |
Low |
Chlorogenic acid content in this study ranged from 3.36% - 7.82%, with an average of 5.78% ±1.52% (Table 1).. Ground coffee caffeine levels in this study ranged from 1.35% - 1.82% with an average of 1.61% ±0.24% (Table 1 |
Results reported as mean ± SD |
||
42 |
Firnabillah et al [62] |
Selection bias |
Low |
Sigarar Utang varieties were obtained from coffee farmers at Cikole Village, Lembang Subdistrict, West Bandung District, West Java, Indonesia around Mount Tangkuban Perahu (Figure 1). The coffee cherries were harvested at the beginning of August 2022. |
Sigarar Utang beans collected from a specific region in West Java. |
Performance bias |
Low |
The green beans coffee samples of three different varieties were then ground into a powder with a 200 μm size using the Cypruz GR006 coffee grinder. The samples were then dried in an oven until the samples weight were constant. Finally, the samples were stored in a dark, airtight bottle at -21°C to reduce evaporation before further used |
Grinding, drying, and storage procedures described. |
||
Detection bias |
Unclear |
The analysis of caffeine and chlorogenic acid in the sample was performed using an HPLC instrument with the specifications of a Shimadzu Prominence Type 20 and a UV detector set at a wavelength of 272 nm for caffeine and 324 nm for chlorogenic acid. |
HPLC analysis described but no LOD/LOQ reported.
|
||
Attrition bias |
Low |
The samples from each variety were prepared in triplicate. |
Samples analyzed in triplicate. |
||
Reporting bias |
Low |
The biochemical composition of Ateng, Tim-Tim, and Sigarar Utang green coffee beans varies (Table 1). The analysis of chlorogenic acid compounds in the three varieties yielded different results |
Statistical results including variability reported
|
||
43 |
Acre et al. [63] |
Selection bias |
Low |
C. canephora coffees were collected in Rondônia (RO) and Acre (AC) states, Brazil, during the 2019 harvest, between April and June. Ten samples of each variety-conilon, robusta, and intervarietal hybrids of conilon and robusta (developed by Embrapa) were provided by Embrapa Rondônia (Porto Velho, RO, Brazil). The coffees (about 450 g of green beans for each sample) came from different locations: Porto Velho (RO), Cruzeiro do Sul (AC), Ouro Preto do Oeste (RO), and Rolim de Moura (RO). |
Coffee samples collected from multiple locations with defined varieties |
Performance bias |
Low |
The beans were roasted in a Rod Bel pilot gas roaster (Rod Bel, São Paulo, Brazil) at around 210 °C, as suggested by Mori et al.17 for conilon coffees…After roasting, coffees were ground using a Burr bench grinder GVX 2 (Krups, Shanghai, China). The ground coffee was classified by manually stirring for 5 min using ASTM sieve stacks No. 20.. |
Roasting and grinding procedures described. |
||
Detection bias |
Low |
Identification was based on retention times, co-elution with standards, and UV spectra. Quantification was carried out by external standardization, using 6-point analytical curves with triplicate measurements, in the concentration range from 1 to 60 µg mL-1 for 5-CQA, 10 to 60 µg mL-1 for caffeine, and 1 to 30 µg mL-1 for trigonelline. Limits of detection (LOD) of 0.047, 0.059, and 0.017 µg mL-1 and quantification (LOQ) of 0.138, 0.178, and 0.052 µg mL-1 were obtained for trigonelline, caffeine, and 5-CQA, respectively. The total chlorogenic acids content (CGA) was estimated considering the sum of the compounds detected at 320 nm, using 5-CQA as standard |
LOD and LOQ values reported for analytes.
|
||
Attrition bias |
Low |
The extractions were carried out with genuine duplicates, and duplicate analyses were performed |
Duplicate extractions and analyses performed |
||
Reporting bias |
Low |
The caffeine contents showed no difference (p = 0.057) between conilon and robusta varieties, with an estimated average content of 2402 mg 100 g-1. Higher variability was observed among hybrid coffees (coefficient of variance (CV) of 27%), with values from 1427 to 3364 mg 100 g-1, compared to conilon and robusta (CV of 14 and 15%, respectively) (Table 1) |
Statistical results including variability reported |
||
44 |
Echeverri-Giraldo et al. [64] |
Selection bias |
Low |
The samples were obtained from coffee fruits of the species Coffea arabica L., variety Castillo®, processed by the coffee growers on their farms through the wet process with spontaneous fermentation. These samples were evaluated during two production harvests (2021–2023), totaling 320 samples. The process began with the harvesting and pulping of ripe fruits, followed by the classification by density of lower quality beans, and then the removal of mucilage through spontaneous fermentation. |
Arabica samples collected across two harvests from defined farms. |
Performance bias |
Low |
The extraction method described below is based on that described by Marín and Puerta [38]. Chlorogenic acids were extracted from previously defatted coffee samples using 70% methanol and subsequent purification with Carrez I and II reagents. |
Extraction method clearly described
|
||
Detection bias |
Unclear |
Analyses were performed on liquid chromatograph (Acquity MQ, Waters Corp., Milford, MA, USA) coupled with a diode array detector (2998-DAD, Waters Corp., Milford, MA, USA). The parameters for the analysis included a wavelength range of 210–400 nm, with chromatograms extracted at 324 nm for quantitation. Chlorogenic acids (CQA, FQA, and diCQA) were identified by comparison of retention times in relation to 5-caffeoylquinic acid (Figure 4) and were quantified considering the concentration obtained for 5-CQA in the chromatogram |
LOD and LOQ values not reported for analytes. |
||
Attrition bias |
Low |
For each of the chemical compounds, the average and standard deviation were determined for each evaluated harvest |
Mean and SD calculated for each harvest. |
||
Reporting bias |
Low |
Table 2 shows the results obtained from the chemical analyses carried out on the green coffee beans of C. arabica from the department of Cesar and processed by the coffee growers on their farm by wet means. The data are presented as the average and standard deviation obtained by each acid group for each of the evaluated harvests: phosphoric acid, organic acids and chlorogenic acids. |
Data reported as mean ± SD in tables. |
||
45 |
Rahmawati and Asrori [65] |
Selection bias |
Low |
The materials utilized in this research included Robusta coffee from the Ciwidey area, Bandung, West Java, Indonesia |
Robusta coffee sourced from Ciwidey region.
|
Performance bias |
Low |
Hot brew coffee is prepared by adding 200 mL of water heated to approximately 96°C to 20 g of ground coffee in a French press. After steeping for 6 minutes, the coffee is deparated by depressing the plunger. Cold brew coffee is prepared similarly by adding 20 g of ground coffee to 200 mL of room temperature water in a French press, which is left to steep for 12 hours |
Hot brew and cold brew preparation described |
||
Detection bias |
Unclear |
The HPLC instrumentation was optimized at a wavelength of 272 nm, and a pump pressure of 150 kg/cm², and the column used was a VP-ODS with dimensions of 250 mm x 4.6 mm and 4.6 μm… A calibration curve was then established by varying the concentration of the caffeine standard solution at 25, 50, 75, 100, 125, and 150 ppm Following this, 10 μL of each concentration was injected into the HPLC column under optimal conditions. |
Unclear – HPLC calibration curve reported but no LOD/LOQ. |
||
Attrition bias |
Low |
Three replication of analysis |
Analyses performed in triplicate. |
||
Reporting bias |
Low |
The analysis of caffeine levels, as presented in Table 2, indicates that the caffeine content in Robusta coffee prepared using the cold brew technique is higher than that prepared using the hot brew technique |
Data reported as mean ± SD in tables. |
||
46 |
Jeon et al. [66] |
Selection bias |
Low |
The seven Arabica coffee cultivars were grown in the greenhouse in the experimental orchard of the Research Institute of Climate Change and Agriculture, the National Institute of Horticultural and Herbal Science, Jeju, Republic of Korea (33°28′ N, 126°31′ E): Catuai, Caturra, Costarica, Geisha, Marsellesa, Obata, and Venecia. |
Seven Arabica cultivars clearly identified and grown in controlled conditions |
Performance bias |
Low |
The leaves and green beans of each cultivar were dried at 20–25 °C and were ground and soaked in 80% methanol for 24 h. After filtration, the extracts were evaporated in a rotary evaporator (IKA RV8, IKA-Werke GmbH and Co. KG, Staufen im Breisgau, Germany) at 50 °C. Samples were freeze-dried and stored at −20 °C before further analyses. |
Extraction and storage procedures described. |
||
Detection bias |
Unclear |
Quantitative analyses of caffeine, CGAs, and mangiferin were performed using a Shimadzu NexeraXr HPLC system…The detector was set at 325 nm for CGAs, 272 nm for caffeine, and 317 nm for mangiferin; the injection volume was 10 μL. Concentrations were calculated using the regression equation of their concentration and the peak area of standards as mg/g extract |
HPLC method described but no LOD/LOQ reported. |
||
Attrition bias |
Low |
presented as the mean ± SEM (n=3) |
Results presented as mean ± SEM (n=3). |
||
Reporting bias |
Low |
Table 1 displays the differences in the levels of CGAs, such as 3-caffeoylquinic acid (3-CQA), 4-CQA, 5-CQA, 4-feruloylquinic acid (4-FQA), 5-FQA, 3,5-dicaffeoylquinic acid (3,5-DiCQA), and 4,5-DiCQA, among the leaves and green beans of various Arabica coffees |
Quantitative data reported in table. |
||
47 |
Fitri et al. [67] |
Selection bias |
Low |
Semi-washed Gayo Arabica beans and fully washed Toraja Arabica beans were collected from the same coffee farmers/processors as reported by Herawati et al.[2]. Meanwhile, Java Preanger Arabica beans (semi-washed) were collected from coffee farmers in Margamulya (located in Pengalengan, Regency of Bandung, Province of West Java, Indonesia). |
Arabica beans from multiple Indonesian origins clearly described. |
Performance bias |
Low |
The roasted beans were ground in a grinder (HeyCafe H1, China) with a 2.0 size setting (fine grind) to produce ground coffee. The ground coffee (18 g) was mechanically tamped in a portafilter and then placed in the group head of the espresso machine |
brewing procedure described. |
||
Detection bias |
Unclear |
The CQAs (Caffeoylquinic acids) quantification was conducted using a former method reported by Herawati et al.[13] with modifications. Modifications were conducted for samples with milk addition… |
HPLC method described but no LOD/LOQ reported. |
||
Attrition bias |
Low |
… for HPLC injection in triplicate |
Triplicate HPLC injections performed. |
||
Reporting bias |
Low |
The bioactive compounds and antioxidant profiles of espresso-based coffee brews prepared from different Arabica bean origins are presented in Table 1. |
Results presented in tables.
|
||
48 |
Duke et al. [68] |
Selection bias |
Low |
Arabica coffee beans (Coffea arabica L.) were sourced from Kerchanshe Trading PLC, Bule Hora branch, West Guji Zone, Oromiya Region, Ethiopia (1900–2200 m elevation, 1600–1800 mm annual rainfall). |
Arabica beans sourced from a specific Ethiopian supplier. |
Performance bias |
Low |
Ground coffee samples (0.5 g) were divided into nine subsamples. Each subsample was mixed with 50 mL distilled water in a 250 mL beaker and heated at 95°C for 20 min on a hot plate. Extracts were filtered sequentially through Whitman No. 1 filter paper and a 0.45 μm microfilter to obtain a clear filtrate. Filtrates were collected in autosampler vials for high-performance liquid chromatography (HPLC) analysis. A |
Extraction and filtration procedures described. |
||
Detection bias |
Unclear |
Caffeine content was quantified using HPLC… samples (10 μL) were injected, and caffeine was detected at 272 nm. Calibration curves were constructed using caffeine standards (5–150 mg/mL), yielding a correlation coefficient (R2) > 0.99 |
Calibration curve reported but no LOD/LOQ values.
|
||
Attrition bias |
Low |
All analyses were performed in triplicate |
Analyses conducted in triplicate |
||
Reporting bias |
Low |
Caffeine content varied across roast levels (Light: 200°C, 7 min; Medium: 212.5°C, 9.5 min; Dark: 225°C, 12 min) and grind sizes (coarse: 800 μm; medium: 450 μm; and fine: 100μm), ranging from 1.3 g/100 g–1.53 g/100 g (Table 2) |
Quantitative data reported in table. |
||
49 |
Souza et al. [69] |
Selection bias |
Low |
total of 107 Conilon coffee genotypes from the Coffea canephora breeding program of Incaper, in collaboration with Embrapa Café, Brazil, were evaluated |
genotypes evaluated from a breeding program. |
Performance bias |
Low |
Extraction was performed using 0.5 g of ground green coffee beans and 100 mL of Milli-Q water at 80 °C under orbital shaking for 15 minutes |
Extraction procedure clearly described. |
||
Detection bias |
Unclear |
the bioactive compounds, including chlorogenic acid [5-caffeoylquinic acid (5-CQA)], trigonelline analysis…. The external standard method was employed to quantify the concentration of each compound.. Calibration curves were obtained with R2 > 0.99. |
Calibration curves reported but no LOD/LOQ. |
||
Attrition bias |
Low |
An analysis of variance (ANOVA) was conducted for each of the evaluated parameters to assess differences among the 107 genotypes. Each parameter was analyzed independently, and when the F-test indicated statistical significance (p<0.05) |
ANOVA performed for all parameters |
||
Reporting bias |
Low |
The descriptive statistics for the physicochemical properties of the Conilon coffee genotypes were presented, including the range of variation, mean values, and identification of the three genotypes with the highest and lowest mean values out of the 107 genotypes evaluated (Table II) |
Quantitative data reported in table. |
||
50 |
Katarzyna et al. [70] |
Selection bias |
Low |
The coffee samples used in this analysis were from Ethiopia, species Coffea arabica L. cultivated in two regions: Jimma (N 7°60′72.2″, E 36°71′18.09″) and Sidama (N 6°85′19.1″, E 38°44′69.2″ |
Arabica samples collected from two Ethiopian regions |
Performance bias |
Low |
The coffee roasting method involved the use of a 1400 W coffee roaster at a constant temperature of 230 °C for three stages of 5, 7, and 9 min, respectively (Figure 1A,B). fter the roasting process, the beans were cooled to ambient temperature to preserve their properties before grinding for brewing |
Roasting and cooling procedures described. |
||
Detection bias |
Unclear |
The absorbance of the prepared extracts was measured at 276 nm. Pure anhydrous caffeine (1,3,7-trimethyl-2,6-dioxypurine-C8H10N4O2) served as the standard… |
Validation parameters not reported |
||
Attrition bias |
Low |
Descriptive statistics were calculated, including mean value, standard deviation, and the respective minimum and maximum for each treatment group. |
Mean and SD calculated for treatments. |
||
Reporting bias |
Low |
During this investigation, 21 bioactive compounds were identified (Table 1), including caffeine, 14 phenolic acids, 4 flavonoid glycosides, and 2 flavonoid compounds. |
Results presented in tables. |
Table S3 Welch’s t-test.
Chlorogenic acid (CQA) levels in Arabica and Robusta green beans.
|
Arabica |
Robusta |
Mean |
64.41 |
107.99 |
Variance |
1,183.768778 |
3,695.275524 |
Observations |
60 |
15 |
Hypothesized Mean Difference |
0 |
|
df |
16 |
|
t Stat |
–2.671479892 |
|
P(T<=t) 1-tail |
0.008359813 |
|
t Critical 1-tail |
1.745883676 |
|
P(T<=t) 2-tail |
0.016719626 |
|
t Critical 2-tail |
2.119905299 |
|
Chlorogenic acid (CQA) levels in Arabica and Robusta roasted beans.
|
Arabica |
Robusta |
Mean |
30.43093 |
15.2625 |
Variance |
628.6694 |
191.1932386 |
Observations |
43 |
12 |
Hypothesized Mean Difference |
0 |
|
df |
33 |
|
t Stat |
2.744188 |
|
P(T<=t) 1-tail |
0.004867 |
|
t Critical 1-tail |
1.69236 |
|
P(T<=t) 2-tail |
0.009734 |
|
t Critical 2-tail |
2.034515 |
|
Chlorogenic acid (CQA) levels in Arabica and Robusta brewed.
|
Arabica |
Robusta |
Mean |
0.574690476 |
3.6725 |
Variance |
0.092578454 |
0.179225 |
Observations |
21 |
4 |
Hypothesized Mean Difference |
0 |
|
df |
4 |
|
t Stat |
–13.9639112 |
|
P(T<=t) 1-tail |
7.62761E-05 |
|
t Critical 1-tail |
2.131846786 |
|
P(T<=t) 2-tail |
0.000152552 |
|
t Critical 2-tail |
2.776445105 |
|
Caffeine levels in Arabica and Robusta green beans.
|
Arabica |
Robusta |
Mean |
22.15297872 |
45.58188811 |
Variance |
231.6947475 |
490.0690015 |
Observations |
47 |
22 |
Hypothesized Mean Difference |
0 |
|
df |
31 |
|
t Stat |
–4.491830958 |
|
P(T<=t) 1-tail |
4.58107E-05 |
|
t Critical 1-tail |
1.695518783 |
|
P(T<=t) 2-tail |
9.16215E-05 |
|
t Critical 2-tail |
2.039513446 |
|
Caffeine levels in Arabica and Robusta roasted beans.
|
Arabica |
Robusta |
Mean |
13.23019 |
18.06347826 |
Variance |
58.768 |
61.18779644 |
Observations |
54 |
23 |
Hypothesized Mean Difference |
0 |
|
df |
41 |
|
t Stat |
–2.49636 |
|
P(T<=t) 1-tail |
0.00833 |
|
t Critical 1-tail |
1.682878 |
|
P(T<=t) 2-tail |
0.01666 |
|
t Critical 2-tail |
2.019541 |
|
Caffeine levels in Arabica and Robusta brewed.
|
Arabica |
Robusta |
Mean |
1.19293 |
1.7832 |
Variance |
5.432151322 |
0.1358012 |
Observations |
40 |
5 |
Hypothesized Mean Difference |
0 |
|
df |
40 |
|
t Stat |
–1.46219348 |
|
P(T<=t) 1-tail |
0.075750557 |
|
t Critical 1-tail |
1.683851013 |
|
P(T<=t) 2-tail |
0.151501113 |
|
t Critical 2-tail |
2.02107539 |
|
Trigonelline levels in Arabica and Robusta green beans.
|
Arabica |
Robusta |
Mean |
10.68258065 |
8.3125 |
Variance |
15.61341978 |
9.215535714 |
Observations |
31 |
8 |
Hypothesized Mean Difference |
0 |
|
df |
14 |
|
t Stat |
1.841981769 |
|
P(T<=t) 1-tail |
0.043379079 |
|
t Critical 1-tail |
1.761310136 |
|
P(T<=t) 2-tail |
0.086758158 |
|
t Critical 2-tail |
2.144786688 |
|
Trigonelline levels in Arabica and Robusta roasted beans.
|
Arabica |
Robusta |
Mean |
6.313077 |
2.98875 |
Variance |
5.246673 |
0.9230125 |
Observations |
13 |
8 |
Hypothesized Mean Difference |
0 |
|
df |
17 |
|
t Stat |
4.614599 |
|
P(T<=t) 1-tail |
0.000124 |
|
t Critical 1-tail |
1.739607 |
|
P(T<=t) 2-tail |
0.000247 |
|
t Critical 2-tail |
2.109816 |
|
Trigonelline levels in Arabica and Robusta brewed.
|
Arabica |
Robusta |
Mean |
0.66125 |
0.427777778 |
Variance |
0.070022786 |
0.009994444 |
Observations |
8 |
9 |
Hypothesized Mean Difference |
0 |
|
df |
9 |
|
t Stat |
2.350840532 |
|
P(T<=t) 1-tail |
0.021622747 |
|
t Critical 1-tail |
1.833112933 |
|
P(T<=t) 2-tail |
0.043245494 |
|
t Critical 2-tail |
2.262157163 |
|
Theobromine levels in Arabica and Robusta green beans.
|
Arabica |
Robusta |
Mean |
0.19229 |
0.027428 |
Variance |
0.004231018 |
0.000119478 |
Observations |
9 |
5 |
Hypothesized Mean Difference |
0 |
|
df |
9 |
|
t Stat |
7.417426949 |
|
P(T<=t) 1-tail |
2.01419E-05 |
|
t Critical 1-tail |
1.833112933 |
|
P(T<=t) 2-tail |
4.02838E-05 |
|
t Critical 2-tail |
2.262157163 |
|
Theobromine levels in Arabica and Robusta roasted beans.
|
Arabica |
Robusta |
Mean |
0.14825 |
0.018343333 |
Variance |
0.064784 |
5.97942E-05 |
Observations |
4 |
3 |
Hypothesized Mean Difference |
0 |
|
df |
3 |
|
t Stat |
1.02014 |
|
P(T<=t) 1-tail |
0.191379 |
|
t Critical 1-tail |
2.353363 |
|
P(T<=t) 2-tail |
0.382758 |
|
t Critical 2-tail |
3.182446 |
|
Theobromine levels in Arabica and Robusta brewed.
|
Arabica |
Robusta |
Mean |
0.058868333 |
0.01061 |
Variance |
0.008844713 |
2.72826E-05 |
Observations |
12 |
5 |
Hypothesized Mean Difference |
0 |
|
df |
11 |
|
t Stat |
1.771003575 |
|
P(T<=t) 1-tail |
0.052114076 |
|
t Critical 1-tail |
1.795884819 |
|
P(T<=t) 2-tail |
0.104228152 |
|
t Critical 2-tail |
2.20098516 |
|