
Trends
Sci.
2026;
23(9):
13153
Multigrain Beverage Quality Evaluation: Effects of Stabilizer Type and Sieve Size on Physical, Physicochemical, Functional, Sensory, and Nutritional Properties
Tjahja Muhandri1,2, Didah Nur Faridah1,2,* and Irena Dwi Mulyaningtias1
1Department of Food Science and Technology, Faculty of Agricultural Engineering and Technology, IPB University, Bogor 16680, Indonesia
2South-East Asia Food and Agricultural Science and Technology (SEAFAST) Center, IPB University, Bogor 16680, Indonesia
(*Corresponding author’s e-mail: [email protected])
Received: 25 December 2025, Revised: 17 January 2026, Accepted: 27 January 2026, Published: 30 March 2026
Abstract
The rising consumption of packaged sweetened beverages contributes to high sugar intake among Indonesians, increasing the risk of obesity and diabetes. As lifestyle awareness improves, consumers are shifting toward functional plant-based beverages, such as multigrain beverages. These drinks combine cereals and legumes, including sorghum, red beans, mung beans, black rice, and sweet corn, providing soluble fiber, phenolics, vegetable protein, and antioxidants that support metabolic health and help stabilize blood sugar. However, developing multigrain beverages remains challenging due to physical stability issues, particularly particle size, which affects product homogeneity and overall performance. Therefore, this study aims to highlight the effect of xanthan gum stabilizer concentration and sieve size on the physical, physicochemical, functional, sensory, and nutritional quality of multigrain beverages. The formula used consists of 19.75% sweet corn, 20% red beans, 25% mung beans, 10.25% black rice, and 25% sorghum. The results showed that adding 0.06% xanthan gum and using 115-mesh sieves produced the smallest, most homogeneous particle size, thereby increasing physical stability during storage. The product also achieved a sensory acceptance level of “quite favorable” due to its cereal and nut flavors. Nutritional analysis showed an air content of 90.46%, ash 0.18%, protein 2.23%, fat 0.65%, carbohydrate 6.48%, dietary fiber 1.30%, total phenolics 29.9 mg GAE/100 g, antioxidant activity 25% inhibition, and total sugar 0%. With a sugar content of 0 g/100 mL and a dietary fiber content of 10.40% RDA, this multigrain beverage has the potential to be a low-sugar RTD alternative with a “less sugar” claim and high functional value.
Keywords: Cereals, Functional Characterization, Legume, Multigrain beverages, Physcial quality stability, Quality evaluation, Xanthan gum
Introduction
People tend to consume packaged sweetened beverages in addition to mineral water/bottled drinking water. Sweetened beverages include all packaged sweetened beverages (both sugar-sweetened and those containing other sweeteners), whether in powder, concentrate, or liquid. One type of sweetened beverage is the RTD (Ready-to-Drink) category. These RTD-type packaged beverages are typically high in calories and sugar [1]. Due to their high sugar and calorie content,
excessive consumption of packaged sweetened beverages is associated with the risk of obesity, diabetes, and other cardiovascular diseases [2]. The increase in diabetes incidence is inseparable from Indonesian consumersʼ preference for sweetened drinks with added sugar [3], states that Indonesia ranks third in Southeast Asia in consumption of sweetened drinks with added sugar, at 20.23 liters/person/year. The 2014 Individual Food Consumption Survey (IFCS) also showed that 11.8% of Indonesians consumed more than the WHO recommendation of 50 g of sugar per day [4] One approach to controlling this incidence is to manage lifestyle [5]. Changes in people's lifestyles have led to a decrease in sweetened beverage consumption, driven by increased public awareness of health, quality, and food safety [6]. This condition has encouraged people to switch to more nutritious drinks to support a healthy lifestyle.
One increasingly popular choice is functional plant-based beverages, namely multigrain RTDs. Multigrain beverages are non-dairy, plant-based functional beverages. These drinks were chosen because they are practical, easy to consume, and utilize the potential of local Indonesian foods such as black rice, mung beans, sweet corn, and other cereals. Multigrain beverages are also used as an alternative for consumers with lactose intolerance, cowʼs milk allergies, and hypercholesterolemia, including vegetarians [7]. Non-dairy drinks are formulated with ingredients that have a low glycemic index, such as cereals and nuts, to produce a lower glycemic response. Common ingredients include sorghum with a GI of 32, red beans with a GI of 26 [8], mung beans with a GI of 28.87 [9], black rice with a GI of 47.21 [10] and sweet corn with a GI of 36 [11]. These ingredients also contain high levels of soluble fiber and phenolics. This fiber can slow glucose absorption, making it suitable for individuals at risk of diabetes or those who want to maintain stable blood sugar levels.
Meanwhile, phenolic compounds have antioxidant potential that can eliminate harmful free radicals in the body [12]. Multigrain beverages contain various additional nutrients, including plant-based protein, unsaturated fatty acids, and B-complex vitamins. These multigrain ingredients can lower total cholesterol levels, lower blood pressure, aid weight loss, and control blood sugar [13]. Multigrain beverage products are developed to provide health benefits and have good physical qualities and nutritional content. The process of creating functional beverages presents various challenges, one of which is determining a formula with the best physical stability. The physical stability of a food product is crucial in deciding quality [14]. Particle size is a critical factor influencing the physical characteristics, quality, and functional properties of multigrain beverages. The refining and filtering processes using different sieve sizes will yield distinct particle distributions, thereby affecting the homogeneity, viscosity, and stability of the beverage suspension [15]. Larger particles will settle more quickly than smaller particles. The stability of the resulting beverage depends on the type of raw material, the processing method used, and the storage temperature. With smaller, evenly suspended particles, multigrain beverages do not undergo phase separation quickly and remain stable, thus maintaining their shelf life [16,17],
This indicates that the physical properties of multigrain beverages require further research, particularly in formulating the formulation for multigrain beverage production, and that this has not yet considered panelist sensory acceptance and nutritional value. The use of stabilizers is an essential aspect in improving overall physical quality. Based on research by [18], xanthan gum is used in beverage production to improve texture and stabilize aroma and flavor. In orange juice, using xanthan gum (0.02% - 0.06%) can stabilize fruit pulp suspensions, increase viscosity, and maintain turbidity and sensory quality stability. Furthermore, particle size, as determined by sieve mesh sizes, also influences the physicochemical properties of beverages. Based on research by [19], differences in sieve size affect viscosity. A higher mesh size results in a lower viscosity. Fiber content is also affected by different mesh filter treatments. A larger pore size allows more fibers to pass through the filter, thereby increasing the fiber content of the fruit juice.
Therefore, this study aimed to evaluate the effects of various stabilizer concentrations and sieve sizes on the overall quality of beverages, including the characterization of physicochemical, functional, and sensory properties, as well as the calculation of the nutritional value of multigrain beverage formulas
Material and methods
Materials
The raw materials used in this study were exotic sweet corn varieties and red beans obtained from Kemang Main Market, Bogor. Burma green beans were obtained from Anyar Market, Bogor. Other materials used were bioguma sorghum variety (sorghum foods brand, PT. Sedana Panen Sejahtera), cempo ireng black rice variety (bio organic rice), water, and sucralose sugar (Shandong Kanbo Biochemical Technology Co., Ltd.), and vegetable stabilizer (xanthan gum) obtained from online stores. The tools used to make the samples were sieve sizes (80, 100, and 115 mesh), a Fomac blender (ICH-DS7), a rice cooker (Philips HD3017), a hydraulic press, a plastic container, a 300 mL polyethylene terephthalate (PET) bottle, and a pan.
Research implementation
The research consisted of three stages, namely characterization of raw materials and production of multigrain beverages; evaluation of physical properties using different mesh sieves and different stabilizer concentrations; characterization of chemical and functional properties of selected drinks, and sensory analysis with a hedonic rating test comparing selected formula samples with similar commercial products to obtain nutritional value information from the selected formulas.
Preparation of multigrain beverage
The stages of making multigrain beverage products, as modified from [20], are as follows: The process begins with sorghum, red beans, and mung beans being ground with a Satake Grin Mill for 45 seconds to separate the husk. Red beans and mung beans are soaked for 7 h to facilitate the following process. Both ingredients are boiled for 20 min at 100 ℃, while sweet corn is boiled for 5 min at the same temperature. Sorghum and black rice are washed and cooked in a rice cooker at a 1:5 ratio to make rice. Each ingredient is weighed in the following proportions: 19.75% sweet corn, 20% red beans, 25% mung beans, 10.25% black rice, and 25% sorghum. Next, the ingredients are ground with 900 mL of water per 300 g of the mixture until homogeneous, using a Fomac blender at 2,000 rpm for 2 min. The suspension is filtered through a filter cloth, and the dregs are squeezed under hydraulic pressure to obtain an extract, which is filtered again until the dregs are dry. The beverage was then pasteurized at ±85 ℃ for 30 min. Sucralose (0.002%) was added to the beverage after filtration, based on the beverageʼs weight. The beverage was stored in PET bottles in a refrigerator at 4 ℃.
Physical property evaluation was conducted using the same multigrain beverage manufacturing process with three sieve sizes (80, 100, and 115 mesh) and three xanthan gum stabilizer concentrations (0.02%, 0.04%, and 0.06%) as described by [21]. The evaluation was conducted for 10 days on days 0, 2, 4, 6, 8, and 10. The study used a completely randomized design (CRD) with two factors, yielding nine treatment combinations, each replicated twice, for a total of 18 experimental units.
Table 1 Formulation of ingredients for multigrain beverage products.
Ingredient Composition |
(Xanthan gum + Sieve sizes) |
||||||||
Xanthan gum and Sieve size |
A1B1 (0.02%: 80 mesh) |
A1B2 (0.02%: 100 mesh) |
A1B3 (0.02%: 115 mesh) |
A2B1 (0.04%: 80 mesh) |
A2B2 (0.04%: 100 mesh) |
A2B3 (0.04%: 115 mesh) |
A3B1 (0.06%: 80 mesh) |
A3B2 (0.06%: 100 mesh) |
A3B3 (0.06%: 115 mesh) |
Corn sweet |
19.75% |
19.75% |
19.75% |
19.75% |
19.75% |
19.75% |
19.75% |
19.75% |
19.75% |
Red beans |
20% |
20% |
20% |
20% |
20% |
20% |
20% |
20% |
20% |
Mung beans |
25% |
25% |
25% |
25% |
25% |
25% |
25% |
25% |
25% |
Black rice |
10.25% |
10.25% |
10.25% |
10.25% |
10.25% |
10.25% |
10.25% |
10.25% |
10.25% |
Sorghum |
25% |
25% |
25% |
25% |
25% |
25% |
25% |
25% |
25% |
Description: The multigrain combination used is the result of the formula per 300 g of multigrain mixture weight.
Determination of physicochemical properties of multigrain beverage
Proximate analysis
The raw materials, namely boiled red beans, boiled green beans, black rice, sorghum rice, and boiled sweet corn, as well as the selected multigrain beverage formula, were analyzed proximately on the parameters of water content, ash content, fat content based on AOAC 2012; protein content based on AOAC 960.52-1961; carbohydrate content (by difference).
Determination of viscosity
The viscosity of the beverages was measured using spindle number 2 and 3 of a Brookfield (Brookfield DV III model; Ametek Brookfield Analog, Jepang) viscometer at 30 rpm [22].
Determination of turbidity
Turbidity testing is performed using a turbidity meter by placing 10 mL of sample into a bottle. The turbidity value in NTU will appear on the monitor after the indicator light goes out (Ezdo TUB-430, Taiwan) [23].
Determination of total solids
The total solids present in beverage were estimated by drying 5 mL beverage sample taken in a pre‐weighed dish at 105 - 110 °C to constant weight for 3 h [21].
Determination of particle size analyzer
Particle size was analyzed using laser diffraction (Malvern Mastersizer 45 mm lens, China). Samples were diluted 10-fold using the same continuous phase to maintain particle size. Particle size distributions were reported as d10 values, which represent the fine particle fraction and describe the smallest particles. Other distribution parameters were not evaluated in this study [24].
Determination of suspension stability
The beverage samples were poured in polyethylene terephthalate (PET) bottles and were stored quiescently at 4 °C during the study. Visual suspension stability was made by looking for a demarcation line between upper and lower portions of the beverage after a 10‐day period of quiescent storage at refrigerated temperature. If a line of demarcation was observed, its height was measured and the sepa ration index was calculated as a ratio to total height of the bever age. The separation index would be 1 if no line was observed. Separation index (SI) = Ht∕Ho where, Ht is the height of the lower phase at the interface after time “t” and Ho is the initial height of the beverage [21].
Instrumental color analysis
Color is measured with (a Minolta CR-300, Jepang) Chromameter using the Hunter system (L, a*, and b*) [25].
Nutritional characterization of multigrain beverages
Determiation of total dietary fiber content
Total dietary fiber analysis was performed by weighing 1 g of sample, adding pH 6.0 phosphate buffer solution, and heating for 15 min after adding termamyl. After standing and adjusting to pH 7.5, protease was added and incubated for 30 min at 60 °C. The mixture was then adjusted to pH 4.0 - 4.6 with 0.1 M HCl, and enzime amyloglucosidase was added; incubation was continued for another 30 min. After being precipitated with 95% ethanol for 60 min, it was filtered, washed, dried, and weighed. The residue was then analyzed for protein (Kjeldahl) and ash (combustion at 525 °C), and the final weight was calculated by subtracting the crucible and celite weights.

Determination of the total phenolic content
Total phenolic content (TPC) was determined using the Folin–Ciocalteau assay [26]. Methanol extracts of phenolics (200 μL) from the grains or beverage were diluted to 1 mL with distilled water. To this solution, 1 mL of diluted Folin-Ciocalteauʼs reagent (1:10) and 0.8 mL of 7% sodium carbonate solution were vortexed and incubated for 30 min. The absorbance was measured at 725nm and expressed as gallic acid equivalents (mg GAE/100 g sample).
Determination of total sugars
The sample was weighed, added with 40 mL of 3% HCl, and heated in a water bath for 3 h. After cooling, the pH was adjusted to 7 with 0.1 M NaOH, then the sample was filtered, and the volume was adjusted to 100 mL. A total of 10 mL of the filtrate was reacted with distilled water and Luff-Schoorl solution, then boiled for 3 min and maintained for 10 min. After cooling on ice, KI and H₂SO₄ were added, and the mixture was titrated with 0.1 M Na₂S₂O₃ using starch as an indicator. The Luff-Schoorl solution was made from citric acid and CuSO₄·5H₂O.

Determination of DPPH radical scavenging activity
The antioxidant activity of the sample extracts was measured based on the scavenging of the stable DPPH radical [26], To concentration 50 µL of the sample extract, 3.95 mL of methanol, and 1 mL of a 0.2 mmol methanol solution of DPPH were added. After 30-minute incubation period in the dark at room temperature, the absorbance was measured against a methanol blank (containing all reagents except the test compound) at 517 nm. Inhibition of free radical DPPH was calculated in percent (%) using the formula.
Sensory analysis-hedonic scale
Sensory evaluation of beverages was conducted by 70 semi-trained panelists who were habitual consumers of grain-based beverage products, had educational backgrounds in food technology, and had not undergone formal sensory training. Assessments were conducted using a 7-point hedonic scale (1 = dislike very much to 7 = like very much). Samples were served in coded glasses at room temperature (25 °C). Parameters evaluated included color, aroma, mouthfeel, flavor, aftertaste, texture, and overall acceptability. For comparison, the optimized formula was also assessed against commercially available soy-grain beverage products. Number Ethical Approval: 1802/IT3.KEPMSM-IPB/SK/2025.
Statistical analysis
Data from physical evaluation, chemical analysis, and functional characterization were analyzed using Microsoft Excel paired sample t-test and Minitab (ANOVA) with a 95% confidence level. Statistical analysis for sensory testing was performed using Microsoft Excel and XLSTAT.
Results and discussion
Chemical and physical characteristics of raw materials
The multigrain beverage used in this study was made from sweet corn, red beans, mung beans, black rice, and sorghum. The manufacturing process for the modified raw materials was based on research [20], the raw materials are processed by soaking and boiling green beans and red beans, boiling sweet corn, and cooking black rice and sorghum. Then, all the raw materials are characterized physicochemically, including proximate and color.
Table 2 Physicochemical characteristics of raw material for making multigrain beverages.
Parameters |
Boiled sweet corn |
Boiled red beans |
Boiled green beans |
Black rice |
Sorghum |
Chemical |
|
|
|
|
|
Moisture (%wb) |
81.27 ± 0.29a |
62.36 ± 0.01c |
72.67 ± 0.06b |
56.35 ± 0.51d |
72.39± 0.24b |
Ash (%db) |
2.59 ± 0.15b |
3.41 ± 0.02a |
2.09 ± 0.05c |
1.65 ± 0.02d |
0.54±0.05e |
Crude Fat (%db) |
4.88 ± 0.19a |
1.62 ± 0.41bc |
1.94 ± 0.26b |
0.57 ± 0.12d |
0.91±0.06cd |
Crude portein (%db) |
26.74 ± 0.04a |
27.26 ± 0.82ab |
28.69 ± 0.47a |
10.97 ± 0.26c |
9.40±0.26c |
Crude Carbohydrate* (% db) |
65.78 ± 0.00d |
67.71 ± 0.29c |
67.29 ± 0.48c |
86.80 ± 0.25b |
89.15± 0.19a |
Physical (Color) |
|
|
|
|
|
L |
60.10 ± 3.21b |
34.93 ± 6.92d |
45.29 ± 3.04c |
17.68 ± 0.78e |
71.79±4.13a |
a |
‒1.04 ± 0.37c |
13.29 ± 1.09a |
‒1.09 ± 1.04c |
8.24 ± 2.03b |
‒1.99±0.27c |
b |
51.30 ± 9.39a |
20.04 ± 1.45bc |
27.15 ± 3.38b |
7.00 ± 0.56d |
10.01±2.04cd |
C |
51.31 ± 9.38a |
24.04 ± 1.77b |
27.18 ± 3.38b |
10.84 ± 1.91c |
10.22±1.95c |
h |
91.22 ± 0.54b |
54.46 ± 0.88c |
92.37 ± 2.10b |
40.95 ± 4.65d |
101.72±3.49a |
Values are presented as mean ± SD. Different notations show the significant differences and the * sign indicates using the by difference method.
Boiling processing has the highest water content. This is in line with [27]: The high water content is due to the principle of boiling during processing with water. The protein content on a dry-basis of the five raw materials ranges from 9.40% to 28.69%, with the lowest in black rice and sorghum rice. This is due to the lower natural protein content in both materials compared to nuts. The fat content on a dry-basis ranges from 0.57% to 4.88%, the highest in sweet corn, due to the shorter boiling time and the absence of soaking, compared to other materials, so that the fat content is not lost much [28].
The dry-basis ash content analyzed can describe the presence of inorganic minerals remaining after burning in food, ranging from 0.54% to 3.41%; the highest is in boiled red beans, and the lowest is in sorghum rice. This is because the processing involves grinding. According to [29], sorghum rice has a high mineral content in its outer layer, which is lost during milling, unlike red beans. According to [30], the polishing does not significantly affect ash content with or without the skin, so the ash content remains high. The available carbohydrate content is determined using the carbohydrate content-by-difference approach/through calculations that have been reduced by the four components analyzed previously.
Physical characteristics, such as color, are determined because the senses can directly observe them. The CIE L*, a*, b* and L*, C*, h color systems are used to quantify color. Boiled sweet corn has a °hue value of 91.22 ± 0.54, a °hue value of sorghum rice of 101.72 ± 3.49, a °hue value of black rice of 40.95 ± 4.65, a °hue value of boiled red beans of 56.46 ± 0.88, and a ΔE value of boiled green beans of 92.37 ± 2.10. The °hue value of boiled sweet corn, with a bright, saturated yellow color, corresponds to the natural color of cooked sweet corn. The °hue value of black rice with a dark and slightly reddish color corresponds to black rice due to the presence of flavonoid pigments, namely anthocyanins [31]. The °hue value of boiled red beans is reddish brown, like the typical color of cooked red beans, whereas the °hue value of boiled green beans tends to be greenish yellow rather than an intense green, due to the polishing process. The °hue of sorghum rice is pale yellowish and not saturated, indicating it is very different from the color of most grains, which often change during cooking or vary by variety.
The effect of different sieve sizes and stabilizer concentrations on the physical quality of multigrain beverage formulas
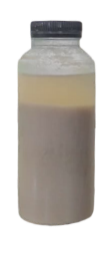
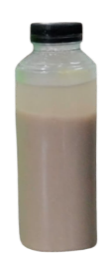
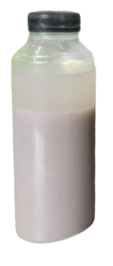
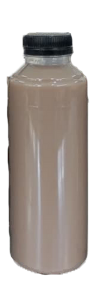
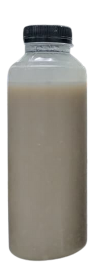
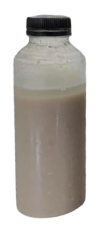
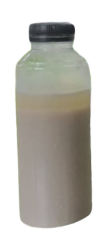
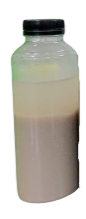
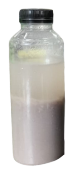
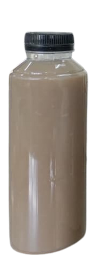
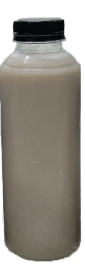
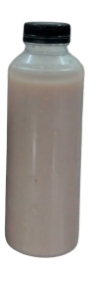
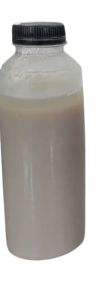
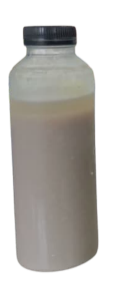
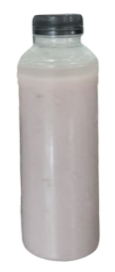
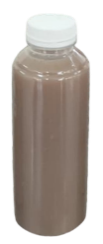
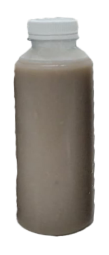
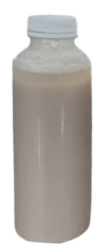
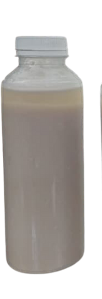
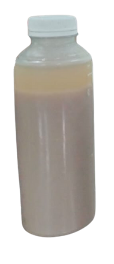
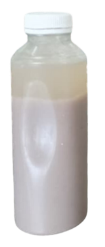
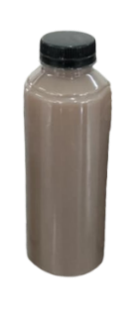
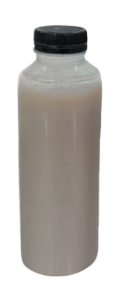
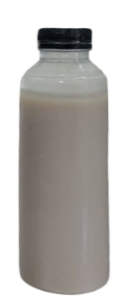
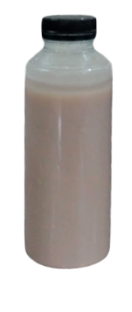
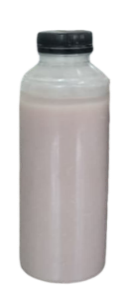
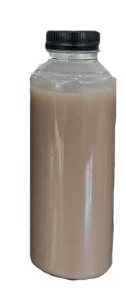
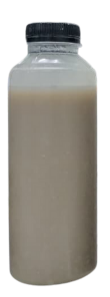
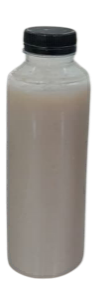
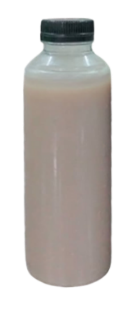
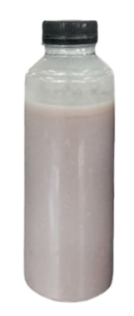
The results of the physical properties evaluation indicate that the formula multigrain beverage exhibits stable characteristics during storage, as shown in Figure 2. Viscosity increases with higher xanthan gum concentration and larger mesh size, resulting in a thicker, more consistent texture. Turbidity shows a pattern in line with viscosity: Samples with smaller particles exhibit higher turbidity because their particle distribution is more homogeneous. Suspension stability increases significantly at xanthan gum concentrations of 0.04% - 0.06%, indicated by a decrease in phase separation during storage. Total solids are relatively constant across all treatments, suggesting that differences in sieve size and stabilizer concentration do not significantly affect solids content. Overall, the formula shows good physical performance, with a combination of 0.04% - 0.06% xanthan gum and a fine sieve providing the best stability during 10 days of storage.
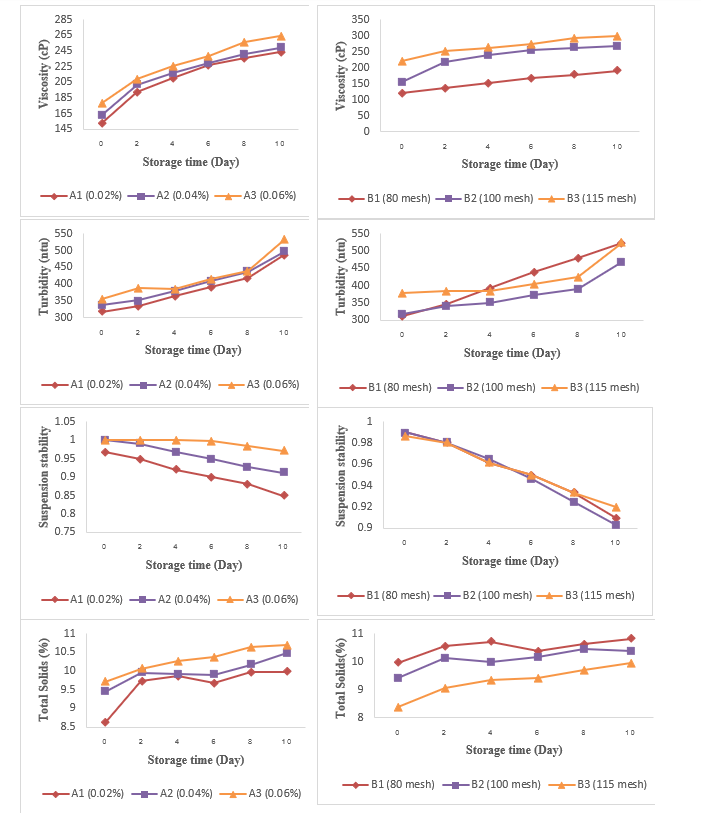
Figure 1 Physical properties (viscosity, turbidity, suspension stability and total solids) during storage at different stabilizer concentrations (A1; A2; A3) and sieve sizes (B1; B2; B3).
Xanthan gum 0.02%
|
Day to-0 |
Day to-2 |
Day to-4 |
Day to-6 |
Day to-8 |
Day to-10 |
Sieve 80 mesh |
|
|
|
|
|
|
Sieve 100 mesh |
|
|
|
|
|
|
Sieve 115 mesh |
|
|
|
|
|
|
Xanthan gum 0.04%
|
Day to-0 |
Day to-2 |
Day to-4 |
Day to-6 |
Day to-8 |
Day to-10 |
Sieve 80 mesh |
|
|
|
|
|
|
Sieve 100 mesh |
|
|
|
|
|
|
Sieve 115 mesh |
|
|
|
|
|
|


Xanthan gum 0.06%
|
Day to-0 |
Day to-2 |
Day to-4 |
Day to-6 |
Day to-8 |
Day to-10 |
Sieve 80 mesh |
|
|
|
|
|
|
Sieve 100 mesh |
|
|
|
|
|
|
Sieve 115 mesh |
|
|
|
|
|
|
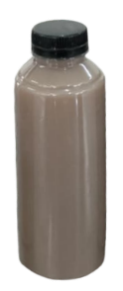
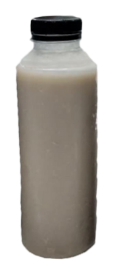
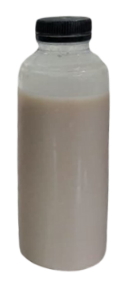
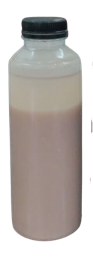
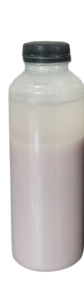
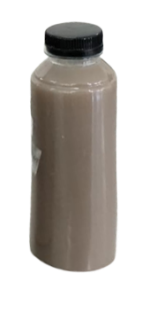
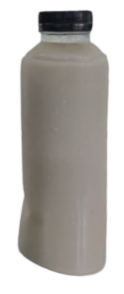
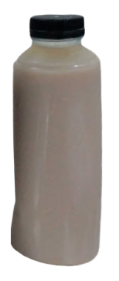
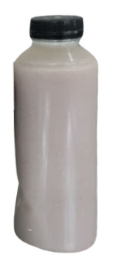
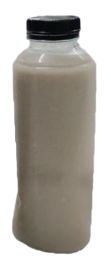
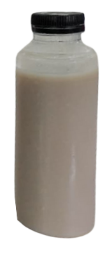
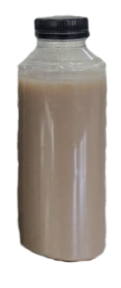
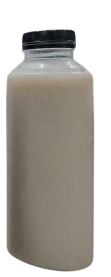
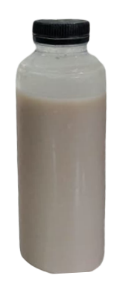
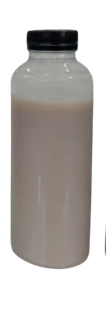
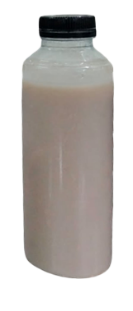
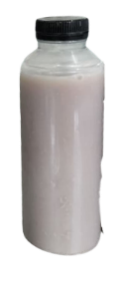
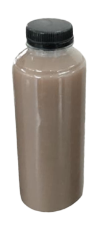
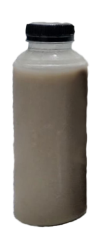
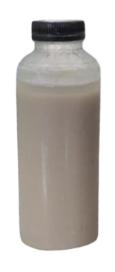
Figure 2 Appearance of the stability of the multigrain beverage suspension during storage.
A stability value close to 1 indicates that the solid particles remain evenly distributed in the liquid and do not settle. A stability value close to 1 indicates that the solid phase remains homogeneously dispersed in the liquid phase, without significant phase separation or sedimentation during the observation period or during centrifugation. This value reflects the suspension systemʼs ability to maintain a uniform particle distribution, which is influenced by particle size, the viscosity of the continuous phase, and interparticle interactions [15]. A decrease in the suspension stability value suggests the onset of particle sedimentation, making the drink inhomogeneous and reducing its quality. In the A3B3 combination treatment, namely a stabilizer concentration of 0.06% and mesh 115, the highest stability level from day 0 to day 10 of storage was 1%, indicating that the particles remained evenly distributed in the liquid without sedimentation.
The effect of different sieve sizes and stabilizer concentrations on the particle size of multigrain beverages
The particle size analyzer is used to measure particle size distribution in liquid, powder, and emulsion samples. In suspended multigrain beverages, particle size and distribution are crucial for stability: Large particles readily settle, leading to phase separation, whereas small particles with a uniform distribution enhance stability and improve texture [32].
Table 3 Average particle size of multigrain beverages.
Sampel |
Average particle size (µm) |
Indeks Polidispersity (PDI) |
A1B1 (0.02%; 80) |
16 ± 0.13a |
0.32 |
A1B2 (0.02%; 100) |
15.5 ± 0.07b |
0.31 |
A1B3 (0.02%;115) |
12.6 ± 0.05c |
0.29 |
A2B1 (0.04%; 80) |
14.9 ± 0.08d |
0.29 |
A2B2 (0.04%; 100) |
13.5 ± 0.04e |
0.23 |
A2B3 (0.04%; 115) |
9.82 ± 0.05f |
0.22 |
A3B1 (0.06%; 80) |
11.6 ± 0.04g |
0.21 |
A3B2 (0.06%; 100) |
11.4 ± 0.04h |
0.19 |
A3B3 (0.06%; 115) |
8.88 ± 0.01i |
0.18 |
Values are presented as mean ± SD. Different notations show the significant differences.
The use of larger sieves and increased xanthan gum concentration resulted in smaller particle sizes, more uniform distribution, and better physical stability. Treatments A3B1, A3B2, and A3B3 produced the most petite particle sizes and the lowest PDI values (< 0.3), indicating a homogeneous and stable system during storage. Several other treatments, such as A1B3, A2B1, A2B2, and A2B3, also showed good stability, with PDI values remaining low even at particle sizes of 5 - 20 µm. Higher xanthan gum concentrations helped reduce agglomeration by lowering surface tension and increasing colloidal interactions, resulting in more evenly dispersed particles. The best stability in the formulation with 0.06% xanthan gum and a finer sieve size is due to the synergy between particle characteristics and the rheological properties of the continuous phase. Finer particles have a lower sedimentation rate, thereby improving suspension stability. The addition of xanthan gum increases the viscosity of the continuous phase, thereby limiting particle mobility and reducing the frequency of interparticle collisions. In addition, xanthan gum forms a charged hydrated layer around the particles, providing steric and electrostatic stabilization that inhibits aggregation [33]. This mechanism is consistent with the lower PDI value, which indicates a more homogeneous particle size distribution and a more colloidally stable system [34].
In line with [35], a narrow particle size distribution (low PDI) is more critical for dispersion stability than the particle size itself, so that slightly larger particles remain stable as long as they do not clump. Dispersion instability is primarily driven by particle aggregation, not by absolute particle size alone. Therefore, a narrow particle size distribution, reflected by a low polydispersity index (PDI), can enhance system stability, allowing relatively larger particles to remain well suspended as long as aggregation is suppressed [15,33].
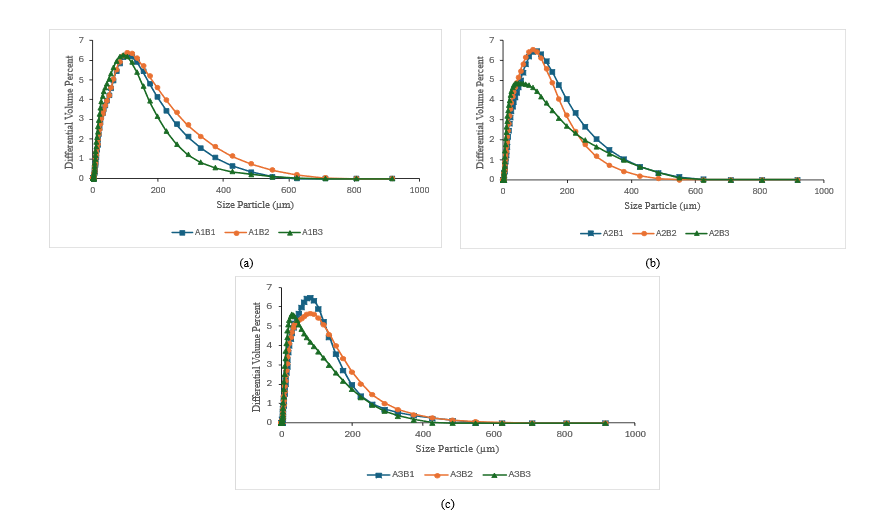
Figure 3 Particle sizes of multigrain beverages (a) 0.02% stabilizer, (b) 0.04% stabilizer, (c) 0.06% stabilizer.
The particle size distribution of multigrain beverages across various stabilizer (A) and sieve size (B) combinations exhibited distinct patterns, with larger sieve sizes producing smaller, more homogeneous particles. Across all treatments (A1, A2, and A3), the largest sieve (B1) produced a larger particle distribution peak and a wider curve. In contrast, the medium sieve (B2) exhibited a peak shift toward smaller particle sizes with a narrower distribution. The smallest sieve (B3) consistently produced the most minor particle peak (around 80 - 120 µm) with a narrower distribution curve, indicating more uniform particles and a smaller fraction of larger particles. This pattern suggests that mesh size is the primary factor influencing particle size distribution, with stabilizer A3 performing most effectively in maintaining particle uniformity by reducing aggregation. Overall, the use of smaller sieves has the potential to improve the softness and physical stability of multigrain beverages.
Overall, the A3B3 treatment with a xanthan gum concentration of 0.06% and a sieve sizes 115 mesh (large mesh) is the best overall treatment because it maintains high and stable total solids, prevents a drastic increase in turbidity, provides a reasonably high viscosity, but remains sensory and visually pleasant, and can maintain suspension stability close to 100% until day 10. The PSA value of the A3B3 treatment has a particle size value of 8.88 µm with a PDI value < 0.3 of 0.18, meaning that the particle distribution is homogeneous or uniform. This treatment can be used if the purpose of the multigrain beverage formulation is long-term physical stability and a good sensory profile, with homogeneous visual and textural quality.
The effect of different sieve sizes and stabilizer concentrations on the physicochemical and functional qualities of multigrain beverage formulas
Multigrain beverage formula has an air content of (90.46%) compared to commercial products (85.92%), which indicates a thinner product nature due to the use of natural ingredients without the addition of high soluble solids such as sugar. The low ash content (0.18 ± 0.01) is related to the mineral content of the raw materials. In contrast, the fat content (0.65 ± 0.02) and protein content (2.23 ± 0.04) are affected by the composition of cereals and nuts and the heating process, which can reduce protein solubility when compared to commercial products that have higher protein (2.65 ± 0.10%) and fat (1.8 ± 0.23%) levels due to the use of soy or plant-based additives. The carbohydrate content (6.48 ± 0.06 g/100 mL) and total dietary fibre (1.30 ± 0.10 g/100 mL) indicate that this product is a good source of fibre, contributing slightly above 10% of the RDA per 200 mL serving. High dietary fibre helps reduce blood glucose responses by inhibiting starch digestion [36]. The antioxidant activity (25±0.06% inhibition) and total phenolic content (29.9±0.001 mg GAE/100g) were higher than those of commercial products (12.95±0.005% and 25.85±0.005 mg GAE/100g, respectively) due to the use of ingredients such as red beans, mung beans, sorghum, and black rice, which are rich in anthocyanins, flavonoids, and tannins [37,38].
Xanthan gum also helps maintain phenolic compounds during storage through its antioxidant activity [39]. The total sugar content of this multigrain beverage was undetectable (0.00 ± 0.00 g/100 mL), indicating that simple sugars contribute minimally to the product. The carbohydrates in this beverage primarily come from complex carbohydrates, such as starch and oligosaccharides, which are not measured as total sugars in the analytical method used, thus supporting the productʼs characterization as a low-sugar beverage. Commercial products are likely to contain added sugar or other sweeteners, resulting in a high total sugar content.
Physically, the formula multigrain beverage exhibits stable dispersion properties, supported by a small particle size and narrow distribution obtained from the use of a fine sieve and the addition of xanthan gum. A small particle size slows sedimentation and improves homogeneity, while a polydispersity index (PDI) value of < 0.3 indicates a uniform, stable particle distribution, according to the criteria [40]. This stability is reinforced by the color characteristics, which show an L* value of around 42.34 ± 3.20, indicating a dark color due to the natural pigment content of ingredients such as anthocyanins in black rice and the browning reaction during processing [41]. Commercial products show L* values of approximately (69.21 ± 0.57). Higher L* values in commercial products indicate brighter colours. Overall, the physical components of the formula reflect a stable colloidal system with a typical cereal-legume color and particle distribution that supports product stability during storage.
The formula multigrain beverage per serving provides 81.32 kcal of energy, 11.64 kcal of energy from fat, and contributes 1.94% fat, 7.44% protein, 4.32% carbohydrate, and 2.60 g of dietary fiber (10.40% RDA). These nutritional values indicate that the multigrain beverage formulation has a lower sugar content and relatively higher dietary fiber than commercially sweetened drinks on the market. One serving of multigrain beverage contains only 0.0 g of total sugar per 200 mL, making this product naturally very low in sugar [42,43]. Under BPOM regulations No. 1 of 2022, a product can be declared low in sugar if its sugar content does not exceed 0.5 g per 100 mL (in liquid form). With test results showing zero sugar, this drink meets and is far below the required limit. Therefore, multigrain beverage products can be categorized as “less sugar” beverages, providing added value for consumers who require low-sugar products, including those with diabetes or those pursuing a healthy lifestyle. The dietary fiber content of 2.60 g per serving contributes 10.40% of the RDA in BPOM regulations No. 26 of 2021 and has the potential to help increase daily fiber intake. Multigrain beverage formula offers a more balanced nutritional profile by combining low sugar with relatively high fiber, making it a healthier beverage alternative. The fiber content does not meet the criteria for a “fiber source” (≥ 3 g/serving). This potentially results in a lower glycemic response due to its formulation with low-GI ingredients, but cannot be claimed without direct GI testing or supporting clinical studies.
Table 4 Physicochemical and functional characteristics of multigrain beverages.
Component |
Quantity |
|
Multigrain Beverages |
Commercial products |
|
Chemical Characteristics |
|
|
Water content (%wb) |
90.46 ± 0.04a |
85,92 ± 0.09b |
Ash (%wb) |
0.18 ± 0.01b |
0,45 ± 0.01a |
Protein (%wb) |
2.23 ± 0.04b |
2,65 ± 0.10a |
Fat (%wb) |
0.65 ± 0.02b |
1,8 ± 0.23a |
Carbohydrates* (%wb) |
6.48 ± 0.06b* |
9,17 ± 0.31a |
Total dietary fiber (%) |
1.30 ± 0.10a |
1,67 ± 0.29a |
DPPH radical scavenging activity (mg/100g) |
25 ± 0.06b |
12,95 ± 0.005a |
Total phenolic content (mg/GAE 100g) |
29.9 ± 0.001b |
25,85 ± 0.005a |
Total sugars (%) |
0.00 ± 0.00b |
6,69 ± 0.002a |
Energy (kcal/100 mL) |
40.66 ± 10.83a |
63,50 ± 13.73a |
Energy (kcal/200 mL) |
81.32 ± 10.83a |
127 ± 13.73a |
Physical Characteristics (Color) |
|
|
L |
42.34 ± 3.20b |
69,21 ± 0.57a |
a* |
0.72 ± 0.18a |
0,078 ± 0.02b |
b* |
6.85 ± 0.70b |
10,692 ± 0.15a |
C* |
6.89 ± 0.72b |
10,694 ± 0.15a |
h |
84.06 ± 0.90b |
88,992 ± 1.29a |
Values are presented as mean±SD. Different notations (a - e) show the significant differences and the * sign indicates using the by difference method.
The effect of different sieve sizes and stabilizer concentrations on the hedonic sensory ratings of multigrain beverages
The sensory characteristics of the multigrain beverage were generally well accepted across several key attributes. Panelists rated color and texture as the attributes with the highest scores because they align with the characteristics of cereal- and legume-based beverages. Aroma and flavor received moderate scores, influenced by the distinctive flavors of raw ingredients such as red beans, mung beans, and black rice, which provide a natural but relatively strong sensory profile. The aroma, taste, and color scores, which were in the moderate category, were influenced by the distinctive characteristics of raw materials such as red beans, mung beans, and black rice. The beverageʼs relatively darker color was perceived differently by panelists; some considered it a positive attribute reflecting a natural impression and the content of whole grains, while others found it less appropriate for the appearance of a milk-like beverage. These diverse perceptions were reflected in the color hedonic score, which was moderate, averaging around 4.5 and falling in the neutral-to-preferred range for panelists. Nevertheless, the assessment results showed that the formula remained in the “liked” category among the panelists. Overall, the productʼs sensory quality was deemed worthy of further development, with opportunities to improve flavor through formulation adjustments or the use of natural flavors to increase consumer acceptability.
Based on the sensory evaluation results, the overall acceptability of the multigrain beverage was around 4.4, while the commercial product was around 6.1. This difference indicates that the commercial product was generally preferred by the panelists, likely because of its more familiar sensory characteristics, particularly its color, aroma, and taste, which resemble those of typical milk drinks. However, the overall acceptability score of the multigrain beverage remained in the neutral to slightly favorable category, indicating that the product was acceptable to consumers. These results confirm that the multigrain beverage formulation has potential for further development, particularly through improvements in taste and aroma, so that its overall acceptability can approach that of established commercial products.
Conclusions
Multigrain beverage products with a composition of 19.75% sweet corn, 20% red beans, 25% mung beans, 10.25% black rice, and 25% sorghum exhibit physical stability during storage, with smaller, more homogeneous particle sizes due to the addition of 0.06% xanthan gum stabilizer and a 115-mesh sieve. The results of sensory tests showed that multigrain beverage products had a “quite preferred” level of acceptance among panelists, with the strong, distinctive taste of cereals and nuts as the main factor influencing preference. Based on proximate and functional characteristics, the formula for multigrain beverages contained 90.46% water content, 0.18% ash content, 2.23% protein content, 0.65% fat content, 6.48% carbohydrate content, 1.30% total dietary fiber, 25% antioxidant activity, 29.9 mg GAE/100g total phenolic content, and 0% total sugar. The results of physical tests, as indicated by color, showed that the formula for multigrain beverages had a darker appearance than commercial products. A serving size of 200 mL of the optimal product formula contains a total sugar of 0 g per 200 mL, below the total sugar rule of 0.5 g per 100 mL in liquid form and the dietary fiber content in multigrain beverages of 2.60 g per 200 mL contributes 10.40% so that the formula of multigrain beverages as drinks with the claim of “less sugar” and higher dietary fiber than sweetened drinks in general and supports limiting daily sugar consumption.
Acknowledgements
This research was funded by the Fundamental-Regular (PFR) program management in 2025. No. 006/C3/DT.05.00/PL/2025 Date 28 Mei 2025.
Declaration of generative AI in scientific writing
The authors declare that generative artificial intelligence tools (e.g., QuillBot and ChatGPT) were used solely to improve the clarity of language and grammar during the preparation of this manuscript. The authors are solely responsiblefor the scientific content, data interpretation, and conclusions presented in this article.
CRediT author statement
Tjahja Muhandri: Supervision, data analysis, validation, draft preparation, data curation, investigation and editing draft. Didah Nur Faridah: Supervision, data analysis, validation, draft preparation, data curation, investigation and editing draft. Irena Dwi Mulyaningtias: Supervision, conceptualization, validation, draft preparation, editing draft, and writingreview & editing.
References
[1] TS Tseng, WT Lin, GV Gonzalez, YH Kao, LS Chen and HY Lin. Sugar intake from sweetened beverages and diabetes: A narrative review. World Journal of Diabetes 2021; 12(9), 1530-1538.
[2] KR Santosa and I Yuadi. Analisis bibliometrik pajak minuman berpemanis dalam kemasan (MBDK). Transparansi: Jurnal Ilmiah Ilmu Administrasi 2023; 6(1), 95-109.
[3] ML Hambali. The Urgency of sugar sweetened beverages excise policy: A literature study for implementation in Indonesia. BISNIS & BIROKRASI: Jurnal Ilmu Administrasi dan Organisasi 2022; 29(1), 20-31.
[4] Atmarita, AB Jahari, Sudikno and M Soekatri. Asupan gula, garam dan lemak di Indonesia: Analisis survei konsumsi makanan individu (SKMI) 2014. Journal of the Indonesian Nutrition Association 2016; 39(1), 1-14.
[5] A Budreviciute, S Damiati, DK Sabir, K Onder, P Schuller-Goetzburg, G Plakys, A Katileviciute, S Khoja and R Kodzius. Management and prevention strategies for non-communicable diseases (NCDS) and their risk factors. Frontiers in Public Health 2020; 8, 574111.
[6] SS Wachyuni and K Wiweka. The changes in food consumption behavior: A rapid observational study of covid-19 pandemic. International Journal of Management, Innovation & Entrepreneurial Research 2020; 6(2), 77-87.
[7] SS Arya and NK Shakya. High fiber, low glycaemic index (GI) prebiotic multigrain functional beverage from barnyard, foxtail and kodo millet. LWT 2021; 135, 109991.
[8] FA Afandi, CH Wijaya, DN Faridah, NE Suyatma and A Jayanegara. Evaluation of various starchy foods: A systematic review and meta-analysis on chemical properties affecting the glycemic index values based on in vitro and in vivo experiments. Foods 2021; 10(2), 364.
[9] ID Cahyani and Purbowati. Nilai indeks glikemik sereal jagung dengan penambahan kacang hijau dan kacang merah. Sport and Nutrition Journal 2022; 4(1), 13-19.
[10] S Harini. 2013, Perbedaan nilai indeks glikemik beras hitam (Oryza Sativa L.Indica), beras merah (Oryza Nivara) dan beras putih (Oryza Sativa). Master Thesis. Universitas Brawijaya Malang, Jawa Timur, Indonesia.
[11] E Daniels, N Wulandari and DN Faridah. Glycemic index of sweet corn and the characteristics of their flakes by adding the red bean. Jurnal Teknologi dan Industri Pangan 2023; 34(2), 233-241.
[12] CG Fernandes, SK Sonawane and SS Arya. Cereal based functional beverages: A review. Journal of Microbiology, Biotechnology and Food Sciences 2018; 8(3), 914-919.
[13] A Satija and FB Hu. Plant-based diets and cardiovascular health. Trends in Cardiovascular Medicine 2018; 28(7), 437-441.
[14] A Gupta, N Sanwal, MA Bareen, S Barua, N Sharma, OJ Olatunji, NP Nirmal and JK Sahu. Trends in functional beverages: Functional ingredients, processing technologies, stability, health benefits, and consumer perspective. Food Research International 2023; 170, 113046.
[15] GC Dacanal. Particle size and morphology in food science and technology: A review. International Journal of Food Science and Technology 2024; 59(10), 6821-6833.
[16] A Durand, GV Franks and RW Hosken. Particle sizes and stability of UHT bovine, cereal and grain milks. Food Hydrocolloids 2003; 17(5), 671-678.
[17] S Sethi, SK Tyagi and RK Anurag. Plant-based milk alternatives an emerging segment of functional beverages: A review. Journal of Food Science and Technology 2016; 53(9), 3408-3423.
[18] S Akkarachaneeyakorn and S Tinrat. Effects of types and amounts of stabilizers on physical and sensory characteristics of cloudy ready-to-drink mulberry fruit juice. Food Science & Nutrition 2015; 3(3), 213-220.
[19] IT Anova, K Kamsina, F Firdausni, YH Diza and Y Yurnita. Pengaruh ukuran saringan dan konsentrasi gula terhadap sifat fisika kimia konsentrat sari buah kundur (Benincasa Hispida (Thunb.) Cogn). Jurnal Litbang Industri 2021; 11(2), 145-150.
[20] LA Wickramaarachchi, DU Rajawardana, MMNP Gunasekara, HMT Herath and MA Jayasinghe. Development and evaluation of physico-chemical, sensorial, and shelf- life of grain-milk beverages. Journal of Cereal Science 2024; 116, 103875.
[21] CG Fernandes, SK Sonawane and SS Arya. Optimization and modeling of novel multigrain beverage: Effect of food additives on physicochemical and functional properties. Journal of Food Processing and Preservation 2019; 43(10), 14151.
[22] I Kusumawaty, D Fardiaz, N Andarwulan, S Widowati and S Budijanto. Stabilisasi bekatul dengan ekstruder ulir ganda menggunakan response surface methodology. Jurnal Penelitian Pascapanen Pertanian 2013; 10(1), 27-37.
[23] IP Wardani, Sumardi and B Hermanto. Pengaruh penambahan lidah buaya (Aloevera Sp) terhadap sifat fisik dan kimia susu sapi segar dan susu kedelai. Jurnal Bioproses Komoditas Tropis 2013; 1(1), 80-87.
[24] Q Wang, Y Zhu, Z Ji and J Chen. Lubrication and sensory properties of emulsion systems and effects of droplet size distribution. Foods 2021; 10(12), 3024.
[25] E Winarno, R Widyasaputra and M Ulfah. Pembuatan minuman sari beras dengan kombinasi rempah jahe putih. Agroforetech 2023; 1(1), 591-604.
[26] S Sonawane and SS Arya. Antioxidant activity of jambhul, wood apple, ambadi and ambat chukka: An indigenous lesser known fruits and vegetables of India. Advance Journal of Food Science and Technology 2013; 5(3), 270-275.
[27] SN Amalia, Rimbawan and M Dewi. Glycemic index values of sweet corn (Zea Mays Saccharata Sturt) with some kind of processing. Journal of Nutrition and Food 2011; 6(1), 36-41.
[28] S El-Safy, F Rabab, HA Salem and E Mukhtar. The impact of soaking and germination on chemical composition, carbohydrate fractions, digestibility, antinutritional factors and minerals content of some legumes and cereals grain seeds. Alexandria Science Exchange Journal 2013; 34(4), 499-513.
[29] BA Susila. Keunggulan mutu gizi dan sifat fungsional sorgum (Sorghum vulgare). IPB University Scientific Repository, Indonesia, 2005, 527-534.
[30] HA Pangastuti, DR Affandi and D Ishartani. Karakterisasi sifat fisik dan kimia tepung kacang merah (Phaseolus Vulgaris L.) dengan beberapa perlakuan pendahuluan. Jurnal Teknosains Pangan 2013; 2(1), 20-29.
[31] TK Dewi, DM Margana and S Buchturi. Padi Hitam Jawa Barat. Polsub Press, Indonesia, 2018.
[32] S Ahmad, G Nasir, ZRAA Azad, ZA Khan, K Jan and K Bashir. Optimisation of multigrain seera from sorghum, green gram and finger millet: Effect of ingredients on functional, structural and thermal properties. Journal of Food Science and Technology 2024; 61,471-480.
[33] E Dickinson. Hydrocolloids at interfaces and the influence on the properties of dispersed systems. Food Hydrocolloids 2003; 17(1), 25-39.
[34] JN BeMiller. Carbohydrate chemistry for food scientists. Elsevier 2019; 16(1), 159-189.
[35] T Schmid, M Kinner, L Stäheli, S Steinegger, L Hollenstein, D de la Gala and N Müller. Effect of press cake-based particles on quality and stability of plant oil emulsions. Foods 2024; 13(18), 2969.
[36] A Arif, A Budiyanto and H Hoerudin. Glicemic Index of foods and its affecting factors. Jurnal Penelitian dan Pengembangan Pertanian 2013; 32(3), 91-99.
[37] MM Asty and M Gumilar. Development of enteral formula ‘nutrigrain’ based on multigrain flour for diabetes mellitus patients. Jurnal Gizi dan Dietetik 2025; 4(1), 44-56.
[38] P Pontieri, J Troisi, M Calcagnile, SR Bean, M Tilley, F Aramouni, A Boffa, G Pepe, P Campiglia, FD Giudice, AL Chessa, D Smolensky, M Aletta, P Alifano and LD Giudice. Chemical composition, fatty acid and mineral content of food-grade white, red and black sorghum varieties grown in the mediterranean environment. Foods 2022; 11(3), 436.
[39] I Jonuškienė, E Davicijonaitė, M Vaškevičiūtė, I Kala, R Stankevičienė, K Kantminienė and I Tumosienė. Sustainable production and antioxidant activity of bacterial xanthan gum. Molecules 2025; 30(13), 2734.
[40] Yunida, M. Totong Kamaluddin, Theodorus, and S. Mangunsong. Formulasi dan karakterisasi nanopartikel kafein hasil isolasi dari biji kopi robusta (Coffea Canephora var. Robusta). Jurnal Mandala Pharmacon Indonesia 2021; 7(1), 47-59.
[41] B Milovanovic, I Djekic, J Miocinovic, V Djordjevic, JM Lorenzo, FJ Barba, D Mörlein and I Tomasevic. What is the color of milk and dairy products and how is it measured? Foods 2020; 9(11), 1629.
[42] MT Veronica, IMB Ilmi and YC Octaria. Kandungan gula sangat tinggi dalam minuman teh susu dengan Topping boba. Amerta Nutrition 2022; 6(1) 171-176.
[43] SG Anggrahini, DS Rosdiana, SF Syihab and HM Insani. Analisis jalur penggunaan label gizi, konsumsi minuman kemasan, dan status gizi remaja di Kecamatan Pasirkaliki, Kota Bandung. Jurnal SAGO Gizi dan Kesehatan 2025; 6(2), 403-410.