
Trends
Sci.
2026;
23(9):
12847
The Combination of Enzymatic and Acid Hydrolysis to Produce Nanocrystalline Cellulose from Oil Palm Empty Fruit Bunches
Novian Wely Asmoro1,2, Chusnul Hidayat1, Teguh Ariyanto3 and Ria Millati1,*
1Department of Food and Agricultural Product Technology, Universitas Gadjah Mada, Yogyakarta 55281, Indonesia
2Agricultural Faculty, Universitas Veteran Bangun Nusantara, Sukoharjo 57521, Indonesia
3Department of Chemical Engineering, Universitas Gadjah Mada, Yogyakarta 55281, Indonesia
(*Corresponding author’s e-mail: [email protected])
Received: 30 November 2025, Revised: 25 January 2026, Accepted: 1 February 2026, Published: 1 April 2026
Abstract
Harsh acid hydrolysis is a conventional method for producing nanocrystalline cellulose (CNC), but a more environmentally friendly alternative should be developed. Therefore, this study aimed to investigate the performance of the combined hydrolysis method in the CNC isolation process to improve yield, crystallinity index, and particle size. The conditions of the combined hydrolysis process were examined, specifically the concentration of endoglucanase enzyme (Endo-1,4-β-glucanase (EC. 3.2.1.4)) and the duration of enzymatic hydrolysis. Endoglucanase enzyme concentration was 20 - 100 µL, and hydrolysis time was 12 - 60 h. The results showed that the combined hydrolysis method using enzyme and acid significantly affected the increase in crystalline yield, crystallinity index, and reduced the average crystal size. This process started with cellulose hydrolysis using endoglucanase enzyme with a concentration of 40 µL for 24 h, followed by sulfuric-acid hydrolysis at a concentration of 20% at 40 °C for 30 min. The method produced the highest crystalline yield of 99.10%, crystallinity index 78.13%, average crystal size 20.94 nm, and average particle size of 64.01 nm. FTIR analysis showed that the combined hydrolysis process does not affect the crystalline structure of cellulose, while SEM studies showed a more open and fibrillated appearance because of efficient removal of amorphous areas. Overall, combined enzymatic-chemical hydrolysis produced CNC with high crystallinity, high yield, and smaller particle size, indicating its potential as a biopolymer for food packaging applications.
Keywords: Crystallinity, Enzyme, Hydrolysis, Isolation, Nanocrystalline cellulose, OPEFB, Particle size
Introduction
Cellulose is a naturally abundant biobased material with potential for industrial applications. This material is derived from lignocellulosic components, such as oil palm empty fruit bunches (OPEFB). Previous studies have reported that OPEFB consists of 39% - 50% cellulose [1,2]. The use of cellulose leads to biopolymer-based nanocomposites, namely cellulose nanomaterial (CN) or nanocrystalline cellulose (CNC), with the development of characteristics [3]. Currently, CNC is gaining significant attention as a filler for several nanocomposites, with potential for application in several sectors. These include food [4], medicine [5], as a membrane of filtration systems, nanofiller in polymer composites, nanocomposite hydrogel, protective coatings, electronic devices, pulp and paper, reinforcement, and other special function additions in manufacturing [6].
Nanocrystalline cellulose is a spindle-shaped nanoparticle with a high degree of crystallinity obtained through acid hydrolysis of cellulosic biomass [7]. It has a length varying between 100 and 500 nm and a crystallinity index ranging from 65% to 80% [8,9]. The production of CNC is mainly obtained through chemical method using acid to remove amorphous areas of cellulose and increase crystallinity index. Several methods have been developed to produce CNC, which include acid hydrolysis (sulfuric acid) [10], chloric acid (HCl) [8], a combination of physical and chemical methods [11], enzymatic hydrolysis [12-14], subcritical water hydrolysis, and oxidation using (2,2,6,6-tetramethylpiperidin-1-oxyl) (TEMPO) [15]. Among these methods, chemical hydrolysis using sulfuric acid is commonly used in various applications.
A previous study reported that acid hydrolysis using sulfuric acid on pistachio shells produces CNC with 50 ± 14% and a crystallinity index of 66% [9]. With 60% Sulfuric acid (H2SO4) at 45 °C for 45 min, CNC from cucumber peel had a crystallinity index of 74.1% and a yield of 65.55% [16]. Cellulose from apple pomace with an H2SO4 concentration of 45% produced CNC with a crystallinity index of 78% [17]. Sugarcane bagasse (SCB) with a solution of H2SO4 (64 %w/w), 1:10 g/mL (cellulose: Dilute H2SO4) at a temperature of 45 °C for 60 min, produced CNC with a crystallinity index of 72.5% [10]. Acid hydrolysis can produce small CNC (< 100 nm) with good suspension stability due to the formation of sulfate groups on the particle surface [9,18]. However, this acid method has disadvantages, namely a decrease in the crystallinity index due to excessive cellulose degradation, corrosive properties towards equipment, and a significant environmental impact due to acid residues and high-water requirements at the neutralization stage [19,20].
In addition to acid hydrolysis, enzymatic hydrolysis is also a promising method. In enzymatic hydrolysis, various enzymes such as complex cellulase, exoglucanase, and endoglucanase have been used [21]. Enzyme concentration and hydrolysis time are important factors that determine the yield and crystallinity index of CNC. Several studies have reported that the use of endoglucanase in cellulose hydrolysis at a concentration of 300 µL for 72 h resulted in a crystallinity index of 63.95% [22]. The use of enzymes (20 mg protein/g solid) produced a crystalline cellulose yield 24.60% with a crystallinity index 78.30% [23]. Enzymatic hydrolysis using endoglucanase occurs under mild conditions (± 50 °C, pH 5) [24]. In this study, endoglucanase enzyme was used because it is selective towards the amorphous region of cellulose, thereby preserving the crystalline structure and producing CNC with a relatively high crystallinity index [21,25]. However, the resulting particle size from enzymatic hydrolysis tends to be larger, and the suspension stability is low [13,25]. Therefore, a combined enzymatic-chemical hydrolysis method was developed to get the advantages of both methods and allow the use of sulfuric acid at lower concentrations.
The combined method is conducted through enzymatic hydrolysis using endoglucanase enzyme, followed by acid hydrolysis using sulfuric acid. This study hypothesizes that the endoglucanase enzyme hydrolyzes the binding of β-1, 4 cellulose glycoside on the amorphous part, causing the amorphous part to become more open. Under mild conditions, acid hydrolysis will further hydrolyze the amorphous part, causing increased CNC yield, high crystallinity index, and low particle size.
Materials and methods
Material
Oil palm empty fruit bunches were obtained from oil palm plantation in Central Kalimantan, Indonesia. The procedures of previous studies were applied to obtain OPEFB cellulose through a pretreatment process using 10% NaOH and 1.4% NaClO2 [1]. The chemicals, including. NaOH (Merck-German), phosphate buffer of pH 5, sulphuric acid (H2SO4, 98 %w/w), and endoglucanase enzyme (endo-1,4-β-glucanase (EC 3.2.1.4)) were obtained from Sigma-Aldrich Pte., Ltd (USA).
Hydrolysis process using a combination of enzymatic and acid methods
The combined hydrolysis method for the production of CNC was carried out in two stages according to literature [26]. These included enzymatic hydrolysis using the endoglucanase enzyme (endo-1,4-β-glucanase (EC 3.2.1.4)), followed by acid hydrolysis with sulfuric acid. Specifically, enzymatic hydrolysis was conducted at 50 °C using a water bath shaker. Variations in the concentration of endoglucanase enzyme were used to determine the best. The concentration of enzyme added was in the range of 20 - 100 µL/g OPEFB or equivalent to 10 - 50 mg protein/g OPEFB cellulose sample. The enzyme was dissolved in 30 mL of pH 5 phosphate buffer before being mixed with one gram of OPEFB cellulose in a 50-mL falcon tube. In line with yield and crystallinity index, the best enzyme concentration of 40 µL/g OPEFB was determined and used to evaluate hydrolysis time from 12 to 60 h. The enzymatic hydrolysis reaction was stopped by heating the sample solution in a falcon tube in water at 100 °C for 10 min to inactivate the enzyme [25]. After cessation, the solution was centrifuged for 15 min, followed by natant separation for acid hydrolysis. Based on the same parameters, the best hydrolysis time of 24 h was selected. Each process was followed by acid hydrolysis using sulfuric acid with a concentration of 20% at 40 °C for 30 min, obtained through preliminary acid hydrolysis experiments. The solid residue from enzymatic hydrolysis was put into a baker’s glass and added to 20 mL of sulfuric acid. The hydrolysis process was stopped by adding 200 mL of cold distilled water, followed by centrifugation for 15 min to separate the natant and supernatant. The neutralization process used cold distilled water (1:10 v/v) [15]. Subsequently, centrifugation was repeated 4 - 5 times until a pH of 5 was reached. The final solid residue was dried at 60 °C for 24 h to obtain a dry crystalline cellulose.
Analysis
Crystallinity index (CrI)
Crystallinity index was determined using X-ray diffraction (XRD) (XPERT-PRO D8 Bruker, Germany) at the integrated laboratory of the Islamic University of Indonesia, Yogyakarta. The analysis and instrument conditions were set at a wavelength of 1.540°A (CuKα radiation), with a scanning speed of 2° per second and a range of 2θ = 2° - 80°. Crystallinity index was calculated using Eq. (1).

In this equation, I002 was the highest intensity peak at 2θ = 22° - 23° of the crystalline fraction, and Iam was the low intensity peak around 2θ = 18° of the amorphous region [27].
Crystallite size
Crystallite size was estimated from the (1̅10), (110), and (200) lattice planes of cellulose, calculated using Scherrer equation [28].

In this equation, D was the crystal size in the direction normal to the family of lattice planes, K was the Scherrer’s constant (0.94 for equatorial reflection of rod-like or needle-like crystallites), λ was the wavelength of the radiation (1.54056 A°), β ½ was the full width (in radians) at half maximum intensity (FWHM) of the same peak (002), and θ was the bragg angle [29,30].
Yield of crystalline cellulose
The yield of crystalline cellulose was calculated using Eq. (3).

In this equation, A was the amount of crystalline cellulose of OPEFB before hydrolysis, and B was the amount of crystalline cellulose after hydrolysis process.
Color of crystalline cellulose
Color testing was measured using a Chroma meter (Minolta, CR-400, Tokyo, Japan). Parameters of color observed were L: Light, a*: Green-red, and b*: Blue-yellow. Whitening index (WI) was calculated with Eq. (4) [17].

Fourier Transmission Infra-Red spectroscopy (FTIR)
Fourier Transmission Infra-Red Spectroscopy method was analyzed using cellulose and crystalline cellulose functional groups (Perkin Elmer Spectrum IR 10.7.2, USA). Specifically, the analysis was conducted in the integrated laboratory of the Islamic University of Indonesia, Yogyakarta. OPEFB crystalline cellulose samples without KBr were in powder form, and FTIR spectroscopy was generated by scanning at various transmission wavelengths of 450 - 4,000 cm–1 [31].
Scanning electron microscope (SEM)
Images of crystalline cellulose were obtained using a JEOL SEM (JSM-6510LA, JEOL, Japan). Analysis was conducted in the integrated study and testing laboratory of Universitas Gadjah Mada, Indonesia. Initially, crystalline cellulose was coated with a very thin layer of gold in a JEC-3000FC sputter coater to obtain a conductive surface, and images were acquired at 10 to 15 kV [4,32].
Results and discussion
Effect of enzyme concentration and hydrolysis time on hydrolysis process
Crystalline cellulose yield from the combined OPEFB cellulose hydrolysis method using 20 - 100 µL enzyme concentration conditioned at 50 °C for 24 h is presented in Figure 1. Based on the results, yield ranged from 88.66% to 98.75%. The highest yield and crystallinity index of 98.75% and 79.47% were achieved by combining hydrolysis method using an endoglucanase enzyme concentration of 40 µL. Meanwhile, the lowest crystalline cellulose yield and crystallinity index of 88.66% and 71.39% were obtained at 100 µL. Different concentrations of endoglucanase enzyme affected the yield and crystallinity index of crystalline cellulose. The results showed that high concentrations of endoglucanase enzyme caused a decrease in the yield and crystallinity index of crystalline cellulose. Endoglucanase is a multi-domain with catalytic sites that randomly cut β-1,4-glycosidic bonds in polysaccharide chains, especially in amorphous regions, thereby increasing fibril structure openness and relative crystalline fraction [33,34] However, at very high enzyme concentrations, endoglucanase with multiple catalytic domains causes less selective hydrolysis and has the potential to attack semi-crystalline to crystalline regions, thereby reducing the crystallinity index and yield due to excessive hydrolysis [35]. According to Beltramino et al. [32], the use of cellulase enzyme at a dose of 10 U/g in hydrolysis could increase yield of crystalline cellulose by approximately 12%. Using 100 µL of endoglucanase enzyme (84 EGU/200 mg recycled pulp), CNC was obtained with a yield of 38.24% [12].
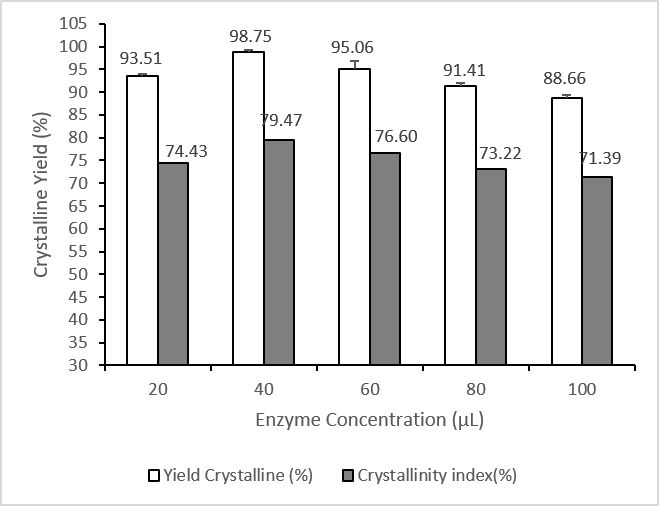
Figure 1 Effect of enzyme concentration on the combined hydrolysis method.
The results in Table 1 showed yield of crystalline cellulose, which ranged from 95.18% to 99.27%. Statistical results showed that there was a significant difference in the extension of enzyme hydrolysis treatment time with the combined method. The highest yield of 99.27% was obtained at 36 h of enzyme hydrolysis time, which was not significantly different from 24 h at 99.10%. Meanwhile, the highest crystallinity index value of 78.89% was obtained at 36 h. The lowest yield and crystallinity index were 95.18% and 76.12% at 60 h of hydrolysis time. The results showed that the combined hydrolysis method increased the crystalline yield and crystallinity index. However, the control treatment using only acid hydrolysis method had yield of 93.53% and a crystallinity index value of 73.36%. The use of enzymatic hydrolysis had yield of 88.69% and a crystallinity index value of 71.44%, which were lower than the combined method.
The main change in material rheology during the initial 4 - 6 h of enzymatic hydrolysis is a reduction in fiber size due to enzyme action in fiber swelling, erosion, and exfoliation [25]. Furthermore, the combined method affected the size of cellulose crystalline diameter, which ranged from 20.94 to 22.83 nm. This value was smaller than the crystalline diameter of acid hydrolysis.
Table 1 Effect of enzyme concentration and enzymatic time on the combined hydrolysis method.
Origin of cellulose |
Crystalline yield (%) |
Crystallinity index (%) |
Average crystalline size (nm) |
Enzyme Concentration (µL) * |
|
|
|
20 |
93.51 ± 0.39bc |
74.43 |
19.54 ± 7.78a |
40 |
98.75 ± 0.49d |
79.47 |
22.30 ± 5.55a |
60 |
95.06 ± 1.85c |
76.60 |
20.34 ± 4.84a |
80 |
91.41 ± 0.61b |
73.22 |
19.77 ± 6.55a |
100 |
88.66 ± 0.76a |
71.39 |
19.25 ± 6.95a |
Hydrolysis time (Hours) * |
|
|
|
12 |
96.53 ± 0.58cd |
76.12 |
21.41 ± 5.14a |
24 |
99.10 ± 1.36d |
78.13 |
20.94 ± 6.45a |
36 |
99.27 ± 0.66d |
78.89 |
22.09 ± 3.85a |
48 |
95.47 ± 0.85bc |
76.15 |
21.40 ± 5.85a |
60 |
95.18 ± 1.43bc |
76.12 |
22.83 ± 4.27a |
Acid Hydrolysis** |
93.53 ± 1.84b |
73.36 |
55.63 ± 38.75b |
Enzymatic Hydrolysis** |
88.69 ± 0.79a |
71.44 |
19.31 ± 6.33a |
Cellulose from OPEFB |
- |
69.35 |
- |
Note: Different notations show a significant difference.
* The sample was hydrolyzed using combined method (endoglucanase enzyme with a concentration of 20 - 100 µL at 12 - 60 h, then continued with acid hydrolysis through 20% sulfuric acid, a temperature of 40 °C, and a time of 30 min).
** control: Acid hydrolysis using 20% sulfuric acid & enzymatic hydrolysis using 40 µL endoglucanase enzyme at 24 h.
The synergy between enzyme concentration and hydrolysis time arises from both factors that controlling the selective hydrolysis of amorphous cellulose while maintaining the crystalline region. At optimal enzyme concentrations, endoglucanase attacks mainly the β-1,4-glycosidic bonds in the amorphous sites. At the right hydrolysis time, this process slowly opens the fibrillar structure, exposing more cellulose without significant damage to the crystalline phase [14,33]. Too high enzyme concentrations or prolonged hydrolysis times can cause over-hydrolysis and partial degradation of the crystalline regions, resulting in low yields and degradation of crystallinity [36]. On the contrary, insufficient enzyme content or too short hydrolysis time lead to incomplete elimination of the amorphous portion.
Previous studies reported that CNC from pistachio shells had a yield of 50 ± 14% and a crystallinity index of 66% with acid hydrolysis process using sulfuric acid [9]. Acid hydrolysis (60 wt% H2SO4) at 45 ℃ for 45 min of cucumber peel showed rod-like shape with high crystallinity index (74.1%) and yield of 65.55% [16]. Based on cellulose from apple pomace with 45% H2SO4 (97%) at 50 °C for 45 min, CNC has a crystallinity index of 78% [17]. SCB with H2SO4 solution (64 %(w/w), 1:10 g/mL (cellulose: Dilute H2SO4) at 45 °C for 60 min under CNC had a higher crystallinity index (72.5%) [10]. Enzymatic hydrolysis (17.5 %w/w total solids, 12.5 mg/g enzyme concentration for 72 h at 50 °C) had also been used in the isolation of crystalline cellulose from SCB, showing a yield of 83% and an increased crystallinity index [25]. CNC synthesis from lemongrass using cellulase hydrolysis had a crystallinity index of 64.78% [5]. Based on these results, the recommended combination method for OPEFB CNC production was endoglucanase enzyme hydrolysis with a concentration of 40 µL/g sample, at 50 °C, for 24 h, followed by acid hydrolysis using 20% sulfuric acid at 40 °C and 30 min.
Characteristics of CNC from OPEFB
XRD
Crystallinity index of raw OPEFB, cellulosic OPEFB, alongside CNC enzymatic hydrolysis, acid hydrolysis, and the combined method can be obtained from XRD analysis. Figure 2 shows XRD spectroscopy for CNC obtained from various methods and the reference of raw OPEFB. Based on the results, the peaks at 2θ: 34.84°, 22.69° and 15.99° represented crystalline cellulose. The peaks of crystalline cellulose showed characteristic peaks in the 004, 200, and 110 planes, respectively. These showed the characteristics of type I cellulose crystal structure with crystalline cellulose domains indicated by sharp diffraction peaks around 16° and 22.5° [10]. Crystallinity index obtained using the combined method was 78.13%, which was higher compared to enzymatic (71.44%) or acid hydrolysis (73.36%). This is indicated by XRD graph, where crystalline parts have narrow and sharp diffraction peaks, while the amorphous parts show broad peaks. In line with the results, the combined method produced high crystallinity, which was important in determining the barrier and mechanical properties (strength, stiffness, rigidity) of CNC reinforcement as fillers in biopolymer composites for industrial applications [3].
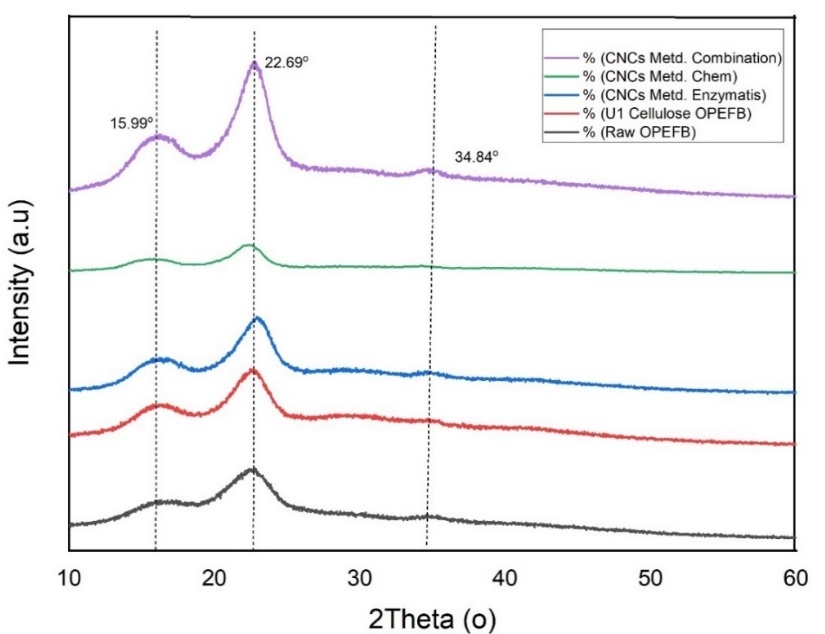
Figure 2 X-ray diffractogram of raw OPEFB, OPEFB cellulose, CNC Enzymatic, Acid, and the Combined Method.
Crystalline size of CNC was calculated using Scherrer equation. Based on the results, CNC produced by the combined method ranged from 19.25 to 22.83 nm, which was smaller than the average value of 55.63 nm obtained using acid method. Enzymatic hydrolysis produced CNC with a more uniform average crystal size compared to acid hydrolysis because of more controllable enzyme action on cellulose [25].
The combined enzymatic-chemical hydrolysis process utilizes 2 mechanisms to enhance the degradation of the amorphous portion of cellulose. Endoglucanase enzymes selectively cleave β-(1→4)-glycosidic bonds in the middle of glucan chains in the amorphous region, thereby reducing molecular weight, opening the fibril structure, and increasing accessibility to acid hydrolysis [33]. In addition, non-specific sulfuric acid continues to randomly cleave glycosidic bonds, particulary in more vulnerable amorphous regions, resulting in more efficient CNC isolation [10].
FTIR
Figure 3 and Table 2 show the verification results of crystalline cellulose through FTIR analysis in this study and references. Based on the results, FTIR spectroscopy of all cellulose showed similar transmittance peaks around 3,400, 2,900, 1,345, 1,045 cm−1, which correspond to type I cellulose [11]. The wavelengths showed the functional groups of cellulose, including C = O stretch at 1,032 cm–1, -O-pyranose at 1,324 - 1,634 cm–1, CH2 stretch at 2,904 cm–1, and OH functional group at 3,330 cm–1. The transmittance peaks observed in the range of 1,032 - 1,160 cm−1 were attributed to C = O stretching and C–H rocking vibrations of the pyranose ring skeleton. The peaks observed within 1,324 and 1,634 cm–1 in all spectroscopy were attributed to symmetrical bending of CH2 and bending vibrations of C–H and C = O groups of aromatic rings in polysaccharides [11]. The broad transmittance band around 3,330 cm−1 was associated with bending and stretching vibrations of OH functional groups, intra- and inter-molecular hydrogen bonds, showing type I lattices of crystalline domains in all samples [8]. Furthermore, there was a slight change in peak intensity associated with an increase in the number of OH groups for CNC.
The peak range of 890 cm−1 band corresponded to ß-glycosidic linkages between glucose units of cellulose [15]. Glycosidic linkages show cellulose structure, which connects the anomeric carbon atoms of saccharides to produce polysaccharides [5]. FTIR analysis also confirmed that acid hydrolysis, enzymatic hydrolysis, and the combined method in CNC production did not affect the basic structure of cellulose in cellulose microfibers and CNCs.
Acid hydrolysis produced sulfate groups at a peak around 1,205 cm−1 [37], which could be bound to the CNC surface. In line with the results, there was an increase in peak intensity on CNC using acid hydrolysis, although the combined method was synergistic [32]. Generally, enzymatic hydrolysis can release the amorphous part of cellulose, as shown by a slight decrease in peaks at 890 and 2,900 cm–1. This converts carbonyl groups to carboxyl, as shown by a reduction in peaks at 1,324 - 1,634 cm–1, thereby increasing the accessibility of the cellulose crystalline surface to be hydrolyzed in the next process using sulfuric acid.
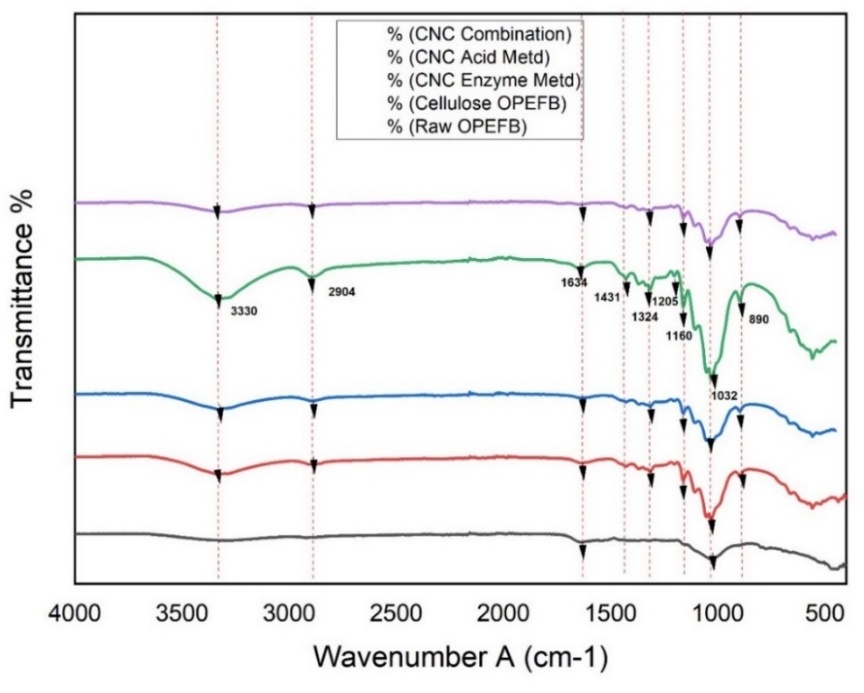
Figure 3 FTIR of EFB cellulose, crystalline cellulose after enzyme hydrolysis, and crystalline cellulose after combined hydrolysis.
Table 2 Wavelength spectroscopy of functional groups in cellulose obtained in this study and references.
Functional groups in cellulose |
Reference [11] (cm–1) |
Reference [17] (cm–1) |
This work (cm–1 ) |
C=O stretching and C–H rocking vibrations of the pyranose ring skeleton C=O stretches the acetyl and carbonyl groups -O- pyranose rings stretch in cellulose CH2 stretches in cellulose molecules OH intramolecular hydrogen bonds in cellulose CH deformation of cellulose |
1,045 - 1,160
1,345
2,900 3,400 898 |
-
1,037 - 1,462
2,942 - 2,886 3,369 - |
1,032
1,324 - 1,634
2,904 3,330 550 - 890 |
Morphology of CNC
The changes in the morphological structure of OPEFB fibers after hydrolysis are shown in Figure 4. Based on the results, OPEFB pulp fiber raw material showed smooth surface and an intact fiber structure with a large size (Figure 4(A)). Specifically, Figure 4(B) showed cellulose isolated from OPEFB through alkaline pretreatment process. Most of the cellulose fibers were separated from the lignocellulose components, although some structures were only open. (Figures 4(C) - 4(E)) showed crystalline cellulose after acid hydrolysis using sulfuric acid, enzymatic hydrolysis using endoglucanase enzyme, and the combined method. Based on the morphological appearance of the SEM results, there has been a change in fiber structure and cellulose fiber size after hydrolysis process.
The fiber-fiber structure in crystalline cellulose was separated and opened after hydrolysis, as shown in Figures 4(C) - 4(D). Acid hydrolysis process can release hydronium ions for hydrolytic cleavage or cutting of glycosidic bonds in cellulose molecules at amorphous parts along cellulose fibers [38]. The endoglucanase enzyme used in the cellulose hydrolysis process can randomly cut β-1,4 glycosidic bonds in cellulose polysaccharide chains to attack and degrade amorphous parts on the fiber surface and between microfibrils. This condition increases the exposed crystal surface and causes swelling of cellulose fiber [34]. As shown in Figure 4(E), the combined method is synergistic, generating crystalline cellulose fiber structure separated from the microfibril bundles and producing more small fibers compared to enzymatic hydrolysis. The endoglucanase enzyme selectively attacks the amorphous part between the crystalline cellulose microfibrils [3] and facilitates the disintegration of fiber structure, thereby reducing fiber size. The amorphous part of cellulose is easier to hydrolyze, located on the surface and between the microfibrils [14].
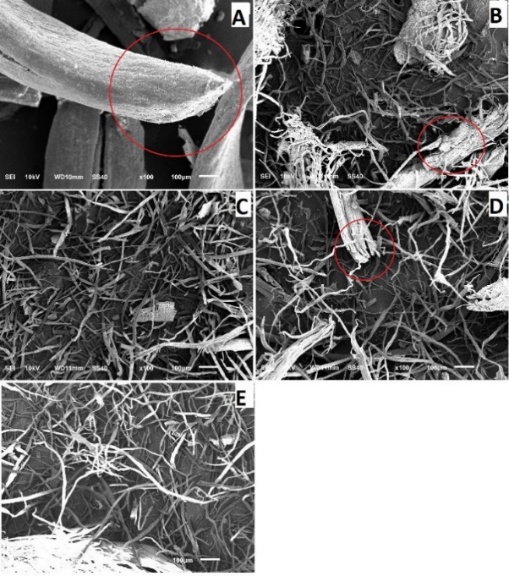
Figure 4 SEM images of (A). OPEFB; (B). OPEFB cellulose; (C). Crystalline cellulose acid hydrolysis method: (D). Crystalline cellulose enzymatic hydrolysis method; (E). Crystalline cellulose combined hydrolysis method.
Particle size of CNC OPEFB
Characterization of the particle size distribution of CNC was carried out using PSA. The results presented in Figure 5 and Table 3 showed that CNC produced from acid hydrolysis process had an average particle size of 90.88 nm, ranging from 65.67 to 120.10 nm. CNC from the combined method had a smaller average particle size of 64.01 nm, ranging from 53.80 to 73.63 nm. The combined method was more effective in reducing particle size compared to the acid method. The polydispersity index (PI) value of CNC produced by the acid hydrolysis had an average of 0.74, while the combined method was 0.71. A smaller PI value shows a more uniform particle size distribution.
The PI value of CNC produced by the combined hydrolysis method is relatively lower than acid hydrolysis, showing a relatively more uniform particle distribution. In comparison, the literature indicated that CNC isolated through acid hydrolysis process (60% H2SO4) at 45 °C for 45 min showed an average particle size of 309.8 ± 273.16 nm and a PI of 0.726 [16]. Meanwhile, CNC obtained by hydrolysis process using 50% sulfuric acid at 40 °C for 10 min showed an average diameter of 196.7 nm [39]. This showed that the combined method could reduce the average particle size of CNC to less than 100 nm. The hydrolysis process on cellulose promotes the depolymerization of cellulose crystals, causing a decrease in particle size [5]. The type and method of hydrolysis will also cause changes in particle size distribution and crystallinity [31].
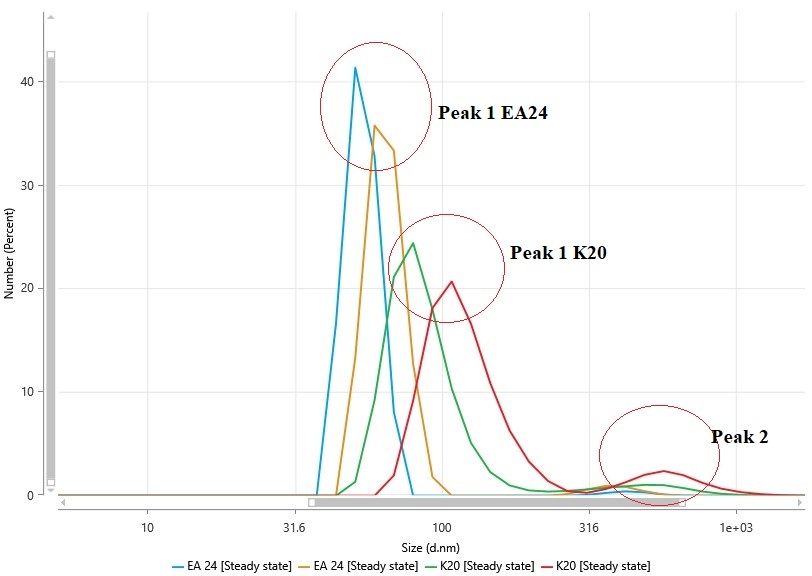
(EA 24: CNC from Combined Hydrolysis and K20: CNC from Acid Hydrolysis).
Figure 5 Particle size distribution of CNC in the combined hydrolysis process.
Zeta potential is an important parameter that shows the stability and aggregation tendency in a dispersion. As presented in Table 3, CNC obtained from acid hydrolysis method showed an average zeta potential of –20.84 mV. Meanwhile, the combined method produced –20.39 mV, which was higher than the −14.0 mV obtained using enzymatic method from lemongrass [5]. The zeta potential value shows that CNC from OPEFB can be dispersed in aqueous systems. The negative charge is attributed to surface hydroxyl groups, which enhance colloidal stability [5]. Generally, zeta potential values higher than 25 mV and below –30 mV show the colloidal stability of CNC in aqueous systems [16,40]. while nanoparticles with –15 to 15 mV cause flocculation in suspensions, showing the need for an optimal range [16]. These characteristics suggest that CNC has the potential for further use as biopolymers for food packaging applications, and CNC-based pickering emulsions can be formulated for application in encapsulation system [3].
Table 3 Analysis of particle size, polydispersity index, and zeta potential.
Name |
Minimum |
Maximum |
Average |
CNC acid hydrolysis method |
|||
Peak 1 area by size (%) |
88.90 |
98.24 |
93.50 ± 4.67 |
Particle size (nm) |
65.67 |
120.10 |
90.88 ± 27.46 |
Polydispersity Index (PI) |
0.71 |
0.76 |
0.74 ± 0.02 |
Zeta Potential (mV) |
–21.85 |
–20.08 |
–20.84 ± 0.91 |
CNC combined hydrolysis method |
|||
Peak 1 area by size (%) |
96.66 |
98.78 |
97.45 ± 1.16 |
Particle size (nm) |
53.80 |
73.63 |
64.01 ± 9.93 |
Polydispersity Index (PI) |
0.59 |
0.91 |
0.71 ± 0.17 |
Zeta Potential (mV) |
–22.86 |
–16.24 |
–20.39 ± 3.61 |
Color
The optical characteristics of crystalline cellulose OPEFB from combined hydrolysis, enzymatic, and acid hydrolysis methods are shown in Table 4. Statistical results showed that there was a significant difference in hydrolysis method on the whiteness index (WI), with the highest value of 72.67% obtained using the combined method.
The combined hydrolysis process produced optical characteristics of crystalline cellulose with higher brightness (L) and whiteness index (WI) compared to acid method using sulfuric acid, enzymatic hydrolysis, and reference. More regular crystalline regions promote more uniform light scattering and reflection due to differences in refractive index along the crystallographic axis. In addition, the removal of amorphous and non-cellulose chromophore components increases the purity of the structure, resulting in higher brightness and whiteness values compared to materials with less regular structures [41,42]. This result is significantly higher when compared to the results of CNC production from apple pomace using an acid hydrolysis process, which had WI of 47.79% [17]. Biocomposite films prepared from cassava pulp show WI of approximately 75.45% [43], while carboxymethyl cellulose had 80.96% to 71.33% [43]. The brightness and whiteness of crystalline cellulose are required for further use as a biocomposite material. At this WI range, CNC shows potential to be used as biocomposite material.
Table 4 Optical characteristics of crystalline cellulose combined hydrolysis method.
Origin of cellulose |
L |
a* |
b* |
WI (%) |
Combined hydrolysis method |
77.24b |
–2.79b |
14.86a |
72.67 ± 0.12b |
Enzymatic Hydrolysis** |
75.63a |
–4.03a |
15.73a |
70.67 ± 1.13a |
Acid Hydrolysis** |
75.86a |
–2.63b |
17.17a |
70.26 ± 0.78a |
CNC [17] |
- |
- |
- |
47.79 ± 0.65 |
Note: Different notations show a significant difference.
* acid hydrolysis using 20% sulfuric acid.
** enzymatic hydrolysis using 40 µL endoglucanase enzyme for 24 h.
Combination hydrolysis shows that the sample was hydrolyzed using the endoglucanase enzyme for 12 - 60 h, then continued with acid hydrolysis using 20% sulfuric acid, temperature 40 °C, and a time of 30 min.
Conclusions
In conclusion, the combined hydrolysis method can be used as an alternative to acid hydrolysis method. The results show that the combined method significantly increases yield and crystallinity index of OPEFB cellulose in CNC isolation process, followed by a reduction in the average diameter. The characteristics of CNC obtained have the potential to be used as biopolymers for food packaging applications.
Acknowledgements
The authors are grateful to the Doctoral Dissertation Research grant (1753/UN1/DITLIT/Dit-Lit/PT.01.03/2022) from the Directorate of Research, Technology, and Community Service, Directorate General of Higher Education, Research, and Technology, Ministry of Education, Culture, Research, and Technology of the Republic of Indonesia.
Declaration of Generative AI in Scientific Writing
The authors state that DeepL was used to refine the English language during the manuscript preparation process. The final version of the manuscript has been reviewed and corrected by a native speaker. All original scientific content, data analysis, interpretations, and conclusions were prepared entirely by the authors.
CRediT Author Statement
Novian Wely Asmoro: Conceptualization, Methodology, Investigation, Formal analysis, Writing - Original draft preparation, and Writing - Reviewing and Editing. Chusnul Hidayat: Supervision and Writing-Reviewing. Teguh Ariyanto: Supervision and Writing-Reviewing. Ria Millati: Conceptualization, Supervision, Funding acquisition, Writing-Reviewing and Editing.
References
[1] NW Asmoro, C Hidayat, T Ariyanto and R Millati. Cellulose isolation from oil palm empty fruit bunch using different pretreatment processes. Journal of Applied Science and Engineering 2022; 26(11), 1513-1520.
[2] SH Pranolo, J Waluyo, R Ikbar, RA Damayanthy, S Lestary and ML Qadarusman. Application of nanocrystal cellulose based on empty palm oil fruit bunch as glucose biosensing. ASEAN Journal of Chemical Engineering 2023; 23(3), 360-369.
[3] PG Marakana, A Dey and B Saini. Isolation of nanocellulose from lignocellulosic biomass: Synthesis, characterization, modification, and potential applications. Journal of Environmental Chemical Engineering 2021; 9(6), 106606.
[4] QJ Chen, LL Zhou, JQ Zou and X Gao. The preparation and characterization of nanocomposite film reinforced by modified cellulose nanocrystals. International Journal of Biological Macromolecules 2019; 132, 1155-1162.
[5] P Kumari, R Seth, A Meena and D Sharma. Enzymatic synthesis of cellulose nanocrystals from lemongrass and its application in improving anti-cancer drug release, uptake and efficacy. Industrial Crops and Products 2023; 192, 115933.
[6] J Shojaeiarani, D Bajwa and A Shirzadifar. A review on cellulose nanocrystals as promising biocompounds for the synthesis of nanocomposite hydrogels. Carbohydrate Polymers 2019; 216, 247-259.
[7] B Zakani and D Grecov. Effect of ultrasonic treatment on yield stress of highly concentrated cellulose nano-crystalline (CNC) aqueous suspensions. Carbohydrate Polymers 2022; 291, 119651.
[8] J Lamaming, R Hashim, CP Leh and O Sulaiman. Properties of cellulose nanocrystals from oil palm trunk isolated by total chlorine free method. Carbohydrate Polymers 2017; 156, 409-416.
[9] J Marett, A Aning and EJ Foster. The isolation of cellulose nanocrystals from pistachio shells via acid hydrolysis. Industrial Crops and Products 2017; 109, 869-874.
[10] A Kumar, YS Negi, V Choudhary and NK Bhardwaj. Characterization of cellulose nanocrystals produced by Acid-hydrolysis from sugarcane bagasse as Agro-waste. Journal of Materials Physics and Chemistry 2014; 2(1), 1-8.
[11] FT Seta, X An, L Liu, H Zhang, J Yang, W Zhang, S Nie, S Yao, H Cao, Q Xu, Y Bu and H Liu. Preparation and characterization of high yield cellulose nanocrystals (CNC) derived from ball mill pretreatment and maleic acid hydrolysis. Carbohydrate Polymers 2020; 234, 115942.
[12] PB Filson, BE Dawson-Andoh and D Schwegler-Berry. Enzymatic-mediated production of cellulose nanocrystals from recycled pulp. Green Chemistry 2009; 11(11), 1808-1814.
[13] SR Anderson, D Esposito, W Gillette, JY Zhu, U Baxa and SE McNeil. Enzymatic preparation of nanocrystalline and microcrystalline cellulose. TAPPI Journal, 13(5), 35-42.
[14] T Yang, Y Guo, N Gao, X Li and J Zhao. Modification of a cellulase system by engineering Penicillium oxalicum to produce cellulose nanocrystal. Carbohydrate Polymers 2020; 234, 115862.
[15] H Zhang, Y Chen, S Wang a , L Ma, Y Yu, H Dai and Y Zhang. Extraction and comparison of cellulose nanocrystals from lemon (Citrus limon) seeds using sulfuric acid hydrolysis and oxidation methods. Carbohydrate Polymers 2020; 238(2), 116180.
[16] NS Prasanna and J Mitra. Isolation and characterization of cellulose nanocrystals from Cucumis sativus peels. Carbohydrate Polymers 2020; 247, 116706.
[17] AY Melikoğlu, SE Bilek and S Cesur. Optimum alkaline treatment parameters for the extraction of cellulose and production of cellulose nanocrystals from apple pomace. Carbohydrate Polymers 2019; 215, 330-337.
[18] N Johar, I Ahmad and A Dufresne. Extraction, preparation and characterization of cellulose fibres and nanocrystals from rice husk. Industrial Crops and Products 2012; 37(1), 93-99.
[19] Y Habibi, LA Lucia and OJ Rojas. Cellulose nanocrystals: Chemistry, self-assembly, and applications. Chemical Reviews 2010; 110(6), 3479-3500.
[20] C Liu, B Li, H Du, D Lv, Y Zhang, G Yu, X Mu and H Peng. Properties of nanocellulose isolated from corncob residue using sulfuric acid, formic acid, oxidative and mechanical methods. Carbohydrate Polymers 2016; 151, 716-724.
[21] Z Karim, S Afrin, Q Husain and R Danish. Necessity of enzymatic hydrolysis for production and functionalization of nanocelluloses. Critical Reviews in Biotechnology 2017; 37(3), 355-370.
[22] R Sposina, S Teixeira, A Sant and J Jang. Combining biomass wet disk milling and endoglucanase / β -glucosidase hydrolysis for the production of cellulose nanocrystals Combining biomass wet disk milling and endoglucanase /  -glucosidase hydrolysis for the production of cellulose nanocrystals. Carbohydrate Polymers 2015; 89(1), 80-88.
[23] P Squinca, S Bilatto, AC Badino and CS Farinas. Nanocellulose production in future biorefineries: An integrated approach using tailor-made enzymes. ACS Sustainable Chemistry & Engineering 2020; 8(5), 2277-2286.
[24] BD Argo, AK Wardani, E Zubaidah and S Winarsih. Endoglucanase, exo-glucanase and ‚-glucosidase activity thecombination of crude enzyme from Trichoderma reesei and Aspergillus niger at different temperatures and pH. Biosciences 2014; 9(2), 46-48.
[25] B Pereira and V Arantes. Production of cellulose nanocrystals integrated into a biochemical sugar platform process via enzymatic hydrolysis at high solid loading. Industrial Crops and Products 2020; 152, 112377.
[26] NW Asmoro, R Millati, C Hidayat and T Ariyanto. Kombinasi Proses Hidrolisis Enzimatis dan Kimiawi pada Pembuatan Nanokristalin Selulosa dari Tandan Kosong Kelapa Sawit. Universitas Gadjah Mada, Yogyakarta, Indonesia, 2025.
[27] T Niamsap, NT Lam and P Sukyai. Production of hydroxyapatite-bacterial nanocellulose scaffold with assist of cellulose nanocrystals. Carbohydrate Polymers 2019; 205, 159-166.
[28] L Amoroso, G Muratore, MA Ortenzi, S Gazzotti, S Limbo and L Piergiovanni. Fast Production of Cellulose Nanocrystals by Hydrolytic-Oxidative Microwave-Assisted Treatment. Polymer 2020; 12(1), 68.
[29] R Arun, R Shruthy, R Preetha and V Sreejit. Biodegradable nano composite reinforced with cellulose nano fiber from coconut industry waste for replacing synthetic plastic food packaging. Chemosphere 2022; 291(P1), 132786.
[30] Z Zulnazri, R Dewi, S Sulhatun and N Nasrun. Kinetics study the decomposition of the cellulose into cellulose nanocrystals by hydrothermal with hydrochloric acid catalyst. International Journal of Plant Biology 2019; 10(1), 7440.
[31] M Thakur, A Sharma, V Ahlawat, M Bhattacharya and S Goswami. Process optimization for the production of cellulose nanocrystals from rice straw derived α-cellulose. Materials Science for Energy Technologies 2020; 3, 328-334.
[32] F Beltramino, BM Roncero, T Vidal, AL Torres and C Valls. Increasing yield of nanocrystalline cellulose preparation process by a cellulase pretreatment. Bioresource Technology 2015; 192, 574-581.
[33] X Wang, J Zeng, W Gao, K Chen, B Wang and J Xu. Endoglucanase recycling for disintegrating cellulosic fibers to fibrils. Carbohydrate Polymers 2019; 223, 115052.
[34] E Quintana, C Valls, T Vidal and MB Roncero. Comparative evaluation of the action of two different endoglucanases. Part I: On a fully bleached, commercial acid sulfite dissolving pulp. Cellulose 2015; 22(3), 2067-2079.
[35] ADAD Santos, MJF Silva, MV Scatolino, AFS Durães, MC Dias, RAP Damásio and GHD Tonoli. Comparison of pre-treatments mediated by endoglucanase and TEMPO oxidation for eco-friendly low-cost energy production of cellulose nanofibrils. Environmental Science and Pollution Research 2022; 30(2), 4934-4948.
[36] JJ Kaschuk, TM Lacerda and E Frollini. International journal of biological macromolecules investigating effects of high cellulase concentration on the enzymatic hydrolysis of the sisal cellulosic pulp. International Journal of Biological Macromolecules 2019; 138, 919-926.
[37] K Song, X Zhu, W Zhu and X Li. Preparation and characterization of cellulose nanocrystal extracted from Calotropis procera biomass. Bioresources and Bioprocessing 2019; 6(1), 45.
[38] Y Tang, X Shen, J Zhang and D Guo. Extraction of cellulose nano-crystals from old corrugated container fiber using phosphoric acid and enzymatic hydrolysis followed by sonication. Carbohydrate Polymers 2015; 125, 360-366.
[39] WT Wulandari, A Rochliadi and IM Arcana. Nanocellulose prepared by acid hydrolysis of isolated cellulose from sugarcane bagasse. IOP Conference Series: Materials Science and Engineering 2016; 107(1), 012045.
[40] JD Aguiar, TJ Bondancia, PIC Claro, HC Mattoso, CS Farinas and JM Marconcini. Enzymatic deconstruction of sugarcane bagasse and straw to obtain cellulose nanomaterials. ACS Sustainable Chemistry & Engineering 2020; 8(5), 2287-2299.
[41] B Frka-Petesic, TG Parton, C Honorato-Rios, A Narkevicius, K Ballu, Q Shen, Z Lu, Yu Ogawa, JS Haataja, BE Droguet, RM Parker and S Vignolini. Structural color from cellulose nanocrystals or chitin nanocrystals: Self-Assembly, Optics, and Applications. Chemical Reviews 2023; 123(23), 12595-12756.
[42] JA Sirvio, K Rekinen and A Ammala. High-yield nanocellulose from supramolecular chemistry-driven delignified softwood. Carbohydrate Polymers Journal 2025; 366, 123873.
[43] J Nithikarnjanatharn and N Samsalee. Effect of cassava pulp on Physical, Mechanical, and Biodegradable properties of Poly(Butylene-Succinate)-Based biocomposites. Alexandria Engineering Journal 2022; 61(12), 10171-10181.