
Trends
Sci.
2026;
23(9):
12859
Optimization of DSPE-Based Graphene Oxide from Empty Fruit Bunches
Using Response Surface Methodology for Determining Ciprofloxacin
Antibiotic Residue
Rinawati1,*, Agung Abadi Kiswandono1, Rima Soraya Permata Sari1, Herlian Eriska Putra2, Dian Septiani Pratama1, Fahamsyah Hamdan Latief3 and Widiarti4
1Department of Chemistry, Universitas Lampung, Bandar Lampung 35145, Indonesia
2Research Center for Environmental and Clean Technologies, National Research and Innovation Agency,
Tangerang Selatan 15314, Indonesia
3Department of Mechanical Engineering, Universitas Nasional, Jakarta 12520, Indonesia
4Department of Mathematics, Universitas Lampung, Bandar Lampung 35145, Indonesia
(*Corresponding author’s e-mail: [email protected])
Received: 1 December 2025, Revised: 6 January 2026, Accepted: 16 January 2026, Published: 25 March 2026
Abstract
Water contamination by antibiotic residues, especially ciprofloxacin (CIP), poses a significant environmental issue due to its role in antimicrobial resistance and adverse impacts on aquatic ecosystems. This study investigated the synthesis of graphene oxide (GO) from empty fruit bunches (EFB) and assessed its efficacy as an adsorbent in the Dispersive Solid Phase Extraction (DSPE) method for the quantification of CIP. The synthesized graphene oxide (GO) underwent thorough characterization through FTIR, XRD, SEM-EDX, and UV-Vis spectrophotometry, validating the presence of oxygen-containing functional groups and structural characteristics associated with GO. The optimization of the GO-based DSPE process using Response Surface Methodology (RSM) determined the optimal extraction conditions at pH 3, an adsorbent mass of 22.5 mg, and a contact time of 35 min, resulting in a predicted CIP adsorption efficiency of 90.592%. ANOVA results confirmed the statistical significance of the quadratic model (p < 0.0001), with a high coefficient of determination (R² = 0.9856) and a non-significant lack-of-fit (p > 0.05), indicating strong model reliability. Experimental validation yielded an adsorption efficiency of 90.129%, closely matching the predicted value with a minimal error of 0.005%, demonstrating excellent agreement between the model and experimental results. The method showed excellent linearity (R² = 0.9989 - 0.9999), with an LOD of 0.0874 mg/L and LOQ of 0.2914 mg/L. Precision was satisfactory, with %RSD ranging from 0.71% to 2.89%. The findings demonstrate that EFB-derived GO serves as an effective and sustainable adsorbent, showing considerable potential for analytical applications, wastewater treatment, and broader environmental remediation.
Keywords: Antibiotic residue, Ciprofloxacin, Dispersive solid phase extraction, Graphene oxide, Response surface methodology
Introduction
Water supplies are vital for the sustenance of all life forms on Earth. The swift escalation of industrial activity and daily human practices has resulted in significant water contamination from different toxins, including new pollutants. Despite their frequent occurrence at low concentrations, these pollutants can nonetheless jeopardize human health and disrupt the equilibrium of aquatic ecosystems [1,2]. Examples encompass medications, personal care items, industrial chemicals, and pesticides [3,4]. Antibiotics are especially concerning among these. Global antibiotic use is anticipated to attain 100,000 to 200,000 tonnes annually and is estimated to rise by 200% by 2030 relative to 2015 [5]. After therapeutic use, a significant portion of antibiotics remain unmetabolized and are discharged into the environment via household and hospital effluents, suggesting possible harmful consequences and contributing to the development of antimicrobial resistance [6].
Ciprofloxacin (CIP), a fluoroquinolone antibiotic effective against both Gram-positive and Gram-negative bacteria, is one of the most commonly used antibiotics worldwide. It is often recommended for treating skin and respiratory problems [7,8]. CIP has been found in many sources of wastewater, such as hospital and household effluents, and often at levels that are higher than the safe limit (0.064 µg/L). Excessive CIP concentrations can be hazardous, carcinogenic, and teratogenic, as well as promote bacterial resistance, highlighting the importance of proper monitoring and reliable testing methodologies [9]. Analytical procedures like Dispersive Solid Phase Extraction (DSPE) are gaining popularity due to their simplicity, speed, and low solvent use [10]. In the analysis of pharmaceuticals and drug residues, DSPE has been extensively utilized as an effective sample preparation technique to enhance antibiotic extraction and preconcentration in complex matrices, thereby augmenting analytical sensitivity and reliability. These features render DSPE particularly suitable for the determination of antibiotic residues in environmentally relevant aqueous matrices, including ciprofloxacin [10-12].
Sorbent materials employed in DSPE are often mesoporous or nanostructured, characterized by their elevated surface area, non-toxicity, recyclability, and robust adsorption capacity. Graphene Oxide (GO), a hydrophilic mesoporous substance, demonstrates excellent water dispersibility and comprises aromatic (sp²) and aliphatic (sp³) domains that enable various surface interactions. Nonetheless, commercially available graphene oxide is costly and generally sourced from non-renewable graphite [13-15]. Consequently, recent research has concentrated on generating graphene oxide from biomass as a more economical and eco-friendly option. In Lampung Province, Indonesia, oil palm empty fruit bunches (EFB), a by-product of the palm oil industry, are produced in substantial quantities, totaling around 202,216 tons annually [16]. EFB comprises 40.93% - 68.3% carbon, 41.3% - 45% cellulose, 25.3% - 33.8% hemicellulose, and 27.6% - 32.5% lignin [17], positioning it as a viable precursor for sustainable GO synthesis. Prior study has shown the effective synthesis of graphene oxide (GO) from biomass sources, including coconut shells by a modified Hummers technique [18] and cassava peels optimized by Response Surface Methodology.
Optimizing antibiotic adsorption necessitates the consideration of various parameters, including pH, contact duration, and adsorbent mass. Traditional optimization methods can need many experimental iterations, rendering them time-intensive and wasteful. Response Surface Methodology (RSM) offers a more efficient approach by concurrently assessing several variables within a Design of Experiment framework. This work employed the Box-Behnken Design (BBD) model to ascertain optimal conditions for ciprofloxacin adsorption. This statistical methodology facilitates the assessment of variable interactions, decreases chemical usage, and lowers operational expenses [19]. The RSM technique has effectively optimized GO-based adsorption procedures for several pollutants, such as norfloxacin [20], chloride ions, crystal violet dye [21], and heavy metals in industrial wastewater [22].
This study focuses on the synthesis of EFB-derived GO using this abundant and environmentally sustainable carbon source. The resultant GO was analyzed by Fourier Transform Infrared (FTIR) spectroscopy, X-ray Diffraction (XRD), Scanning Electron Microscopy with Energy Dispersive X-ray (SEM EDX), and Ultraviolet Visible (UV Vis) spectrophotometry to assess its physical and chemical properties. The study aims to determine the optimal conditions for ciprofloxacin adsorption by examining the effects of pH, adsorbent mass, and contact time using Response Surface Methodology to improve adsorption efficiency.
Materials and methods
The materials used included oil palm empty fruit bunch (EFB) waste from PT. Sinar Jaya Agro Investama, concentrated H₂SO₄ from Supelco Sigma-Aldrich, KMnO₄ from Merck™, H₂O₂ 30% from Supelco Sigma-Aldrich, BaCl₂ from Merck™, ciprofloxacin (CIP) standard antibiotics from Hexpharm Jaya, HCl 37% from Smart-Lab, NaOH, and distilled water.
Preparation of standard and sample solutions
The standard and sample solutions were prepared prior to the DSPE tests. A ciprofloxacin stock solution was created by dissolving a sufficient amount of the CIP standard in distilled water and then diluting it to make working solutions at the desired concentrations. Each solution’s pH was adjusted with HCl or NaOH before extraction.
Graphitization of empty fruit bunches
EFB was subjected to crushing and subsequently washed with water to ensure cleanliness. EFB was sun-dried for a duration of 5 days. The material was subsequently processed by cutting it into smaller sizes, reducing it from its original dimensions to those suitable for the counter, and then dried at 100 °C for 24 h. Dried EFB was milled and sieved to a particle size of 200 mesh and subsequently stored in a desiccator to preserve moisture content [23]. Samples weighing up to 6 g were pyrolyzed at 400, 500, and 600 °C for 3 h to find the best conditions [24].
GO synthesis with the modified Hummer’s method
A total of 2 g of graphite was placed in a 500 mL beaker, followed by the addition of concentrated H₂SO₄:H₃PO₄ (23:2.5 mL). The mixture was stirred using a magnetic stirrer in an ice bath for 30 min, after which 3 g of KMnO₄ was slowly added while maintaining the temperature below 10 °C. The reaction was then continued by stirring at 35 °C for 30 min. Subsequently, 46 mL of distilled water was added dropwise until the temperature rose to 98 °C, and the mixture was allowed to stand for 15 min [15,25]. An additional 140 mL of distilled water was then introduced, followed by the slow addition of 10 mL of 30% H₂O₂ while stirring for 10 min to ensure the completion of the oxidation process.
The resulting suspension was washed repeatedly with 5% HCl to remove residual sulphate ions, and the absence of sulphate was confirmed by the lack of white precipitate upon BaCl₂ testing. The product was further washed with distilled water until the pH reached approximately 5, then separated by centrifugation for 10 min. The obtained precipitate was re-dispersed in 450 mL of distilled water, sonicated for 30 min, and finally dried in an oven at 60 °C for 5 h [26].
Graphene oxide characterization
GO was characterized using Fourier Transform Infrared (FTIR) spectroscopy (Agilent Cary 630), X-ray diffraction (XRD) analysis (Bruker D8 Advance), scanning electron microscopy coupled with energy-dispersive X-ray spectroscopy (SEM-EDX, EVO® MA 10), and UV-Vis spectrophotometry (Shimadzu UV-1780).
DSPE optimization using RSM
The DSPE optimization was performed using a Box-Behnken Design (BBD) consisting of 3 coded levels: Maximum (+1), medium (0), and minimum (1). These levels were applied to the variables of adsorbent mass, pH, and contact time (Table 1). The experimental ranges of the 3 parameters were defined as pH (2 - 8), GO adsorbent mass (5 - 40 mg), and contact time (10 - 60 min). The experimental matrix generated using Design Expert 13.0 produced 17 experimental runs. Level of pH as the solution pH of the ciprofloxacin sample during the DSPE process. The adsorption percentage obtained from each DSPE trial served as the response variable and was analyzed using ANOVA. Response surface methodology (RSM) was subsequently used to generate surface plots and to identify the optimal conditions for the CIP adsorption process using GO as the adsorbent.
Table 1 Levels of independent variables in BBD design.
Factor |
−1 |
0 |
1 |
Mass of GO adsorbent (mg) |
5 |
22.5 |
40 |
pH |
2 |
5 |
8 |
Contact time (min) |
10 |
35 |
60 |
The experiments were conducted sequentially following the run order specified in Table 1 of the BBD design. For each run, the sample was prepared by mixing the CIP solution at a defined concentration with a predetermined mass of GO adsorbent under controlled pH and contact time conditions. After the adsorption process was finished, the GO was separated from the solution by centrifugation and then filtration. The residual CIP concentration in the supernatant was quantified using a UV-Vis spectrophotometer at 274 nm. Regression analysis was then performed to validate the reliability and predictive accuracy of the model, with the percentage of CIP removal serving as the response variable as defined in Eq. (1).

where, Co = Initial CIP concentration (ppm); Cx = Final concentration of CIP after adsorption in solution (ppm).
Validation statistical were evaluated under the optimized conditions. The validation involved comparing the projected adsorption values derived from the RSM model with the relevant experimental results. The agreement between predicted and experimental values was assessed by percentage error and statistical metrics, including R², adjusted R², predicted R², lack-of-fit, and acceptable precision. The analytical performance was evaluated based on linearity (R²), precision (expressed as % Relative Standard Deviation, %RSD), and the limits of detection (LOD) and quantification (LOQ).
Results and discussion
This section presents the results of the study along with an in-depth analysis to identify the findings obtained. The discussion included the characterization of EFB-derived GO material synthesis results based on data from various analytical instruments, such as FTIR, SEM, XRD, and UV-Vis spectrophotometry. In addition, the process of optimizing CIP adsorption conditions using EFB-derived GO was also explained, accompanied by a thorough comparison of the experimental data obtained.
Graphene oxide characterization
The EFB-derived GO was subsequently characterized using FTIR, SEM-EDX, XRD, and UV-Vis spectrophotometry. Figure 1(a) presents the FTIR spectra of commercial GO, EFB-derived GO, and EFB-derived graphite. Clear spectral differences were observed between EFB-derived graphite and EFB-derived GO, particularly the emergence of characteristic oxygen-containing functional groups in EFB-derived GO. The EFB-derived GO spectrum exhibited distinct absorption bands associated with carboxylate (C=O) and epoxy (C–O–C) groups at 1,703 and 1,013 cm⁻¹, respectively. The presence of these oxygen functionalities in EFB-derived GO was further verified by comparison with the commercial GO spectrum, which displayed similar peak patterns. These included hydroxyl (–OH) stretching at 3,302 and 3,127 cm⁻¹, carboxylate (C=O) stretching at 1,703 and 1,722 cm⁻¹, aromatic C=C stretching at 1,586 and 1,610 cm⁻¹, C–O stretching of carboxylate groups at 1,215 and 1,237 cm⁻¹, and epoxy (C–O–C) vibrations at 1,013 and 1,038 cm⁻¹. Collectively, the FTIR results confirm that the modified Hummers method successfully oxidized EFB-derived graphite into GO, as evidenced by the appearance of functional groups typical of commercial graphene oxide. These results are consistent with previous reports [18,27,28], who similarly observed the formation of carbonyl (–C=O), carboxyl (–COOH), hydroxyl (–OH), and epoxy (C–O–C) groups following the oxidation of biomass-derived graphite.
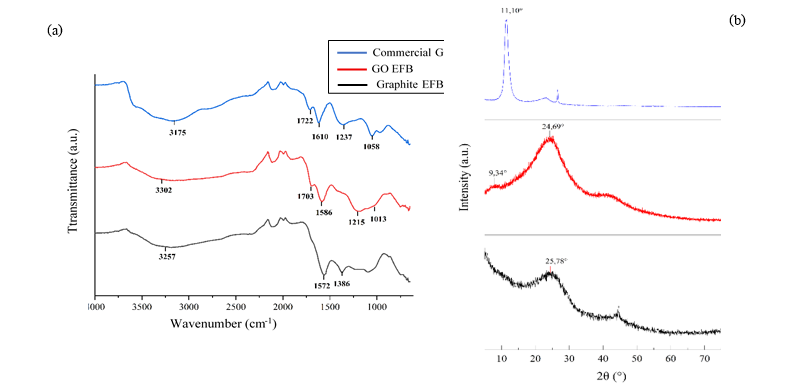
Figure 1 Characterization results from FTIR and XRD analyses (a) FTIR spectra images and (b) XRD patterns of commercial GO, EFB-derived GO, and EFB-derived graphite.
The XRD results presented in Figure 1b show that EFB-derived graphite exhibits a diffraction peak at 2θ = 25.78° with relatively low intensity, indicating poor crystallinity (amorphous structure) and an incomplete graphitization process. This observation is consistent with the typical diffraction pattern of graphite, which generally displays a peak near 2θ of approximately 26° [29], and also aligns with the findings of Karim et al. [30], who reported that EFB graphite produces peaks below 26° with low crystallinity. In comparison, the GO synthesized from EFB displays 2 characteristic peaks at 2θ = 9.34° and 24.69°, both reflecting an amorphous structure. The peak at 9.34° corresponds to the oxidized GO phase commonly observed between 2θ values of 9° and 13° [31], confirming the successful transformation of graphite into GO. The shift of the broad graphite peak from around 26° to 24.69° indicates the intercalation of oxygen-containing functional groups within the graphene layers, which increases the interlayer spacing, as also noted by Li et al. [26]. The relatively strong peak intensity at 24.69° suggests the presence of multilayer GO sheets, which may result from incomplete oxidation or partial structural shrinkage during the drying process [17,32]. Overall, the differences in peak position and intensity between graphite and EFB-derived GO confirm the successful synthesis of GO. The dominance of amorphous features in both materials is closely related to the characteristics of biomass-based graphite, which contains various organic residues and non-carbon components [17]. These results demonstrate that the structural attributes of the resulting GO are strongly influenced by the intrinsic properties of the EFB precursor and the specific conditions applied during the oxidation process.
Figure 2 illustrates the surface morphology of commercial GO, EFB-derived GO, and EFB-derived graphite at a magnification of 5,000×. Figure 2(b) illustrates that the GO derived from EFB displays a layered and non-uniform morphology. The sheets exhibit partial exfoliation, are loosely stacked, and present wavy and slightly folded characteristics. This morphology aligns with the findings of Rinawati et al. [18], who noted that GO generally exhibits thin, sheet-like layers characterized by extensive surface areas and a mildly corrugated texture. The SEM image of commercial GO (Figure 2(a)) corroborates these observations, indicating a strong similarity between EFB-derived GO and commercial GO. The SEM image of EFB graphite (Figure 2(c)) shows compact and aggregated structures with numerous wrinkled regions, indicative of unoxidized biomass-derived graphite. The shift from dense graphite aggregates to partially exfoliated sheets in EFB-derived GO indicates the effectiveness of the oxidation and sonication processes in separating graphite layers and generating GO.
|
|
|
|
|
|
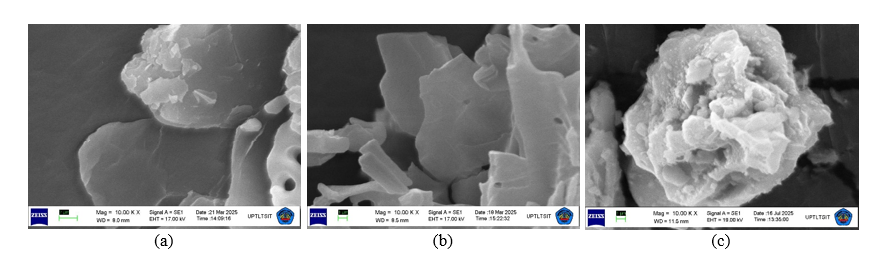
Figure 2 SEM images at the same magnification (a) Commercial GO, (b) EFB-derived GO, and (c) EFB-graphite.
The elemental composition analysis of the GO adsorbents was performed using EDX, with results presented in Figure 3. The elemental composition of GO synthesized from EFB (Figure 3b) is primarily characterized by carbon and oxygen, which are the main components introduced during the oxidation process. The carbon content is 73.22%, significantly exceeding the oxygen content of 26.78%. The findings support the explanation by Akhtar et al. [33], which indicated that the presence of oxygen verifies the successful incorporation of oxygen functional groups into the graphite carbon framework during the formation of graphene oxide. The EDX spectrum of commercial GO (Figure 3(a)) further corroborates this trend, displaying a relatively balanced distribution of carbon and oxygen. Conversely, EFB-derived graphite (Figure 3(c)) shows an elevated oxygen content of 31.85 %. This imbalance can be attributed to incomplete oxidation in the conversion of graphite to graphene oxide (GO) using KMnO₄, leading to a reduced number of oxygen functional groups in the GO structure. Additionally, it may indicate residual oxygen from the original biomass material, a phenomenon frequently observed in agricultural-waste-based carbon precursors [34,35].
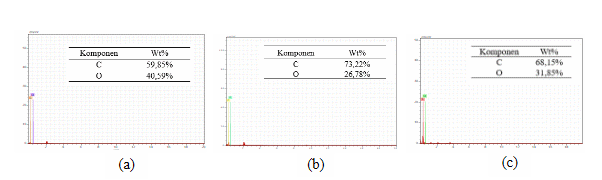
Figure 3 EDX spectra of (a) commercial GO, (b) EFB- GO derived, and (c) EFB-graphite.
The optical properties of graphite and GO derived from EFB were characterized using UV-Vis spectrophotometry, focusing on the wavelength range of 190 to 400 nm to assess differences between the 2 materials. Figure 4 illustrates that the spectrum of graphite (Figure 4(c)) demonstrates a relatively low absorbance that progressively diminishes with increasing wavelength and is devoid of any distinct absorption peak. The observed pattern aligns with the findings of Chiang et al. [36], which indicate that well-ordered graphite structures with few functional groups do not display significant electronic transitions in the UV-Vis region. The UV-Vis spectrum of EFB-derived GO (Figure 4(b)) exhibits markedly higher absorbance, featuring a prominent peak around 200 nm and a broadened absorption edge that extends toward 300 nm. The features observed are consistent with the findings of Fauzi et al. [37], who reported that GO generally displays an absorption maximum at approximately 230 nm, with a shoulder near 300 nm. This structure is indicative of the π to π* electronic transition linked to C=C bonds in its aromatic regions. The findings are corroborated by the study of Baruah and Chowdhury [38], which identified 2 distinct GO absorption peaks at approximately 201 and 280 nm. The commercial GO spectrum (Figure 4(a)), which displays a distinct absorption peak at 203 nm, further confirms the findings. The distinct differences observed in the spectra of EFB-derived graphite and EFB-derived GO, especially the pronounced absorption near 200 nm, indicate that the oxidation of EFB-derived graphite to GO was effectively accomplished.
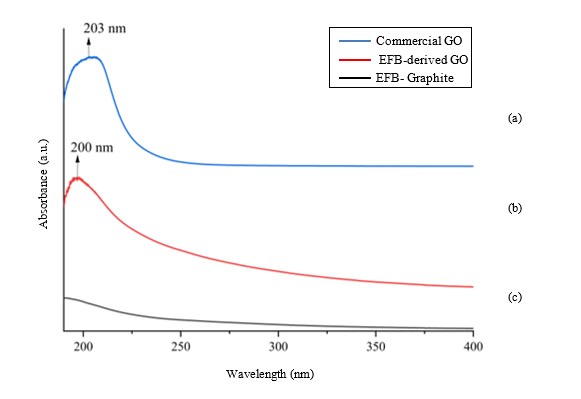
Figure 4 UV-Vis spectra of GO obtained from different precursors: (a) commercial GO, (b) EFB-derived GO and (c) EFB-graphite.
DSPE optimization using RSM Box-Behnken Design
The CIP adsorption results were obtained from 17 experimental runs generated by the BBD design, which evaluated the effects of pH, contact time, and adsorbent mass on the response variable, as summarized in Table 2.
Table 2 Percentage of CIP adsorption obtained at each level of the independent variables in the BBD design.
Run |
pH |
Adsorbent Mass (mg) |
Contact Time (min) |
Adsorption (%) |
1 |
5 |
22.5 |
35 |
86.4122 |
2 |
5 |
22.5 |
35 |
87.9174 |
3 |
8 |
22.5 |
10 |
63.1473 |
4 |
2 |
22.5 |
60 |
91.0646 |
5 |
8 |
40 |
35 |
62.8596 |
6 |
8 |
5 |
35 |
60.8458 |
7 |
5 |
40 |
10 |
88.0542 |
8 |
5 |
22.5 |
35 |
84.0859 |
9 |
5 |
5 |
60 |
86.0016 |
10 |
2 |
22.5 |
10 |
86.1385 |
11 |
8 |
22.5 |
60 |
65.4488 |
12 |
5 |
5 |
10 |
66.8446 |
13 |
2 |
5 |
35 |
74.3802 |
14 |
5 |
40 |
60 |
82.5530 |
15 |
5 |
22.5 |
35 |
87.0123 |
16 |
5 |
22.5 |
35 |
90.2436 |
17 |
2 |
40 |
35 |
The experimental data indicated that the quadratic model is most suitable for further analysis. ANOVA results (Table 3) show a p-value below 0.0001 and an F-value of 53.33, confirming strong statistical significance at the 95% confidence level. All model parameters significantly affected the response, and the lack-of-fit test (p > 0.05) confirmed the model’s adequacy for predictive use [39].
Fit statistics (Table 4) further support the model’s reliability: R² = 0.9856, adjusted R² = 0.9671, and predicted R² = 0.9109, with a minimal difference of 0.0562, indicating robust predictive performance without overfitting. The Adeq Precision of 20.5725 and a coefficient of variation of 2.58% demonstrate a high signal-to-noise ratio and precise, stable representation of the experimental data [40,41].
Table 3 Analysis of variance (ANOVA) results.
Source |
Sum of Squares |
df |
Mean Square |
Value |
p-value |
Model |
2,030.42 |
9 |
225.60 |
53.33 |
< 0.0001* |
A-pH |
1,054.59 |
1 |
1,054.59 |
249.27 |
< 0.0001* |
B-Adsorbent Mass |
180.15 |
1 |
180.15 |
42.58 |
0.0003* |
C-Contac Time |
54.51 |
1 |
54.51 |
12.88 |
0.0089* |
AB |
65.41 |
1 |
65.41 |
15.46 |
0.0057* |
AC |
1.72 |
1 |
1.72 |
0.4071 |
0.5438 |
BC |
152.02 |
1 |
152.02 |
35.93 |
0.0005* |
A² |
375.36 |
1 |
375.36 |
88.73 |
< 0.0001* |
B² |
106.47 |
1 |
106.47 |
25.17 |
0.0015* |
C² |
6.50 |
1 |
6.50 |
1.54 |
0.2550 |
Residual |
29.61 |
7 |
4.23 |
|
|
Lack of Fit |
9.50 |
3 |
3.17 |
0.6302 |
0.6330 |
Table 4 Summary of model fit statistics.
Standard Deviation |
Average |
C.V. (%) |
R2 |
Adjusted R2 |
Predicted R2 |
Adequate Precision |
2.06 |
79.74 |
2.58 |
0.9856 |
0.9671 |
0.9109 |
20.5725 |
The model’s accuracy was evaluated using diagnostic plots (Figure 5). The normal probability plot (Figure 5(a)) shows residuals near the diagonal, indicating normal distribution and good fit. The predicted vs. actual plot (Figure 5(b)) shows data points closely clustered around the diagonal, reflecting strong correlation and high accuracy. The residuals vs. run plot (Figure 5(c)) displays random residuals around zero, all within control limits, indicating no bias or outliers [39,42].
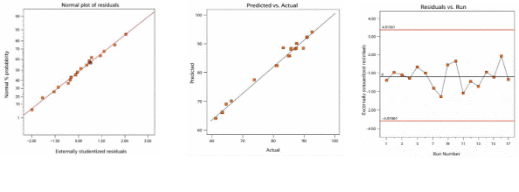
Figure 5 Diagnostic plots: (a) normal probability plot of residuals, (b) predicted versus actual values, and (c) residuals versus run.
The results of the experimental design and statistical analysis utilizing the quadratic model produced by Design Expert 13.0 are delineated in Eq. (2). A positive coefficient signifies that an increase in the related variable augments the percentage of CIP adsorption, while a negative coefficient denotes an inhibitory effect. This study demonstrates that both adsorbent mass and contact duration positively influence adsorption efficiency, indicating that greater values of these variables enhance performance. Conversely, pH exerts a detrimental effect, suggesting that increased alkalinity leads to a diminished percentage of CIP adsorption, in accordance with the results presented by Rinawati et al. [18].
Adsorption = 87.13 − 11.48A + 4.75B + 2.61C – 4.04AB – 0.6562AC – 6.16BC – 9.44A2 – 5.03B2 – 1.24C2 (2)
The percentage of CIP adsorption influenced by pH, adsorbent mass, and contact time was analyzed using Design Expert 13.0 to evaluate the individual effects and interactions among these parameters. The resulting contour and 3-dimensional response surface plots are presented in Figure 6. As shown in Figures 6(a) and 6(b), which illustrate the interaction between pH and adsorbent mass at a fixed contact time of 35 min, CIP adsorption increases under more acidic conditions and with higher adsorbent mass. The steep gradients observed in the 3D surface plot indicate that small variations in these 2 variables produce substantial changes in adsorption efficiency. Figures 6(c) and 6(d) depict the interaction between pH and contact time at an adsorbent mass of 22.5 mg. The plots show that adsorption improves as the pH becomes more acidic, while the influence of contact time is relatively minor, as evidenced by the gentler slope of the 3D surface. In contrast, Figure 6(e) and 6(f) present the interaction between adsorbent mass and contact time, which exhibit relatively stable effects on CIP adsorption. This stability is reflected in the flatter contour and 3D surfaces, suggesting that the combination of these 2 variables does not exert a dominant influence on adsorption performance.
The pH is the key variable affecting CIP adsorption, as evidenced by the varying color gradients in the contour plots and the pronounced response surfaces in the 3-dimensional diagrams. The sensitivity of CIP adsorption to pH is attributed to the pH-dependent ionization of CIP and the resultant alterations in the surface charge of GO. Maximum adsorption occurs in acidic to near-neutral conditions, where CIP possesses a positive charge (pH below 5.90) as a result of amine group protonation. At pH values exceeding 8.89, CIP acquires a negative charge due to the deprotonation of carboxyl groups. In the intermediate pH range of 5.90 to 8.89, CIP primarily exists in a zwitterionic neutral form [45]. Under acidic conditions (pH 3 to 5), graphene oxide exhibits a negative surface charge due to the deprotonation of its oxygen-containing functional groups. This promotes significant electrostatic attraction between negatively charged GO and positively charged CIP, thus improving adsorption efficiency. At pH values exceeding 7, both GO and CIP exhibit progressively negative charges, resulting in electrostatic repulsion that diminishes adsorption efficiency [18]. This is in line with the FTIR characterization results of GO-EFB, which show the presence of functional groups containing large amounts of oxygen, including hydroxyl (–OH), carboxyl (–COOH), carbonyl (C=O), and epoxide (C–O–C) groups. These functional groups impart a negative charge to the GO surface, especially under acidic to neutral pH conditions due to partial deprotonation of the carboxyl and hydroxyl groups [27,28]. As a result, at acidic pH values (around pH 3), there is a strong electrostatic attraction between positively charged CIP molecules and the negatively charged GO surface, resulting in higher adsorption efficiency.The high adsorption efficiency is enhanced not only by electrostatic forces but also by specific intermolecular interactions between CIP and GO. Interactions such as π-π donor-acceptor interactions, hydrogen bonding, and other electrostatic attractions collectively enhance the strong affinity of GO for CIP molecules [43,44].
The determination of optimal conditions for CIP adsorption was conducted to ensure that each process variable- pH, adsorbent mass, and contact time- effectively contributed to maximizing the adsorption percentage. Optimization was performed using Design Expert version 13.0, employing a desirability function-based method to determine the optimal operating conditions. The optimal parameter settings that meet the specified criteria are summarized in Table 5. The model proposed optimal circumstances that yielded 100 potential solutions, of which solution number 2 was chosen. The model calculated a CIP adsorption effectiveness of 90.592% at pH 3, with an adsorbent mass of 22.5 mg and a projected contact duration of 35 min. This solution attained a desirability score of 1, signifying complete concordance between the optimization criteria and the anticipated response. The desirability scale, ranging from 0 to 1, indicates the extent of conformity between expected outcomes and optimization aims, with values near 1 signifying superior alignment [45]. However, the objective of optimization is not solely to achieve a desirability value of 1 but to determine the most appropriate operating circumstances that effectively meet all anticipated performance criteria.
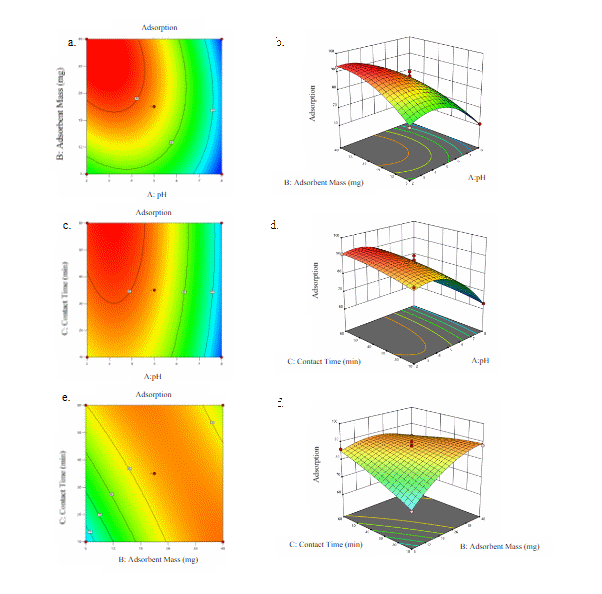
Figure 6 Contour (2D) and response surface (3D) plots illustrating the interactions between key experimental factors affecting adsorption. Panels (a) and (b) show the interaction between GO mass and pH, (c) and (d) depict the effect of contact time and pH, and (e) and (f) illustrate the combined influence of contact time and GO mass.
Table 5 Optimum operating conditions suggested by the model.
pH |
Adsorbent Mass |
Contact Time |
Adsorption |
Desirability |
3 |
22.5 mg |
35 min |
90% |
1 |
The optimization results were validated to evaluate the correctness of the projected optimal conditions derived from the RSM analysis. Experimental validation was conducted in the laboratory by quantifying the percentage of CIP adsorption utilizing GO across 5 different trials. To ensure the empirical model’s accuracy and reliability, the validation results must fall within the 95% Prediction Interval (PI) range, as recommended by Yudiastuti et al. [45]. Table 6 presents a comparison between the expected values and the outcomes of experimental validation.
Table 6 Validation results of CIP adsorption (%).
Response |
Prediction |
95% PI low |
Mean Data |
95% PI high |
% error |
Adsorption |
90.592% |
87.464% |
90.129% |
93.72% |
0.005% |
The validation results indicated an average adsorption response of 90.129%, closely aligning with the predicted value of 90.592% from Design Expert 13.0. The validated value is within the 95% prediction interval range, confirming the successful optimization of the CIP adsorption process. The prediction interval indicates the range of response values anticipated if the experiment is conducted again under the same conditions [46,47]. The percentage error between the model prediction and the experimental results was calculated to assess the model’s accuracy. Table 6 indicates that the percentage error was 0.005%. Values below 5% suggest that the model’s predictions demonstrate a high level of accuracy and consistency with the experimental data under optimized conditions. The analytical method demonstrated excellent linearity, with R² values ranging from 0.9980 to 0.9999, indicating a strong correlation between the measured response and analyte concentration. The limit of detection (LOD) was determined to be 0.0874 mg/L, while the limit of quantification (LOQ) was 0.2914 mg/L, reflecting the method’s sensitivity. Precision was assessed by evaluating the percentage relative standard deviation (%RSD), which ranged from 0.71 to 2.89%, confirming the method’s reliability and reproducibility.
The economic and environmental sustainability of a DSPE method is significantly enhanced by the reusability of the sorbent. Graphene oxide (GO) derived from lignocellulosic waste like empty fruit bunch (EFB) possesses a robust carbon skeleton and high chemical stability. Literature on similar GO-based composites in DSPE has demonstrated that these materials can be successfully reused for up to 15 cycles while maintaining analytical recoveries greater than 80% [48,49]. This high degree of reusability, combined with the low-cost nature of the EFB precursor, confirms that the proposed EFB-GO is a highly practical and sustainable alternative to commercial single-use sorbents.
Conclusions
This study successfully synthesized GO from EFB, as confirmed by FTIR analysis, which indicated the presence of hydroxyl (–OH), carbonyl (C=O), carboxyl (–COOH), and epoxy (C–O–C) functional groups. SEM-EDX also disclosed a morphology defined by thin, undulating sheet-like structures. XRD examination revealed the existence of the characteristic GO diffraction peak at 2θ = 9.34°, but UV-Vis spectrophotometry revealed a definite absorption peak at a wavelength of 200 nm. The optimization of the GO-based DSPE method for CIP residue determination, utilizing the BBD design, revealed optimal parameters of pH 3, an adsorbent mass of 22.5 mg, and a contact period of 35 min, yielding a predicted adsorption value of 90.592%. The experimental validation demonstrated an average adsorption of 90.129%, accompanied by a minimal percentage error of 0.005%, so affirming the predictive model’s exceptional accuracy and robust concordance with the experimental data. The method showed excellent linearity (R² = 0.9989 - 0.9999), with an LOD of 0.0874 mg/L and LOQ of 0.2914 mg/L. Precision was satisfactory, with %RSD ranging from 0.71% to 2.89%. By bridging the gap between green waste management and advanced chemical analysis, this study provides a robust, low-cost, and environmentally responsible framework for the trace detection of pharmaceutical residues in complex matrices.
Acknowledgements
The author gratefully acknowledges the support of the Directorate of Research, Technology, and Community Services, Ministry of Education, Culture, Research, and Technology of the Republic of Indonesia, for funding this research through the Regular Fundamental Research Grant under contract numbers 076/C3/DT.05.00/PL/2025 and 512/UN26.21/PN/2025. Appreciation is also extended to all individuals and institutions who contributed, either directly or indirectly, to the successful completion of this study.
Declaration of generative AI in scientific writing
The authors declare that generative AI tools (such as ChatGPT by OpenAI) were used solely for linguistic editing and grammatical refinement. No AI tools were involved in the generation of scientific content, analysis, or interpretation of data. The authors are fully responsible for the integrity, accuracy, and conclusions of the manuscript.
CRediT author statement
Rinawati: Conceptualization; Supervision; Methodology; Writing - Review & Editing; Funding acquisition. Agung Abadi Kiswandono: Investigation; Formal analysis; Data curation; Writing - Original Draft; Visualization. Rima Soraya Permata Sari: Methodology; Validation; Formal analysis; Writing - Original Draft. Herkan Eriska Putra: Investigation; Methodology; Validation; Data curation. Dian Septiani Pratama: Software; Resources; Project administration. Fahamsyah Hamdan Latief: Writing - Review & Editing; Visualization. Widiarti: Optimization; Visualization.
References
[1] G Feng, H Huang and Y Chen. Effects of emerging pollutants on the occurrence and transfer of antibiotic resistance genes: A review. Journal of Hazardous Materials 2021; 420, 126602.
[2] RY Krishnan, S Manikandan, R Subbaiya, M Biruntha, M Govarthanan and N Karmegam. Removal of emerging micropollutants originating from pharmaceuticals and personal care products (PPCPs) in water and wastewater by advanced oxidation processes: A review. Environmental Technology & Innovation 2021; 23, 101757.
[3] NZ Arman, S Salmiati, A Aris, MR Salim, TH Nazifa, MS Muhamad and M Marpongahtun. A review on emerging pollutants in the water environment: Existences, health effects and treatment processes. Water 2021; 13(22), 3258.
[4] M Rigoletto, P Calza, E Gaggero and E Laurenti. Hybrid materials for the removal of emerging pollutants in water: Classification, synthesis, and properties. Chemical Engineering Journal Advances 2022; 10, 100252.
[5] GG Hacıosmanoğlu, C Mejías, J Martín, JL Santos, I Aparicio and E Alonso. Antibiotic adsorption by natural and modified clay minerals as designer adsorbents for wastewater treatment: A comprehensive review. Journal of Environmental Management 2022; 317, 115397.
[6] J Dutta and AA Mala. Removal of antibiotic from the water environment by the adsorption technologies: A review. Water Science & Technology 2020; 82, 401-426.
[7] SF Aden, LA Mahmoud, EH Ivanovska, LR Terry, VP Ting, MG Katsikogianni and S Nayak. Controlled delivery of ciprofloxacin using zirconium-based MOFs and poly-caprolactone composites. Journal of Drug Delivery Science and Technology 2023; 88, 104894.
[8] K Velusamy, S Periyasamy, PS Kumar, T Jayaraj, R Krishnasamy, J Sindhu, D Sneka, B Subhashini and DVN Vo. Analysis on the removal of emerging contaminant from aqueous solution using biochar derived from soap nut seeds. Environmental Pollution 2021; 287, 117632.
[9] E Yakamercan, A Aygün and H Simsek. Antibiotic ciprofloxacin removal from aqueous solutions by electrochemically activated persulfate process: Optimization, degradation pathways, and toxicology assessment. Journal of Environmental Sciences 2024; 143, 85-98.
[10] N Nakhonchai, N Prompila, K Ponhong, W Siriangkhawut, J Vichapong and S Supharoek. Green hairy basil seed mucilage biosorbent for dispersive solid phase extraction enrichment of tetracyclines in bovine milk samples followed by HPLC analysis. Talanta 2024; 271, 125645.
[11] J Chen, G Mei, X Zhang, D Huang, P He and D Xu. Dispersive solid-phase extraction and ultra-performance liquid chromatography-tandem mass spectrometry - a rapid and accurate method for detecting 10 macrolide residues in aquatic products. Foods 2024; 13(6), 866.
[12] A Niroumandpassand, A Javadi, MR A Mogaddam and I Fathollahi. Dispersive solid phase extraction of fluoroquinolone antibiotic residues in raw cow milk samples using bimetallic organic frameworks and investigating the effect of UV irradiation on antibiotics decontamination. Microchemical Journal 2024; 206, 111564.
[13] A Jiříčková, O Jankovský, Z Sofer and D Sedmidubský. Synthesis and applications of graphene oxide. Materials 2022; 15(3), 920.
[14] R Soni, AK Pal, P Tripathi, JA Lal, K Kesari and V Tripathi. An overview of nanoscale materials on the removal of wastewater contaminants. Applied Water Science 2020; 10(8), 189.
[15] KZ Donato, HL Tan, VS Marangoni, MV Martins, PR Ng, MC Costa, P Jain, SJ Lee, GK Koon, RK Donato and AH Castro Neto. Graphene oxide classification and standardization. Scientific Reports 2023; 13(1), 6064.
[16] Badan Pusat Statistik. Produksi tanaman perkebunan Provinsi Lampung, BPS, Lampung, Indonesia, 2022.
[17] EH Sujiono, D Zabrian, MY Dahlan, BD Amin and J Agus. Graphene oxide based coconut shell waste: Synthesis by modified Hummers method and characterization. Heliyon 2020; 6(8), e04568.
[18] R Rinawati, B Buhani, W Widiarti, A Isro, E Fitrianingsih, A Rahmawati, AA Kiswandono and F Nitti. Enhancing ciprofloxacin removal: Unveiling the potential of graphene oxide synthesized from cassava peels through Box-Behnken design optimization. Journal of Sustainable Development of Energy, Water and Environment Systems 2024; 12(4), 1-20.
[19] Y Sun, Y Yang, M Yang, F Yu and J Ma. Response surface methodological evaluation and optimization for adsorption removal of ciprofloxacin onto graphene hydrogel. Journal of Molecular Liquids 2019; 284, 124-130.
[20] P Hongsawat, S Bungokule, N Boonchouy, P Prarat and P Punyapalakul. Response surface methodology approach for optimization of norfloxacin by the graphene oxide under the presence of tannic acid and its adsorption mechanism. Desalination and Water Treatment 2021; 217, 272-285.
[21] HM Kifayatullah, H Tahir and AR Shah. Modeling and optimization of ultrasound-assisted adsorption of crystal violet dye by graphene oxide nanoparticles using response surface methodology. International Journal of Environmental Analytical Chemistry 2022; 102(16), 4678-4694.
[22] A Ibrahim, MS Vohra, SA Bahadi, SA Onaizi, MH Essa and T Mohammed. Heavy metals adsorption onto graphene oxide: Effect of mixed systems and response surface methodology modeling. Desalination and Water Treatment 2022; 266, 78-90.
[23] O Akhavan, K Bijanzad and A Mirsepah. Synthesis of graphene from natural and industrial carbonaceous wastes. RSC Advances 2014; 4(39), 20441-20448.
[24] S Nasir, MZ Hussein, NA Yusof and Z Zainal. Oil palm waste-based precursors as a renewable and economical carbon sources for the preparation of reduced graphene oxide from graphene oxide. Nanomaterials 2017; 7(7), 182.
[25] DC Marcano, DV Kosynkin, JM Berlin, A Sinitskii, Z Sun, A Slesarev, LB Alemany, W Lu and JM Tour. Improved synthesis of graphene oxide. ACS Nano 2010; 4(8), 4806-4814.
[26] F Li, DL Zhao, LZ Bai and DD Zhang. Fabrication of nano hollow graphene oxide spheres via water-in-oil emulsion. Applied Mechanics and Materials 2013; 320, 540-543.
[27] A Alkhouzaam, H Qiblawey, M Khraisheh, M Atieh and M Al-Ghouti. Synthesis of graphene oxides particle of high oxidation degree using a modified Hummers method. Ceramics International 2020; 46(15), 23997-24007.
[28] L Zhu, T Shi and Y Chen. Preparation and characteristics of graphene oxide from the biomass carbon material using fir powder as precursor. Fullerenes, Nanotubes and Carbon Nanostructures 2015; 23(11), 961-967.
[29] NFBM Ithnin and WW Liu. Exfoliation of graphite into graphene oxide and reduction by plant extract to synthesize graphene. International Journal of Nanoelectronics and Materials 2024; 17(2), 284-287.
[30] NA Karim, CMR Ghazali, MM Ramli, DRY Marniati, Tb, MD Payana and MFM Zulfadhly. Graphitization of empty fruit bunch (EFB) waste at lower heating temperature. AIP Conference Proceedings 2023; 2484(1), 040006.
[31] CD Liyanage, H Kumar, I Perera, PG Abeykoon, F Chen, JS Joya, SL Suib and DH Adamson. Synthesis of graphene oxide: Effect of sonication during oxidation. Carbon 2024; 223, 119047.
[32] PN Khanam, A Popelka, M Alejji and MA AlMaadeed. Biotechnological production process and life cycle assessment of graphene. Journal of Nanomaterials 2017; 2017(1), 5671584.
[33] MS Akhtar, DSR Jutt, S Aslam, R Nawaz, MA Irshad, M Khan, M Khairy, A Irfan, SA Al-Hussain and MEA Zaki. Green synthesis of graphene oxide and magnetite nanoparticles and their arsenic removal efficiency from arsenic contaminated soil. Scientific Reports 2024; 14(1), 23094.
[34] AH Handayani, F Amalia, EV Noviantana, TR Mulyaningsih, A Waris and A Dimyati. Atmospheric plasma-assisted preparation of graphene oxide from biomass: Characterization and elemental analysis. Atom Indonesia 2025; 51(2), 89-96.
[35] KO Olumurewa, B Olofinjana, O Fasakin, MA Eleruja and EOB Ajayi. Characterization of high yield graphene oxide synthesized by simplified hummers method. Graphene 2017; 6(4), 85-98.
[36] AKM Chiang, LY Ng, CY Ng, YP Lim, E Mahmoudi, LS Tan and SK Mah. Conversion of palm oil empty fruit bunches to highly stable and fluorescent graphene oxide quantum dots: An eco-friendly approach. Materials Chemistry and Physics 2023; 309, 128433.
[37] F Fauzi, F Azizi, MM Musawwa and WSB Dwandaru. Synthesis and characterisations of reduced graphene oxide prepared by microwave irradiation with sonication. Journal of Physical Science 2021; 32(2), 1-13.
[38] U Baruah and D Chowdhury. Functionalized graphene oxide as an electrochemical sensing platform for detection of bisphenol A. Advanced Materials Letters 2018; 9(7), 516-525.
[39] YT Zewide, TA Yemata, AA Ayalew, et al. Application of response surface methodology (RSM) for experimental optimization in biogenic silica extraction from rice husk and straw ash. Scientific Reports 2025; 15(1), 132.
[40] SAS Amin and N Sobhi. Process optimization in poultry feed mill. Scientific Reports 2023; 13(1), 9897.
[41] R Rostamian and H Behnejad. A comprehensive adsorption study and modeling of antibiotics as a pharmaceutical waste by graphene oxide nanosheets. Ecotoxicology and Environmental Safety 2018; 147, 117-123.
[42] F Gamon, M Tomaszewski, G Cema and A Ziembinska-Buczynska. Adsorption of oxytetracycline and ciprofloxacin on carbon-based nanomaterials as affected by pH. Archives of Environmental Protection 2022; 48(2), 34-41.
[43] S Yasmin, MG Azam, MS Hossain, US Akhtar and MH Kabir. Efficient removal of ciprofloxacin from aqueous solution using Zn-C battery derived graphene oxide enhanced by hydrogen bonding, electrostatic and π-π interaction. Heliyon 2024; 10(12), e33317.
[44] R Zainul, EU Rahmad, RO Ramadhani, MS Ahmad and AP Lubis. Optimizing hydrogen gas concentration using response surface methodology (RSM) with design expert 6.0.9 application. IOP Conference Series: Earth and Environmental Science 2023; 1281(1), 012025.
[45] SON Yudiastuti, W Handayani, EKN Sari, R Wijaya, A Brilliantina and AHH Slamet. The utilization of Trichoderma viride in optimising xylanase production from coffee cherry processing waste. International Journal of Islamic Education, Research and Multiculturalism 2024; 6(1), 102-122.
[46] JR Spence and DJ Stanley. Tempered expectations: A tutorial for calculating and interpreting prediction intervals in the context of replications. Advances in Methods and Practices in Psychological Science 2024; 7(1), 25152459231217932.
[47] N Zaini, NSM Hanapi, WNW Ibrahim, R Osman, S Kamaruzaman, N Yahaya and AL Anis. Dispersive micro-solid-phase extraction (D-µ-SPE) with polypyrrole-graphene oxide (PPy-GO) nanocomposite sorbent for the determination of tetracycline antibiotics in water samples. Malaysian Journal of Analytical Sciences 2022; 26(5), 953-964.
[48] E Öztürk. Graphene oxide as a highly efficient and reusable adsorbent for simultaneous removal of parabens: Optimization by response surface methodology, adsorption isotherms and reusability studies. Adsorption 2025; 31(1), 24.
[49] F Fauzi, F Azizi, MM Musawwa and WSB Dwandaru. Synthesis and characterisations of reduced graphene oxide prepared by microwave irradiation with sonication. Journal of Physical Science 2021; 32(2), 1-13.